hotel employee perceptions towards first line managers ...lib.dtc.ac.th/thesis/0347.pdf · thesis...
TRANSCRIPT

i
Hotel Employee Perceptions towards First Line Managers� Leadership Competencies in
Phuket
Uraipan Socharoen
A Thesis Submitted in Partial Fulfillment of the Requirements for the Degree of
Master of Business Administration in Hospitality and Tourism Management
(International Program)
Prince of Songkla University
2009
Copyright of Prince of Songkla University

ii
Thesis Title Hotel Employee Perceptions towards First Line Managers� Leadership Competencies in Phuket
Author Miss Uraipan Socharoen Major Program Hospitality and Tourism Management (International Program)
Major Advisor Examining Committee:
###################.. ############. Chairperson (Dr. Naree Weerakit) (Assoc. Prof. Dr. Ranee Esichaikul) #############Committee
Co-advisor (Dr. Jutamas Wisansing) ###################.. ############# Committee (Dr. Ilian Assenov) (Dr. Naree Weerakit) ############# Committee (Dr. Ilian Assenov)
The Graduate School, Prince of Songkla University, has approved this thesis as partial fulfillment of the requirements for the Master of Business Administration Degree in Hospitality and Tourism Management (International Program)
#################. (Assoc. Prof. Dr. Krerkchai Thongnoo) Dean of Graduate School

iii
23456789:;7<;=> 234546789:;<38;9=7>?:@ABC:D2B3:E4BF48GHAI844J:6;<3875K:LMN:O3P:QDB><D=RM72?G
?@ABCD9; :3BI3<AST4C44U IHA7Q49V E:C:672: 234QD=234234W49234FX6234YHAB7YZ[\< (>XD2IMG4:3:3]3G9) FGH:IJKHL: 2552
M8NOP9Q5
234<9QD\;4D`B:Z` 8Z<DGJS546IB;a7Cb[Acd2e3I844J:6;<3875K:LMN:O3YZ[QO375K:IO3>4DW;<38IO374?Q@ABLMNQD=234E4BF48P:RM72?GQ32234546789:;<38;9=7>?:@ABC:D2B3:E4BF48 2XSH8546]324@ABB3:<9QD\:Z`;bA C:D2B3:E4BF48 234cd2e3P]N@NA8MXQ3223472?WFWWIAWJ38C:D2B3:E4BF48QO3:<: 545 ;: E=\234ISH8GD<A\H3BFWWI6=<2 FWWIAWJ38JM24H3B@d`:75K:R3e3ADB2geFX6T=NJM2F5X75K:R3e3TY\7Cb[AYZ[Q67C9[8ADG43234GAWFWWIAWJ38FX6YO3P>N:3PQJdB;<38>83\@ABFWWIAWJ38:D`:7C436<H3C:D2B3:E4BF48IH<:P>VH75K:;:TY\ FWWIAWJ385462AW=N<\IZ[IH<:;bA (1) XD2eU6=N3:546]324c3IG4a@ABC:D2B3:E4BF48 (2) @NA8MX72Z[\<2DWAB;a24 (3) I844J:6;<3875K:LMN:O3 (4) <9jZ234QD=234 234P>N;SU;H3FX6j4487:Z\85k9WDG9@ABE4BF48
LX234cd2e3YO3P>NY43W<H3 XD2eU6@ABC:D2B3:E4BF48E=\4<88ZXD2eU6;bAC:D2B3:E4BF48IH<:P>VH75K:LMN>V9B 8ZA3\S46><H3B 25-34 5m 75K:LMNYZ[8Z234cd2e346=DW549VV3G4Z>4bAIMB2<H3 E=\IH<:P>VHQ6YO3B3:P:E4BF48@:3=2X3BFX6E4BF48@:3=P>VH E4BF4846=DW>N3=3< E4BF48P:7;4bA@AB;:TY\ E4BF485467RY4ZIA4aY Q32234546789:;<38;9=7>?:@ABC:D2B3:E4BF48 234cd2e3;4D`B:Z`CW<H3 n234F2N5oV>3FX6234CDp:3G:7ABq ;bA5oQQD\YZ[IO3;DVYZ[IS=Q32234546789:@ABC:D2B3:E4BF48 4ABXB83;bA n2344MNId224654Z`246754H3 n234T=NCW7>?:I9[BGH3Br 7YH3YZ[Q6832T=Nq n;<384MNId25XA=RD\P:234YHAB7YZ[\<q FX6 n2348Z546IW234UaF5X2P>8HFX6T=NP]N]Z<9GYZ[FG2GH3BQ327=98q nYD2e6Y3B=N3:234ID[BIA:q n234<3BFL:FX6234546\S2GaP]Nq nYD2e6Y3B=N3:234YO3B3:75K:YZ8q nYD2e6Y3B=N3:234Ib[AI34q nYD2e6Y3B=N3:2348AWAO3:3Qq nYD2e6Y3B=N3:234P>N;O3F:6:O3q nYD2e6Y3B=N3:234=D=F5XBG38IJ3:234Uaq :A2Q32:Z`8Z;<38FG2GH3BA\H3BIO3;DV46><H3B5oQQD\Y3B=N3:I844J:6;<3875K:LMN:O32DW7Cc A3\S 234cd2e3 546IW234Ua234YO3B3:P:ASGI3>2448E4BF48 546IW234Ua234YO3B3:P:E4BF48F>HB:Z` FX6GO3F>:HB LX234cd2e3\DBFI=BP>N7>?:<H38Z;<38FG2GH3BA\H3BIO3;DV46><H3B5oQQD\

iv
Y3B=N3:I844J:6;<3875K:LMN:O32DW@:3=@ABE4BF48 46=DW@ABE4BF48 QO3:<:C:D2B3:P:E4BF48 5467RY@AB234W49>34P:E4BF48 FX65467RYE4BF48
>XDBQ325oQQD\Y3B=N3:I844J:6;<3875K:LMN:O3T=NWHB]Z`JdB;<38QO375K:GHA;<38 IO374?Q@ABLMNQD=234E4BF48P:QDB><D=RM72?GQ32234546789:;<38;9=7>?:@ABC:D2B3:E4BF48 FX6:A2Q32:Z ̀ LX@AB234cd2e3I3834J]H<\YO3P>NLMNQD=234I3834JCDp:3234YO3B3:@ABC<27@3=N<\ LX@AB234cd2e3\DBFI=B:D\JdB234CDp:3234QD=234 234AW48 FX6234CDp:3Y3BA3]ZC FX6\DBI3834J75K:F:<Y3BIO3>4DW2344DWI8D;4LMNQD=234E4BF48YZ[JM2GNAB :A2Q32:D`: \DBI3834J\246=DW2344D2e3;SUR3C@ABLMNQD=234LMNsd[BI:DWI:S:234QD=234@ABtu3\W49>347Cb[AW44XSJdB75v3>83\@ABAB;a24 @NA2O3>:=A\H3BGHA7:b[AB;<4Q6T=N4DW234\A84DWP>N75K:83G4w3:P:2345k9WDG9P:ASGI3>2448E4BF48 NR:ER:NOS ;<38I3834J ;<3875K:LMN:O3 >D<>:N3B3: E4BF48 RM72?G 5467YcTY\

v
Thesis Title Hotel Employee Perceptions towards First Line Managers� Leadership Competencies in Phuket
Author Miss Uraipan Socharoen Major Program Hospitality and Tourism Management (International Program) Academic Year 2009
ABSTRACT
This thesis aims to identify the key competencies needed for Phuket hotel managers to be successful from the employee�s perceptive. The target population of this study was hotel employees. Data was collected from 545 hotel employees and convenience sampling was applied. The questionnaire was created in English and translated into Thai in order to maximize the response rate and to ensure the questionnaire was understood as the majority of the respondents were Thai. It consisted of four sections: (1) Hotel employee demographics, (2) Organizational Information, (3) Leadership Competencies, and (4) Organizational Behavior.
Concerning the demographic characteristics of the respondents; the majority were female, middle-aged, and well-educated. The majority of the respondents worked for medium and large size hotels, five-star hotels, Thai chain affiliated hotels, and resort hotels. Based on the hotel employee perceptions, this study found that nProblem solving and self-developmentq was rated the most important factor by the hotel employees. This was followed by nCoaching skillq, nPlanning and Implementationq, nTeam building skillq, nCommunication skillq, nEmpowermentq, nCounseling skillq, and nAdaptive skillq. Also, leadership competencies were perceived significantly differently upon demographic characteristics such as gender, the respondents� age, educational background, working experience in the hotel industry, working experience in this hotel and position of the respondents whereas significant difference in leadership competency factors depended on the hotel characteristics such as hotel sizes, hotel rating, number of employees, hotel management demographics, and type of hotel.
Once the leadership competency factors were identified; the necessity for success as the Phuket first line managers from the hotel employees� view point. In addition, the result will assist first line managers to improve their job performance. The results of this study

vi
also have implications for management development, training, and career development. They can also serve as a guideline for recruiting the right hotel managers. Moreover, they can enhance the maintenance of quality managers who support the executive management in materializing company objectives. The provision of continuous should be accepted as standard managerial practice in the hotel industry.
Key words: competency, leadership, first line manager, hotel, Phuket, Thailand

vii
ACKNOWLEDGEMENTS
The thesis nHotel Employee Perceptions towards First Line Managers� Leadership Competencies in Phuketq was completed with the help, special kindness and contribution from many people. Without their love and support, I could not have completed my Master�s degree. They deserve my thanks and acknowledgement. First of all, I would like to express my sincere appreciation to my advisor, Dr. Naree Weerakit who gave me excellent guidance, encouragement, and understanding throughout my studies and examined this thesis regarding all aspects of it from the beginning to the end. I am deeply grateful to my co-advisor, Dr. Ilian Assenov. I would like to sincerely thank for their valuable suggestions and continuous supports in having this thesis move forward towards completion. Moreover, I would like to thank all the professors: Associate Professor Manat Chaisawat, Dr. Aree Tirasatayapitak, Dr. Kullada Phetvaroon, Associate Professor Dr. Ranee Esichaikul and Dr. Jutamas Wisansing, who provided me with the academic knowledge, vision, and valuable necessary experience.
I would like to thank the Human Resource�s officers for allowing me to conduct my research in their respective hotels and I would also express my special thank for all respondents who spent their valuable time to share their opinions and give more the useful information for my research. As well as, Ms. Watcharee Chamnina, I am appreciative of her helpful support during my study time.
Sincere appreciation is also expressed to my friends: Ms. Wipada Thaothampitak and Ms. Pimmas Promrat who greatly assisted in providing the feedback necessary to bring this study together and gave me invaluable assistance and kind attention. Thanks for all my IMBA friends and many others whose names are not listed here.
Thanks too to Arj. Guy Ridgeon for his time and patience in proofreading the final draft of my thesis. Last but not least, special thanks to my family who gave me the chance to study in this program and thanks for all the support, encouragement and steadfastness that helped me keep on track with this project. Without their tremendous support this thesis would not have been successfully achieved.

viii
CONTENTS
Page
Contents viii List of Tables x List of Figures xv List of Abbreviations and Symbols xvi Chapter 1. Introduction 1 1.1 Statement of the Problem 6 1.2 Related Literature 8
1.2.1 Competencies 9 1.2.2 Leadership 16 1.2.3 Differences between Leadership and Management 20 1.2.4 Leadership Competency 22 1.2.5 Leadership Competency in Hospitality Industry 25
1.3 Aim and Objectives 31 1.4 Hypotheses and Conceptual Model 31 1.5 Significance of the Study 32 1.6 Scope of the Study 32 1.7 Definition of Key Terms 32 2. Methodology 34
2.1 Population, Sample Size and Selection 34 2.2 Type of Research 35 2.3 Research Instruments 36
2.4 Data Collection 37 2.4.1 Primary Data 37 2.4.2 Secondary Data 38
2.5 Data Analysis-Statistics used to Analyze the Data 38

ix
3. Results 40 3.1 Demographic Profile of Respondents 41
3.2 The Characteristic Profile of the Respondents� Hotels 42
CONTENTS (CONTINUED)
Page
3.3 Organizational Behavior 44 3.4 Independent Sample t-test on Impact of Respondents� Demographic
Characteristics and the Organizational Behavior 46
3.5 Independent Sample t-test on Impact of Hotel Characteristics and the Organizational Behavior
51
3.6 Factor Analysis 54 3.7 Descriptive Statistics of the Leadership Competency Factors 61 3.8 Independent Sample t-test on Impact of Respondents� Demographic
Characteristics and the Competency Factors 61
3.9 Independent Sample t-test on Impact of Hotel Characteristics and the Competency Factors
65
3.10 One-Way ANOVA on Impact of Hotel Characteristics and the Competency Factors
68
3.11 One-Way ANOVA on Impact of Respondents� Demographic Characteristics and the Competency Factors
87
4. Summary 94 4.1 Conclusions 94 4.2 Discussions 97 4.3 Recommendations 99 4.4 Limitations and Suggestions for Further Study 102 References 103 Appendices 110 Appendix A: A Cover Letter 111
x
Appendix B: Questionnaire (Thai Version) 112 Appendix C: Questionnaire (English Version) 118
Appendix D: List of 314 Hotels in Phuket 124 Appendix E: List of Participated Hotels in Phuket 135
Vitae 138
LIST OF TABLES
Table Page 1.1 Numbers of International Tourists in Thailand (2003-2007) 3 1.2 Numbers of Domestic Tourists in Thailand (2003-2007) 3 1.3 Guest Arrivals at Accommodation Establishments in Phuket 2006 4 1.4 Selection Definitions of Competencies 9 1.5 Top 10 Competency Categories for Leadership and Management 10 1.6 Rank Order of Competencies by Hotel Senior Managers of Different
Functional Departments 13
1.7 Selection Definitions of Leadership 17 1.8 Summary of the Basic Leadership Styles and Their Components 18 1.9 Hotel Management Style Over the Decades 27 1.10 Management Competencies Characterized Essential a 29 3.1 Respondents� Demographic Characteristics Profile 41 3.2 Hotel Characteristic Profile 43 3.3 Descriptive Statistics of the Organizational Behavior 45 3.4 The Independent Sample t-test on Impact of Gender on the Organizational
Behavior 46
3.5 The Independent Sample t-test on Impact of Education on the Organizational Behavior
47
3.6 The Independent Sample t-test on Impact of Position on the Organizational Behavior
49

xi
3.7 The Independent Sample t-test on Impact of Number of Employee in Unit on the Organizational Behavior
51
3.8 The Independent Sample t-test on Impact of Type of Hotel on the Organizational Behavior
53
3.9 KMO and Bartlett�s Test 55 3.10 The Result of the Factor Analysis 55 3.11 Descriptive Statistics of the Leadership Competency Factors 61 3.12 The Independent Sample t-test on Impact of Gender on the Competency
Factors 62
LIST OF TABLES (CONTINUED)
Table Page 3.13 The Independent Sample t-test on Impact of Education on the Competency
Factors 63
3.14 The Independent Sample t-test on Impact of Position on the Competency Factors
64
3.15 The Independent Sample t-test on Impact of Number of Employee in Unit on the Competency Factors
66
3.16 The Independent Sample t-test on Impact of Type of Hotel on the Competency Factors
67
3.17 The One-Way ANOVA on Impact of the Hotel Size on the Leadership Competency Factors
68
3.18 Multiple Comparisons (LSD) on Impact of the Hotel Size on the nEmpowermentq Factor
69
3.19 Multiple Comparisons (LSD) on Impact of the Hotel Size on the nPlanning and Implementationq Factor
69
3.20 Multiple Comparisons (LSD) on Impact of the Hotel Size on the nTeam Building Skillq Factor
70
3.21 Multiple Comparisons (LSD) on Impact of the Hotel Size on the 70

xii
nCommunication Skillq Factor 3.22 Multiple Comparisons (LSD) on Impact of the Hotel Size on the nProblem
solving and Self-developmentq Factor 71
3.23 Multiple Comparisons (LSD) on Impact of the Hotel Size on the nCoaching Skillq Factor
71
3.24 Multiple Comparisons (LSD) on Impact of the Hotel Size on the nCounseling skillq Factor
72
3.25 The One-Way ANOVA on Impact of the Number of Employees on the Leadership Competency Factors
72
3.26 Multiple Comparisons on Impact of the Number of Employees on the nEmpowermentq Factor
73
3.27 Multiple Comparisons on Impact of the Number of Employees on the nPlanning and Implementationq Factor
74
LIST OF TABLES (CONTINUED)
Table Page 3.28 Multiple Comparisons on Impact of the Number of Employees on the nTeam
Building Skillq Factor 74
3.29 Multiple Comparisons on Impact of the Number of Employees on the nCommunication Skillq Factor
75
3.30 Multiple Comparisons on Impact of the Number of Employees on the nProblem solving and Self-developmentq Factor
75
3.31 Multiple Comparisons on Impact of the Number of Employees on the nCoaching Skillq Factor
76
3.32 Multiple Comparisons on Impact of the Number of Employees on the nCounseling Skillq Factor
76
3.33 Multiple Comparisons on Impact of the Number of Employees on the nAdaptive Skillq Factor
77
3.34 The One-Way ANOVA on Impact of the Hotel Rating on the Leadership Competency Factors
77

xiii
3.35 Multiple Comparisons on Impact of the Hotel Rating on the nEmpowermentq Factor
78
3.36 Multiple Comparisons on Impact of the Hotel Rating on the nPlanning and Implementationq Factor
79
3.37 Multiple Comparisons on Impact of the Hotel Rating on the nTeam Building Skillq Factor
79
3.38 Multiple Comparisons on Impact of the Hotel Rating on the nCommunication Skillq Factor
80
3.39 Multiple Comparisons on Impact of the Hotel Rating on the nProblem solving and Self-developmentq Factor
80
3.40 Multiple Comparisons on Impact of the Hotel Rating on the nCoaching Skillq Factor
81
3.41 Multiple Comparisons on Impact of the Hotel Rating on the nCounseling Skillq Factor
81
3.42 Multiple Comparisons on Impact of the Hotel Rating on the nAdaptive Skillq Factor
82
LIST OF TABLES (CONTINUED)
Table Page 3.43 The One-Way ANOVA on Impact of the Hotel Management Demographics on
the Leadership Competency Factors 82
3.44 Multiple Comparisons on Impact of the Hotel Management Demographics on the nEmpowermentq Factor
83
3.45 Multiple Comparisons on Impact of the Hotel Management Demographics on the nPlanning and Implementationq Factor
83
3.46 Multiple Comparisons on Impact of the Hotel Management Demographics on the nTeam Building Skillq Factor
84
3.47 Multiple Comparisons on Impact of the Hotel Management Demographics on the nCommunication Skillq Factor
84
3.48 Multiple Comparisons on Impact of the Hotel Management Demographics on 85

xiv
the nProblem solving and Self-developmentq Factor 3.49 Multiple Comparisons on Impact of the Hotel Management Demographics on
the nCoaching Skillq Factor 85
3.50 Multiple Comparisons on Impact of the Hotel Management Demographics on the nCounseling Skillq Factor
86
3.51 Multiple Comparisons on Impact of the Hotel Management Demographics on the nAdaptive Skillq Factor
86
3.52 The One-Way ANOVA on Impact of the Working Experience in This Hotel on the Leadership Competency Factors
87
3.53 Multiple Comparisons on Impact of the Working Experience in This Hotel on the nEmpowermentq Factor
88
3.54 Multiple Comparisons on Impact of the Working Experience in This Hotel on the nPlanning and Implementationq Factor
88
3.55 Multiple Comparisons on Impact of the Working Experience in This Hotel on the nTeam Building Skillq Factor
89
3.56 Multiple Comparisons on Impact of the Working Experience in This Hotel on the nCommunication Skillq Factor
89
3.57 Multiple Comparisons on Impact of the Working Experience in This Hotel on the nCoaching Skillq Factor
90
LIST OF TABLES (CONTINUED)
Table Page 3.58 The One-Way ANOVA on Impact of the Experience in the Hotel Industry on
the Leadership Competency Factors 90
3.59 Multiple Comparisons on Impact of the Experience in the Hotel Industry on the nEmpowermentq Factor
91
3.60 The One-Way ANOVA on Impact of the Respondents� Age on the Leadership Competency Factors
91

xv
LIST OF FIGURES
Figure Page 1.1 Number of Tourist Arrivals in Phuket Year 1998-2007 2 1.2 The Development of a Competency Model for Hotel Middle Managers 14 1.3 Management versus Leadership 21

xvi
LIST OF ABBREVIATIONS AND SYMBOLS
UNWTO United Nations World Trade Organization TAT Tourism Authority of Thailand THA Thai Hotels Association SD Standard Deviation LSD Least Square Difference SPSS Statistical Package for the Social Sciences

1
CHAPTER 1 INTRODUCTION
Tourism Industry
The United Nations World Tourism Organization (UNWTO) reported that there were 846 million international tourist arrivals in 2006. The average growth of international tourist arrivals was a 6.5% growth year on year from 1950 to 2006. (Higher than in 2005, when the growth of world tourism experienced a 5.5% expansion) Moreover, UNWTO's Tourism 2020 Vision forecasts that international arrivals are expected to reach nearly 1.6 billion by the year 2020. The region which was expected to grow at a higher rate was the Asia Pacific (+10%) owing to the fact that tourists paid more attention to finding new attractions in this region, especially in Cambodia, Vietnam, India and China, where there was high growth in the number of visitors. Other regions in the lower ranks were Africa (+7%), the Americas (+6%), Europe (+4%), and the Middle East (+3%), respectively. However, in Thailand, the tsunami disaster of 2004, and disturbance in the 3 southern provinces, as well as the increased market competition from new destinations (Vietnam, China, India) and tourism product creation (Japan, Hong Kong, and Korea) were key factors in Thailand’s steady tourism growth in 2006, with 11.52 million inbound visitors, a 1.15 % decrease from the previous year. But, this slowdown is not that significant violent because of the attempts of the public and private sectors to stimulate markets and recover the attractions affected by the disaster as fast as possible. These resulted in a slight impact of the above-mentioned factors on the Thai tourism industry (TAT, 2006). Tourism situations in Phuket

2
In 2006, tourism in Phuket recovered and grew very rapidly compared
with the same previous period situation before the Tsunami disaster and expanded continuously all year. As Phuket acquired the most market share in the Southern part of Thailand (55.02%) and acquired the third range of average growth rate (21.45%). This is resulting from the main tourism destinations such as Patong beach, Karon beach, Kata beach having recovered and been developed in the right ways and the good relationship both within government and the private sector to promote tourism in Phuket. The key driver of this growth has created a good image of Phuket, promoting attractions, and presenting the securities which are the key factors that tourists consider after the incident in Phuket until now. Moreover, the economic recovery in 2006 and in terms of crisis management, public relations plans and events were created to stimulate the market, including publication of articles in various media, special offers of lower-priced package, and provision of charter flights directly to Phuket. The number of tourists who traveled to Phuket in 2007 was about 5 millions, an increase of 11.25 percent from 2006. The average growth rate from 2003 to 2007 increased by about 5.44 percent whereas the average growth rate from 1998-2007 increased only 7.28 percent as shown in figure 1.1. The number of tourists who traveled to Phuket in 2007 can be divided into two groups: 83 million Thai and 14 million foreign tourists. The overwhelming majority of today’s tourists are vacationers. In addition, most tourists traveled with their partners or their friends (TAT, 2007).

3
Figure 1.1 Number of Tourist Arrivals in Phuket Year 1998-2007
Source: Tourism Authority of Thailand, 2007
For the situation of period of stay for tourists in 2007, the overall average length of stay was 4.71 days. The average expenditure was about 4,210.25 baht/person/day increase of 6.32% from 2006. In terms of revenue, internal tourism increased 21.45% to 94,239.52 million baht. The accommodation establishments increased to 37,543 rooms in the number of accommodations. Moreover, the room occupancy rate was 65.82% (a 5.13% increase from 2006). This is resulted from the growth of the economic situation in Phuket. Therefore, there was new construction of accommodations that were affected by the tsunami disaster at the end of 2004. And travelers tend to have longer length of stay equivalent to 3.70 days (TAT, 2007). There
2,000,000
2,500,000
3,000,000
3,500,000
4,000,000
4,500,000
5,000,000
5,500,000
6,000,000
1998 1999 2000 2001 2002 2003 2004 2005 2006 2007
Year
Num
ber
Year Number (%)
1998 2,660,420 +10.781999 3,083,208 +15.892000 3,459,573 +12.212001 3,789,660 +9.542002 3,990,702 +5.312003 4,020,077 +1.492004 4,793,252 +18.352005 2,510,276 -47.632006 4,499,324 +79.242007 5,005,653 +11.25
Average growth rate 1998-2007 +7.28%

4
are two tables that show about the numbers of international tourists and domestic tourists from year 2003-2007 as follows: Table 1.1 Numbers of International Tourists in Thailand (2003-2007)
International Tourists Average Average Expenditure Revenue
Year Number (million)
Change (%)
Length of Stay (Days)
/person/day (Baht)
Change (%)
Million (Baht)
Change (%)
2003 10.00 - 7.36 8.19 3,774.50 + 0.55 309,269 - 4.39 2004 11.65 + 16.46 8.13 4,057.85 + 7.51 384,360 + 24.28 2005 11.52 - 1.51 8.20 3,890.13 - 4.13 367,380 - 4.42 2006 13.82 + 20.01 8.62 4,048.22 + 4.06 482,319 + 31.29 2007 14.46 + 4.65 9.19 4,120.95 + 1.80 547,782 + 13.57 Source: Tourism Authority of Thailand, 2007 Table 1.2 Numbers of Domestic Tourists in Thailand (2003-2007) Year Tourists Average Average Expenditure Revenue
Trip (million)
Change (%)
Length of Stay (Days)
/person/day (Baht)
Change (%)
Million (Baht)
Change (%)
2003 69.36 + 12.20 2.61 1,824.38 + 7.98 289,986.81 + 23.22 2004 74.80 + 7.84 2.60 1,852.33 + 1.53 317,224.62 + 9.39 2005 79.53 + 6.33 2.73 1,768.87 - 4.51 334,716.79 + 5.51 2006 81.49 + 2.46 2.65 1,795.09 + 1.48 322,533.71 + 8.41 2007 83.23 + 2.14 2.63 1,767.35 - 1.55 380,417.10 + 4.15
5
Source: Tourism Authority of Thailand, 2007
From table 1.1 and table 1.2, the number of International and domestic tourists had increased gradually from year 2003-2007. They had longer lengths of stay. The average expenditure for international tourists increased slightly and there was slightly slowdown for domestic tourists. Revenue from tourism has also continually increased. This was the good result to Thailand’s tourism and it also stimulates Thailand’s economy.
The Tourism Authority of Thailand’s latest figures for guest arrivals at accommodation establishments in Phuket for the July to December 2006 indicates good increases in the number of tourists. According to the report sent to Andaman News in Phuket 2007, Thais of course were the most numerous at 486,931, up from 384,955 in 2005 after the tsunami. Among foreign nationalities, Australians were top at 188,396. Very close behind were British at 111,165. Third were the Koreans about 107,431. Fourth were Swedes at 83,454. Fifth were the German at 74,619. They were followed by, Japanese, Chinese, Singaporeans, Hong Kong, Americans and Malaysian all above 41,000 people and all showing increases from last year. The total of all nationalities was 1.91 million up from 787,000 or a healthy increase of 139% for clarity of information (as shown in the table 1.3).

6
Table 1.3 Guest Arrivals at Accommodation Establishments in Phuket 2006 Nationality Jan.-Jun. Jul.-Dec. Total
Thai 578,359 486,931 1,065,290 Australia 75,387 188,396 263,783 U.K. 98,845 111,165 210,010 Korea 131,662 107,431 239,093 Sweden 131,544 83,454 214,998 Germany 97,503 74,619 172,122 Japan 45,465 69,417 114,882 China 91,289 64,359 155,648 Singapore 46,030 52,884 98,914 Hong Kong 31,644 50,702 82,346 U.S.A. 45,162 48,561 93,723 Malaysia 50,334 40,713 91,047 Other Asia 59,735 72,010 131,745 Others Europe 141,311 120,710 262,021
Table 1.3 (Continued) Nationality Jan.-Jun. Jul.-Dec. Total
Others South Asia 2,598 7,703 10,301 Others Americas 4,312 13,651 17,963 Others 250,810 319,671 570,481
Total 1,881,990 1,912,377 3,794,367 Source: Tourism Authority of Thailand, 2007

7
Thailand’s Hotel Industry
Thailand’s hotel operators collectively held their breath at the end of September 2006, waiting to see whether the change of government that month was going to cut into their businesses on the eve of the busiest time of the year. After the coup, some hoteliers reported losses of millions of baht as tourists cancelled bookings and guests already in the country cut short their stays. However, most hotels reported that November 2006, traditionally the busiest month of the year, was back to business as usual.
Overall in Thailand since 2007, it has been a good year of growth, although it had its ups and downs. It was good to see Phuket coming back, although there was a slowdown in the middle of 2007. Thai hotels have time and again proved their resilience. There are too many rooms for the industry to sustain. Although, during the past 5 years, Thai hotel industry has suffered many threats both from internal and external factors such as domestic political problems, tsunami disaster, disturbance in the 3 southern provinces, increased market competition in new destinations (Vietnam, China, India), increased tourism product creation (Japan, Hong Kong, and Korea), SARS, Bird Flu, the US lead war in and Iraq. The sector had already shown strong recovery from the dark days after the tsunami and that continued through 2007. The aftermath of the tsunami is still being felt, with a big transfer of business from coastal resorts to Bangkok and other inland destinations creating a somewhat more balanced distribution of hotel room availability which should help the country's overall tourism development in the long run. However, the outlook for 2007 is strong. Areas like Khao Lak and Krabi still suffering from lower occupancies and rate pressure but there are positive signs in the high season that these destinations were improved continually in 2007. In Krabi, more than 1,000 up market rooms are due to open in the next two years

8
by companies including Central Hotels and Resorts and Hilton Hotels International. Ko Samui continues to be a booming destination with growing demand and an increase in the supply of upscale hotel products. Bangkok showed good growth but leisure and meetings hotels suffered somewhat post-coup, particularly from key destinations in Asia, such as Japan and key MICE feeder markets. In Bangkok the bulk of new hotel supply will be online by the end of 2007/beginning of 2008 where over 3,500 rooms will be added to the market (Bangkok Post, 2006).
1.1 Phuket Tourism Situation
Phuket is a world famous tourist destination, renowned for its beautiful beaches as well as plentiful high quality resort and hotel accommodation. Moreover, today the hospitality industry in Thailand, especially in Phuket, has grown significantly with the expanding economy of the country, which can be seen from the number of international tourists during the past 5 years, and the increased use of hospitality facilities by the domestic tourists. Due to this reason, the hotel industry in Phuket has grown rapidly in recent years. The number of tourists who traveled to Phuket in 2007 was about 5 million, an increase of 11.25 percent from 2006. The average growth rate from 2003 to 2007 increased by about 5.44 percent whereas the average growth rate from 1998-2007 increased by only 7.28 percent. The number of tourists who traveled to Phuket in 2007 can be divided into two groups: 83 million Thai and 14 million foreign tourists. The overwhelming majority of today’s tourists are vacationers. In addition, most tourists traveled with in a pair or with their friends (TAT, 2007). Most of the Thai tourists came from Bangkok, followed by southern provinces, whereas the main groups of foreigners were Europeans and Asians. Of these 79% were first time visitors and visiting for the purpose is for leisure,

9
followed by visit relationship and meeting/seminar respectively. And at a rate of 118.2% of foreigners are increased. Most tourists come from European and Asia. The main foreign target markets were: Australia, Korea, Sweden, United Kingdom, Russia and Germany respectively. The people from these countries preferred to stay at beach and Island locations such as Maiton Island, the group of Racha Island and Patong beach and so on. Of these 55% were the repeat tourists (TAT, 2007). For the situation of period of stay for tourists, the overall average length of stay is 4.71 days. The average expenditure was about 4,210.25 baht/person/day an increase of 6.32% from 2006. In terms of revenue, the overall revenue in Phuket tourism increased 21.45% to 94,239.52 million baht. Accommodation establishments increased to 37,543 rooms in year 2007 from 26,637 rooms. Moreover, the average occupancy rate was 67.97 percent with an average room rate of 3,295.66 baht (US$94) in year 2008, compared to 67.67 percent and 3,212.05 baht in 2007 (THA, 2007). This results from the growth of economic situation in Phuket. Therefore, there were the new construction of accommodation where were affected by the tsunami disaster at the end of 2004 (TAT, 2007). Despite the fact that the Thai hotel industry has suffered many threats both from internal and external factors. Room supply in Phuket was on the upturn as Phuket still had good fundamentals with its international reputation and direct regional air access. Phuket had an inventory of nearly 40,000 rooms in registered tourism establishments, ranging from guesthouses to branded hotels, with about 10,000 rooms or 25 percent of the total room supply being of international standards. In general, the number of hotels in Phuket has significantly increased during 2007. 30 new hotels are at various stages of development, with about 4,918 rooms due to hit the supply between 2008 and 2011. Brands such as Accor, Sheraton, Hilton, Marriott, Crowne Plaza and Le Meridien are all expanding strongly in Phuket. However, one of most important threats for hotel industry in Phuket is great competition. The hotel industry has to face up to both present and future competition resulting from globalization, technological, and market

10
changes. In the face of a high competitive environment, it has long been considered important for a hotel to formulate a marketing competition strategy, strengthen corporate operations and upgrade quality of service (Hwang and Chang, 2003). This bring into further threats such as high labor turnover rate, high demand for competent managers, low demand and over supply. To achieve survive under these situations; hotels need to adjust their structures, strategies, work systems, and management in order to remain competitive. Furthermore, increasing customer demand for care in quality of service is highlighting the critical role played by managerial competences in promoting quality performance from contact employees, thereby leading to customer satisfaction (Bitner, 1990; Martinez-Tur, 2001; Shemwell, 1998). Moreover, a manager is a key person who plays an important role to enhance and develop hotels to meet the required standard. Many studies have been conducted to identify leadership competency need for the hotel managers from the manager perceptions. However, there are few studies trying to identify the leadership competencies from hotel employee perspective. It is also interesting to investigate the leadership competency for the employee perspective. Therefore, to fulfill the needs of the industry, it is appropriate to explore the employee perceptions regarding the leadership competencies for the Phuket hotels managers. Then the object of this study is to identify the key leadership competencies for the Phuket hotel managers from the employee’s perspective.

11
1.2 Related Literature
This research aimed to identify the key leadership competencies needed for hotel managers to be successful. The related theories and related researches were applied as follows:
1.2.1 Competencies 1.2.2 Leadership 1.2.3 Similarities and Differences between Leadership Competencies
and Management 1.2.4 Leadership Competency 1.2.5 Leadership Competency in Hospitality Industry

12
1.2.1 Competencies
Since the first concerted efforts to conceptualize the competence of an
organization began to emerge in the early 1990s; as can be seen in table 1.4, many characterizations of competence proposed by researchers have consistently referred to some key constituent elements of competence, such as skills, capabilities, knowledge, learning, coordination, organization and relationships. Table 1.4 Selection Definitions of Competencies
Author/Year Definition Trivett (1975)
the minimum combination of achievement-based behavioral objectives, mastery learning, and life experiences that results in student learning necessary to succeed in one’s profession
Klemp (1980) the ability, being capable, possessing certain skills and the knowledge to do what one is supposed to do
Woodruffe (1991) a person can only be competent in an area of work (area of competence) if he or she possesses the dimension that underlies that competent performance (personal competence)
Caroline (1992) individual achievement of required skills and knowledge Management Charter Initiative (1992)
the ability of a person to perform in the workplace to the standards required in employment
Sanchez (1996) the ability to sustain the coordinated development of assets in ways that help a firm achieve its goals
Vhidddett and the ability based on work tasks or job outputs

13
Hollyforde (2000) Calhoun, Davidson, Sinioris, Vincent and Griffith (2002)
a cluster comprised of knowledge, skills, attitudes, abilities, behaviors and other characteristics
There are many studies concerned with competency in other areas such
as; Corning (2002) who found that the enormous array of competencies were identified in verifies assertions that leaders and managers are expected to be all things to all people. Counte and Newman (2002) noted that ensuring a good fit between curricula and actual competencies needed for administrative practice has been difficult. Buergermeister (1983) and Mariampolski (1980) found that technical and human skills are far more important than conceptual skills for the manager at the start of their managerial career. These authors suggested that restaurant management curricula should help students develop technical and human skills. Jennings, Scalzi, Keane and Rodgers III (2007) identified the top 10 leadership and management categories based upon the frequency counts of the competencies they represented. Most of competencies were accounted for in these 10 categories. As shown in table 1.5, the frequency with which the competencies were mentioned and their rank order varied between leadership and management.

14
Table 1.5 Top 10 Competency Categories for Leadership and Management
Category (n) a
Rank
Leadership Management
1. Personal qualities(147) Interpersonal skills (55) 2. Interpersonal skills (100) Personal qualities(54) 3. Thinking skills (55) Thinking skills (29) 4. Setting the vision (36)* Management skills (e.g., Planning,
organizing) (28) 5. Communicating (33) Communicating (24) 6. Initiating change (32) Business skills (e.g., finance, marketing) (23) 7. Developing people (25)* Health care knowledge (clinical, technical, as
a business) (22) 8. Health care knowledge
(clinical, technical, as a business) (22)
Human resources management (17)**
9. Management skills (e.g., Planning, organizing) (21)
Initiating change (9)
10. Business skills (e.g., finance, marketing) (17)
Information management (9)**
a Number of times this competency was identified in the literature reviewed. * Unique to the top 10 Leadership Competencies. ** Unique to the top 10 Management Competencies. Source: Jennings, Scalzi, Keane and Rodgers III, 2007

15
Westra and Delaney (2007) identified three major concepts for nursing informatics. Nursing informatics competencies have been identified for future evaluation with nursing leaders. The three major concepts are computer skills, informatics knowledge, and informatics competency. Within these broad concepts are more specific categories and items. For instance, computer skills include such categories as use of basic software applications, electronic communication, and patient related computer applications. Informatics knowledge includes categories such as management concepts associated with informatics, knowledge of data issues, and knowledge of information system concepts. And the last are example categories of informatics skills include defining of system requirements and selection of information systems, financial skills applied to information systems, and implementation and management skills for information systems.
Competencies were most often portrayed in a positive way, with little attention given to the shadow side of attributes. For instance, a passion for one’s work may have a negative effect if it overpowers others’ views. Similarity, collaboration was addressed more often than conflict, illustrating the tendency to ignore the tough work of both leadership and management. Heifetz and Linsky (2002) suggested that although conflict is potentially dangerous, it is necessary for change to occur. They underscored the importance of learning how to deal with people’s differences by letting conflicts surface.
The way in which conquering adversity shapes leaders also received limited attention. Effective leadership and management often develop from intense, even traumatic experiences that allow individuals to learn from failure and mistakes (Fitzpatrick, 2004; Bennis, Thomos, 2002, and Ehrat, 2001). In addition, some traits were paradoxical-personal humility and professional will; timidity and ferocity; shyness and fearlessness. These paradoxical combinations were found among individuals at the pinnacle of leadership (Collins, 2001).

16
On the other hand, Siu (1998) presented the overall rank order of importance of the eleven competencies for hotel middle managers, as perceived by their senior managers. The eleven managerial competency clusters include:
1. Communication: Get his or her ideas across, and gets the job done as identified.
2. Customer concern: Identifies customer needs and ensures that customers receive the service required.
3. Leadership: Influences others to follow, even when asking for greater than normal efforts.
4. Planning: Sets priorities and schedules his or her own work and the work of others efficiently.
5. Team building: Involves others and builds teams in which others feel valued and which have goals.
6. Team membership: Works well in a team, shares information and seeks the ideas of others.
7. Results orientation: Continuously sets himself or herself, and those who work for him or her, targets for better performance, and shows concern for getting things done.
8. Efficiency: Always seeks faster ways of doing things with fewer resources.
9. Personal drive: Tries to improve him or herself, and actively seeks new challenges.
10. Decision making: A makes decisions based on his or her level of responsibility, and does not refer these to higher levels of management when not appropriate.
11. Commercial concern: Looks for profitable business opportunities for the hotel, and seeks ways to improve the financial position of the organization.

17
The rank order indicated that communication was perceived as the extremely important among eleven competencies in the hotel industry, followed closely by concern for customers, leadership competency, planning, team building, team membership, results orientation, efficiency, personal drive, decision making and commercial concern respectively. These top three competencies coincided with Baum (1991) who referred to these as “soft competencies”, since these attributes are related more to human relations than to hard managerial skills. This study also presented an individual listing by department with regards to the mean ranking of the eleven competencies is listed in table 1.6. The possible impact that cultural differences have on respondents’ perception of managerial competency and thus the development of appropriate management development programs were also revealed.
Table 1.6 Rank Order of Competencies by Hotel Senior Managers of Different Functional Departments
Competency Department
Food &
Beverage
Front Office
& Housekeepi
ng
Accounting
Human
Resource
Sales &
Marketing & Public Relations
Engineering
Leadership 3 3 3 2 7 8 Communication
4 2 1 1 1 3
Team building
7 4 5 3 2 5
Team 2 6 8 7 4 6

18
membership Results orientation
6 8 7 6 6 10
Personal drive
8 10 10 9 9 9
Planning 5 5 4 4 3 1 Efficiency 11 7 6 8 5 2 Commercial concern
9 11 11 11 11 11
Decision making
10 9 9 10 10 7
Customer concern
1 1 2 5 8 4
Source: Siu, 1998

19
Spencer and Spencer (1993) recommended the development of a competency model to the hotel practitioners for enhancing management development programs (figure1.2): Figure 1.2 The Development of a Competency Model for Hotel Middle Managers Process #1: Identify the criteria for effective performance of a hotel middle
manager’s job Process #2: Selecting a group of superior and average performers as the criterion
sample group Process #3: Analyze information collected to develop a competency model Process #4: Validating the competency model Process #5: Applications of the competency model
Source: Spencer and Spencer, 1993
Organizations get things done when people do their job effectively. To evaluate whether or not employees can handle their job well, we need to use certain techniques to assess their performance. Assessment of competencies enhances the ability of organizations to evaluate actual performance in the work role and thus provides evidence of their capabilities.
There also have been many other studies during the 1980s and different viewpoints about required and important competencies for hotel employees. Katz (1955) pointed out that managers should possess technical, human, and conceptual skills. Technical skill has the greatest importance at the supervisory level of management. Human skill is essential to every level of management while at the top level; conceptual skill becomes the most important. Furthermore, Sandwich (1993) also identified that managers acquired conceptual-creative, leadership, interpersonal, administrative, and technical skills that could applied to work situations to achieve

20
effective results. The conceptual-creative skill includes too broad a band of the organization’s related domain and can now be seen to consist of creativity, adaptation, and planning skills. Similarly, the interpersonal skill can be seen to consist of communication and coordination and social skills. Also, Hogan (1989) conducted a survey with 77 hotel and restaurant companies in the U.S.A. and found that hotel operators were particularly interested in three employment areas for entry-level managers. These areas include marketing and sales, food and beverage, and housekeeping management. The results of Hogan’s survey also showed that the hotel operators were interested in people skills such as human relations and service. Especially, William & Hunter (1991) reported that supervisory personnel needed professional development training in many human resource skills namely coaching, training, negotiating, disciplining, and handling difficult people as skills that they needed to improve. Knutson and Patton (1992) also found that students believed that they were not proficient in human relations skills such as managing employees or interacting with guests. Moreover, Sandwith (1993) expanded the Katz’s three-prong model and developed the competency-domain model. The five elements are conceptual-creative (the cognitive), leadership (the ability to turn ideas into productive action), interpersonal (skills for effective interaction with others), administrative (personnel and financial management of the business), and technical (the knowledge and skills essential to producing the product or service). On the other hand, Lewis (1993) put a greater emphasis on conceptual skills. Although several authors tend to think of leadership as a human skill, it is considered a conceptual skill in that leadership, in its broadest sense, refers to a person’s ability to create a vision for the future. O’Halloarn (1992), Umbreit (1992), Williams and Hunter (1991), and others have identified leadership as an element of managerial success.
Human relation skill is another important core competency which is advocated by many authors. According to Doyle (1992), interpersonal competency and

21
teamwork ranked most highly along with effective communication when recruiters make selection decisions. Supervisory personnel reported that they needed professional development training in many human resource skills (William & Hunter, 1991). The respondents of that study cited coaching, training, negotiating, disciplining, and handling difficult people as skills that they needed to improve. Knutson and Patton (1992) also found that students believed that they were not proficient in human relations skills such as managing employees or interacting with guests. Additionally, O’Halloran (1992) investigated the competency need for manages from the tourism managers’ point of view and found that employee relations were one of the most important skills. Bach and Milman (1996) surveyed faculty, students, and industry professionals regarding curriculum issues and also predicted greater emphasis on employee relations. Moreover, Okeiyi, Finley and Postel (1994) conducted a study to determine the importance of food and beverage competencies expected of hospitality management graduates as perceived by hospitality practitioners, educators, and students. In this study, human-relations and managerial skills were once again rated most important for students graduating from hospitality-management programs. The importance of general management knowledge and skills was identified in the study conducted by Ashley (1995) and Breiter and Clements (1995). They stated that people skills, leadership, service orientation, oral communication, listening skills, teamwork, employee relations, problem identification and problem solving, adapting to change, creative thinking ability, employee training and development, written communication, quality management, individual and system wide computer skills, and financial skills are important competencies that should be cultivated by hospitality management curricula for 21st century. Although quite a few authors have promoted the inclusion of technical skill training in the hospitality curricula, e.g., integration of computers and writing skills into hotel and restaurant courses, general management knowledge has gained more focus rather than specific technical skills recently (Mihalik, 1992 and

22
Pederson, 1993). For example, Ashley (1995) suggested the top 10 competency categories such as (1) people skills, (2) creative-thinking ability, (3) financial skill, (4) communication skills (for both written and oral presentations), (5) developing a service orientation, (6) total quality management,(7) problem-identification and problem-solving skills, (8) listening skills, (9) individual and (10) system-wide computer skills.
1.2.2 Leadership Because of the complexities of leadership, the different types of
leadership, and individual perceptions of leaders, leadership has several definitions. Many definitions share commonalities, but there are also differences (Walker, 2004). Complicating the research on management is the issue of leadership and its relationship to management. Often the terms are interchanged or, alternatively, leadership is seen to influence management and vice-versa. Leadership is an ambiguous word, which is intuitively simple and yet inordinately difficult to define with any degree of precision (Pittaway, 1998).
The significance of leadership is well known in organizational literature. In fact, the definition of “leadership” itself is widely varied among organizational psychologists (Hughes, Ginnett and Curphy, 1996), though the most widely varied agreed elements of the general construct is that it involves a process of influence that an individual asserts over followers to attain specified goals (Yuki and Van, 1992). As can be seen in table 1.7, many studies viewed leadership in different ways as follows:

23
Table 1.7 Selection Definitions of Leadership
Author/Year Definition Bartol (1995)
the process of influencing others towards organizational goal achievement
Kouzes and Posner (1995)
based on relationships and helping people (and organizations) move toward achieving a vision
Hofmann and Morgeson (1999)
the ability to foster good relationships with staff and the workforce
Miner and Beyerlein (1999)
a system of guiding influences that may be embodied in people at different levels of the organization or in the cultures and support systems of the organization
Williams and Winston (2003)
statements of the areas of knowledge and the abilities that is necessary for successful leaders
Walker (2004) leadership is the process by which a person with vision is able to influence the activities and outcomes of others in a desired way
The related paradigms of transactional and transformational leadership
have become among the most widely studied theories of leadership performance. Transactional leadership is the type of leadership a leader exercises when exchanging something of value to elicit a specified behavior from followers (Bass and Riggio, 2006). Transactional leadership is further subdivided into three areas: contingent-reward (CR), where rewards are provided given certain criteria are met; management by exception-active (MBEA) that aim to intervene with follower behavior before a course of action becomes problematic; and management by exception-passive (MBEP)

24
that does not interfere with follower behavior until a problem arises. Transformational leadership, in contrast, attempts to influence the beliefs and attitudes of followers to align with that of the leader, and then direct followers through these common beliefs toward the attainment of greater organizational success (Bass and Riggio, 2006). Four types of transformational leadership have been identified: (1) inspirational motivation (IM) aims to influence followers through charismatic communication of a set of goals that becomes viewed as universally valuable to achieve; (2) individualized consideration (IC) occurs when the leader serves to help the follower attain desired intrinsic needs; (3) idealized influence is commonly subdivided into two types: idealized influence attributed (IIA) in which leader charisma is used to foster strong positive emotional bonds with followers, and idealized behavior of the leader becomes manifested in collective values and actions throughout the organization; (4) intellectual stimulation (IS) pushes followers to think creatively and pursue new and creative ideas. Table 1.8 provides a basic summary of the aforementioned leadership styles and basic components of which they are comprised.
Table 1.8 Summary of the Basic Leadership Styles and Their Components
Leadership styles
Characteristics Descriptions
Transactional leadership
Contingent reward (CR) Management by exception-active (MBEA)
Exchange-based leadership based on providing rewards and punishments based on follower behavior/performance Actively monitors situations and makes corrective interventions before situations become problematic (prospective)

25
Transformational leadership
Idealized influence Attributed (IIA) Idealized influence (behavior) Inspirational motivation (IM)
Provides vision and sense of mission, gains the respect and trust of followers, and subordinates become encouraged to emulate the behavior and values of the leader Sets example for follower behavior through own actions, subordinates look at behavior of the leader for guidance of their own behavior Utilizes referent power, communicates charismatically, clearly and unambiguously to followers
Table 1.8 (Continued)
Leadership styles
Characteristics Descriptions
Intellectual stimulation (IS) Individualized consideration (IC)
Encourages creativity, thoughtfulness, rational action, and active problem solving among subordinates Provides individual attention, mentoring, empowerment, and bonding with followers

26
Passive-avoidant leadership
Management by exception-passive (MBEP) Laissez-faire (LF)
Take corrective action only after a problem becomes significant and obvious (retrospective). In some cases, can be considered a transformational leader quality when the leader purposely aims to let followers learn from making mistakes Decision avoidance, passes important decision making responsibility to subordinates, reluctance to express views on important or controversial issues
Source: Bass and Riggio, 2006
Bass (1985) argued that the transformational leadership style is complementary to the transactional style and likely to be ineffective in the total absence of a transactional relationship between leaders and subordinates. Avolio (1999, 2005) identified that in the leadership development program emanating from transformational leadership theory; emphasis is placed on developing interpersonal skills such as effective listening and building trusting relationships. London (2002) stated that a great many comprehensive leadership management development programs in large corporations include interpersonal skill development as an important component, regardless of whether or not the program is inspired by a unifying leadership theory. Bass and Riggio (2006) defined transformational leadership as a form of leadership that has been shown to lead to higher performing and more satisfied work groups.

27
According to Bass (1990) the topic of emotional intelligence and its
purported importance in managerial and leadership success was based on a long history of research that demonstrated that leaders with highly developed interpersonal skills were more effective that leaders lacking these important “people skills”. Goleman (1998); and Boyatzis, Goleman, and Rhee (2000) identified the mixed model of emotional intelligence. This model is one that is directly centered on the emotional intelligence of workplace leaders. There is (1) Self-awareness (2) Relationship Management (3) Social Awareness (4) Self-Management. Langhorn (2004) and Wong & Law (2002) also suggested that leaders possessing high levels of emotional intelligence have a positive impact on their followers in terms of increased levels of employee satisfaction and engaging in positive organizational citizenship behaviors. Rosete & Ciarrochi (2005) revealed that emotional intelligence has been found to be positively related to leader performance and commitment to the group and organization (Carmeli, 2003). Thompson (1998); Sawacha, (1999); Flin, (2000) suggested that communication is also frequently identified as the most or second most necessary element after leadership of a safe culture.
1.2.3 Differences between Leadership and Management
In order to understand the role of a physician leader, it is important to
define leadership. Upon initial review, one might believe that there is little, if any, difference between leadership and management. Further examination demonstrates that managers produce predictability and order through planning, organization, control, and problem solving; in contrast, leaders stimulate change through the motivation and alignment of people with an established direction (figure 1.3).

28
Figure 1.3 Management versus Leadership
Source: Burnett, 1999
Schwartz (2000, p.187) referring to Warren Bennis who was a well-
known authority on leadership, describes the distinction even further: “Leaders are people who do the right things. Managers are people who do things right. There’s a profound difference. When you think about doing the right things, your mind immediately goes toward thinking about the future, thinking about dreams, missions, visions, strategic intent, and purpose. But when you think about doing things right, you think of control mechanisms. You think about how-to. Leaders ask the what and why questions, not the how question”.
The roles of leaders and managers are both essential to the success of any organization. The leader enables the organization to grow and stretch outside its
Strong Management Planning Budgeting Organizing Staffing
Strong Leadership Establishing Direction Aligning People
Produces Predictability Produces
Managem Leadershi
29
comfortable boundaries. The theme of “leadership” is an amalgamation of a number of behaviors identified by the respondents as being important for creating a safety sites. Leadership is often associated with “visible” persons within the organization. In larger construction organizations leaders are found at various levels. On construction sites specifically Supervisors/Foremen are the most conspicuous leaders and are perceived by the workforce as visible ‘face’ of the company. It is leaders with authority and ability who are able to influence the desired behaviors necessary for a safe environment by reinforcement of the organization’s safety values. At the same time as, managers keep the organization realistically focused and growing toward the leader’s vision. The two created an environment in which creative tensions thrive. Just as there was a distinction between the leadership and management of organizations, there was a distinction between formal and informal leaders. Formal leaders were those who had been trained and hold a position of authority within a traditional organizational structure, whereas informal leaders, often staff members, accept leadership roles for a variety of reasons.
Miner and Beyerlein (1999) noted that, “leadership represents a system of guiding influences that may be embodied in people at different levels of the organization or in the cultures and support systems of the organization. Central to this leadership theme is the ability to foster good relationships with staff and the workforce. Leadership theories such as leader-member exchange hold that good leader-follower relationships encourage the followers to behave in a manner which is aligned with the leader’s goals and values (Hofmann and Morgeson, 1999). Therefore, if the manager has a good relationship with his/her staff and he/she behaves in a manner that promotes work safety, their subordinates will be inclined to behave safely as a means of reciprocation reinforcing the notion that those in a critical role must lead by their own example. Hence, managers should seek to develop a leadership style that

30
promotes collaboration and relationship building, while still maintaining authority and discipline.
1.2.4 Leadership Competency
Managing an organization involves adaptive responses both to the job tasks and the changing environment. To cope with these demands, the traditional management framework, mainly based on knowledge and skills, is insufficient. For this reason, the wider concept of managerial competences has been recently introduced (Kanungo and Misra, 1992; Lawer, 1994), which identifies two interrelated sets of managerial competencies: technical and generic (Boyatzis, 1982; De Ansorena, 1996; Levy-Leboyer, 1997). Technical managerial competence consists of having the knowledge and skills that enable the manager to give an effective performance in specific areas of management such as management such as marketing (e.g. “marketing and market analysis”), financial and accounting (“economic-financial management”), quality management (“service quality management”), customer care quality of service (“customer profiles and behaviors”). Generic managerial competence refers mainly to manager’s capability of self-regulation and self-control in fob development (Kanungo and Misra, 1992). It also covers other individual characteristics (e.g. attitudes, motivation, or personality traits) that involve coping with less programmed and technical tasks and more generic situations. The literature has offered different and often overlapping taxonomies of generic managerial competences. In a previous review (Agut, 2000), they were classified into three areas: (1) Job performance efficacy: ability to apply knowledge and skills to perform tasks successfully (Kanungo and Misra, 1992), (2) self-control and social relationship: ability to adapt to and to deal with different people and situations, and (3) proactive behavior: ability to anticipate rather than react to work problems and opportunities. All these sets of competencies

31
are required for effective managerial performance nowadays. Thus, our study extends the analysis of managerial work to focus on those two types of managerial competences: technical and generic, and also when a managerial competency needs analysis is carried out. A need derives from a gap between the required and the current results (Kaufman, 1998). Thus, a competency needs analysis seeks to identify the situation in which the manager’s level of competency is lower than level of that required for the job.
Leadership and management competencies were identified from a literature review of 140 articles published between 2000-2004. Similarities and differences among the competencies were accessed. A large intersection of common competencies was discovered, indicating a lack of discrimination between leadership and management competencies. Williams and Winston (2003) indicated that leadership competencies represent statement of the areas of knowledge and the abilities that are necessary for successful leaders. Private-sector research has focused on the issue of leadership competencies for some time, with the idea of identifying those qualities and abilities possessed by successful leaders. In addition, statements of leadership competencies are used as the basis for strengthening an organization’s leadership team and determining the types of educational and leadership development opportunities that are needed for future leaders (Barner, 2000; Ulrich, Zenger, and Smallwood, 2000). Statements of leadership competencies have addressed issues such as “adaptability, effective interpersonal communication, and good decision making” (Barner, 2000). Leadership competencies are considered important for several reasons, including the fact that “they guide direction. They are measurable. And competencies can be learned” (Intagliata, Ulrich, and Smallwood, 2000). Leadership focuses on enhancing organizational success and related to the issue of influencing the attitudes and behaviors of others (Neely and Winston, 1999).

32
Each competency mentioned in each article was identified as well as whether the competency was addressed in relation to leadership or management. Leadership competencies have reflected the current interest in leadership. The large intersection indicates a lack of discrimination between leadership and management competencies. Despite this similarity, the tone of the literature suggested that leadership competencies were more highly valued. Scoble and Russell (2003) noted that although leadership, management, and administration are used interchangeably, they are not synonymous. This review is consistent with the classic work of Benis and Nanus (1985) who indicated that leadership and management are both important but profoundly different. According to Kouzes and Posner (1995), leadership is based on relationships and helping people (and organizations) move toward achieving a vision. By contract, management focuses on maintaining order, planning, organizing, coordinating resources, and attending to rules and details. However, Brodbeck (2000) argue that someone is perceived as a leader when there is congruence between the leadership perception and a leadership prototype. Their leadership prototypically scales include tests for leaders as visionary, decisive, administrative and team collaboration. Moreover, Bigg (2005) suggested that an evidence based approach to improving an organization’s safety culture is to provide management and leadership skills and training to key staff so that they are equipped to model the appropriate safety behaviors and make the “right” decisions regarding safety. Additionally, Westra and Delaney (2007) stated that nursing informatics competencies have been identified for future evaluation with nursing leaders. The three major concepts are computer skills, informatics knowledge, and informatics competency. Within these broad concepts are more specific categories and items.

33
1.2.5 Leadership Competency in Hospitality Industry
The hospitality industry will have to face up to both present and future
competition resulting from globalization, technological, and market changes in order to remain competitive. To achieve this, organizations make changes to their structures, strategies, work systems, and management. Furthermore, increasing customer demand for care in quality of service is highlighting the critical role played employees, thereby leading to customer satisfaction (Bitner 1990; Martinez Tur 2001; and Shemwell 1998). Many hospitality organizations are increasingly viewing leadership development as a source of competitive advantage. Since the industry tends to be labor intensive and has increasingly harsh environmental demands imposed upon it, leadership skills may help organizations to utilize the available human resources more effectively and may help to increase performance. Worsfold (1898) found that managers in the hospitality industry had an awareness of participative styles of leadership but were more inclined to use autocratic approaches. Buergermeister (1983) stated that “Today’s beginning hospitality manager needs a diversity of talents, skills and competencies to meet the experiences of the industry”. Tracey (1994) suggested that major changes in the environment of hospitality business required leaders who were able to examine holistically their organization, use vision to recognize what changes were required and manager those changes to fit with the organization’s environment. With increased attention being paid to successful change management in the last decade, organizations, generally, are accepting transformation leadership behavior as an important component of leading such change. Hsu and Gregory (1995) identified the competencies needs for an entry level hospitality manager from the industry professional viewpoint and found that human-relations skills such as

34
communication and leadership skills was perceived the majority important and should receive extra recognition in the future.
Required competencies in the hotel industry are quite different from those in educational institutions. When the question of what competencies employees need to be effective has been asked among various management groups, the answer seems to have changed over time. In the late 1970s and early 1980s, researchers’ answer to the above seemed to center more on technical matters than the answers found in the studies of the late 1980s and after (Tas, LaBrecque, and Clayton, 1996). For example, Sapienza (1978) asserted that courses related to the hotel operation along with hotel law and security techniques are valuable. According to Tas (1983), the most representative author related to this issue, however, important competencies are: (1) managing the guest problems with understanding and sensitivity, (2) maintaining professional and ethical standards in work environment, (3) demonstrating poise and a professional appearance, (4) communicating effectively both in writing and orally, (5) developing positive customer relations, and (6) striving to achieve the positive working relationships with employees. According to Tas (1988), furthermore, important competencies for hotel-manager trainees are: (1) human-relations skills, (2) professional ethical standards, (3) diplomacy, and (4) effective oral and written communication skills. He also suggested full lists of competencies by classifying them into three categories such as essential, considerable important, and moderate important competencies. Other major researches up to 1990 include: technical, human, and conceptual (Hersey & Blanchard, 1998), and demonstration of organization skills, people skills, and leadership (Van Dyke and Strick, 1990). Tas (1988) established that there were six essential competencies for hotel manager trainees that centered primarily on human-relations skills. These skills are: managing guest problems, professional and ethical standards, professional appearance and poise, effective communication, positive customer relations, and positive working relationships.

35
Chung (2000) also revealed that (1) all general and hotel business administration courses including marketing, human resources, finance, and accounting and (2) fundamental or principle courses such as statistics, management, and economics were important areas of study to develop competencies in the hotel industry. Moreover, “management of employee and job” and “management analysis techniques” related competencies were more influenced capabilities for career success in the hotel industry. Additionally, the important competencies for hotel-management trainees identified by Tas (1988) were (1) human-relations skills, (2) professional ethical standards, (3) diplomacy, and (4) effective oral and written communication skills. He also suggested full lists of competencies by classifying them into three categories such as essential, considerably important, and moderately important competencies. There were six essential competencies for hotel management trainees that centered primarily on human-relations skills. These skills were: managing guest problems, professional and ethical standards, professional appearance and poise, effective communication, positive customer relations, and positive working relationships. Moreover, Gillbert and Guerrier (1997) found that the management styles and competencies are described by hospitality managers as having changed over the past 20 years. Managers are described as being more consultative. On the other hand, Deery and Jago (2001) indicated the first ten competencies to compare with Gillbert and Guerrier’s findings as shown in table 1.9. Moreover, Deery and Jago (2001) also found that hotel managers in the late 1990s perceived lack of these competencies as follows:
• Communication skills • People management skills • Providing feedback • Assisting with job requirements • Using staff skills well

36
• Encouraging training • Representing staff views to senior management • Influencing decisions on, for example, salaries
Table 1.9 Hotel Management Style Over the Decades
The hotel manager of the 1970s
(Gillbert and Guerrier)
The hotel manager of the 1990s
(Gillbert and Guerrier)
The hotel manager of the 1990s: 1997-2000
(Deery and Jago)
Autocratic/military Made instant decisions Almost theatrical Distanced from staff Hardness of approach Lead by example Insular with little access Rigid personality A ‘carnation’ man ‘Seat of the pants’
More consideration about decision making Less three-dimensional Acts the manager Less hands on or involved Team leader or facilitator Only forces issues when required More consultative/democratic More office based
Has authority to make decisions Makes prompt decisions Is approachable Fully understands the employees’ jobs Is competent Knows what is going on in the organization Is available to answer questions Helps in difficult situations Treats staff with respect Treats staff fairly
Remark: a Adaptation of Gillbert and Guerrier, 1997, p.128.

37
Agut (2003) presented the technical managerial competency needs in most of the areas. Economic-financial management and computing are the items with the highest deficit. Furthermore, managers present more knowledge needs than skills needs in economic-financial management, marketing and market analysis, work organization, people and work team management, human resources management, tourism products and services, and customer profiles and behaviors. This result implies that the strategy chosen to improve competencies by reducing or eliminating needs should reinforce the knowledge component of these competencies rather than the skills component. These findings confirm those of Grau (2000 and 2002), which used focus groups composed of other informants as well as managers. Thus, despite the use of different techniques and respondents, the results of two previous studies and the present one coincide in that Spanish hotel and restaurant managers need to improve mainly their knowledge and skills components in competences involving computing, languages, health and risk prevention, marketing, work organization, human resources management, and customer profiles and behaviors. Managers also display needs in more than half of the 22 generic managerial competences considered. The average highest deficit identified in “control of hasty reactions in highly emotive situations”. This result is not so strange if we consider the emotional nature of this competence. Results obtained here do not coincide with those obtained by Grau (2000, 2002) where deficits were only detected into two generic managerial competences. One possible explanation for this disagreement could be that respondents other than the managers themselves might consider most of the generic managerial competences studied as personality traits, rather than competences that can be developed for effective job performance.
Eaton (2000) identified the research describes the replication of Tas’ and Baum’s studies in Greece, a traditional holiday destination in Europe. The most obvious result of the study is that general mangers identified “soft skills” as most

38
essential. Even six years after the first two studies (table1.10) similar to those by Tas (1988) and Buam (1995) resurface. This has to be taken seriously by hospitality educators in Greece and elsewhere. Compared with the British hotel managers, the Greeks showed little reluctance to rate competencies as “essential”. The gap with the American professionals was even larger: the Greeks were very reluctant to consider any area as “unimportant” (table 1.10). This is reflected in the composite mean for all 36 competencies (not tabled here). Thus, one may assume that Greek employers have higher demands and expectations of potential recruits than British and American counterparts. A further interesting outcome of the survey is that the majority of the hoteliers in these countries agreed to what the most essential competency is for trainees: the ability to manage guest problems with understanding and sensitivity. “Soft skills” figure in the first position of most general managers’ checklist in these countries. The practical consequence suggested by this study is the establishment of stronger links between the education programs and the industry. The results regarding the competencies required by graduate management trainees can guide educators’ development of study programs that are closer to the needs of the industry. Baum (1990) suggested that comparative surveys provide the basis for the development of an internationally transferable core curriculum for relevant degrees. The Greek study can contribute to the development of university programs that could take place in the context of a European Diploma in Hospitality Management. It is reasonable to assume that the needs of the hospitality and tourism industry will not remain constant in the future. Therefore, similar studies should be repeated in the future, perhaps every two to three years, in order to keep in touch with social and industrial changes.

39
Table 1.10 Competencies Characterized Essential a
Competencies Rank Greece
Christou and
Eaton study
Greece Mean
Rank UK
Buam study UK
Mean
Rank USA
Tas Study USA Mean
Manages guest problems with understanding and sensitivity
1 4.89 1 4.81 1 4.80
Demonstrates professional appearance and poise
2 4.83 5 4.61 3 4.61
Develops positive customer relations
3 4.72 6 4.24 5 4.60
Strives to achieve positive working relationships with employees
4 4.63 4 4.52 6 4.52
Possesses needed leadership qualities to achieve organizational objectives
5 4.60 9 4.40 7 4.48
Maintain professional and ethical standards in the work environment
6 4.58 9 4.40 2 4.69
Table 1.10 (Continued) Competencies Rank
Greece
Eaton study Greec
e
Rank
UK
Buam study UK
Mean
Rank
USA
Tas Study USA Mean
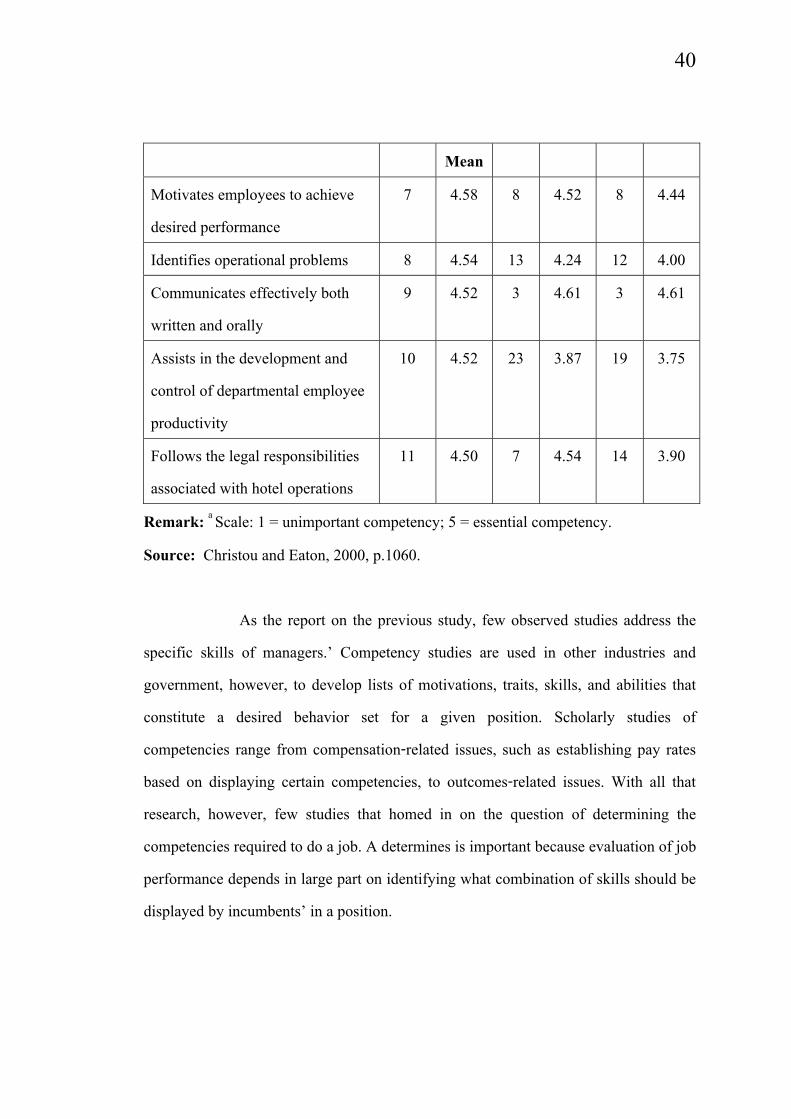
40
Mean Motivates employees to achieve desired performance
7 4.58 8 4.52 8 4.44
Identifies operational problems 8 4.54 13 4.24 12 4.00 Communicates effectively both written and orally
9 4.52 3 4.61 3 4.61
Assists in the development and control of departmental employee productivity
10 4.52 23 3.87 19 3.75
Follows the legal responsibilities associated with hotel operations
11 4.50 7 4.54 14 3.90
Remark: a Scale: 1 = unimportant competency; 5 = essential competency. Source: Christou and Eaton, 2000, p.1060.
As the report on the previous study, few observed studies address the
specific skills of managers.’ Competency studies are used in other industries and government, however, to develop lists of motivations, traits, skills, and abilities that constitute a desired behavior set for a given position. Scholarly studies of competencies range from compensation-related issues, such as establishing pay rates based on displaying certain competencies, to outcomes-related issues. With all that research, however, few studies that homed in on the question of determining the competencies required to do a job. A determines is important because evaluation of job performance depends in large part on identifying what combination of skills should be displayed by incumbents’ in a position.

41
1.3. Aim and Objectives
Aim: To identify the key competencies needed for the hotel managers to be successful.
The objectives of this study are: 1.3.1 To investigate the organizational behavior in Phuket hotels. 1.3.2 To examine the impact of demographic characteristic on the
employee perceptions toward the organizational behavior. 1.3.3 To identify the key perceived leadership competencies for the
Phuket hotel first line managers. 1.3.4 To investigate the impact of demographic characteristic on the
employee perceptions toward leadership competencies. 1.4 Hypothesis
The hypotheses of this study are: 1.4.1 Hypothesis1: Employees demographic characteristics do not
have an impact on the hotel employee perceptions toward the organizational behavior.
1.4.2 Hypothesis2: Hotel characteristics do not have an impact on the hotel employee perceptions toward the organizational behavior.

42
1.4.3 Hypothesis3: Employees demographic characteristics do not have an impact on the hotel employee perceptions toward leadership competencies.
1.4.4 Hypothesis4: Hotel characteristics do not have an impact on the hotel employee perceptions toward leadership competencies.
1.5 Significance of the Study
1.5.1 To guide the hotel to recruit the correct potential candidate for the management positions.
1.5.2 Provide the guideline for the university to decide the training programs that best suits the industry’s needs.
1.6 Scope of the study
1.6.1 Scope of Time: Total study period would be two years from September 2007 to April 2009. The questionnaire was carried out between September 2008 and November 2008.
1.6.2 Scope of Geography: Distribution of questionnaires to hotel employees to be carried out at hotels in Phuket.

43
1.6.3 Area of Research: Primary focus is to identify the leadership competencies for the hotel managers and investigate the factors affect the perception of employees who work in the hotels in Phuket.
1.6.4 Scope of Demography: The data will be collect from hotel employees who worked in the Phuket hotels.
1.7 Definition of Key Terms
1.7.1 Hotel Employee The term of hotel employees in this study refer to Thai operational
employees who worked in only the operational level. 1.7.2 First Line Manager First line manager are the lowest-level managers; they manage the work
of line employees. They may also be called supervisors. 1.7.3 Leadership The word leadership can refer to the process of leading, those entities
that perform one or more acts of leading, and the ability to affect human behaviors so as to accomplish a mission designated by the leader.
1.7.4 Competency Competency is a measurable pattern of knowledge, skills, abilities,
behaviors, and other characteristics that an individual needs to successfully perform work roles or discharge occupational functions.
1.7.5 Leadership Competency Leadership Competency describes competencies such as valuable skills,
abilities, behaviors, attitudes, and knowledge areas that is characteristic of positions

44
having leadership responsibilities (e.g., supervisors, managers, and team leaders) in order for an organization to be successful, both now and in the future. Leadership competencies are distinguishable from general and technical competencies.

34
CHAPTER 2
METHODOLOGY
This chapter reviews the methodology utilized in
conducting this study. First, a description of population, sample
size and selection of this study was described. Next, how the
respondents were exposed to the research instrument was
described, followed by how the researcher collected the data.
Last, the discussion of the analysis of the data was presented.
2.1 Population, Sampling Size and Selection
The target population of this study was hotel
employees. However, the exact number of hotel employee in
Phuket is not available. So, the researcher sorted out all hotels
from the list of accommodation in Phuket conducted by the
Tourism Authority of Thailand (TAT) in 2007. The results
found that the number of rooms in the year 2007 was 38,528.
The ratio between employees per room was 1:1.5 (Thansettakij,
2008). So, the estimated number of hotel employees in Phuket
was 57,792 employees. Based on Yamane calculation, the
sample size was 398.
Yamane (1967) indicated that size of sample group
of hotel employee statistical population formulary as followed:
n = N
1 + N(e2)
When n : Sample size
N : Size of target population which was the
number of the Phuket hotel employees in
2007.
e : The level of precision (the confidence level
at 95%), 0.05 population variable

35
Calculation the sample size of the hotel employees in
Phuket:
n = 57,792
1 + 57,792 (0.05)2
n = 397.25
Therefore, the sample size was 398.
The questionnaires were distributed to the
participating hotels between September, 2008 and November,
2008. Since the number of hotel employees in Phuket is
unknown. From the 639 properties in the list of accommodation
in Phuket conducted by the Tourism Authority of Thailand
(TAT) in 2007, there were 38,528 rooms in year 2007 and the
ratio between employees per room was 1:1.5 (Thansettakij,
2008). Therefore, the estimated number of hotel employees in
Phuket in 2007 was 57,792 employees. Due to the limit of time,
convenience sampling method was applied. Out of 639 hotels,
314 hotels were selected and permission to question their
employees was sought. Only 80 hotels agreed to facilitate the
researcher for data collection. When the permission was granted,
personal visits were made to the human resource officers for 58
hotels while only 10 hotels were contacted via the post. The
questionnaires were left with the human resource officers to
distribute to their hotel employees. The employees who worked
in the participating hotels were requested to complete the
questionnaire and return them to their respective human
resource offices. Every one or two weeks, the researcher
inquired about the returns from different hotels and, if sufficient
in number, they were collected. On average 10 questionnaires
were distributed to some hotels. Otherwise, there were some
hotels that requested less or more number of questionnaires.
Moreover, to maximize the response rate, the face to face
interviews were conducted at 4 hotel bus stops in town at the
Surakul stadium bus stop, Vichitt Road bus stop, Merlin hotel
bus stop and Rajabhat university bus stop. In addition, 580
questionnaires were distributed personally to 58 hotels, 100

36
questionnaires were distributed to 10 hotels via the post and 100
questionnaires by face to face interviews. In total 780
questionnaires were distributed and 585 were returned. Only,
545 completed questionnaires were usable and representing a
response rate of 69.87%.
2.2 Type of Research
This research is a quantitative study. Firstly, the
researcher acquired information which is principle, theory and
related research and relevant literatures. The questionnaire was
applied to collect data from hotel operational level employees.
After finishing the questionnaire design, the pre-test was
conducted for twenty hotel employees to improve the content
comprehensibility and clarity of the questionnaire. Finally, the
questionnaires were distributed to the participating hotels by
using a convenience sampling method and were left with the
human resource officers to be distributed to the hotel employees.
The hotel employees completed the questionnaires and returned
them to their human resource officers. Every one or two weeks,
the researcher called about the returns and got them back and
collected to analyze.
2.3 Research Instruments
The questionnaire (Appendix B and C) was adapted
from previous research and literature which related to
leadership competencies. First, the researcher was created the
questionnaire in English version and translated it into a Thai
version in order to maximize the response rate because the
majority of the respondents are Thai. Before the main survey,
the pre-test was conducted for twenty hotel employees to
maximize the validity of the result and clarify of the instrument.

37
The questionnaire instrument consisted of four
sections on the followings:
Section 1: Hotel employee demographics
Section 2: Organizational Information
Section 3: Leadership Competencies
Section 4: Organizational behavior
This questionnaire was structured for the purpose to
identify the key perceived leadership competencies for first line
managers in the participating Phuket hotels and to investigate
the impact of demographic characteristic of employees on their
perceptions toward leadership competencies. The questionnaires
combined closed - end multiple choice and Likert-type scale
questions.
In the first section, basic details about a hotel
employee’s demographic characteristic. This section composed
of seven questions including; gender, age, education level,
working experience in the industry, working experience in the
hotel, position, and department.
The second section composed of five questions. It
related to the organizational characteristic such as: hotel size,
hotel rating, number of employees in the hotel, management
style of the hotel, and type of hotel.
The third section was composed of sixty-five
questions. This section was designed to determine the
employee’s perceptions towards leadership competencies of
their first line managers. Sixty-five variables of leadership
competencies were examined in this study. All of the sixty-five
leadership competencies variables in this section were
developed based on the review of the related literatures and
modified to apply within the scope of this research. A five point
Likert - type scale was used as the response format for
leadership competencies variables they were: strongly disagree
(1), disagree (2), neither agree nor disagree (3), agree (4), and
strongly agree (5).

38
The forth section composed of nine questions and
was structured to measure levels of hotel employee’s
perceptions concerned with the norms, values and practices in
their organization. These questions including; number of
employees in the unit, group loyalty, concerned people in unit,
manager’s expectation, performance improvement,
communication between bosses and subordinates, loyalty to the
hotel, distance among bosses and subordinates, and relation
among people in the organization.
2.4 Data Collection
In this study the research used both primary data
collection and secondary collection.
2.4.1 Primary data
545 questionnaires were collected from respondents
who are the hotel employees in Phuket. The data was collected
from September 2008 - November 2008. The researcher applied
the quantitative method. The research methodology was done
by survey method using questionnaires. The researcher
distributed questionnaires to the target sample. The number of
314 hotels was contacted and asked for the support to collect
data. However, only 80 hotels agreed to facilitate the researcher
for data collection. After that, the questionnaires were
distributed to the human resource officers in the participated
hotels for data collection with their employees. Additionally, to
maximize the response rate, face to face interview was
conducted with the other hotel employees at the hotel bus stops
in town.
2.4.2 Secondary data

39
The researcher collected further information from the
following:
• Tourism Authority of Thailand (TAT)
• Academic journals
• Textbooks
• Newspapers
• Websites
2.5 Data Analysis-Statistics used to analyze the Data
For initial survey data analysis, SPSS (Statistical
Package for the Social Sciences) version 15.0 computer
software program was used as a tool for analyze data and
describe of statistic data. The researcher decided to use
descriptive statistics (e.g. frequencies, percentages, average), the
independent sample t - test, one way ANOVA, and factor
analysis for this study where appropriate are used with
quantitative data. It also had necessary graphs and table which
generated with SPSS. Each section of the questionnaire was
applied with proper statistics to analyze the data.
Descriptive statistics were used in order to identify
the demographic characteristics of the respondents on leadership
competencies.
Factor analysis was applied as a data reduction or
structure detection method. It was used to classify a large
number of variables or detect structure in the relationships
between variables and explained variability among observed
leadership competencies variables in terms of fewer unobserved
variables called factors (Thurstone, 1931).
The independent sample t-test and one way
ANOVA were used to examine the impact of hotel employees’
demographics on the perception towards leadership
competencies.
For the data analysis, mean was based on the
interval level that is calculated by:

40
The interval level = [Maximum - Minimum] / n
= [5 - 1] / 5
= 0.80
Therefore, the researcher arranged the results of
each sub - level as follows:
Level of Important and
Agreement Meaning
1.00 - 1.80
1.81 - 2.60
2.61 - 3.40
3.41 - 4.20
4.21 - 5.00
Very unimportant / Strongly
disagree
Unimportant / Disagree
Neutral / Neither agree nor
disagree
Important / Agree
Very important / Strongly
agree

40
CHAPTER 3 RESULTS
The result of this study were based on the responses of 545 Phuket hotel employees who were asked to complete the research questionnaire. This study aimed to identify the key competencies needed for the hotel managers to be successful. The objectives of this research were: (1) to investigate the organizational behavior in Phuket hotels, (2) to examine the impact of demographic characteristic on the employee perceptions toward the organizational behavior, (3) to identify the key leadership competencies for the Phuket hotel first line managers, and (4) to investigate the impact of demographic characteristic on the employee perceptions toward leadership competencies.
In this chapter, researcher presented the findings as follow:
3.1 Demographic Profile of Respondents 3.2 The Characteristic Profile of the Respondents’
Hotels 3.3 Organizational Behavior 3.4 Independent Sample t-test on Impact of
Respondents’ Demographic Characteristics and the Organizational Behavior
3.5 Independent Sample t-test on Impact of Hotel Characteristics and the Organizational Behavior
3.6 Factor Analysis 3.7 Descriptive Statistics of the Leadership
Competency Factors 3.8 Independent Sample t-test on Impact of
Respondents’ Demographic Characteristics and the Competency Factors
3.9 Independent Sample t-test on Impact of Hotel Characteristics and the Competency Factors

41
3.10 One-Way ANOVA on Impact of Hotel Characteristics and the Competency Factors
3.11 One-Way ANOVA on Impact of Respondents’ Demographic Characteristics and the Competency Factors
3.1 Demographic Profile of Respondents
The demographic information of the respondents is shown in table 3.1. There were 194 (35.6%) male and 351 (64.4%) female respondents. In terms of the age of respondents, 14.3% were below 25 years old, 62.6% were between 25-34 years old, and 23.2% were 35 years or older. In terms of the educational background of respondents had the following: 341 (62.6%) held a bachelors degree or above, while 204 (37.4%) respondents held a school certificate or diploma.
With respect to the experience background, the results indicated that 88 (14.9%) respondents had more than 10 years of working experience in the hotel industry, while 142 (26%) respondents had 6-10 years of working experience in the hotel industry. Moreover, 315 (58.1%) respondents had less than 5 years of experience in the hotel industry. On the other hand, 31.4% of the respondents had worked in this hotel for less than 2 years, 41.5% worked in this hotel for 2-4 years, while 27.1% worked in this hotel for more than 5 years. In terms of their position, 339 (62.2%) worked in front of house positions while 206 (37.8%) worked in back of house positions. On the other hand, among five groups, the front office department accounted for the highest response rate (25.7%), while food and beverage and accounting department together accounted for 38.7%. The housekeeping department accounted for 17.1%, while others accounted for 18.7%.

42
Table 3.1 Respondents’ Demographic Characteristics Profile Respondent’s demographic
characteristics Frequency Percentage
Gender Male Female
Total
194 351 545
35.6 64.4
100.0 Age Less than 25 years 25-34 years 35 years or older
Total
78
341 126 545
14.3 62.6 23.2
100.0 Table 3.1 (Continued) Education Certificate or diploma Undergraduate degree or higher
Total
204 341 545
37.4 62.6
100.0
Working experience in the hotel industry Less than 5 years 6-10 years More than 10 years
Total
315 142 88
545
58.1 26.0 14.9
100.0
Working experience in this hotel Less than 2 years 2-4 years 5-7 years More than 7 years
Total
171 226 44
104 545
31.4 41.5 8.1
19.0 100.0
Department Front of house: Front office
339 140
62.2 25.7

43
Food and Beverage Back of house: Accounting Housekeeping Others
Total
107 206 104 93
101 545
19.6 37.8 19.1 17.1 18.7
100.0 3.2 The Characteristic Profile of the Respondents’ Hotels
From table 3.2, it is obvious that the majority of the respondents worked for medium and large size hotels (39.9% worked for 100-300 room hotels and 34.9% worked for 300 rooms or more hotels). On the other hand, 49% of respondents worked in five-star hotels, 22.2% of respondents worked in four-star hotels, while 13% of respondents worked in three-star hotels and 15.8% of respondents worked in less than three-star hotels. As for the number of employees in the hotels, it is obvious that the majority of respondents worked for hotels that employed 300 or more employees and 100-300 employees. (52.3% worked for hotels that employed 300 or more employees, 26.8% worked for hotels that employed 100-300 employees). Only 114 (20.9%) of respondents worked for hotels that employed less than 100 employees. On the other hand, 377 (69.2%) were the respondents who had less than 25 employees in their unit while 168 (30.8%) were the respondents who had more than 25 employees in their unit. In terms of chain of the hotels, surprisingly, two groups were equally distributed, 30.6% of the respondents who worked for international chain hotels with affiliation whereas 31.6% of respondents who worked for independent hotels without affiliation, while 37.8% of respondents who worked for Thai chain hotels with affiliation. However, 73.8% of the respondents who worked in resort hotels, while 26.2% of respondents who worked in city hotels.
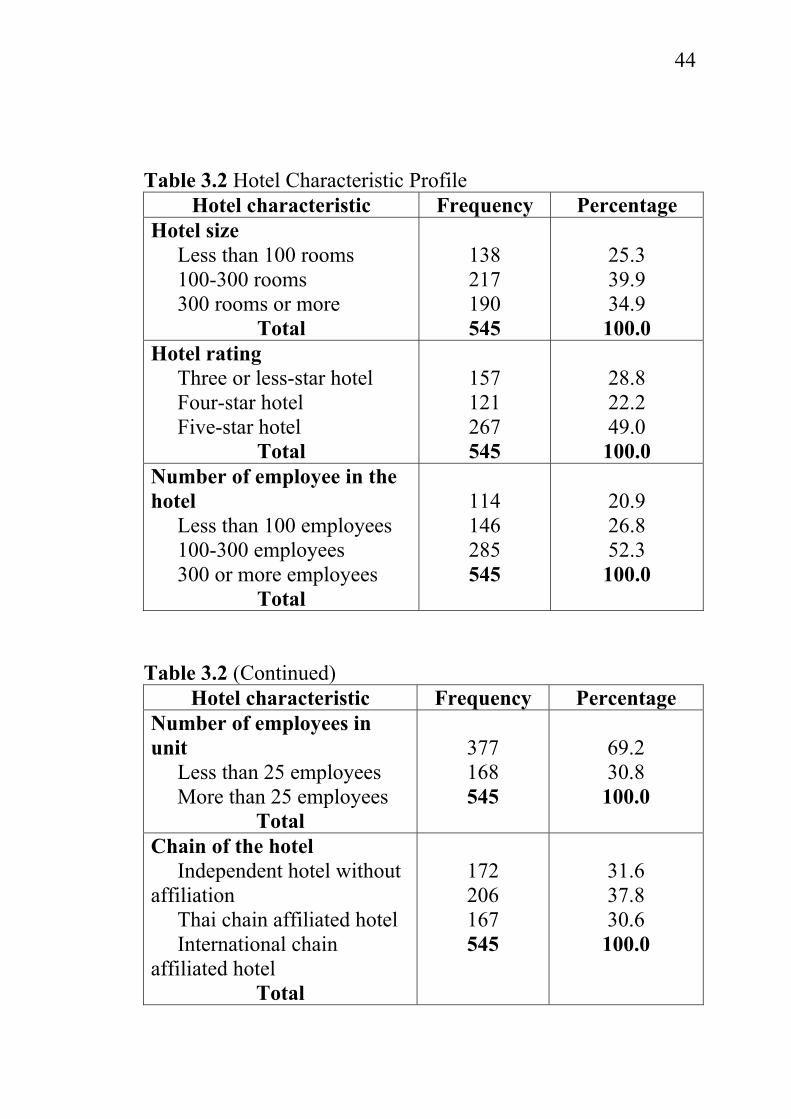
44
Table 3.2 Hotel Characteristic Profile
Hotel characteristic Frequency Percentage Hotel size Less than 100 rooms 100-300 rooms 300 rooms or more
Total
138 217 190 545
25.3 39.9 34.9
100.0 Hotel rating Three or less-star hotel Four-star hotel Five-star hotel
Total
157 121 267 545
28.8 22.2 49.0
100.0 Number of employee in the hotel Less than 100 employees 100-300 employees 300 or more employees
Total
114 146 285 545
20.9 26.8 52.3
100.0
Table 3.2 (Continued)
Hotel characteristic Frequency Percentage Number of employees in unit Less than 25 employees More than 25 employees
Total
377 168 545
69.2 30.8
100.0
Chain of the hotel Independent hotel without affiliation Thai chain affiliated hotel International chain affiliated hotel
Total
172 206 167 545
31.6 37.8 30.6
100.0

45
Type of the hotel Resort hotel City hotel
Total
402 143 545
73.8 26.2
100.0 3.3 Organizational Behavior
As shown in tables 3.3 and 3.4, the majority of the respondents perceived that they were expected to questions their boss when in disagreement (Mean = 3.91), job requirements and instruction were spelled out in detail so the respondents knew what they were expected to do (Mean = 3.85). People in the positions of power try to decrease their social distance from less powerful people (Mean = 3.84). They were encouraged to strive for continuously improved performance (Mean = 3.79), and people in their unit were generally concerned about others (Mean = 3.78).
In terms of the norm, most of the respondents perceived that managers encourage group loyalty even if individual goals suffer (Mean = 3.75). The respondents felt loyal to their hotels (Mean = 3.75). However, they were not sure whether they could talk about the disagreements to anyone that they want to tell (Mean = 3.68).

46
Table 3.3 Descriptive Statistics of the Organizational Behavior
Level of agreement Mean SD
Agreement level
Factors
Strongly
disagree
(%)
Disagree (%)
Neutral
(%)
Agree
(%)
Strongly
agree (%)
Subordinates are expected to question their boss when in disagreement
4.2 6.2
18.3 36.5 34.7
3.91 1.074 Agree
Job requirements and instruction are spelled out in detail so I know what I am expected to do
1.8 5.9
23.3 43.9 25.1 3.85 0.929
Agree
People in the positions of power try to decrease their social distance from less powerful people
5.0 5.0 22.0 36.9 31.2 3.84 1.074
Agree
Employees are encouraged to strive for continuously improved performance
2.4 6.2 22.9 46.8 21.7 3.79 0.932
Agree
In your unit, people are generally concerned about others
4.4 7.3 17.6 47.5 23.1 3.78 1.024
Agree
Managers encourage group loyalty even if individual goals suffer
5.3 6.4 20.0 44.2 24.0 3.75 1.057
Agree
I feel loyalty to the hotel
3.3 4.6 28.4 41.1 22.6 3.75 0.965
Agree

47
When people in this hotel have serious disagreement with each other, they talk about the disagreements to anyone they want to tell
3.5 5.0 37.1 28.8 25.7 3.68 1.020
Agree
Notes: 1) Agreement ranking was based on mean scores
measured on a Likert-type scale from 1 to 5 (1 = strongly disagree, 2 = disagree, 3= neither agree nor disagree, 4 = agree, and 5 = strongly agree).
2) N = 545 3.4 Independent Sample t-test on Impact of Respondents’ Demographic Characteristics and the Organizational Behavior
Based on the independent sample t-test, the results in table 3.4 showed that there was statistically significant difference between male and female perception regarding in “Subordinates are expected to question their boss when in disagreement”. The perceptions of female employees were stronger than male employees that subordinates are expected to question their boss when in disagreement.

48
Table 3.4 The Independent Sample t-test on Impact of Gender on the Organizational Behavior
Mean SD t-value
p-value
Managers encourage group loyalty even if individual goals suffer Male Female
3.63 3.82
1.085 1.037
-1.947 0.052
In your unit, people are generally concerned about others Male Female
3.66 3.84
1.021 1.022
-1.889 0.059
Subordinates are expected to question their boss when in disagreement Male Female
3.78 3.99
1.032 1.091
-2.165 0.031*
Employees are encouraged to strive for continuously improved performance Male Female
3.72 3.83
0.948 0.921
-1.386 0.166
I feel loyalty to the hotel Male Female
3.67 3.79
0.957 0.967
-1.447 0.148
Table 3.4 (Continued) Job requirements and instruction are spelled out in detail so I know what I am expected to do Male
3.75 3.90
0.940 0.919
-1.844 0.066

49
Female People in the positions of the power try to decrease their social distance from less powerful people Male Female
3.78 3.88
1.084 1.069
-0.978 0.329
When people in this hotel have serious disagreement with each other, they tell about the disagreements to anyone they want to tell Male Female
3.68 3.68
0.977 1.045
-0.037 0.971
Remarks: 1) t-test two tailed probability < 0.05, 2) * indicates statically significant of differences between groups,
3) N = 545
Based on the independent sample t-test, the results in table 3.5 showed that there was no statistically significant difference between the employees who held certificate or diploma and the employees who held undergraduate degree or higher regarding in all of the way things are in hotel. Therefore, the education of the respondents has no impact to the perceptions of the organizational behavior. Table 3.5 The Independent Sample t-test on Impact of Education on the Organizational Behavior
Mean SD t-value p-value
Managers encourage group loyalty even if individual goals suffer Certificate or diploma
3.78
1.029
0.463 0.644

50
Table 3.5 (Continued) Mean SD t-value p-
value Undergraduate or higher 3.74 1.074 In your unit, people are generally concerned about others Certificate or diploma Undergraduate or higher
3.74 3.80
1.118 0.965
-0.694 0.488
Subordinates are expected to question their boss when in disagreement Certificate or diploma Undergraduate or higher
3.90 3.92
1.057 1.086
-0.250 0.803
Employees are encouraged to strive for continuously improved performance Certificate or diploma Undergraduate or higher
3.84 3.76
0.920 0.939
0.919 0.359
Job requirements and instruction are spelled out in detail so I know what I am expected to do Certificate or diploma Undergraduate or higher
3.81 3.87
0.912 0.939
-0.625 0.532
I feel loyalty to the hotel Certificate or diploma Undergraduate or higher
3.67 3.80
0.961 0.965
-1.571 0.117
People in the positions of the power try to decrease their social distance from less powerful people Certificate or diploma Undergraduate or higher
3.82 3.86
1.065 1.081
-0.427 0.670

51
Table 3.5 (Continued)
Mean SD t-value p-value
When people in this hotel have serious disagreement with each other, they tell about the disagreements to anyone they want to tell Certificate or diploma Undergraduate or higher
3.71 3.67
1.007 1.029
0.499 0.618
Remarks: 1) t-test two tailed probability < 0.05, 2) * indicates statically significant of differences between groups,
3) N = 545
Based on the independent sample t-test, the results in table 3.6 showed that there was statistically no significant difference between the employees who worked in front of house and the employees who worked back of house positions regarding in all of organizational behavior. Therefore, positions of the respondents have no impact to the perceptions of the organizational behavior.
Table 3.6 The Independent Sample t-test on Impact of Position on the Organizational Behavior
Mean SD t-value
p-value
Managers encourage group loyalty even if individual goals suffer Front of the house
3.76 3.73
1.010 1.131
0.323 0.747

52
Back of the house In your unit, people are generally concerned about others Front of the house Back of the house
3.79 3.76
0.989 1.082
0.335 0.738
Subordinates are expected to question their boss when in disagreement Front of the house Back of the house
3.90 3.94
1.020 1.161
-0.410 0.682
Table 3.6 (Continued)
Mean SD t-value
p-value
Employees are encouraged to strive for continuously improved performance Front of the house Back of the house
3.78 3.81
0.907 0.973
-0.293 0.770
Job requirements and instruction are spelled out in detail so I know what I am expected to do Front of the house Back of the house
3.83 3.87
0.910 0.959
-0.547 0.585
I feel loyalty to the hotel Front of the house Back of the house
3.73 3.79
0.938 1.007
-0.770 0.442
People in the positions of the power try to decrease their social distance from less powerful people
3.86
1.050
0.483 0.630

53
Front of the house Back of the house
3.82 1.115
When people in this hotel have serious disagreement with each other, they tell about the disagreements to anyone they want to tell Front of the house Back of the house
3.63 3.77
1.030 1.000
-1.508 0.132
Remarks: 1) t-test two tailed probability < 0.05, 2) * indicates statically significant of differences between groups,
3) N = 545
3.5 Independent Sample t-test on Impact of Hotel Characteristics and the Organizational Behavior
Based on the independent sample t-test, the results in table 3.7 showed that there was statistically no significant difference between the employees who worked in their unit which less than 25 employees and the employees who worked in their unit which more than 25 employees regarding “Job requirements and instruction are spelled out in detail so I know what I am expected to do”. Therefore, number of employee in unit has no impact to the perceptions of the organization’s behaviors.

54
Table 3.7 The Independent Sample t-test on Impact of Number of Employee in Unit on the Organizational Behavior
Mean SD t-value
p-value
Managers encourage group loyalty even if individual goals suffer Less than 25 employees More than 25 employees
3.70 3.88
1.051 1.062
-1.813 0.070
In your unit, people are generally concerned about others Less than 25 employees More than 25 employees
3.82 3.68
1.005 1.063
1.486 0.138
Subordinates are expected to question their boss when in disagreement Less than 25 employees More than 25 employees
3.91 3.92
1.040 1.150
-0.069 0.945
Employees are encouraged to strive for continuously improved performance Less than 25 employees More than 25 employees
3.76 3.87
0.947 0.893
-1.309 0.191
Job requirements and instruction are spelled out in detail so I know what I am expected to do Less than 25 employees More than 25 employees
3.80 3.95
0.951 0.870
-1.691 0.092

55
Table 3.7 (Continued) Mean SD t-
value p-
value I feel loyalty to the hotel Less than 25 employees More than 25 employees
3.75 3.76
0.983 0.925
-0.089 0.929
People in the positions of the power try to decrease their social distance from less powerful people Less than 25 employees More than 25 employees
3.82 3.90
1.111 0.989
-0.830 0.407
When people in this hotel have serious disagreement with each other, they tell about the disagreements to anyone they want to tell Less than 25 employees More than 25 employees
3.66 3.74
1.030 0.997
-0.939 0.348
Remarks: 1) t-test two tailed probability < 0.05, 2) * indicates statically significant of differences between groups,
3) N = 545
Based on the independent sample t-test, the results in table 3.8 showed that there were statistically significant differences between resort hotel employees and city hotel employees regarding “Subordinates are expected to question their boss when in disagreement” and “People in the positions of the power try to decrease their social distance from less powerful people” behaviors. The respondents who worked in city hotels perceived that subordinates are expected to question their boss when in disagreement and people in the positions of

56
the power try to decrease their social distance from less powerful people more than the respondents who worked in resort hotels.
Table 3.8 The Independent Sample t-test on Impact of Type of Hotel on the Organizational Behavior
Mean SD t-value
p-value
Managers encourage group loyalty even if individual goals suffer Resort hotel City hotel
3.72 3.84
1.133 0.802
-1.343 0.180
In your unit, people are generally concerned about others Resort hotel City hotel
3.75 3.86
1.062 0.908
-1.230 0.220
Subordinates are expected to question their boss when in disagreement Resort hotel City hotel
3.86 4.07
1.112 0.947
-2.216 0.027*
Employees are encouraged to strive for continuously improved performance Resort hotel City hotel
3.78 3.83
0.975 0.799
-0.564 0.573
Job requirements and instruction are spelled out in detail so I know what I am expected to do
3.85
0.944
0.205 0.837

57
Resort hotel City hotel
3.83 0.888
I feel loyalty to the hotel Resort hotel City hotel
3.72 3.85
1.016 0.799
-1.547 0.123
People in the positions of the power try to decrease their social distance from less powerful people Resort hotel City hotel
3.79 4.01
1.130 0.884
-2.377 0.018*
Table 3.8 (Continued)
Mean SD t-value
p-value
When people in this hotel have serious disagreement with each other, they tell about the disagreements to anyone they want to tell Resort hotel City hotel
3.63 3.83
1.042 0.944
-1.951 0.052
Remarks: 1) t-test two tailed probability < 0.05, 2) * indicates statically significant of differences between groups,
3) N = 545 3.6 Factor Analysis
There were 65 leadership competencies used in this study. Principal component analysis with varimax rotation was employed in the exploratory factor analysis to extract from 65 competencies into a set of simplified composite factors that could be used to describe the original construct to analysis the leadership competencies necessary for success as managers.

58
First, The Kaiser-Meyer-Olkin measure of sampling adequacy was used to quantify the degree of inter-correlations among the variables and the appropriateness of factor analysis. As shown in table 3.9, Kaiser-Meyer-Olkin (KMO) statistic was calculated as 0.96 for this study. Because KMO was above 0.8, the 65 competencies could be considered interrelated and they shared common underlying dimensions. Second, the Bartlett test of sphericity was conducted in order to test the significance of the correlation matrix (X2=20210.56, df=2080, p<0.000). Both tests indicated that factor analysis was appropriate for this study.
Table 3.9 KMO and Bartlett’s Test Kaiser-Meyer-Olkin Measure of Sampling Adequacy. Bartlett’s Test of Sphericity Approx. Chi-Square df Sig.
0.959
20210.568 2080 0.000
After the validity of the factor analysis was
determined, an exploratory factor analysis using principle component with varimax rotation was used to identify underlying factors according to which the employees in the Phuket hotels evaluated the agreement of the competencies necessary for success as the Phuket hotels managers. In general, when factors have an eigenvalue equal to or greater than 1, then they can be considered statistically significant. In this study, the competencies with a factor loading of 0.5 or higher were clustered together; the results of the factor analysis produced a clear factor structure with relatively appropriate factors. Fifty-seven out of sixty-five competencies were excluded from this

59
process. The results of the factor analysis had shown in table 3.10. From the varimax-rotated factor matrix, eight factors were extracted that explain 54.86% of overall variance. These eight factors were named as “Empowerment skill”, “Planning and Implementation”, “Team building skill”, “Communication skill”, “Problem solving and self-development skill”, “Coaching skill”, “Counseling skill”, and “Adaptive skill”. These factors were named based on the common characteristics of the items in each factor. Table 3.10 The Result of the Factor Analysis
Factor Factor
Loading
Eigenvalue
Variance
Explained
Cronbach’s
Alpha
F1: Empowerment (eigenvalue = 22.992, % of variance = 10.543) Encourages employees to use their initiative to remedy problems
0.628
22.992
10.543 0.915
Table 3.10 (Continued) Factor Facto
r Loadi
ng
Eigenvalue
Variance
Explained
Cronbach’s
Alpha
when they first occur (Q26) Allow subordinates to lead under the appropriate circumstances (Q27) Inspires and motivates subordinates (Q28) Prepares subordinates
0.602
0.646
0.650

60
to understand changes (Q29) Defines and sets up quality standards for employees (Q30) Gives others the authority necessary to accomplish their objectives (Q31) Involves employees in critical decisions that affect them (Q32) Defines priorities for the staff (Q33) Keeps employees updated with information (Q34) Gets employees interested and involved in the change process (Q35)
0.616
0.616
0.504
0.645
0.620
0.553
F2: Planning and Implementation (eigenvalue = 3.401, % of variance = 9.441) Anticipates obstacles and develop plans (Q1) Adapts to changing circumstances (Q2)
0.604
0.574
3.401 9.441 0.866
Table 3.10 (Continued)
Factor Factor
Loading
Eigenvalue
Variance
Explained
Cronbach’s
Alpha
Manages time to 0.610

61
ensure productivity (Q3) Integrates planning efforts across work groups or functional units (Q4) Considers a broad range of factors (internal, external, and trends) when resolving problems and making decisions (Q5) Brings together different perspectives and approaches and combines them in creative ways (Q6) Develops action plans to meet customer needs (Q8) Develops new systems or processes for increased efficiency (Q10)
0.660
0.667
0.521
0.531
0.515
F3: Team building skill (eigenvalue = 1.931, % of variance = 8.260) Encourages employees to express their views, even contrary ones (Q56) Adjusts leadership approach to fit other individuals (Q57) Works as a member of a team (Q58) Champions new ideas and initiatives (Q59)
0.525
0.644
0.658
0.587
1.931 8.260 0.872

62
Table 3.10 (Continued)
Factor Factor
Loading
Eigenvalue
Variance
Explained
Cronbach’s
Alpha
Employs a team approach to solve problems when appropriate (Q60) Promotes respect and appreciation for diversity and individual differences (Q61) Treats people fairly (Q62) Promotes teamwork among groups; discourages “us versus them” thinking (Q63) Monitors progress of employees and redirects efforts when necessary (Q64)
0.567
0.577
0.526 0.565
0.541
F4: Communication skill (eigenvalue = 1.746, % of variance = 6.698) Summarizes and clarifies what people say to ensure understanding (Q16) Expresses disagreement in a tactful and sensitive manner (Q22) Presents ideas in a
0.519
0.667
0.667
0.588
1.746 6.698 0.780

63
convincing manner (Q23) Clarifies expectations to staff members about assignments, roles, and responsibilities (Q24) F5: Problem solving and self-development (eigenvalue = 1.533, % of variance = 5.684) Confronts problems early before they become unmanageable (Q44)
0.615
1.533 5.684 0.744
Table 3.10 (Continued) Factor Facto
r Loadi
ng
Eigenvalue
Variance
Explained
Cronbach’s
Alpha
Pursues continual learning and self-development (Q45)
0.654
F6: Coaching skill (eigenvalue = 1.455, % of variance = 5.571) Listens carefully to input and concerns expressed by others (Q18) Provides employees access to information (Q48) Treats employees with respect (Q49) Coaches others in skill development (Q50)
0.551
0.592
0.576
0.563
1.455 5.571 0.786

64
F7: Counseling skill (eigenvalue = 1.341, % of variance = 4.988) Understands and harnesses individual differences to create a competitive advantage (Q54) Gives specific, timely, and constructive feedback (Q55)
0.623
0.649
1.341 4.988 0.763
F8: Adaptive skill (eigenvalue = 1.262, % of variance = 3.676) Works effectively in ambiguous situations (Q36) Select leadership style most appropriate for the situation (Q37)
0.701
0.597
1.262 3.676 0.526
Remarks: 1) F* = Factor Loading 2) () is the question number in Section 3 and 5 of the questionnaire. The first factor had the highest eigenvalue (22.992), and it presented 10.543% of the explained variance. The example attributes included in this factor were “Encourages employees to use their initiative to remedy problems when they first occur”, “Allow subordinates to lead under the appropriate circumstances”, “Inspires and motivates subordinates”, “Prepares subordinates to understand changes”, “Defines and sets up quality standards for employees”, and “Gives others the authority necessary to accomplish their objectives”. Therefore, this factor was named as “Empowerment” factor. The second

65
highest eigenvalue (3.401) was “Planning and Implementation” factor. This factor represented 9.441% of the explained variance in the sample. The “Team building skill” factor contained 9 competencies and explained 8.260% of the variance with an eigenvalue of 1.931. On the other hand, the “Communication skill” factor had the eigenvalue 1.746, and it presented 6.689% of the explained variance. In term of the “Problem solving and self-development skill” factor included the example attributes such as “Confronts problems early before they become unmanageable” and “Pursues continual learning and self-development”. This factor’s eigenvalue was 1.533, and this represented 5.684% of the explained variance in the sample. Moreover, the “Coaching skill” factor included the following attributes: “Listens carefully to input and concerns expressed by others”, “Provides employees access to information”, “Treats employees with respect”, and “Coaches others in skill development”. This factor accounted for 5.571 of the variance with an eigenvalue of 1.455%. On the other hand, the “Counseling skill” factor contained 2 attributes such as “Understands and harnesses individual differences to create a competitive advantage”, and “Gives specific, timely, and constructive feedback”. This factor had a 1.341 eigenvalue and represented 4.988% of the explained variance. The last factor was “Adaptive skill” factor contained 2 attributes included: “Works effectively in ambiguous situations” and “Select leadership style most appropriate for the situation”. In case of eight factors, summated scales were constructed, all of competencies loading highly on each factor were combined, and the average scores of the variables were used as replacement variables. Cronbach’s alpha was calculated to test the reliability of these summated scales. Generally, the agreed upon lower limit for Cronbach’s alpha is 0.70 (Hair, 1998). In this study, the reliability analysis with Cronbach’s alpha results in table 3.6 shows that most of the reliability values exceed the recommended level of 0.70 except factor 8.

66
3.7 Descriptive Statistics of the Leadership Competency Factors
The descriptive analysis results are shown in table 3.11. After analyzing the overall mean value of eight factors on leadership competencies necessary for managers in the Phuket hotels based on the employee perceptions, the ranking was listed in descending order of mean value ranging from “1” as “strongly disagree” and “5” as “strongly agree”. The respondents agreed that the eight derived factors were necessary competencies for hotel managers, but in different degree of agreement. Among all these eight factors, competencies in “Problem solving and self-development” was rated highest by the respondents, followed by “Coaching skill”, “Planning and Implementation”, “Team building skill”, “Communication skill”, “Empowerment”, “Counseling skill”, and “Adaptive skill”.
Table 3.11 Descriptive Statistics of the Leadership Competency Factors
Mean SD Ranking
F5: Problem solving and self-development skill
4.0881 0.70290 1
F6: Coaching skill 4.0225 0.63345 2 F2: Planning and Implementation 4.0179 0.58906 3 F3: Team building skill 3.9941 0.56257 4 F4: Communication skill 3.9867 0.62329 5 F1: Empowerment skill 3.9530 0.63864 6 F7: Counseling skill 3.7798 0.76165 7 F8: Adaptive skill 3.5394 0.85899 8
Note: Importance rankings were based on mean scores measured on a Likert-type scale from 1 to 5 (1 = strongly

67
disagree, 2 = disagree, 3 = neither agree nor disagree, 4 = agree, and 5 = strongly agree).
3.8 Independent Sample t-test on Impact of Respondents’
Demographic Characteristics and the Competency Factors
Based on the independent sample t-test, the results in
table 3.12 showed that there was statistically significant difference between male and female employee’s perception regarding “Adaptive skill” factor. The perception of male employees perceived “Adaptive skill” factor more important than female employees.
Table 3.12 The Independent Sample t-test on Impact of Gender on Competency Factors
Mean SD t-value p-value Empowerment skill Male Female
3.9134 3.9749
0.6797 0.6147
-1.046 0.296
Planning and Implementation Male Female
3.9807 4.0385
0.6209 0.5706
-1.097 0.273
Team building skill Male Female
4.0063 3.9873
0.5803 0.5533
0.376 0.707
Communication skill Male Female
3.9601 4.0014
0.6322 0.6188
-0.742 0.459
Problem solving and self-development skill Male
4.1418 4.0584
0.6804 0.7143
1.326 0.185

68
Female Coaching skill Male Female
4.0142 4.0271
0.6647 0.6164
-0.227 0.820
Counseling skill Male Female
3.8273 3.7536
0.7600 0.7624
1.083 0.279
Adaptive skill Male Female
3.6804 3.4615
0.7725 0.8948
2.990 0.003*
Remarks: 1) t-test two tailed probability < 0.05, 2) * indicates statically significant of differences between groups,
3) N = 545 Based on the independent sample t-test, the results in
table 3.13 showed that there were statistically significant differences between certificate or diploma and undergraduate or higher regarding “Planning and Implementation”, “Team building skill”, “Communication skill”, “Coaching skill”, and “Adaptive skill” factors. The respondents who held bachelors degree or higher perceived these factors more important than the respondents who held a certificate or diploma.
Table 3.13 The Independent Sample t-test on Impact of Education on the Competency Factors
Mean SD t-value p-value Empowerment skill Certificate or diploma Undergraduate or higher
3.9147 3.9760
0.5885 0.6666
-1.118 0.264
Planning and Implementation Certificate or diploma
3.9295 4.0707
0.5943 0.5804
-2.724 0.007*

69
Undergraduate or higher Team building skill Certificate or diploma Undergraduate or higher
3.9303 4.0323
0.5575 0.5630
-2.054 0.040*
Communication skill Certificate or diploma Undergraduate or higher
3.8787 4.0513
0.6348 0.6081
-3.155 0.002*
Problem solving and self-development skill Certificate or diploma Undergraduate or higher
4.0196 4.1290
0.6856 0.7109
-1.762 0.079
Coaching skill Certificate or diploma Undergraduate or higher
3.9387 4.0726
0.6272 0.6328
-2.398 0.017*
Counseling skill Certificate or diploma Undergraduate or higher
3.7843 3.7771
0.7362 0.7776
0.107 0.915
Table 3.13 (Continued)
Mean SD t-value p-value Adaptive skill Certificate or
3.3431
0.8653
-4.189 0.000*

70
diploma Undergraduate or higher
3.6569 0.8347
Remarks: 1) t-test two tailed probability < 0.05, 2) * indicates statically significant of differences between groups,
3) N = 545
Based on the independent sample t-test, the results in table 3.14 showed that there were statistically significant differences in five competency factors “Empowerment skill”, “Planning and Implementation”, “Problem solving and self-development skill”, “Coaching skill”, and “Counseling skill” factors between front of house and back of house positions. The respondents who worked in back of house positions perceived these fives factors more important than the respondents who worked in front of house positions.
Table 3.14 The Independent Sample t-test on Impact of Position on the Competency Factors
Mean SD t-value p-value Empowerment skill Front of the house Back of the house
3.9094 4.0248
0.6556 0.6045
-2.091 0.037*
Planning and Implementation Front of the house Back of the house
3.9786 4.0825
0.5952 0.5744
-2.002 0.046*
Team building skill Front of the house
3.9669 4.0388
0.5581 0.5683
-1.449 0.148

71
Back of the house Communication skill Front of the house Back of the house
3.9653 4.0218
0.6291 0.6135
-1.026 0.305
Table 3.14 (Continued)
Mean SD t-value p-value Problem solving and self-development skill Front of the house Back of the house
4.0133 4.2112
0.6917 0.7056
-3.214 0.001*
Coaching skill Front of the house Back of the house
3.9676 4.1129
0.6595 0.5783
-2.611 0.009*
Counseling skill Front of the house Back of the house
3.7183 3.8811
0.7945 0.6944
-2.511 0.012*
Adaptive skill Front of the house Back of the house
3.5767 3.4782
0.8338 0.8976
1.299 0.194
Remarks: 1) t-test two tailed probability < 0.05,

72
2) * indicates statically significant of differences between groups,
3) N = 545
3.9 Independent Sample t-test on Impact of Hotel Characteristics and the Competency Factors
Based on the independent sample t-test, the results in table 3.15 showed that there were statistically significant differences in “Coaching skill”, “Counseling skill”, and “Adaptive skill” competency factors between the employees who worked in their unit which less than 25 employees and the employees who worked in their unit which more than 25 employees. The respondents who had more than 25 employees in their unit perceived these three factors more important than the respondents who had less than 25 employees in their unit. Table 3.15 The Independent Sample t-test on Impact of Number of Employee in Unit on the Competency Factors
Mean SD t-value p-value Empowerment skill Less than 25 employees More than 25 employees
3.91884.0298
0.6136 0.6873
-1.797 0.073
Planning and Implementation Less than 25 employees More than 25 employees
4.00274.0521
0.5532 0.6631
-0.844 0.399
Team building skill -1.743 0.082

73
Less than 25 employees More than 25 employees
3.96614.0569
0.5351 0.6169
Communication skill Less than 25 employees More than 25 employees
3.95234.0640
0.6031 0.6617
-1.973 0.053
Problem solving and self-development skill Less than 25 employees More than 25 employees
4.05974.1518
0.6859 0.7377
-1.375 0.170
Coaching skill Less than 25 employees More than 25 employees
3.98474.1071
0.6193 0.6581
-2.089 0.037*
Counseling skill Less than 25 employees More than 25 employees
3.73473.8810
0.7526 0.7743
-2.076 0.038*
Adaptive skill Less than 25 employees More than 25 employees
3.48943.6518
0.8481 0.8751
-2.044 0.041*
Remarks: 1) t-test two tailed probability < 0.05, 2) * indicates statically significant of differences between groups,
3) N = 545

74
Based on the independent-sample t-test, the results in
table 3.16 showed that there were significant differences in eight competency factors as “Empowerment skill”, “Planning and Implementation”, “Team building skill”, “Communication skill”, “Problem solving and self-development skill”, “Coaching skill”, “Counseling skill” and “Adaptive skill” factors between resorts and city hotels. The respondents who worked for resorts viewed these factors more necessary than the respondents who worked for city hotels. Table 3.16 The Independent Sample t-test on Impact of Type of Hotel on the Competency Factors
Mean SD t-value p-value Empowerment skill Resort City
4.01593.7762
0.6676 0.5110
4.425 0.000*
Planning and Implementation Resort City
4.08493.8295
0.5886 0.5500
4.531 0.000*
Team building skill Resort City
4.07493.7669
0.5577 0.5135
5.789 0.000*
Communication skill Resort City
4.01803.8986
0.6340 0.5854
1.973 0.049*
Problem solving and self-development skill Resort City
4.15423.9021
0.7184 0.6231
3.727 0.000*
Coaching skill Resort City
4.08083.8584
0.6446 0.5719
3.647 0.000*

75
Counseling skill Resort City
3.84953.5839
0.7641 0.7219
3.621 0.000*
Table 3.16 (Continued)
Mean SD t-value p-value Adaptive skill Resort City
3.63933.2587
0.8178 0.9113
4.635 0.000*
Remarks: 1) t-test two tailed probability < 0.05, 2) * indicates statically significant of differences between groups,
3) N = 545
3.10 One-Way ANOVA on Impact of Hotel Characteristics and the Competency Factors
In term of hotel size, the ANOVA results in table 3.17
showed that there were significant differences between hotel size and leadership competency factors included “Empowerment”, “Planning and Implementation”, “Team building skill”, “Communication skill”, “Problem solving and self-development skill”, “Coaching skill” factors (p<0.05) . But there was no significant difference between hotel size and “Adaptive skill” factor.
Table 3.17 The One-Way ANOVA on Impact of the Hotel Size on the Leadership Competency Factors
F-Test p-value F1: Empowerment 5.299 0.005* F2: Planning and Implementation 5.912 0.003* F3: Team building skill 10.381 0.000* F4: Communication skill 12.955 0.000* F5: Problem solving and self-development
10.430 0.000*

76
F6: Coaching skill 13.955 0.000* F7: Counseling skill 6.190 0.002* F8: Adaptive skill 1.007 0.366
Remarks: 1) p-value = Level of statistically significant (2 tailed), 2) N = 545
As seen in table 3.18, when multiple comparisons (LSD) were calculated, the results showed that the respondents who worked in small and medium size hotels perceived “Empowerment” factor equally important. However, the respondents who worked in large size hotels perceived “Empowerment” factor more important than the respondents who worked in small and medium size hotels. Table 3.18 Multiple Comparisons (LSD) on Impact of the Hotel Size on the “Empowerment” Factor
Hotel size N Mean SD Letter* Less than 100 rooms
138 3.8507 0.6140 a
100-300 rooms 217 3.9171 0.6750 a 300 rooms or more
190 4.0684 0.5979 b
Total 545 3.9530 0.6386 * Means with the same letter are not significantly different (at the 5% level), when “a” = “Less than 100 rooms”, and “b” = “300 rooms or more”.
The result in table 3.19 showed that the respondents who worked in small and medium size hotels perceived “Planning and Implementation” factor equally important while the respondents who worked in large size hotels perceived “Planning and Implementation” factor more than the respondents who worked in small and medium size hotels.

77
Table 3.19 Multiple Comparisons (LSD) on Impact of the Hotel Size on the “Planning and Implementation” Factor
Hotel size N Mean SD Letter* Less than 100 rooms
138 3.8976 0.6002 a
100-300 rooms 217 4.0046 0.5635 a 300 rooms or more
190 4.1204 0.5945 b
Total 545 4.0179 0.5891 * Means with the same letter are not significantly different (at the 5% level), when “a” = “Less than 100 rooms”, and “b” = “300 rooms or more”.
Table 3.20 showed that the respondents who worked in small and medium size hotels perceived “Team building skill” factor equally important while the respondents who worked in large size hotels perceived “Team building skill” factor more than the respondents who worked in small and medium size hotels. Table 3.20 Multiple Comparisons (LSD) on Impact of the Hotel Size on the “Team Building Skill” Factor
Hotel size N Mean SD Letter* Less than 100 rooms
138 3.8800 0.5116 a
100-300 rooms 217 3.9406 0.5814 a 300 rooms or more
190 4.1380 0.5489 b
Total 545 3.9941 0.5626 * Means with the same letter are not significantly different (at the 5% level), when “a” = “Less than 100 rooms”, and “b” = “300 rooms or more”. From the table 3.21, the results showed that the respondents who worked in large size hotels perceived

78
“Communication skill” factor more important than the respondents who worked in small and medium size hotels while the respondents who worked in medium size hotels the “100-300 rooms” hotels perceived “Communication skill” factor more important than the respondents who worked in small size hotels but less important than the respondents who worked in large size hotels. Table 3.21 Multiple Comparisons (LSD) on Impact of the Hotel Size on the “Communication Skill” Factor
Hotel size N Mean SD Letter* Less than 100 rooms
138 3.8062 0.6049 a
100-300 rooms 217 3.9597 0.6046 b 300 rooms or more
190 4.1487 0.6198 c
Total 545 3.9867 0.6233 * Means with the same letter are not significantly different (at the 5% level), when “a” = “Less than 100 rooms”, “b” = “100-300 rooms”, and “c” = “300 rooms or more”. The result in table 3.22 showed that the respondents who worked in small and medium size hotels perceived “Problem solving and self-development” factor equally importance while the respondents who worked in large size hotels perceived “Problem solving and self-development” factor more than the respondents who worked in small and medium size hotels. Table 3.22 Multiple Comparisons (LSD) on Impact of the Hotel Size on the “Problem solving and Self-development” Factor
Hotel size N Mean SD Letter* Less than 100 rooms
138 3.9203 0.6734 a
100-300 rooms 217 4.0438 0.6644 a

79
300 rooms or more
190 4.2605 0.7323 b
Total 545 4.0881 0.7029 * Means with the same letter are not significantly different (at the 5% level), when “a” = “Less than 100 rooms”, and “b” = “300 rooms or more”. The result in table 3.23 showed that the respondents who worked in large size hotels perceived “Coaching skill” factor more important than the respondents who worked in small and medium size hotels while the respondents who worked in medium size hotels perceived “Coaching skill” factor more important than the respondents who worked in small size hotels but less important than the respondents who worked in large size hotels. Table 3.23 Multiple Comparisons (LSD) on Impact of the Hotel Size on the “Coaching Skill” Factor
Hotel size N Mean SD Letter* Less than 100 rooms
138 3.8460 0.6654 a
100-300 rooms 217 3.9793 0.6054 b 300 rooms or more
190 4.2000 0.5988 c
Total 545 4.0225 0.6335 * Means with the same letter are not significantly different (at the 5% level), when “a” = Less than 100 rooms”, “b” = “100-300 rooms”, and “c” = “300 rooms or more”. Table 3.24 showed that the respondents who worked in small and medium size hotels perceived “Counseling skill” factor equally important while the respondents who worked in large size hotels perceived “Counseling skill” factor more than the respondents who worked in small and medium size hotels.

80
Table 3.24 Multiple Comparisons (LSD) on Impact of the Hotel Size on the “Counseling Skill” Factor
Hotel size N Mean SD Letter* Less than 100 rooms
138 3.6304 0.7696 a
100-300 rooms 217 3.7512 0.7579 a 300 rooms or more
190 3.9211 0.7394 b
Total 545 3.7798 0.7617 * Means with the same letter are not significantly different (at the 5% level), when “a” = “Less than 100 rooms”, and “b” = “300 rooms or more”. In terms of number of employees, table 3.25 showed that there were strongly significant differences between number of employees and all eight factors; “Empowerment”, “Planning and Implementation”, “Team building skill”, “Communication skill”, “Problem solving and self-development”, “Coaching skill”, “Counseling skill”, and “Adaptive skill” factors (p<0.00). Table 3.25 The One-Way ANOVA on Impact of the Number of Employees on the Leadership Competency Factors
F-Test p-value F1: Empowerment 24.938 0.000* F2: Planning and Implementation 19.917 0.000* F3: Team building skill 37.695 0.000* F4: Communication skill 30.871 0.000* F5: Problem solving and self-development
16.085 0.000*
F6: Coaching skill 29.378 0.000* F7: Counseling skill 20.766 0.000* F8: Adaptive skill 10.036 0.000*
Remarks: 1) p-value = Level of statistically significant (2 tailed), 2) N = 545

81
The result in table 3.26 showed that the respondents who worked for hotels that employed “Less than 100 employees” and “100-300 employees” perceived “Empowerment” factor equally important while the respondents who worked for hotels that employed “300 or more employees” perceived “Empowerment” competency more important than the respondents who worked for hotels that employed “Less than 100 employees” and “100-300 employees”. Additionally, the results in Table 3.26 Multiple Comparisons on Impact of the Number of Employees on the “Empowerment” Factor
No. of employees N Mean SD Letter* Less than 100 employees
114 3.7816 0.6691 a
100-300 employees
146 3.7425 0.5947 a
300 or more employees
285 4.1295 0.5973 b
Total 545 3.9530 0.6386 * Means with the same letter are not significantly different (at the 5% level), when “a” = “Less than 100 employees”, and “b” = “300 employees or more”. Table 3.27 showed that the respondents who worked for hotels that employed “Less than 100 employees” and “100-300 employees” perceived “Planning and Implementation” factor equally important while the respondents who worked for hotels that employed “300 or more employees” perceived “Planning and Implementation” competency more important than the respondents who worked for hotels that employed “Less than 100 employees” and “100-300 employees”.
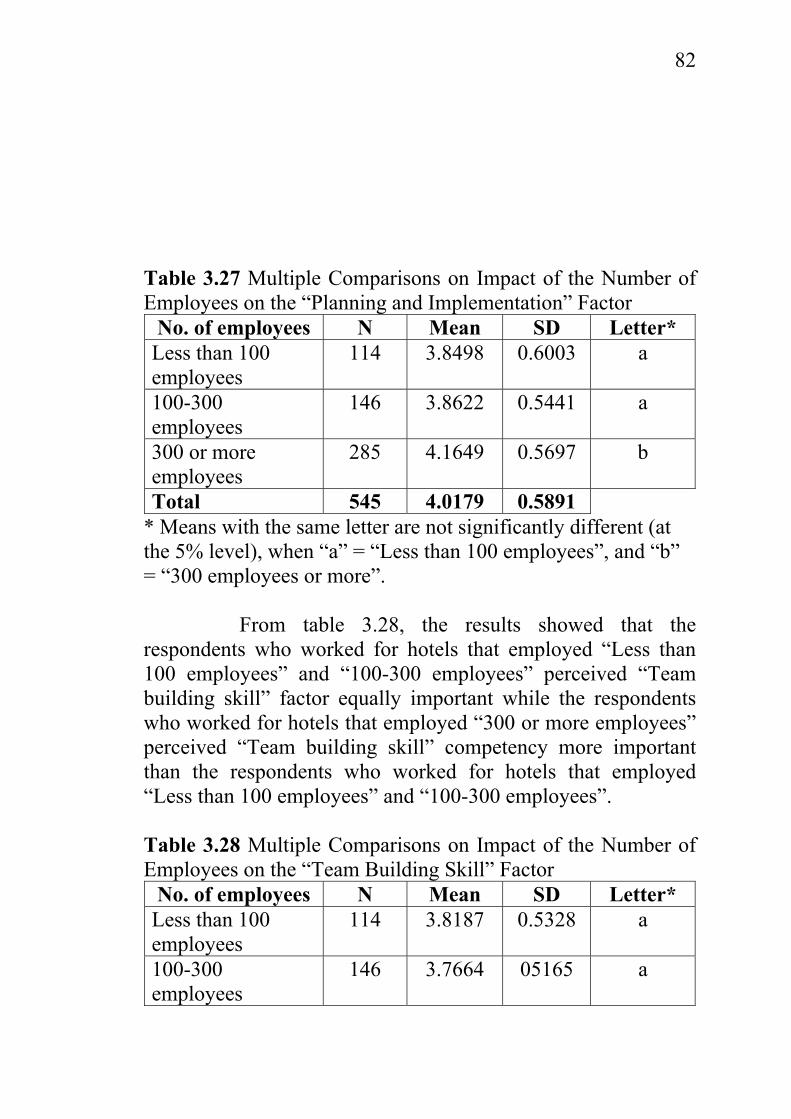
82
Table 3.27 Multiple Comparisons on Impact of the Number of Employees on the “Planning and Implementation” Factor
No. of employees N Mean SD Letter* Less than 100 employees
114 3.8498 0.6003 a
100-300 employees
146 3.8622 0.5441 a
300 or more employees
285 4.1649 0.5697 b
Total 545 4.0179 0.5891 * Means with the same letter are not significantly different (at the 5% level), when “a” = “Less than 100 employees”, and “b” = “300 employees or more”.
From table 3.28, the results showed that the
respondents who worked for hotels that employed “Less than 100 employees” and “100-300 employees” perceived “Team building skill” factor equally important while the respondents who worked for hotels that employed “300 or more employees” perceived “Team building skill” competency more important than the respondents who worked for hotels that employed “Less than 100 employees” and “100-300 employees”.
Table 3.28 Multiple Comparisons on Impact of the Number of Employees on the “Team Building Skill” Factor
No. of employees N Mean SD Letter* Less than 100 employees
114 3.8187 0.5328 a
100-300 employees
146 3.7664 05165 a

83
300 or more employees
285 4.1809 0.5320 b
Total 545 3.9941 0.5626 * Means with the same letter are not significantly different (at the 5% level), when “a” = “Less than 100 employees”, and “b” = “300 employees or more”.
Table 3.29 showed that the respondents who worked for hotels that employed “300 or more employees” perceived “Communication skill” competency more important than the respondents who worked for hotels that employed “Less than 100 employees” and “100-300 employees” while the respondents who worked for hotels that employed “100-300 employees” perceived “Communication skill” competency more important than the respondents who worked for hotels that employed “Less than 100 employees” but less important than the respondents who worked for hotels that employed “300 or more employees”.
Table 3.29 Multiple Comparisons on Impact of the Number of Employees on the “Communication Skill” Factor
No. of employees N Mean SD Letter* Less than 100 employees
114 3.6996 0.6134 a
100-300 employees
146 3.8527 0.5751 b
300 or more employees
285 4.1702 0.5912 c
Total 545 3.9867 0.6233 * Means with the same letter are not significantly different (at the 5% level), when “a” = “Less than 100 employees”, “b” = “100-300 employees”, and “c” = “300 employees or more”.
From table 3.30, the results showed that the respondents who worked for hotels that employed “Less than

84
100 employees” and “100-300 employees” perceived “Problem solving and self-development” factor equally important while the respondents who worked for hotels that employed “300 or more employees” perceived “Problem solving and self-development” competency more important than the respondents who worked for hotels that employed “Less than 100 employees” and “100-300 employees”.
Table 3.30 Multiple Comparisons on Impact of the Number of Employees on the “Problem solving and Self-development” Factor
No. of employees N Mean SD Letter* Less than 100 employees
114 3.8816 0.6794 a
100-300 employees
146 3.9418 0.6760 a
300 or more employees
285 4.2456 0.6902 b
Total 545 4.0881 0.7029 * Means with the same letter are not significantly different (at the 5% level), when “a” = “Less than 100 employees”, and “b” = “300 employees or more”.
Table 3.31 showed that the respondents who worked for hotels that employed “Less than 100 employees” and “100-300 employees” perceived “Coaching skill” factor equally important while the respondents who worked for hotels that employed “300 or more employees” perceived “Coaching skill” competency more important than the respondents who worked for hotels that employed “Less than 100 employees” and “100-300 employees”.
Table 3.31 Multiple Comparisons on Impact of the Number of Employees on the “Coaching Skill” Factor

85
No. of employees N Mean SD Letter* Less than 100 employees
114 3.8268 0.6006 a
100-300 employees
146 3.8065 0.6649 a
300 or more employees
285 4.2114 0.5694 b
Total 545 4.0225 0.6335 * Means with the same letter are not significantly different (at the 5% level), when “a” = “Less than 100 employees”, and “b” = “300 employees or more”.
Moreover, table 3.32 showed that the respondents
who worked for hotels that employed “Less than 100 employees” and “100-300 employees” perceived “Counseling skill” factor equally important while the respondents who worked for hotels that employed “300 or more employees” perceived “Counseling skill” competency more important than the respondents who worked for hotels that employed “Less than 100 employees” and “100-300 employees”.
Table 3.32 Multiple Comparisons on Impact of the Number of Employees on the “Counseling Skill” Factor
No. of employees N Mean SD Letter* Less than 100 employees
114 3.5614 0.7790 a
100-300 employees
146 3.5719 0.7701 a
300 or more employees
285 3.9737 0.6985 b
Total 545 3.7798 0.7617 * Means with the same letter are not significantly different (at the 5% level), when “a” = “Less than 100 employees”, and “b” = “300 employees or more”.

86
In addition, table 3.33 showed that the respondents who worked for hotels that employed “300 or more employees” perceived “Adaptive skill” competency more important than the respondents who worked for hotels that employed “Less than 100 employees” and “100-300 employees” while the respondents who worked for hotels that employed “100-300 employees” perceived “Adaptive skill” competency more important than the respondents who worked for hotels that employed “Less than 100 employees” but less important than the respondents who worked for hotels that employed “300 or more employees”.
Table 3.33 Multiple Comparisons on Impact of the Number of Employees on the “Adaptive Skill” Factor
No. of employees N Mean SD Letter* Less than 100 employees
114 3.2632 0.9690 a
100-300 employees
146 3.4897 0.8104 b
300 or more employees
285 3.6754 0.8087 c
Total 545 3.5394 0.8590 * Means with the same letter are not significantly different (at the 5% level), when “a” = “Less than 100 employees”, “b” = “100-300 employees”, and “c” = “300 employees or more”.
As seen in table 3.34, ANOVA results showed that there were strongly significant differences between hotel rating and all competency factors; “Empowerment”, “Planning and Implementation”, “Team building skill”, “Communication skill”, “Problem solving and self-development”, “Coaching skill”, “Counseling skill”, and “Adaptive skill” factors (p<0.00). Table 3.34 The One-Way ANOVA on Impact of the Hotel Rating on the Leadership Competency Factors

87
F-Test p-value F1: Empowerment 8.017 0.000* F2: Planning and Implementation 7.809 0.000* F3: Team building skill 13.858 0.000* F4: Communication skill 19.620 0.000*
Table 3.34 (Continued) F-Test p-value F5: Problem solving and self-development
9.326 0.000*
F6: Coaching skill 16.377 0.000* F7: Counseling skill 7.317 0.001* F8: Adaptive skill 18.805 0.000*
Remarks: 1) p-value = Level of statistically significant (2 tailed), 2) N = 545
The results in table 3.35 showed that the respondents who worked in “Four star” and “Five star” hotels rated the “Empowerment” competency equally important whereas the respondents who worked in “Three or less-star” hotels viewed the “Empowerment” competency less important than the respondents who worked in the “Four star” and “Five star” hotels. In terms of “Planning and Implementation” competency, table 3.36 showed that the respondents who worked in “Four star” and “Five star” hotels rated the “Planning and Implementation” competency equally important. Moreover, the respondents who worked in “Three or less-star” hotels perceived the “Planning and Implementation” competency less important than the respondents who worked in “Four star” and “Five star” hotels. Table 3.35 Multiple Comparisons on Impact of the Hotel Rating on the “Empowerment” Factor
Hotel rating N Mean SD Letter*Three or less-star 157 3.7847 0.6310 a

88
Four star 121 3.9942 0.6458 b Five star 267 4.0333 0.6178 b Total 545 3.9530 0.6386
* Means with the same letter are not significantly different (at the 5% level), when “a” = “Three or less-star”, and “b” = “Five star”. Table 3.36 Multiple Comparisons on Impact of the Hotel Rating on the “Planning and Implementation” Factor
Hotel rating N Mean SD Letter*Three or less-star 157 3.8631 0.6109 a Four star 121 4.0816 0.4838 b Five star 267 4.0801 0.5998 b Total 545 4.0179 0.5891
* Means with the same letter are not significantly different (at the 5% level), when “a” = “Less than three star”, and “b” = “Five star”. From table 3.37 and 3.38, the respondents who worked in “Four star” and “Five star” hotels perceived the “Team building skill” and “Communication skill” competency factors equally important. Also, the respondents who worked in “Three or less-star” hotels perceived these two factors less important than the respondents who worked in “Four star”, and “Five star” hotels. Table 3.37 Multiple Comparisons on Impact of the Hotel Rating on the “Team Building Skill” Factor
Hotel rating N Mean SD Letter*Three or less-star 157 3.7997 0.5470 a Four star 121 4.0569 0.5651 b Five star 267 4.0799 0.5424 b

89
Total 545 3.9941 0.5626 * Means with the same letter are not significantly different (at the 5% level), when “a” = “Three or less-star”, and “b” = “Five star”. Table 3.38 Multiple Comparisons on Impact of the Hotel Rating on the “Communication Skill” Factor
Hotel rating N Mean SD Letter*Three or less-star 157 3.7325 0.6275 a Four star 121 4.0992 0.5482 b Five star 267 4.0852 0.6006 b Total 545 3.9867 0.6233
* Means with the same letter are not significantly different (at the 5% level), when “a” = “Three or less-star”, and “b” = “Five star”. The results in table 3.39 and 3.40 showed that the respondents who worked in “Four star” and “Five star” hotels perceived the “Problem solving and self-development” and “Coaching skill” competency factors equally important while the respondents who worked in “Three or less-star” hotels perceived these two factors less important than the respondents who worked in “Four star”, and “Five star” hotels. Table 3.39 Multiple Comparisons on Impact of the Hotel Rating on the “Problem solving and Self-development” Factor
Hotel rating N Mean SD Letter*Three or less-star 157 3.8981 0.7002 a Four star 121 4.2397 0.6895 b

90
Five star 267 4.1311 0.6811 b Total 545 4.0881 0.7029
* Means with the same letter are not significantly different (at the 5% level), when “a” = “Three or less-star”, “b” = “Five star”, and “c” = “Four star”. Table 3.40 Multiple Comparisons on Impact of the Hotel Rating on the “Coaching Skill” Factor
Hotel rating N Mean SD Letter*Three or less-star 157 3.7930 0.6007 a Four star 121 4.1839 0.6248 b Five star 267 4.0843 0.6356 b Total 545 4.0225 0.6335
* Means with the same letter are not significantly different (at the 5% level), when “a” = “Three or less-star”, and “b” = “Five star”.
From table 3.41, the respondents who worked in “Three or less-star” hotels viewed the “Counseling skill” competency factor less important than the respondents who worked in “Five star” hotels while there was no significant difference for the respondents who worked in “Four star” hotels. However, the respondents who worked in “Four star” hotels viewed this factor more than the respondents who worked in “Three or less-star” hotels but less than the respondents who worked in “Five star” hotels. Table 3.41 Multiple Comparisons on Impact of the Hotel Rating on the “Counseling Skill” Factor
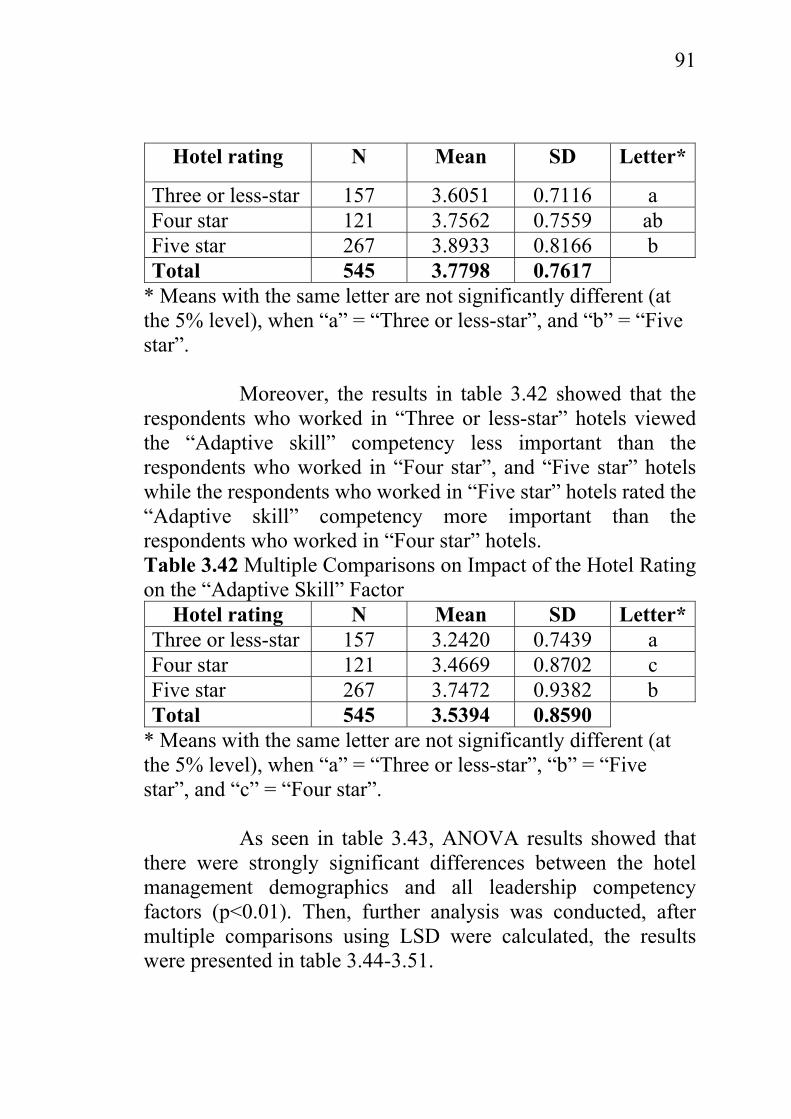
91
Hotel rating N Mean SD Letter*
Three or less-star 157 3.6051 0.7116 a Four star 121 3.7562 0.7559 ab Five star 267 3.8933 0.8166 b Total 545 3.7798 0.7617
* Means with the same letter are not significantly different (at the 5% level), when “a” = “Three or less-star”, and “b” = “Five star”.
Moreover, the results in table 3.42 showed that the respondents who worked in “Three or less-star” hotels viewed the “Adaptive skill” competency less important than the respondents who worked in “Four star”, and “Five star” hotels while the respondents who worked in “Five star” hotels rated the “Adaptive skill” competency more important than the respondents who worked in “Four star” hotels. Table 3.42 Multiple Comparisons on Impact of the Hotel Rating on the “Adaptive Skill” Factor
Hotel rating N Mean SD Letter*Three or less-star 157 3.2420 0.7439 a Four star 121 3.4669 0.8702 c Five star 267 3.7472 0.9382 b Total 545 3.5394 0.8590
* Means with the same letter are not significantly different (at the 5% level), when “a” = “Three or less-star”, “b” = “Five star”, and “c” = “Four star”.
As seen in table 3.43, ANOVA results showed that
there were strongly significant differences between the hotel management demographics and all leadership competency factors (p<0.01). Then, further analysis was conducted, after multiple comparisons using LSD were calculated, the results were presented in table 3.44-3.51.

92
Table 3.43 The One-Way ANOVA on Impact of the Hotel Management Demographics on the Leadership Competency Factors
F-Test p-value F1: Empowerment 11.608 0.000* F2: Planning and Implementation 8.590 0.000* F3: Team building skill 13.769 0.000* F4: Communication skill 11.411 0.000* F5: Problem solving and self-development
4.593 0.011*
F6: Coaching skill 8.809 0.000* F7: Counseling skill 7.036 0.001* F8: Adaptive skill 9.868 0.000*
Remarks: 1) p-value = Level of statistically significant (2 tailed), 2) N = 545 The results in table 3.44 showed that the respondents who worked for “Independent hotel without affiliation” and “Domestic affiliated hotel” perceived “Empowerment” factor equally important while the respondents who worked for “Chain affiliated hotel” perceived “Empowerment” factor more important than the respondents who worked for “Independent hotel without affiliation” and “Domestic affiliated hotel”. Table 3.44 Multiple Comparisons on Impact of the Hotel Management Demographics on the “Empowerment” Factor
Hotel management demographics
N Mean SD Letter*
Independent hotel without affiliation
172 3.8581 0.6213 a
Domestic affiliated hotel 206 3.8748 0.6355 a

93
Chain affiliated hotel 167 4.1473 0.6208 b Total 545 3.9530 0.6386 * Means with the same letter are not significantly different (at the 5% level), when “a” = “Independent hotel without affiliation”, and “b” = “Chain affiliated hotel”.
The results in table 3.45 showed that the respondents who worked for “Independent hotel without affiliation” and “Domestic affiliated hotel” perceived “Planning and Implementation” factor equally important while the respondents who worked for “Chain affiliated hotel” perceived “Planning and Implementation” factor more important than the respondents who worked for “Independent hotel without affiliation” and “Domestic affiliated hotel”.
Table 3.45 Multiple Comparisons on Impact of the Hotel Management Demographics on the “Planning and Implementation” Factor
Hotel management demographics
N Mean SD Letter*
Independent hotel without affiliation
172 3.9033 0.6267 a
Domestic affiliated hotel 206 3.9970 0.5526 a Chain affiliated hotel 167 4.1617 0.5661 b Total 545 4.0179 0.5891 * Means with the same letter are not significantly different (at the 5% level), when “a” = “Independent hotel without affiliation”, and “b” = “Chain affiliated hotel”.
From table 3.46, the respondents who worked for “Independent hotel without affiliation” and “Domestic affiliated hotel” perceived “Team building skill” factor equally important while the respondents who worked for “Chain affiliated hotel” perceived “Team building skill” factor more important than the

94
respondents who worked for “Independent hotel without affiliation” and “Domestic affiliated hotel”. Table 3.46 Multiple Comparisons on Impact of the Hotel Management Demographics on the “Team Building Skill” Factor
Hotel management demographics
N Mean SD Letter*
Independent hotel without affiliation
172 3.8630 0.5427 a
Domestic affiliated hotel 206 3.9612 0.5291 a Chain affiliated hotel 167 4.1697 0.5813 b Total 545 3.9941 0.5626 * Means with the same letter are not significantly different (at the 5% level), when “a” = “Independent hotel without affiliation”, and “b” = “Chain affiliated hotel”.
The results in table 3.47 showed that the respondents who worked for “Chain affiliated hotel” perceived “Communication skill” factor more important than the respondents who worked for “Independent hotel without affiliation” and “Domestic affiliated hotel” while the respondents who work for “Domestic affiliated hotel” perceived “Communication skill” factor more important than the respondents who worked for “Independent hotel without affiliation” but less important than the respondents who worked for “Chain affiliated hotel”.
Table 3.47 Multiple Comparisons on Impact of the Hotel Management Demographics on the “Communication Skill” Factor
Hotel management demographics
N Mean SD Letter*
Independent hotel without affiliation
172 3.8081 0.6349 a

95
Domestic affiliated hotel 206 4.0352 0.6190 b Chain affiliated hotel 167 4.1108 0.5773 b Total 545 3.9867 0.6233 * Means with the same letter are not significantly different (at the 5% level), when “a” = “Independent hotel without affiliation”, and “b” = “Chain affiliated hotel”.
The results in table 3.48 showed that the respondents who worked for “Chain affiliated hotel” perceived “Problem solving and self-development” factor more important than the respondents who worked for “Independent hotel without affiliation”. Table 3.48 Multiple Comparisons on Impact of the Hotel Management Demographics on the “Problem solving and Self-development” Factor
Hotel management demographics
N Mean SD Letter*
Independent hotel without affiliation
172 3.9767 0.6619 a
Domestic affiliated hotel 206 4.0850 0.7011 ab Chain affiliated hotel 167 4.2066 0.7307 b Total 545 4.0881 0.7029 * Means with the same letter are not significantly different (at the 5% level), when “a” = “Independent hotel without affiliation”, and “b” = “Chain affiliated hotel”.
From table 3.49, the respondents who worked for
“Chain affiliated hotel” perceived “Coaching skill” factor more important than the respondents who worked for “Independent hotel without affiliation” and “Domestic affiliated hotel” while the respondents who worked for “Domestic affiliated hotel” perceived “Coaching skill” factor more important than the respondents who worked for “Independent hotel without affiliation” but less important than the respondents who worked for “Chain affiliated hotel”.

96
Table 3.49 Multiple Comparisons on Impact of the Hotel Management Demographics on the “Coaching Skill” Factor
Hotel management demographics
N Mean SD Letter*
Independent hotel without affiliation
172 3.8750 0.6435 a
Domestic affiliated hotel 206 4.0352 0.6200 b Chain affiliated hotel 167 4.1587 0.6101 b Total 545 4.0225 0.6335 * Means with the same letter are not significantly different (at the 5% level), when “a” = “Independent hotel without affiliation”, and “b” = “Chain affiliated hotel”.
Moreover, table 3.50 showed that the respondents who worked for “Independent hotel without affiliation” and “Domestic affiliated hotel” perceived “Counseling skill” factor equally important while the respondents who worked for “Chain affiliated hotel” perceived “Counseling skill” factor more important than the respondents who worked for “Independent hotel without affiliation” and “Domestic affiliated hotel”. Table 3.50 Multiple Comparisons on Impact of the Hotel Management Demographics on the “Counseling Skill” Factor
Hotel management demographics
N Mean SD Letter*
Independent hotel without affiliation
172 3.7151 0.8058 a
Domestic affiliated hotel 206 3.6869 0.7227 a Chain affiliated hotel 167 3.9611 0.7343 b Total 545 3.7798 0.7617 * Means with the same letter are not significantly different (at the 5% level), when “a” = “Independent hotel without affiliation”, and “b” = “Chain affiliated hotel”.

97
The results in table 3.51 showed that that the
respondents who worked for “Independent hotel without affiliation” and “Domestic affiliated hotel” perceived “Adaptive skill” factor equally important while the respondents who worked for “Chain affiliated hotel” perceived “Adaptive skill” factor more important than the respondents who worked for “Independent hotel without affiliation” and “Domestic affiliated hotel”. Table 3.51 Multiple Comparisons on Impact of the Hotel Management Demographics on the “Adaptive Skill” Factor
Hotel management demographics
N Mean SD Letter*
Independent hotel without affiliation
172 3.3721 0.9230 a
Domestic affiliated hotel 206 3.4927 0.8475 a Chain affiliated hotel 167 3.7695 0.7540 b Total 545 3.5394 0.8590 * Means with the same letter are not significantly different (at the 5% level), when “a” = “Independent hotel without affiliation”, and “b” = “Chain affiliated hotel”. 3.11 One-Way ANOVA on Impact of Respondents’
Demographic Characteristics and the Competency Factors
From the results in table 3.52, there were significant
differences between working experience in this hotel and the leadership competency factors; “Empowerment skill”, “Planning and Implementation”, “Team building skill”, “Communication skill” and “Coaching skill factors” (p<0.05).
Table 3.52 The One-Way ANOVA on Impact of the Working Experience in This Hotel on the Leadership Competency Factors

98
F Sig. F1: Empowerment 7.008 0.000* F2: Planning and Implementation 5.505 0.001* F3: Team building skill 4.280 0.005* F4: Communication skill 2.650 0.048* F5: Problem solving and self-development
1.693 0.167
F6: Coaching skill 2.874 0.036* F7: Counseling skill 1.938 0.122 F8: Leadership skill 1.860 0.135
Remarks: 1) p-value = Level of statistically significant (2 tailed), 2) N = 545 The result in table 3.53 showed that employees who had worked experience in this hotel for “5-7 years” perceived “Empowerment” factor more important than employees who had worked experience in this hotel for “Less than 2 years”, “2-4 years”, and “Over 7 years”. Table 3.53 Multiple Comparisons on Impact of the Working Experience in This Hotel on the “Empowerment” Factor Working experience in this
hotel N Mean SD Letter*
Less than 2 years 171 4.0082 0.6270 a

99
2-4 years 226 3.8597 0.6310 b 5-7 years 44 4.3114 0.4933 c Over 7 years 104 3.9135 0.6734 ab Total 545 3.9530 0.6386 * Means with the same letter are not significantly different (at the 5% level), when “a” = “Less than 2 years”, “b” = “2-4 years”, and “c” = “5-7 years”.
Tables 3.54 and 3.55 showed that employees who had worked experience in this hotel for “Less than 2 years”, “2-4 years”, and “Over 7 years” perceived “Planning and Implementation” and “Team building skill” factor equally important while employees who had worked experience in this hotel for “5-7 years” perceived these factors more important than employees who had worked experience in this hotel for “Less than 2 years”, “2-4 years”, and “Over 7 years”.
Table 3.54 Multiple Comparisons on Impact of the Working Experience in This Hotel on the “Planning and Implementation” Factor
Working experience in this hotel
N Mean SD Letter*
Less than 2 years 171 4.0227 0.6360 a 2-4 years 226 3.9779 0.5444 a 5-7 years 44 4.3494 0.5348 b Over 7 years 104 3.9567 0.5865 a Total 545 4.0179 0.5891 * Means with the same letter are not significantly different (at the 5% level), when “a” = “Less than 2 years”, and “b” = “5-7 years”. Table 3.55 Multiple Comparisons on Impact of the Working Experience in This Hotel on the “Team Building Skill” Factor
Working experience in this hotel
N Mean SD Letter*
Less than 2 years 171 4.0227 0.5293 a

100
2-4 years 226 3.9735 0.5499 a 5-7 years 44 4.2374 0.5679 b Over 7 years 104 3.8889 0.6125 a Total 545 3.9941 0.5626 * Means with the same letter are not significantly different (at the 5% level), when “a” = “Less than 2 years”, and “b” = “5-7 years”. Tables 3.56 and 3.57 showed that employees who had worked experience in this hotel for “Less than 2 years”, “2-4 years”, and “Over 7 years” perceived “Communication skill” and “Coaching skill” factor equally important while employees who had worked experience in this hotel for “5-7 years” perceived these factors more important than employees who had worked in this hotel for “Less than 2 years”, “2-4 years”, and “Over 7 years”. Table 3.56 Multiple Comparisons on Impact of the Working Experience in This Hotel on the “Communication Skill” Factor
Working experience in this hotel
N Mean SD Letter*
Less than 2 years 171 3.9883 0.6242 a 2-4 years 226 3.9580 0.6123 a 5-7 years 44 4.2330 0.5126 b Over 7 years 104 3.9423 0.6712 a Total 545 3.9867 0.6233 * Means with the same letter are not significantly different (at the 5% level), when “a” = “Less than 2 years”, and “b” = “5-7 years”. Table 3.57 Multiple Comparisons on Impact of the Working Experience in This Hotel on the “Coaching Skill” Factor

101
Working experience in this hotel
N Mean SD Letter*
Less than 2 years 171 4.0424 0.6033 a 2-4 years 226 3.9668 0.6638 a 5-7 years 44 4.2670 0.5588 b Over 7 years 104 4.0072 0.6265 a Total 545 4.0225 0.6335 * Means with the same letter are not significantly different (at the 5% level), when “a” = “Less than 2 years”, and “b” = “5-7 years”. In term of experience in the industry, table 3.58 showed that there were no significant differences between working experience in the hotel industry and the leadership competency factors included “Planning and Implementation”, “Team building skill”, “Communication skill”, “Problem solving and self-development skill”, “Coaching skill”, “Counseling skill”, “Adaptive skill” factors. However, there was significant difference between working experience in the hotel industry and “Empowerment skill” factor (p<0.05). Table 3.58 The One-Way ANOVA on Impact of the Experience in the Hotel Industry on the Leadership Competency Factors
F-Test p-value F1: Empowerment 4.572 0.011* F2: Planning and Implementation 2.580 0.077 F3: Team building skill 0.606 0.546 F4: Communication skill 1.883 0.153 F5: Problem solving and self-development
2.427 0.089
F6: Coaching skill 0.740 0.477 F7: Counseling skill 0.913 0.402 F8: Adaptive skill 2.765 0.064
Remarks: 1) p-value = Level of statistically significant (2 tailed),

102
2) N = 545
From table 3.59, the results showed that employees who had experience in the hotel industry for “More than 10 years” perceived “Empowerment” factor more important than employees who had experience in the hotel industry for “Less than 5 years” while employees who had experience in the hotel industry for “6-10 years” and “More than 10 years” perceived “Empowerment” factor equally importance.
Table 3.59 Multiple Comparisons on Impact of the Experience in the Hotel Industry on the “Empowerment” Factor
Experience in the industry
N Mean SD Letter*
Less than 5 years 315 3.8829 0.6591 a 6-10 years 142 4.0451 0.5753 b More than 10 years
88 4.0557 0.6355 b
Total 545 3.9530 0.6386 * Means with the same letter are not significantly different (at the 5% level), when “a” = “Less than 5 years”, and “b” = “6-10 years”. Table 3.60 showed the ANOVA results of the impact of respondents’ age on the perception of the leadership competency factors. There were no significant differences between the respondents’ age and all leadership competency factors. Table 3.60 The One-Way ANOVA on Impact of the Respondents’ Age on the Leadership Competency Factors
F-Test p-value F1: Empowerment skill 0.575 0.632 F2: Planning and Implementation 0.943 0.420 F3: Team building skill 1.102 0.348

103
F4: Communication skill 0.786 0.502 F5: Problem solving and self-development skill
0.672 0.570
F6: Coaching skill 0.103 0.958 F7: Counseling skill 0.078 0.972 F8: Adaptive skill 1.505 0.212
Remarks: 1) p-value = Level of statistically significant (2 tailed), 2) N = 545 Conclusion of Hypotheses H1 Employees demographic characteristics do not have an impact on the hotel employee perceptions toward the organizational behavior. The results rejected this hypothesis because the independent sample t-test indicated that there was significant difference between the respondents’ gender and the perceptions toward the organization behaviors (Table 3.4). H2 Hotel characteristics do not have an impact on the hotel employee perceptions toward the organizational behavior. The results rejected this hypothesis. The independent sample t-test indicated that there was significant difference between type of hotel and the perceptions toward the organizational behavior (Table 3.8). H3 Employees demographic characteristics do not have an
impact on the hotel employee perceptions of leadership competencies.
The results rejected this hypothesis because the independent sample t-test and one way ANOVA indicated that there were significant differences between the respondents’ gender, education, position, working experience and industry experience and leadership competencies factors (Table 3.12, Table 3.13, Table 3.14, Table 3.52, and Table 3.58).

104
H4 Hotel characteristics do not have an impact on the hotel
employee perceptions of leadership competencies. The results rejected this hypothesis. The independent sample t-test and one way ANOVA indicated that there were significant differences between the number of employees in unit, type of hotel, hotel size, number of employees, hotel rating and hotel management demographics and leadership competencies factors (Table 3.15, Table 3.16, Table 3.17, Table 3.25, Table 3.34, and Table 3.43). This chapter indicated that leadership competencies in “Problem solving and self-development” was perceived the most important by the hotel employees, followed by “Coaching skill”, “Planning and Implementation”, “Team building skill”, “Communication skill”, “Empowerment”, “Counseling skill”, and “Adaptive skill”. However, the demographic characteristics in terms of the respondents’ gender had an impact on the perception of the organization behaviors while the hotel characteristics in terms of type of hotel had an impact on the perception of the organization behaviors. Moreover, the demographic characteristics in terms of the respondents’ gender, education, position, working experience and industry experience had an impact on the perception of leadership competencies. In addition, there were significant differences between hotel characteristics on leadership competencies in terms of number of employee in unit, type of hotel, hotel size, and number of employees, hotel rating and hotel management demographics. Demographic characteristics had an impact on leadership competencies, and hotel characteristics had an impact on leadership competencies. The conclusions, discussions,

105
recommendations, limitations and suggestions for further study will be presented in the next chapter.

94
CHAPTER 4 SUMMARY
This study aims to identify the key competencies needed for hotel managers to be success from the employee’s perceptive. This research is a quantitative study. A questionnaire was used to collect data. The questionnaire was created in English and translated into Thai in order to maximize the response rate and ensure the comprehension of questionnaire as the majority of the respondents were Thai. After finishing the design of the questionnaire, the pilot study was conducted with twenty hotel employees with the objective of improving the content comprehensibility and clarity of the questionnaire. The target population of this study was hotel employees. Convenience sampling method was applied in this study. The hotel employees were requested to complete the questionnaire. Finally, 545 completed questionnaires were returned for this study, representing a response rate of 69.87%.
The data from this study was analyzed using the SPSS program. Descriptive statistics were used in order to identify leadership competencies levels for the Phuket hotel managers. Factor analysis was applied as a data reduction or structure detection method. It was used to classify a large number of variables or detect structure in the relationships between variables and explained variability among observed leadership competencies variables in terms of fewer unobserved variables called factors. An independent sample t-test and one way ANOVA were used to examine the impact of hotel employees’ demographics on the perception towards leadership competencies and the way things are in hotel.
4.1 Conclusions
The demographic information of the respondents was 194 (35.6%) male and 351 (64.4%) female. In terms of the age

95
of respondents, 14.3% were below 25 years old, 62.6% were between 25-34 years old, and 23.2% were 35 years or older. In terms of an educational background; respondents had the following, 341 (62.6%) held a bachelors degree or above, while 204 (37.4%) held a school certificate or diploma. In terms of their position, 339 (62.2%) worked in front of house positions while 206 (37.8%) worked in back of house positions. It is obvious that the majority of the respondents worked for medium and large size hotels (39.9% worked for 100-300 room hotels and 34.9% worked for hotels with 300 rooms or more). Additionally, 49% of respondents worked in five-star hotels, 22.2% of respondents worked in four-star hotels, while 28.8% of respondents worked in three or less-star hotels. As for the number of employees in the hotels, it is obvious that the majority of respondents worked for hotels that hired 300 or more employees and 100-300 employees. (52.3% worked for hotels that hired 300 or more employees, 26.8% worked for hotels that hired 100-300 employees). In term of chain of the hotels, surprisingly, two groups were equally distributed, 30.6% of the respondents worked for international chain hotels with affiliation whereas 31.6% worked for independent hotels without affiliation, while 37.8% worked for Thai chain hotels with affiliation. However, 73.8% worked in resort hotels, while 26.2% worked in city hotels.
From the result of this study, in terms of the organizational behavior in Phuket hotels, the majority of Phuket hotels have an open door policy to their employees. Most of hotels gave the opportunities to their employees to express their opinions with their boss when in disagreement and the hotels had spelled out in detail clearly about job requirements and instruction to their employees. Moreover, the result also shown that managers in Phuket hotels try to decrease their social distance from their subordinates while hotel employees were encouraged to strive for continuously improved performance. Also, people in organization were generally concerned about

96
others. Most of the respondents perceived that managers encourage group loyalty even if individual goals suffer and employees felt loyalty to their hotels. However, employees were not sure whether they could tell about the disagreements to anyone that they want to tell. Therefore, Phuket hotel operators should encourage and create the good norms or values in the organizations. Moreover, hotel operators should improve the norm about the trust of their employees to let they know that they can tell every disagreement to everyone in their organization. Also, the managers of resort operators should improve on the norm of listen to their subordinates when they are in disagreement and they should try to decrease their social distance from less powerful people. In addition, hotel operators should create the activities for example providing the sport competition every year in order to increase the good relationship among departments and between the people in the organization and it also encourages the loyalty of the employees.
From the leadership competencies factors, the hotel
employees perceived that which leadership competency factors effect on their job performance and it also have an impact on their career development. The results of the study revealed the leadership competencies in “Problem solving and self-development” was rated highest by the hotel employees, followed by “Coaching skill”, “Planning and Implementation”, “Team building skill”, “Communication skill”, “Empowerment”, “Counseling skill”, and “Adaptive skill”. Leadership competencies were perceived significant difference among demographic characteristics (gender, educational background, position) and hotel characteristics (hotel sizes and type of hotel).
Based on the independent sample t-test results between the respondents’ demographic characteristics and competency factors, the results showed that there were statistically significant differences in gender, education, and

97
respondents’ positions. For the independent sample t-test between the hotel characteristic and competency factors, the result showed that there was significant difference in eight competency factors as follows: “Empowerment skill”, “Planning and Implementation”, “Team building skill”, “Communication skill”, “Problem solving and self-development skill”, “Coaching skill”, “Counseling skill” and “Adaptive skill” factors between resorts and city hotels. Moreover, there also was significant difference between the number of employees in a given unit and competency factors. Additionally, there were significant differences between hotel size and leadership competency factors included “Empowerment”, “Planning and Implementation”, “Team building skill”, “Communication skill”, “Problem solving and self-development skill”, and “Coaching skill” factors (p<0.05) . But there was no significant difference between hotel size and “Adaptive skill” factor. The respondents who worked in large size hotels perceived all of eight factors more important than the respondents who worked in small and medium size hotels. The study found that, in term of star rating, the “Four-star” and “Five-star” hotels perceived all of these competency factors more essential than “Three or less stars” hotels. In term of hotel management demographic, there were strong significant differences between the hotel management demographics and all leadership competency factors (p<0.01).
For the one-way ANOVA results in respondents’
demographic characteristics and competency factors, the respondents who worked in this hotel for more than 5 years had an impact on the competency factors while the respondents who had experience in the hotel industry for “More than 10 years” viewed “Empowerment” factor more important than the respondents who had experience in the hotel industry for “Less

98
than 5 years”. Finally, in terms of the impact of hotel employees’ age on the perception of the leadership competency factors. There were no significant differences between the hotel employees’ age and all leadership competency factors.
4.2 Discussions
The discussions are based on the research objectives.
The objectives of this research are: 1. To investigate the organizational behavior in
Phuket hotels. 2. To examine the impact of demographic
characteristic on the employee perceptions toward the organizational behavior.
3. To identify the key perceived leadership competencies for the Phuket hotel first line managers.
4. To investigate the impact of demographic characteristic on the employee perceptions toward leadership competencies.
This study had attempted to identify the key
perceived leadership competencies for the Phuket hotel first line managers from the hotel employee’s perspective. The study had also investigated the impact of demographic characteristic on the employee perceptions toward leadership competencies. The results of this study confirm previous research, especially Mariampolski (1980), Buergermeister (1983), Tas (1988), Hsu and Gregory (1995), Siu (1998), Jennings, Scalzi, Keane and Rodger III (2007).
This result supported the argument from Siu (1998) that communication was perceived as extremely important in the hotel industry, follow closely by the concern of customers, leadership competency, planning, team building, team membership, result orientation, efficiency, personal drive,

99
decision making and commercial concern respectively. Moreover, these top three competencies coincided with Buam (1991) who referred to those as “soft competencies”, since these attributes are related more to human relations than to hard managerial skills. Additionally, Tas (1988) affirmed that the important management competencies required by graduate trainees from American hotel managers perceptions were: (1) human-relations skills, (2) professional ethical standards, (3) diplomacy, and (4) effective oral and written communication skills. He also suggested full lists of competencies by classifying them into three categories such as essential, considerable important, and moderate important competencies. There were six essential competencies for hotel manager trainees that centered primarily on human-relations skills. These skills were managing guest problems, professional appearance and poise, effective communication, positive customer relations, and positives working relationships. On the other hand, Hogan (1989) conducted a survey with 77 hotel and restaurant companies in the U.S.A. and found that the hotel operators were interested in people skills such as human relations and service. Hsu and Gregory (1995) stated that the competencies needs for an entry level hospitality manager in Taiwan from the industry professional viewpoint and found that human-relations skills such as communication and leadership skills was perceived the most important and should receive extra recognition in the future. Moreover, Jennings, Scalzi, Keane and Rodger III (2007) identified the top 10 competencies. There were personal qualities, interpersonal skills, thinking skills, setting the vision, communicating, initiating change, developing people, health care knowledge (clinical, technical, as a business), management skills (e.g. planning, organizing) and business skills (e.g. finance, marketing). In addition, Buergermeister (1983) and Mariampolski (1980) found that technical and human skills are far more important than conceptual skills for the manager beginning their managerial career. These authors suggested that

100
restaurant management curricula should help students develop technical and human skills. In contract, this study found that competencies in “Problem solving and self-development” was considered to be the top competency necessary for success as a Phuket hotel manager by the hotel employees, followed by “Coaching skill”, “Planning and Implementation”, “Team building skill”, “Communication skill”, “Empowerment”, “Counseling skill”, and “Adaptive skill”. The study also found that, in terms of star rating, the “Five-star” hotels perceived competency in leadership more important than “Three stars or less” hotels. When considering the number of employees, the hotel which employed “Less than 100 employees” perceived “Empowerment” competency less important than the hotels that employed “300 or more employees”. In terms of the management competencies found in Gillbert and Guerrier (1997) study, the managers of the late 1990s had competencies in common with both the 1970s and the 1990s hotel managers. Additionally, the management styles and competencies are described by hospitality managers as having changed over the past 20 years as mentioned on table 1.9. Managers are described as being more consultative. On the other hand, Deery and Jago (2001) indicated the first ten competencies to compare with Gillbert and Guerrier’s findings. However, there were some missing competencies for the late 1990s manager: good communication skills and good people management skills. It was consistent with this study. “Communication skill” was rated less important competencies among eight leadership competencies. 4.3 Recommendations
The growth of the hospitality industry in Phuket had been rapid. Moreover, it has created a high demand for competent managers and poses a challenge to hospitality educators. Efforts need to be made to enhance hospitality

101
educators’ perspective of the industry’s needs and to design effective courses in the field of hospitality management accordingly. To have a significant on-going evaluation of hospitality curricula, there should be a substantial input form the hospitality industry on a regular basis. In addition to classroom lectures, the hospitality management programs should also include field experience that enables the student to develop the leadership competencies identified in this study. Problem solving and self-development should be extra recognition in the future. As previously mentioned, the Communication skill, Empowerment, Counseling skill, and Adaptive skill competencies were four elements that Phuket hotel managers have to improve. It is possible that greatly diversity in management experience would assist in breaking down these missing competencies. Even though the Phuket hotel managers have effort to change these missing skills in time, it will encourage the Phuket hotel managers be successful.
One of the key findings from this study is the increased desire from staff for hotel managers to provide decisive management. It is also important that staff have access to the decision-making processes through some level of empowerment. The executive of the hotel should continue to train its managers to improve their leadership competencies skills essential for success in all levels of managers identified by this study, but at the same time train staff to engage in the decision-making processes and gain some level of empowerment. Based on the top three competencies need for the Phuket hotel managers as ranked by the hotel employees, it is possible to develop the training and development programs for all levels of managers that emphasize on these essential leadership competencies. Since most of the hotels and resorts in this study were medium and large size hotels and all of 7 leadership competencies factors such as “Empowerment”, “Planning and Implementation”, “Team building skill”, “Communication skill”, “Problem solving and self-

102
development”, “Coaching skill”, and “Counseling skill” had impact on the employees perceptions. However, hotel operators should expand supervisor training by focusing on these leadership competencies factors in order to have sufficient qualifications. Moreover, hotel operators may obtain these leadership competencies in the recruiting new staff conditions and at the same time hotel operators should also provide training these leadership competencies to the old staff. Hotel operators must give clear guidance, emphasizing the importance of improving these leadership competencies. Good training programs will encourage employee to have better understanding in their knowledge and skills. Also, it can help employee to get more opportunities in their career development.
As Phuket is a world famous resort destination and most of the hotels in Phuket were resorts. The hotel industry has to face up to high competition. Also, service quality is a crucial to customer satisfaction and business success. Therefore, high competition in hotel industry means that hotel operators need to work hard to provide the good quality of services, products and compete with competitive tactic of high service quality and facilities and know how to be different from their competitors. Moreover, resort operators should pay more attention and invest more in developing and training the employees in terms of leadership competency because it affects to their service quality and their guest satisfaction. In general, the natures of guest’s use of services between resort and city hotels are so different. Most of guests in resorts are tourists who come for the purpose of leisure but, mostly the guests in city hotels come for the purpose of business meeting or group tours. Moreover, the used of service for city hotel guests are less than the used of resort guests. Therefore, resort operators should take responsibilities in providing efficiently service quality in order to satisfy the guests.
Company employees are the most important resource in any organization; satisfied employees are more likely to
103
provide quality service than unsatisfied employees. Therefore, manager should empower employee. However, before that action manager have to ensure that their employees have adequate abilities and competencies for this empowerment.
For the result of this study, employees who worked for front of house department perceived “Empowerment”, “Planning and Implementation”, “Problem solving and self-development”, “Coaching skill”, and “Counseling skill” leadership competencies factors less important than employees who worked for back of house department. Therefore, the training programs in hotel operators should emphasize these skills more.
Most of the training and development programs at the present focus more on the job skill of the employees in order to maximize the guest satisfaction only but, hotel operators should also emphasis on developing their career development programs in order to open the opportunities for the employees to get growth and to be the good future managers and ensure that the organizations have the competent employees. Moreover, hotel operators should adapt the training programs for their employees from the result of this study in term of leadership competencies. However, empowerment is one of the skills for managers nowadays, managers should empower their employees by getting them to take more responsibilities and this can also maximize employee’s satisfaction.
In addition, all hotel employees should be required to participate and share their opinions by themselves in such developmental training in order to develop the efficiency training program. In addition, managers should delegate to employees in order to ensure employee satisfaction and then they can provide better service quality to the customers. Moreover, employees should use in this criteria for developing efficiently on their career development in the operational system and it will help to reduce the employee turnover rate. However, senior managers should monitor the work performance of first

104
line managers every six months. Then, they can use this result for planning for the training program, recruiting process, monitor the work performance, human resource development and maximize the efficiently and reputation of organization. From the result in this study, the most appropriate leadership style for the hotel industry nowadays tend to be a transformational leadership and hotel operators should assess the hotel employees based on their competency.
In conclusion, hotel management must recognize the importance of providing appropriate and adequate training and development opportunities that will assist first line managers to improve their job performance. It is anticipated that such opportunities would in turn enhance the retention of quality managers who support the executive management in materializing company objectives. The provision of continuous should be accepted as standard managerial practice in the hotel industry. 4.4 Limitations and Suggestions for Further Study There were some limitations in this study: (1) the hotel employees who participated in this study might rate the important level of those 65 leadership competencies based on his/her experience instead of predicted future phenomenon. (2) Only 80 out of 314 hotels participated in this study. Data was collected from 80 hotels and it is represented only 25.48% of population. The way the human resource officers distributed questionnaires to their employees it might be bias. Moreover, the completed questionnaires may not be reflecting the fact and may not be confidence on the way of returning back to their human resource officers because the respondents did not returned the questionnaires directly to the researcher. (3) Due to the convenience sampling method, the results of this study are only a reflection of those respondents who participated in this survey. The representativeness and generalize ability of the findings are limited to the target population.

105
This study identified the leadership competencies necessary for success as the first line managers in Phuket hotels from the hotel employees’ view point. Once identified, the acquisition and use of those competencies must be examined to ensure maximum effectiveness. Accordingly, future research could investigate the leadership competencies necessary for success as a middle manager and top manager in Phuket. It is also interesting to investigate the difference of leadership competencies required for success among first line managers, middle managers, and top managers in the Phuket hotels. And because of this study was investigate leadership competencies for all hotels but it is interesting to investigate the essential competencies required by full service hotels in Phuket because upscale hotels may be require leadership competencies for success more or less than 3 or less star hotels. Moreover, it is interesting to identify the leadership competencies needs for five-star hotels in Phuket. It would be interesting to replicate this study every few years to assess whether changes in perception occur over time.

103
REFERENCES
Aggarwal, R. & Darzi, A. (2007). Competency-Based Training and Practice-What Does It Really Mean?. J Am Coll Surg, 205(1), 192-193.
Agut, S. (2000). Competency needs analysis in managers from tourism organizations. The role of training. Unpublished doctorate dissertation. Universitat Jaume I, Castellon, Spain.
Aguta, S., Graub, R., & Peiro’ J. M. (2003). Competency needs among managers from Spanish hotels and restaurants and their training demands. International Journal of Hospitality Management, 22, 281-295.
Ashley, R. A., Bach, S. A., Chesser, J. W., Ellis, E. T., Ford, R. C. S., LeBruto, M., Milman, A., Pizam, A., & Quain, W. J. (1995). A customer-based approach to hospitality education. The Cornell H.R.A. Quarterly, 36(4), 74-79.
Bach, S. A. & Milman, A. (1996). A novel technique of reviewing a hospitality management curriculum, Hotel and Tourism Educator, 8(1), 37-41.
Bangkokpost (2007). THAILAND’S HOTEL INDUSTRY: MORE ROOM FOR EXPANSION. Retrieved June 10, 2007, from http://www.bangkokpost.com/ tourismreview2006/27.html.
Barner, R. (2000). Fives steps to leadership competencies. Training and development, 54, 47-52.
Bartol, M. C., Martin, D. C., Tein, M., & Matthew, G. (1995). Management, A Pacific Rim Focus. McGraw-Hill, Roseville.
Bass, B. M. & Riggio, R. E. (1990). Transformational leadership: Learning to share the vision. Org Dynamics, 18, 19.
Bennis, W. G. & Nanus, B. (1985). Leaders: The strategies of Taking Charge. Harper & Row, NY.
Bennis, W. G. & Thomas, R. J. (2002). Crucibles of leadership.

104
Harv Bus Rev, 80(9), 39-45. Bitner, M. J., Booms, B. M., Tetreault, M. S., (1990). The
service encounter diagnosing favorable and unfavorable incidents. Journal of marketing. 53, 92-98.
Bordbeck, F. (2000). Cultural variation of leadership protypes across 22 European countries. Journal of Occupational Psychology, 73, 1-29.
Boyatzis, B. E. (1982). The Competent Manager: A Model for
Effective Performance. Wiley, New York. Boyatzis, R. E., Cowen, S. S., & Kolb, D. A. (1991). Curricular
innovation in higher education: The new weathered MBA program. The Magazine of the Graduate Management Admission Council, 8(1), 27-37.
Breiter, D. & Clements, C. J. (1995). Hospitality management curricula for the 21st century. Journal of Hospitality and Tourism Educator, 8(1), 57-60.
Buam, T. (1990). Competencies for Hotel Management: Industry Expectation of Education. International Journal of Contemporary Hospitality Management, 2(4), 13-16.
Buam, T. (1995). Managing Human Resources in the European Hospitality Industry: A Strategic Approach. Chapman & Hall, London.
Buergermeitser, J. (1983). Assessment of the educational skills and competencies needed by beginning hospitality managers. Hospitality Education and Research Journal, 8(1), 38-53.
Calhoun, J. G., Davidson, P.L., Sinioris, M. E., Vincent, E. T., & Griffith, J.R. (2002). Toward an understanding of competency identification and assessment in health care management. Qual Manag Health Care, 11(1), 14-38.
Caroline, R. E. (1992). A study to identify and analyze educational competencies relevant to doctoral studies in tourism. Doctoral Dissertation, The George Washington University.

105
Chirametakorn, R. (2000). Transformational Leadership and Women Leaders in Thailand. Ph.D. dissertation, Nova Southern University.
Christou, E. & Eaton, J. (2000). Management Competencies for Graduate Trainees. Annals of Tourism Research, 27(4), 1058-1061.
Chung, K. Y. (2000). Hotel management curriculum reform based on required competencies of hotel employees and career success in the hotel industry. Tourism Management, 21, 473-487.
Collins, J. (2001). Level 5 leadership. The triumph of humanity and fierce resolve. Harv Bus Rev, 79(1), 67-76.
Corning, S. P. (2002). Profiling and developing nursing leaders. J Nurs Adm, 32(7/8), 373-375.
Counte, M. A. & Newman, J. F. (2002). Competency-based health services management education: Contemporary issues and emerging challenges. J Health Adm Educ, 20(2), 113-122. De Ansorena, A. (1996). 15 steps for successful personnel
selection. Methods and tools. Deery, M. & Jago, L. (2001). Hotel management style: a study
of employee perceptions and preferences. International Journal of Hospitality Management, 20, 325-338.
Dingsdag, D. P., Biggs, H. C., & Sheahan V. L. (2007). Understanding and defining OH&S competency for construction site positions: Worker perceptions. SAFETY SCIENCE.
Doyle, K. (1992). Mastering motivation. Incentive, 166(3), 20-23.
Enz, C. A., Renaghan, L. M., & Geller, A. N. (1993). Graduate-level education: A survey of stakeholders. The Cornell H.R.A. Quarterly, 34(4), 90-95.
Fitzpatrick, J. J. (2004). Perspectives on leadership. A bold leadership style: Nothing will ever be accomplished if all obstacles must first be overcome!. Policy, Politics, & Nurs

106
Prac, 5(4), 223-236. Frank, E. (1991). The UK’s management charter initiative: the
first three years. J. Eur. Ind. Training, 15(6), 3-12. Gilbert, D. & Guerrier, Y. (1997). UK managers past and
present. The Services Industries Journal, 17, 133-154. Goldman, D. (1998). Working with emotional intelligence. Bantam Books, New York. Grau, R., Salanova, M., Agut, S., Llorens, S., & Martinez, I. M.
(2002). Training needs in managers from Spainish tourist organizations. Tourism and Hospitality Research, 3(3), 324-244.
Hair, J. F., Anderson, R. E., Tatham, R. L., & Black, W. C. (1998). Multivariate data analysis. Fifth Edition. Prentice-Hall, New Jersey.
Heifetz, R. A. & Laurie, D. L. (2003). Learning to lead: Real leaders say, “I don’t have the answer”. Ivey Business J, Jan/Feb, 1-7.
Hersey, P. & Blanchard, K. H. (1998). Management of organizational behavior. Prentice Hall, NJ.
Hobson, J. S. & Barrows, C. W. (1993). Service management: Does it have a place in the hospitality curriculum. The annual meeting of the council on hotel, restaurant, and institutional education, Chicago.
Hofmann, David A. & Morgeson, Frederick P. (1999). Safety-
related behavior as a social exchange: the role of perceived organizational support and leader-member exchange. Journal of Applied Psychology, 84(2), 286-296.
Hogan, J. J. (1989). What industry needs from academe. The Cornell Hotel and Restaurant Administration Quarterly, 30(3), 96-99.
Hsu, J. F. & Gregory, S. R. (1995). Developing future hotel managers in Taiwan: from an industry viewpoint. Hospitality Management, 14(3/4), 261-269.
Hughes, R.L., Ginnett, R.C., & Curphy, G.J. (1996). Leadership:

107
Enhancing the lessons of experience, 2nd ed. Irwin, Chicago.
Hwang, S. & Chang, T. (2003). Using data envelopment analysis to measure hotel managerial efficiency change in Taiwan. Tourism Management, 24(4), 357-369.
Intagliata. (2000). Levering leadership competencies to produce leadership brand: Creating distinctiveness by focusing on strategy and results. Human Resource Planning 23, Retrieved April21, 2002, from http://proquest.umi.com/pqdweb.
Jacobs, R. (1989). Getting the measure of management competence. Personnel Management, 21(6), 32-37.
Jennings, B. M., Scalzi, C. C., Rodgers III, J. D. & Keane, A. (2007). Differentiating nursing leadership and management competencies. Nursing Outlook, 55,169-175.
Kanungo, R. N. & Misra, S. (1992). Managerial resourcefulness: a reconceptualization of management skills. Human Relations, 45(12), 1311-1332.
Katz, R. L. (1955). Skills of an effective administrator. Harvard Business Review, 33(1), 33-42.
Kaufman, R. (1998). Strategic Thinking: A Guide to Identifying and Solving Problems (Revised). American Society for Training & Development and the International Society for Performance Improvement, Arlington, VA & Washington, DC.
Keiser, J. R. (1989). Principles and Practices of Management in the Hospitality Industry. Klemp, G. O. Jr. (Ed.). (1980). The Assessment of Occupational
Competencies Report to the National Institute of Education. Washington D.C.
Knutson, B. J. & Patton, M. E. (1992). How prepared am I to succeed in the hospitality industry? What the students are telling US. Hospitality and Tourism Educator, 4(3), 38-43.
Kouzes, J. M. & Posner, B. Z. (1995). The leadership Challenge. How to Keep Getting Extraordinary Things Done in
108
Organizations. Jossey-Bass, San Francisco. Levy-Leboyer, C. (1997). Competences Management.
Capellades, Spain. Lewis, R. C. (1993). Hospitality management education: Here
today gone tomorrow?. Hospitality Research Journal, 17(1), 273-283.
Lucia, A. D. & Lepsinger, R. (1999). The art and science of competency models: Pinpointing critical success factors in organizations. Jossey-Bass, San Francisco.
Mariampolski, A., Spears, M. C., & Vaden, A. G. (1980) What the restaurant manager needs to know: the consensus. The Cornell Hotel and Restaurant Administration Quarterly, 21(3), 77-81.
Martinez-Tur, V., Peiro, J. M., Ramos, J., (2001). Service quality and customer’ satisfaction. Sinthesis Psicologia, Madrid.
Mihalik, B. J. (1992). A strategy for integrating the computer into the hospitality and tourism curriculum. Hospitality and tourism Educatior, 4(2), 74-79.
Needly & Winstonm (1999). The Snowbrid Leadership Institute: Leadership development in the profession. College & Research Libraries, 60, 412-425.
O’Halloran, R. M. (1992). Tourism management profiles: implications for tourism education. F.I.U. Hospitality Review, 10(1), 83-91.
Okeiyi, E., Finley, D. & Postel, R. T. (1994). Food and beverage management competencies: Educator, industry, and student perspectives. Hospitality and Tourism Educator, 6(4), 37-40.
Perdue, J. M., Woods, R., & Ninemeier J. (2001). CORNELL HOTEL AND RESTA URANT ADMINISTRATION QUARTERLY, 60-65.
Phuket info.com Forums (2006). Statistics For Guest Arrivals At Hotels In Phuket, Phang Nga And Krabi increase well. Retrieved July 10, 2007, from http://www.phuket-

109
info.com/forums/news-articles/17036-statistics-guest-arrivals-hotels-phuket-phang-nga-krabi-increase-well.html.
Riggio, R. E. & Lee, J. (2007). Emotional and interpersonal competencies and leader development, Human Resource Management Review.
Samenfink, W. H. (1993). Adding ‘service efficiency’ to the nomenclature of the hospitality industry. The annual meeting of the council on hotel, restaurant, and institutional education, Chicago.
Sandwith, P. (1993). A hierarchy of management training requirements: The competency domain model. Public Personnel Management, 22(1), 43-62.
Sapienza, D. L. (1978). What university hotel students ought to
study: Opinions expressed by a selected group of Nevada hotel executives. Journal of Hospitality Education, 2(2), 11-16.
Scoble, K. B. & Russell, G. (2003). Profile of the future nurse leader. J Nurs Adm, 33(6), 324-330.
Shemwell, D. J., Yavas, U., Bilgin, Z., (1998). Customer-service relationships: an empirical test of a model of service quality: test of a causal model. Journal of Applied Psychology, 83, 150-163.
Siu, V. (1998). Managing by competencies-a study on the managerial competencies of hotel middle managers in Hong Kong. International Journal of Hospitality Management, 17, 253-273.
Spencer, L.M. & Spencer, S.M. (1993). Competence at Work. Wiley, New York.
Tas, R. (1988). Teaching Future Managers. The Cornell Hotel and Restaurant Administration Quarterly, 29(2), 41-43.
Tas, R. F. (1983). Competencies important for hotel manager trainees. Dissertation Abstracts Interantional, 45(03B), 841.

110
Tas, R. F. (1988). Teaching future managers. Cornell H.R.A. Quarterly, 29(2), 41-43.
Tas, R. F., Labrecque, S. V., & Clayton, H. R. (1996). Property management competencies for management trainees. Cornell H.R.A. Quarterly, 37(4), 90-96.
Thansettakij. (2008). The shortage of hotel employees in the next 3 years, 2382. Retrieved March 28, 2008, from http://www.thannews.th.com/detailNews.php? id= R3823213&issue=2382.
Thurstone. (1931). Psychological Review, 38(5), 406-427. Tourism Authority of Thailand (TAT). (2007). Accommodation
In Phuket. From: http://www.tourismthailand.org, http://www.tat.or.th
Tourism Authority of Thailand (TAT). (2007). Tourism Statistic. Retrieved August 3, 2007, from: http://www2.tat.or.th/stat/web/static_index.php.
Trivett, D. A. (1975). Competency programs in higher education, ASHEERIC higher education research report (7), American Association for Higher Education. Washington, DC.
Ulrich, D., Zenger, J., & Smallwood, N. (2000). The new leadership development. Training & Development, 54, 22-27.
Umbreit, W. T. (1992). In search of hospitality curriculum
relevance for the 1990s. Hospitality and Tourism Educator, 5(1), 71-74.
United Nations World Tourism Organization (UNWTO). (2006). International Tourist Arrivals. Retrieved August 1, 2007, from: http://www.unwto.org/index.php.
Van Dyke, T. & Strick, S. (1990). Recruitment, selection, and retention of managers in the hotel and restaurant industry. F.I.U. Hospitality Review, 8(1), 1-9.
Van Velsor, E. V., McCauley, C. D., & Moxley, R. S. (1998). Our view of leadership development. Jossey-Bass, San

111
Francisco. Walker, J. R. (2006). Introduction To Hospitality. Pearson Education. Ward, R., Brazier, A., & Lancaster, R. (2003). Different types of
supervision and the impact on safety in the chemical and allied industries. Northwich, HSE.
Westra, B. L. & Delaney, C. W. Nursing Outlook, 55, 210-211. Williams, II, J. & Winston, M. (2003). Leadership competencies
and the importance of research methods and statistical analysis in decision making and research and publication: A study of citation patterns. Library & Information Science Research, 25, 387-402.
Williams, P. W. & Hunter, M. (1991). Recruitment and retention insights for the hotel industry. F.I.U. Hospitality Review, 9(1), 51-58.
Woodruffe, C. (1991). Competent by any other name. Personnel Mgmt. 23(9), 30-33. Worsfold, P. (1989). Leadership and managerial effectiveness in
the hospitality industry. International Journal of Hospitality Management, 8(2), 145-155.
Yulk, G. & Van Fleet, D.D. (1992). Theory and research on leadership in organizations. In: Dunnette MD, Hough LM, Eds. Handbook of Industrial and Organizational Psychology, Consulting Psychological Press, CA.
Yulk, G. (2002). Leadership in organizations, Fifth Ed. Prentice Hall, NJ.

110
APPENDICES

111
APPENDIX A A cover Letter
เร่ือง ขอความอนุเคราะหใหนักศึกษาเก็บขอมูลเพ่ือประกอบการทําวิทยานิพนธ เรียน ผูจัดการฝายบุคคลโรงแรม ส่ิงที่แนบมาดวย แบบสอบถามจํานวน 10 ชุด ดวยนางสาวอุไรพรรณ สอเจริญ รหัสประจําตัวนักศึกษา 503010015 นักศึกษาในหลักสูตร บริหารธุรกิจมหาบัณฑิต สาขาการจัดการการบริการและการทองเที่ยว (หลักสูตรนานาชาติ) คณะการบริการและการทองเที่ยว มหาวิทยาลัยสงขลานครินทร วิทยาเขตภูเก็ต ไดลงทะเบียนรายวิชา 816-531 วิทยานิพนธ และไดเสนอหัวขอวิทยานิพนธเร่ือง “การประเมินความคิดเห็นของพนักงานโรงแรมตอสมรรถนะความเปนผูนําในจังหวัดภูเก็ต (Hotel Employee Perceptions towards First Line Managers’ Leadership Competencies in Phuket)” และนักศึกษารายดังกลาวมีความประสงคจะเก็บขอมูลเพ่ือประกอบการทําวิทยานิพนธ ในการนี้ หลักสูตรฯ จึงขอความอนุเคราะหมายังหนวยงานทานเพื่อใหนักศึกษาเขาไปเก็บขอมูลดังกลาว เพ่ือนํามาใชประโยชนในทางการศึกษาตอไป และหวังเปนอยางย่ิงวาจะไดรับความอนุเคราะห จากทาน จึงเรียนมาเพื่อโปรดใหความอนุเคราะหดังกลาวดวย จะขอบคุณย่ิง
ขอแสดงความนับถือ
(รองศาสตราจารยมนัส ชัยสวัสดิ์) ผูอํานวยการหลักสูตรบริหารธุรกิจมหาบัณฑิต
สาขาการจดัการการบริการและการทองเที่ยว (หลักสูตรนานาชาติ)

112
APPENDIX B Questionnaire (Thai Version)
แบบสอบถาม การประเมินความคิดเห็นของพนักงานโรงแรมตอสมรรถนะความเปนผูนําในจังหวัดภูเก็ต
งานวิจัยครั้งนี้ มีวัตถุประสงค เพ่ือศึกษาสมรรถนะความเปนผูนําที่สําคัญสําหรับผูจัดการ
โรงแรมในจังหวัดภูเก็ตจากมุมมองของพนักงานโรงแรมในฐานะผูใตบังคับบัญชา และวิเคราะหผลกระทบของปจจัยตางๆที่มีผลตอความคิดเห็นของพนักงานโรงแรมในภูเก็ต ขอมูลที่ไดจากการวิจัยครั้งนี้จะนํามาใชประโยชนเพ่ือเสนอแนวทางในการเสริมสรางและพัฒนาสมรรถนะผูนําที่เหมาะสมใหแกผูจัดการทุกระดับของโรงแรม และการศึกษาครั้งนี้ เปนสวนหนึ่งของการเรียนในระดับปริญญาโท สาขาการจัดการการบริการและการทองเที่ยว มหาวิทยาลัยสงขลานครินทร วิทยาเขตภูเก็ต ดังนั้นขอมูลของทานจะนําไปใชเพ่ือการศึกษาเทานั้น ดิฉันจึงใครขอความรวมมือในการตอบแบบสอบถามชุดนี้ และขอรับรองวาขอมูลของทานจะถูกเก็บเปนความลับ และไมอนุญาตใหใครนําขอมูลที่ไดไปใชเพ่ือวัตถุประสงคอ่ืนอีก ขอขอบคุณที่ใหความรวมมือ อุไรพรรณ สอเจริญ นักศึกษาปริญญาโท คณะการบริการและการทองเที่ยว มหาวิทยาลัยสงขลานครินทร วิทยาเขตภูเก็ต ___________________________________________________
______
ขอใหทานทําเครื่องหมาย (/) หนาขอที่ทานเลือก
เลขที่ ______

113
สวนที่ 1: ขอมูลสวนตัวของผูกรอกขอมูล 1. เพศ:
ชาย หญิง 2. อายุ:
นอยกวา 25 ป 25-34 ป 35-44 ป 45-54 ป 55-64 ป 65 ปข้ึนไป
3. การศึกษา: ระดับประถมศึกษา ระดับมธัยมศึกษาหรือประกาศนียบตัร ระดับปรญิญาตร ี ระดับปรญิญาโทหรือสูงกวา
4. ประสบการณการทํางานในอุตสาหกรรม: นอยกวา 5 ป 6-10 ป 11-15 ป 16-20 ป มากกวา 20 ป
5. ประสบการณการทํางานในโรงแรมนี้ นอยกวา 2 ป 2-4 ป 5-7 ป 8-10 ป มากกวา 10 ป
6. ตําแหนง: _______________________________. 7. แผนก: _________________________________. สวนที่ 2: ขอมูลเกี่ยวกับองคกร 1. ขนาดของโรงแรม:
นอยกวา 50 หอง 50-99 หอง 100-199 หอง 200-299 หอง 300-399 หอง 400-499 หอง 500 หองหรือมากกวา
2. โรงแรมทานเปนโรงแรม: หาดาว ส่ีดาว สามดาว นอยกวาสามดาว ไมมีการจดัอันดับ
3. จํานวนพนักงานของโรงแรม: นอยกวา 50 คน 50-99 คน 100-
199 คน 200-299 คน 300-399 คน 400-499 คน 500 คนขึ้นไป

114
4. โรงแรมของทานเปน: โรงแรมที่บริหารโดยอิสระ โรงแรมในเครือของคนไทย โรงแรมในเครือของตางประเทศ
5. ประเภทของโรงแรมทาน: โรงแรมรีสอรท โรงแรมในเมือง
สวนที่ 3: สมรรถนะความเปนผูนํา ในฐานะที่คุณเปนพนักงานโรงแรม คุณเห็นดวยหรือไมที่หัวหนางานของทานควรมีคุณสมบัติหรือลักษณะของผูนําตอไปนี้ โปรดประเมินโดยใชเกณฑดังตอไปนี ้ (1 = ไมเห็นดวยอยางย่ิง, 2 = ไมเห็นดวย, 3= ไมมีความเห็น, 4 = เห็นดวย และ 5 = เห็นดวยอยางย่ิง)
สมรรถนะความเปนผูนํา 1 2 3 4 51. คาดการณถึงอุปสรรคที่จะเกิดขึ้นในอนาคตและพฒันาแผนตางๆ เพ่ือ รองรับ
2. ปรับตัวใหเหมาะกับสภาพแวดลอมที่เปลี่ยนแปลง 3. จัดการเวลาใหเกิดประโยชน 4. บูรณาการแผนการทํางานระหวางแผนกหรือกลุมงาน 5. พิจารณาปจจัยตางๆ (ทัง้ภายนอก,ปจจัยภายในและแนวโนมใน อนาคต) เมื่อตองแกปญหาหรือตัดสนิใจ
6. รวบรวมและประสานแนวคิดที่แตกตางอยางสรางสรรค 7. ประยุกตใชความรูขามสายงานเพื่อนาํมาใชทําความเขาใจและแกปญหา ตางๆ
8. พัฒนาแผนการดาํเนินงานเพื่อตอบสนองความตองการของลูกคา 9. พิจารณาจดุด-ีจุดดอยของขอเสนอที่มีเพ่ือแกปญหาตางๆ 10. พัฒนาระบบและกระบวนการใหมๆ เพ่ือเพ่ิมประสิทธิภาพในการ ทํางาน
11. จัดการกบัความตองการที่หลากหลายและจัดลําดบั ความสําคญั 12. รูลักษณะของปญหาและกําหนดขอบเขตของปญหา 13. พิจารณาความตองการของลูกคาเมื่อตัดสนิใจในเรื่องตางๆ 14. ตัดสนิใจไดอยางเหมาะสมภายใตความกดดันดานเวลาและ
ทรัพยากรที่จํากัด
15. แสวงหาขอมูลสะทอนกลับ (feedback) จากผูอ่ืน

115
16. สรุปและทําความเขาใจอยางชัดเจนกบัสิ่งที่ผูอ่ืนพดูเพื่อให แนใจวาเขาใจถูกตอง
17. รับฟงผูอ่ืนโดยไมขัดจงัหวะ 18. ตั้งใจฟงขอมูลที่ผูอ่ืนสงใหอยางระมัดระวัง 19. เขียนไดอยางมีประสิทธิภาพ 20. รับฟงลูกคาโดยตรงอยางกระตือรือรนและทําเปนนิจสิน 21. พูดชัดเจนในสถานการณตางๆ 22. แสดงความไมเห็นดวยดวยความรูสึกเขาใจและเห็นใจ
สมรรถนะความเปนผูนํา 1 2 3 4 523. นําเสนอความคดิดวยทาทางที่เช่ือมั่นและนาเช่ือถือ 24. อธิบายความคาดหวังเก่ียวกับงาน บทบาทและความรับผิดชอบใหแก
พนักงาน
25. มอบหมายงานที่ทาทายใหผูใตบังคบับญัชาเพื่อสงเสริมการพัฒนา 26. สนับสนนุพนักงานใหใชความคดิริเร่ิมเพื่อแกปญหาแตเนิ่นๆ 27. เปดโอกาสใหผูใตบังคบับญัชาไดเปนผูนาํในสถานการณที่เหมาะสม 28. สรางแรงบันดาลใจและใหกําลังใจแกผูใตบังคบับญัชา 29. เตรียมความพรอมใหผูใตบังคบับญัชาเขาใจการเปลี่ยนแปลง 30. กําหนดและวางมาตรฐานคุณภาพสําหรับพนักงาน 31. มอบหมายอํานาจหนาที่ที่จําเปนใหแกพนักงานเพือ่ใหทํางานได
บรรลุวัตถุประสงค
32. ใหพนักงานไดมีสวนรวมในการตัดสนิใจที่มีผลกระทบตอพวกเขา 33. แจงลําดบัความสาํคัญของงานใหแกพนักงาน 34. ใหพนักงานรับรูขอมูลขาวสารที่เปนปจจุบนั 35. ทําใหพนักงานสนใจและเขารวมในกระบวนการเปลี่ยนแปลง 36. ทํางานอยางมีหลักการภายใตความเครียดและความกดดนั 37. เลือกรูปแบบผูนาํที่เหมาะสมที่สุดกบัสถานการณ 38. มองปญหาใหเปนโอกาส และความผิดพลาดใหเปนความกาวหนา 39. ปองกันขอมูลที่เปนความลับ 40. สรางเครือขายกับผูคนทั้งภายในและภายนอกโรงแรม 41. ใชเวลากับปญหาที่สําคญั ไมใชเพียงแคปญหาเรงดวน

116
42. จัดการอยางมีหลักการกับความลมเหลวและความผิดพลาดของตนเอง
43. เผชิญหนากับปญหาแตเนิ่นๆ กอนที่ปญหาจะทวคีวามรุนแรงจนไม สามารถจัดการได
44. มุงเนนการเรียนรูอยางตอเนื่องและการพัฒนาตนเอง 45. สงเสริมการคิดริเร่ิมสรางสรรคที่มีคุณภาพ 46. ทํางานโดยเนนการแกปญหาใหทุกฝายพอใจเมื่อมโีอกาส 47. พยายามลดความขดัแยงระหวางบุคคลหรือตอหัวขอตางๆ 48. ใหพนักงานสามารถเขาถึงขอมูลได 49. ปฏิบัตติอพนักงานอยางใหเกียรต ิ 50. อบรมพนักงานเพื่อการพัฒนาทักษะ
สมรรถนะความเปนผูนํา 1 2 3 4 551. ทํางานอยางเขาใจเหตผุลที่พนักงานตอตานการเปลี่ยนแปลงแทนที่จะ บังคบัใหพนักงานยอมรับการเปลี่ยนแปลง
52. แสดงความมั่นใจตอศกัยภาพในการทํางานของพนกังาน 53. เขาใจและนําความแตกตางของพนักงานแตละคนมาใชเพ่ือเพ่ิม ประสิทธภิาพในการทาํงาน
54. ใหขอมูลยอนกลับ (feedback) อยางมีหลักการ ตามเวลาและชัดเจน
55. จัดทํารูปแบบ (Model) การเปลี่ยนแปลงตามความคาดหวังของ พนักงาน
56. สงเสริมใหพนักงานแสดงความคดิเห็น แมจะเปนความคดิเห็นที่ ขัดแยง
57. ปรับเปลีย่นลักษณะผูนาํใหเหมาะสมกับบุคลิกของพนักงาน 58. ทํางานในฐานะสมาชิกของทีม 59. สนับสนนุความคดิใหมๆ และความคิดริเร่ิมสรางสรรค 60. นําวิธีการทํางานเปนทมีมาใชในการแกปญหาเมื่อเหมาะสม 61. สงเสริมการใหความเคารพและชื่นชมความหลากหลายและความ แตกตางของบุคคล
62. ปฏิบัติกับทุกคนอยางเสมอภาค

117
63. สงเสริมการทํางานเปนทีม พยายามลบลางความคิด "เรากับเขา" 64. ติดตามความกาวหนาของพนักงานและพยายามชีน้ําทางออมเมือ่ จาํเปน
65. พิจารณาหลักจรรยาบรรณกอนปฏิบตัิเสมอ สวนที่ 4: พฤติกรรมองคกร ดิฉันสนใจศึกษาวิธีการจัดการ การใหคุณคาและธรรมเนียมปฏิบัติของโรงแรมที่ทานทํางานในฐานะที่ทานเปนพนักงานของโรงแรม โปรดตอบแบบสอบถามโดยเติมในชองวางและวงกลมตัวเลขที่ใกลเคียงกับคําตอบของทานมากที่สุด 1. จํานวนพนักงานในแผนกของทาน ? __________________ 2. หัวหนาทานสงเสริมกลุม แมในบางครั้งตองแลกดวยการเสียสละประโยชนสวนตน ไมเห็นดวยอยางย่ิง ไมมีความเห็น เห็นดวยอยางย่ิง 1 2 3 4 5 3. ในแผนกที่ทานทํางาน ผูคนสวนใหญ: ไมสนใจใคร เปนหวงเปนใย เพ่ือนรวมงานมาก 1 2 3 4 5 4. ความคาดหวังของหัวหนาทานที่มีตอผูใตบังคับบัญชา เช่ือฟงหัวหนา ซักถามหัวหนาได อยางเครงครัด เมื่อความเห็นไม ตรงกนั 1 2 3 4 5 5. พนักงานที่น่ีไดรับการสงเสริมใหพยายามฟนฝาเพื่อปรับปรุงการทํางานใหดีขึ้นอยาง
ตอเน่ือง ไมเห็นดวยอยางย่ิง ไมมีความเห็น เห็นดวยอยางย่ิง 1 2 3 4 5

118
6. แผนกของทานมีการใหขอมูลเกี่ยวกับกฎเกณฑ และวิธีการทํางานอยางละเอียด ทําใหพนักงานทราบวาองคกรมีความคาดหวังอะไรตอการทํางานของตน
ไมเห็นดวยอยางย่ิง ไมมีความเห็น เห็นดวยอยางย่ิง 1 2 3 4 5 7. พนักงานในแผนกของทาน โดยสวนใหญมีความภักดีตอโรงแรม ไมเห็นดวยอยางย่ิง ไมมีความเห็น เห็นดวยอยางย่ิง 1 2 3 4 5 8. ผูจัดการ/หัวหนาแผนกของทาน: หางเหิน ใหความสนิทสนม กับผูใตบงัคับบญัชา กับผูใตบังคบับญัชา 1 2 3 4 5 9. หากเพื่อนรวมงานของทานมีความขัดแยงที่รุนแรงระหวางกัน ใครคือคนทีเ่ขาสามารถ
ปรึกษาได ไมมีใคร เฉพาะสมาชิกในกลุมเทานั้น ใครก็ไดทีเ่ขาอยากระบาย 1 2 3 4 5
ขอขอบพระคณุที่ทานสละเวลาและความตั้งใจในการใหขอมูลครั้งน้ี

119
APPENDIX C
Questionnaire (English Version)
QUESTIONNAIRE Hotel Employee Perceptions towards First Line Managers’
Leadership Competencies in Phuket
My thesis topic is “Hotel employee perceptions towards first line managers’ leadership competencies in Phuket”. The objectives of this study are to identify the key perceived leadership competencies for the Phuket hotel first line managers and to investigate the impact of demographic characteristic on the employee perceptions toward leadership competencies. The results will be useful for enhancing and improving leadership competencies to managers in hotels. This study is the part of my Master degree in Hospitality and Tourism Management Program.
The data collected in this survey will be used for academic purpose only. Please cooperate by answering the questions in the questionnaire. Your opinions will be kept completely confidential and will only be presented in summary form. Thank you very much for your cooperation. Miss Uraipan Socharoen MBA student Faculty of Hospitality and Tourism Prince of Songkla University, Phuket campus __________________________________________________
Please write down your answer or mark √ in the box which corresponds to your answer.
No._____

120
Part I: Respondent Demographics Information 1. Gender:
Male Female 2. Age:
Less than 25 25-34 35-44 45-54 55-64 65 or more
3. Education: School Certificate Diploma Undergraduate Postgraduate
4. Experience in the industry: Less than 5 years 6-10 11-15 16-20 Over 20 years
5. Working experience in this hotel Less than 2 years 2-4 5-7 8-10 Over 10 years
6. Your position is: ___________________________. 7. Your department is: ________________________. Part II: Organizational Information 1. Your hotel size:
Less than 50 rooms 50-99 rooms 100-199 rooms
200-299 rooms 300-399 rooms 400-499 rooms
500 or more 2. Your hotel rating:
Five-star Four-star Three-star
Two-star One-star 3. No. of employees in your hotel:
Less than 50 50-99 100-199 200-299 300-399 400-499 500 or more
4. Your hotel is:

121
Independent hotel without affiliation Chain (brand name) affiliated hotel
5. Your hotel is: Resort hotel City hotel
Part III: Leadership Competencies Please use the scale below to rate the behaviors or characteristics that describe how important that behavior or characteristic of your immediate supervisor. Using the following criteria (1 = strongly disagree, 2 = disagree, 3= neither agree nor disagree, 4 = agree, and 5 = strongly agree)
Leadership Competencies 1 2 3 4 51. Anticipates obstacles and develop plans 2. Adapts to changing circumstances 3. Manages time to ensure productivity 4. Integrates planning efforts across work groups or functional units
5. Considers a broad range of factors (internal, external, and
trends) when resolving problems and making decisions
6. Brings together different perspectives and approaches and
combines them in creative ways
7. Applies cross-functional knowledge to understand and solve problems
8. Develops action plans to meet customer needs
9. Considers alternatives before making decisions
10. Develops new systems or processes for increased efficiency
11. Handles multiple demands and competing

122
priorities 12. Identifies and defines problems 13. Considers customer needs when making decisions
14. Stays informed about industry practices and new developments
15. Seeks feedback from others 16. Summarizes and clarifies what people say to ensure understanding
17. Listens to people without interrupting 18. Listens carefully to input and concerns expressed by others
19. Writes in an effective manner 20. Actively and frequently listens directly to customers
21. Speaks clearly and articulately in a variety of situations
22. Expresses disagreement in a tactful and sensitive manner
Leadership Competencies 1 2 3 4 523. Presents ideas in a convincing manner 24. Clarifies expectations to staff members about assignments, roles, and responsibilities
25. Provides challenging assignments to facilitate development
26. Encourages employees to use their initiative to remedy problems when they first occur
27. Allow subordinates to lead under the appropriate circumstances
28. Inspires and motivates subordinates 29. Prepares subordinates to understand changes

123
30. Defines and sets up quality standards for employees
31. Gives others the authority necessary to accomplish their objectives
32. Involves employees in critical decisions that affect them
33. Defines priorities for the staff 34. Keeps employees updated with information 35. Gets employees interested and involved in the change process
36. Works effectively in ambiguous situations 37. Select leadership style most appropriate for the situation
38. Views problems as opportunities and mistakes as progress
39. Adjusts behavior in response to feedback and experience
40. Protects confidential information 41. Builds networks with people inside and outside the hotel
42. Spends time on the most important issues, not just the most urgent
43. Understands complex concepts and relationships
44. Confronts problems early before they become unmanageable
45. Pursues continual learning and self-development
46. Works toward win-win solutions with others whenever possible
47. Steers conflict away from personalities and toward issues
48. Provides employees access to information

124
49. Treats employees with respect 50. Coaches others in skill development
Leadership Competencies 1 2 3 4 551. Works to understand why employees resist
change instead of forcing employees to accept change
52. Accurately identifies strengths and weaknesses in employees
53. Expresses confidence in employees’ competence to do their jobs
54. Understands and harnesses individual differences to create a competitive advantage
55. Gives specific, timely, and constructive feedback
56. Encourages employees to express their views, even contrary ones
57. Adjusts leadership approach to fit other individuals
58. Works as a member of a team 59. Champions new ideas and initiatives 60. Employs a team approach to solve
problems when appropriate
61. Promotes respect and appreciation for diversity and individual differences
62. Treats people fairly 63. Promotes teamwork among groups;
discourages “us versus them” thinking
64. Monitors progress of employees and redirects efforts when necessary
65. Considers ethical implication prior to taking action

125
Part IV: Organizational Behavior I am interested in your beliefs about what the norms, values, and practices are in the organization in which you work as an employee. Please respond to the questions by filling in the blank and circling the number that most closely represents your observations about your workplace. 1. How many employees in your unit? ________________ 2. Managers encourage group loyalty even if individual goals suffer. Strongly Disagree neither agree nor disagree strongly agree 1 2 3 4 5 3. In your unit, people are generally: Not at all concerned very concerned about others about others 1 2 3 4 5 4. Subordinates are expected to: Obey their boss Question their without question boss when in disagreement 1 2 3 4 5 5. Employees are encouraged to strive for continuously
improved performance: Strongly Disagree neither agree nor disagree strongly agree

126
1 2 3 4 5 6. Job requirements and instruction are spelled out in detail
so I know what I am expected to do Strongly Disagree neither agree nor disagree strongly agree 1 2 3 4 5 7. I feel loyalty to the hotel Strongly Disagree neither agree nor disagree strongly agree 1 2 3 4 5 8. People in the positions of the power try to: Increase their social decrease their social distance from less distance from less powerful people powerful people 1 2 3 4 5 9. When people in this hotel have serious disagreement with each other, whom do they tell about the disagreements? No one Only other members anyone they of the work group want to tell 1 2 3 4 5
Thank you very much for your time and effort

127
APPENDIX D
List of 314 Hotels in Phuket by Tourism Authority of Thailand (TAT) in 2007
List the Name of Target Group by Location (Talang
District) Number Hotel Name
1 AIRPORT RESORT 2 AISAWAN 3 ALLAMANDA PHUKET 4 AMANPURI RESORT 5 AMORA BEACH RESORT PHUKET 6 ANCHAN RESORT&SPA 7 ANDAMAN BANGTAO BAY RESORT 8 ANDAMAN SEAVIEW RESORT 9 ANDAMAN WHITE BEACH RESORT
10 ARAHMAS RESORT&SPA PHUKET 11 AT PANTA PHUKET HOTEL 12 AYARA HILLTOPS PHUKET 13 BANGTAO VILLAGE RESORT 14 BANYAN TREE PHUKET 15 BEAUTIFUL SANDS RESORT 16 BEST WESTERN PREMIER BANGTAO
BEACH RESORT&SPA 17 BEST WESTERN PREMIER SUPALAI
RESORT&SPA 18 BLUE CANYON COUNTRY CLUB 19 BUNDARIKA RESORT SPA AND VILLA 20 CHANDARA RESORT&SPA 21 DUSIT LAGUNA RESORT&SPA 22 GARDEN COTTAGE 23 HYATT REGENCY PHUKET 24 INDIGO PEARL HOTEL PHUKET 25 JW MARRIOT PHUKET RESORT&SPA

128
26 KASALONG PHUKET RESORT 27 LAEM SAI GARDEN BEACH RESORT
Number Hotel Name 28 LAGUNA BEACH RESORT 29 LAGUNA HOLIDAY CLUB PHUKET
RESORT 30 LAYAN BEACH RESORT&SPA VILLAGE 31 MANATHAI RESORT 32 MISSIONHILLS PHUKET GOLF
RESORT&SPA 33 NAI YANG BEACH RESORT 34 NAITHON BEACH RESORT 35 NAITHONBURI BEACH RESORT PHUKET 36 PEN VILLA 37 PHUKET NATURE HOME RESORT 38 PHUKET PAVILLION 39 SALA PHUKET RESORT&SPA 40 SHERATON GRANDE LAGUNA BEACH
RESORT 41 SIX SENSES DESTINATION SPA PHUKET 42 SUNWING RESORT&SPA 43 SURIN BEACH RESORT 44 THE CHEDI PHUKET 45 THE GOLDDIGGER'S RESORT 47 TRISARA 48 TWINPALMS PHUKET
List the Name of Target Group by Location (Kathu District)
Number Hotel name 49 ABSOLUTE SEA PEARL BEACH RESORT 50 ALOHA VILLA 51 AMARI CORAL BEACH RESORT 52 ANDAMAN BEACH SUITE 53 ANDAMAN HILL HOTEL 54 ANDAMAN ORCHID HOTEL

129
55 ANDAMAN RESORTEL 56 ANDAMAN VILLA
Number Hotel name 57 ANDATEL PATONG PHUKET 58 APK RESORT 59 AQUAMARINE RESORT&VILLA 60 ARIMARA HOTEL 61 AVANTIKA BOUTIQUE HOTEL 62 AZZURRO VILLAGE 63 BAAN BOA RESORT 64 BAAN LAIMAI BEACH RESORT 65 BAAN NERN SAI RESORT 66 BAAN NERNSAI RESORT 67 BAAN SUKOTHAI HOTEL&SPA 68 BAAN TON SAI GARDEN RESORT 69 BAAN YIN DEE BOUTIQUE RESORT 70 BANTHAI BEACH RESORT&SPA 71 BAUMANBURI HOTEL 72 BEL-AIRE RESORT PHUKET 73 BENJAMIN RESORT 74 BLUE OCEAN RESORT 75 BOUGAIN VILLA 76 BURASARI RESORT 77 C & N HOTEL 78 C & N RESORT&SPA 79 CLUB ANDAMAN BEACH 80 CLUB BAMBOO 81 CLUB ONE SEVEN 82 COCONUT VILLAGE RESORT 83 DEEVANA PATONG RESORT&SPA 84 DUANGJITT RESORT 85 EDEN BUNGALOW RESORT 86 EXPAT HOTEL 87 GREEN VIEW RESORT
Number Hotel name

130
88 HOLIDAY INN RESORT PHUKET 89 HORIZON PATONG BEACH RESORT&SPA90 HYTON LEELAVADEE PHUKET 91 HYTON MARINE HOTEL 92 IMPIANA PHUKET CABANA 93 K. HOTEL 94 KAMALA BAY GARDEN RESORT 95 KAMALA BAY TERRACE RESORT 96 KAMALA BEACH ESTATE 97 KAMALA BEACH HOTEL&RESORT 98 LA FLORA RESORT & SPA PATONG 99 LAYALINA HOTEL
100 LE TONG BEACH 101 LEELAWADEE BOUTIQUE HOTEL 102 MERCURE PATONG BEACH HOTEL 103 MERIN BEACH RESORT 104 MILLENNIUM RESORT PATONG PHUKET105 MONTANA GRAND PHUKET 106 NEPTUNA HOTEL 107 NERNTONG RESORT 108 NIPA VILLA 109 NIRVANA CLUB 110 NIRVANA TANA PATONG 111 NOVOTEL PHUKET RESORT 112 P.S. HOTEL 113 PARADISE RESORT HOTEL 114 PATONG BAY GARDEN RESORT 115 PATONG BAYSHORE HOTEL 116 PATONG BEACH HOTEL 117 PATONG BEACH LODGE PHUKET 118 PATONG CITY HOTEL
Number Hotel name 119 PATONG COTTAGE 120 PATONG GRAND CONDOTEL 121 PATONG GRAND VILLE

131
122 PATONG GREEN MOUTAIN HOTEL 123 PATONG INN HOTEL 124 PATONG LODGE HOTEL 125 PATONG MERIN HOTEL 126 PATONG PALACE HOTEL 127 PATONG PARAGON HOTEL 128 PATONG PEARL RESORTEL 129 PATONG PREMIER RESORT 130 PATONG RESORT HOTEL 131 PATONG SUN BEACH HOTEL 132 PATONG SWISS HOTEL 133 PATONG VILLA 134 PATONG VILLAGES SUITES 135 PHUKET GOLF RESORT 136 PHUKET GOLF VIEW 137 PHUKET GRACELAND RESORT&SPA 138 PHUKET GRAND TROPICANA 139 PHUKET PALACE 140 POPPA PALACE HOTEL 141 PRINT KAMALA RESORT 142 QUAILTY RESORT PATONG BEACH 143 RAMABURI RESORT 144 REGENT MANSION HOTEL 145 RESIDENCE KALIM BAY 146 ROYAL CROWN HOTEL 147 ROYAL PHAWADEE VILLAGE 148 ROYAL PLAM RESORTEL 149 SAFARI BEACH
Number Hotel name 150 SARATHAI RESORT 151 SEA SUN SAND RESORT 152 SEA VIEW PATONG HOTEL 153 SEAGULL CHINA CITY HOTEL 154 SEAGULL COTTAGE HOTEL 155 SIAM PLAM HOTEL

132
156 SMILE INN PATONG 157 SUNSET BEACH RESORT 158 SWISS PLAM BEACH 159 THAI KAMALA VILLAGE 160 THAN THIP VILLA 161 THARA PATONG BEACH RESORT 162 THAVORN BEACH VILLAGE&SPA 163 THE BEACH RESORTEL 164 THE BLUE MARINE RESORT&SPA 165 THE CLUB 166 THE DIMOND CLIFF RESORT&SPA 167 THE MINOTEL 168 THE NATURAL RESORT 169 THE ORCHID HOTEL KALIM BAY
PHUKET 170 THE PLAM VIEW RESORT 171 THE ROYAL PARADISE HOTEL 172 THIWARATRI RESORT&SPA PHUKET 173 TONY RESORT 174 TRITRANG BEACH RESORT 175 TROPICAL BUNGALOW HOTEL 176 VILLA ATCHARA 177 VISES PATONG HOTEL 178 WHITE SAND RESORTEL 179 ZUM SCHLAWIENER VIENNA BEACH
HOTEL
List the Name of Target Group by Location (Muang District)
Number Hotel name 180 999 HOTEL 181 ACCESS RESORT&SPA 182 ALINA PHUKET NALINA 183 ANDAMAN CANNACIA RESORT&SPA 184 ANDAMAN SEAVIEW HOTEL

133
185 ATLAS RESORT 186 BAAN KARON RESORT 187 BAAN KARONBURI RESORT 188 BAN KRATING PHUKET RESORT 189 BEST WESTERN OCEAN RESORT 190 BIG A RESORT 191 BOAT LAGOON RESORT 192 BOONDAREE BOUTIQUE RESORT 193 BUNGALOW RAYA RESORT 194 BY THE SEA KHOA-KHARD BEACH
PHUKET 195 C.S. RESORT 196 CAPE PANWA HOTEL 197 CC BLOOM 198 CENTARA KARON RESORT 199 CENTARA KARON VILLAGE HOTEL
PHUKET 200 CENTARA KATA RESORT 201 CLUB MEDITERRANE 202 CONRAD PHUKET RESORT&SPA 203 CORAL ISLAND RESORT 204 CRUISER ISLAND RESORT 205 CRYSTAL INN HOTEL 206 CRYSTRAL BEACH HOTEL 207 DAENG PLAZA HOTEL 208 DAMRONG HOTEL 209 DIAMOND COTTAGE RESORT&SPA
Number Hotel name 210 DIAMOND HILL 211 FRIENDSHIP BEACH RESORT 212 FULL MOON VILLAGE&RESORT 213 HILTON PHUKET ARCADIA
RESORT&SPA 214 HOLIDAY VILLAGE RESORT 215 HOMDUANG BELAIR PANWA

134
216 HORIZON KARON BEACH RESORT&SPA 217 IMPERIAL HOTEL1 218 IMPERIAL HOTEL2 219 IN ON THE BEACH 220 KARON BEACH RESORT 221 KARON PRINCESS HOTEL 222 KARON SEA SANDS RESORT& SPA 223 KARON SILVER RESORT 224 KARON VIEW RESORT 225 KARON WHALE RESORT PHUKET 226 KARONA RESORT&SPA 227 KATA BEACH RESORT 228 KATA BHURI HOTEL&BEACH RESORT 229 KATA DELIGHT VILLAS 230 KATA GARDEN RESORT 231 KATA LUCKY VILLA 232 KATA PLAM RESORT & SPA 233 KATA POOLSIDE RESORT 234 KATA SEA BREEZE RESORT 235 KATA SUN BEACH 236 KATA THANI PHUKET BEACH RESORT 237 KATA VIEW POINT RESORT 238 KATINA HOTEL 239 KITTIKORN HOTEL 240 KOH MAPHRAO RESORT
Number Hotel name 241 LE MERIDIEN PHUKET BEACH RESORT 242 MAITON ESTATE&RESORT 243 MALISA VILLA SUITES 244 MANORA HOTEL 245 MARINA PHUKET RESORT 246 METROPOLE PHUKET 247 MOM TRI’S BOATHOUSE PHUKET 248 MOM TRI’S VILLA ROYALE THE
GOURMET HOTEL

135
249 MOVENPICK RESORT&SPA KARON BEACH PHUKET
250 MYSTASIA RESORT 251 NAIHARN GARDEN RESORT&SPA 252 NAIHARN GREEN VALLEY RESORT 253 NAIHARN VILLA 254 NOVOTEL PANWA BEACH RESORT 255 ON ON HOTEL 256 ONNICHA HOTEL 257 ORCHIDACEA RESORT 258 P.P. VILLA 259 P.S.A HOTEL 260 PACIFIC CLUB&SPA 261 PEACH HILL HOTEL&RESORT 262 PEARL HOTEL 263 PENGMMIN HOTEL 264 PHUKET GARDEN HOTEL 265 PHUKET GREEN VALLEY RESORT 266 PHUKET I’ PAVILION PHUKET 267 PHUKET ISLAND VIEW 268 PHUKET MERLIN HOTEL 269 PHUKET MONTREE RESOTEL 270 PHUKET ORCHID RESORT 271 PHUKET RESOTEL
Number Hotel name 272 RAMADA RESORT 273 RASADA HOTEL 274 RATTANA BEACH HOTEL 275 RAWAI BEACH RESORT 276 RAYA FATHER RESORT 277 ROME PLACE HOTEL 278 ROYAL PHUKET CITY HOTEL 279 ROYAL PHUKET MARINA RESORT 280 SABANA RESORT 281 SAWASDEE VILLAGE

136
282 SERENE RESORT 283 SIAM HOTEL 284 SIAM PHUKET RESORT 285 SILVER HOTEL 286 SINTHAWEE HOTEL 287 SIRI HOTEL 288 SOUTH SEA KARON RESORT 289 SRI PANWA 290 SUGAR PLAM RESORT 291 SUKSABAI HOTEL 292 SUMMER HOTEL 293 THARA HOTEL 294 THAVORN GRAND PLAZA HOTEL 295 THAVORN HOTEL 296 THAVORN PALM BEACH RESORT 297 THE ASPASIA PHUKET 298 THE BAY HOTEL 299 THE EVASON PHUKET RESORT&SIX
SENSES SPA 300 THE FRONT VILLAGE 301 THE LITTLE MERMAID RESORT 302 THE MANGOSTEEN RESORT&SPA
Number Hotel name 303 THE OLD PHUKET 304 THE PHULIN RESORT PHUKET 305 THE RACHA 306 THE ROYAL PHUKET YACHT CLUB 307 THE SAND BOUTIQUE RESORT 308 THE VIJITT RESORT HOTEL PHUKET 309 THE VILLAGE RESORT&SPA 310 THE WATERFRONT PHUKET 311 TROPICAL GARDEN RESORT 312 VERSAILLES HOTEL 314 WORABURI PHUKET RESORT&SPA

137
APPENDIX E List of Participated Hotels in Phuket
List the Name of Participated Hotels by Location (Talang
District) Number Hotel Name
1 AMANPURI RESORT 2 AYARA HILLTOPS PHUKET 3 BANYAN TREE PHUKET 4 BLUE CANYON COUNTRY CLUB 5 BUNDARIKA RESORT SPA AND VILLA 6 DUSIT LAGUNA RESORT&SPA 7 INDIGO PEARL HOTEL PHUKET 8 JW MARRIOT PHUKET RESORT&SPA 9 LAGUNA BEACH RESORT
10 LAGUNA HOLIDAY CLUB PHUKET RESORT
11 SALA PHUKET RESORT&SPA 12 SHERATON GRANDE LAGUNA BEACH
RESORT 13 SIX SENSES DESTINATION SPA PHUKET 14 THE CHEDI PHUKET 15 TRISARA 16 TWINPALMS PHUKET
List the Name of Participated Hotels by Location (Kathu
District) Number Hotel Name
17 ALOHA VILLA 18 AMARI CORAL BEACH RESORT 19 ANDAMAN BEACH SUITE 20 ANDATEL PATONG PHUKET 21 AQUAMARINE RESORT&VILLA

138
22 BAAN YIN DEE BOUTIQUE RESORT 23 BAUMANBURI HOTEL 24 BEL-AIRE RESORT PHUKET
Number Hotel Name 25 BURASARI RESORT 26 C & N HOTEL 27 CLUB ANDAMAN BEACH 28 CLUB BAMBOO 29 COCONUT VILLAGE RESORT 30 DEEVANA PATONG RESORT&SPA 31 DUANGJITT RESORT 32 EXPAT HOTEL 33 HOLIDAY INN RESORT PHUKET 34 HORIZON PATONG BEACH
RESORT&SPA 35 LA FLORA RESORT & SPA PATONG 36 MERCURE PATONG BEACH HOTEL 37 MERIN BEACH RESORT 38 MILLENNIUM RESORT PATONG PHUKET 39 NOVOTEL PHUKET RESORT 40 P.S. HOTEL 41 PATONG MERIN HOTEL 42 PATONG PARAGON HOTEL 43 PATONG RESORT HOTEL 44 PHUKET GRACELAND RESORT&SPA 45 POPPA PALACE HOTEL 46 ROYAL PLAM RESORTEL 47 THARA PATONG BEACH RESORT 48 THE BLUE MARINE RESORT&SPA 49 THE DIMOND CLIFF RESORT&SPA 50 THE ROYAL PARADISE HOTEL 51 TROPICAL BUNGALOW HOTEL

139
List the Name of Participated Hotels by Location (Muang District)
Number Hotel Name 52 BOAT LAGOON RESORT 53 C.S. RESORT 54 CAPE PANWA HOTEL 55 CENTARA KARON RESORT 56 DAENG PLAZA HOTEL 57 HILTON PHUKET ARCADIA
RESORT&SPA 58 I’ PAVILION PHUKET 59 IMPERIAL HOTEL1 60 KATA BEACH RESORT 61 KATA PLAM RESORT & SPA 62 KATA THANI PHUKET BEACH RESORT 63 LE MERIDIEN PHUKET BEACH RESORT 64 MALISA VILLA SUITES 65 MANORA HOTEL 66 METROPOLE PHUKET 67 PEARL HOTEL 68 PHUKET GARDEN HOTEL 69 PHUKET MERLIN HOTEL 70 PHUKET MONTREE RESOTEL 71 ROME PLACE HOTEL 72 ROYAL PHUKET CITY HOTEL 73 ROYAL PHUKET MARINA RESORT 74 SINTHAWEE HOTEL 75 SIRI HOTEL 76 SRI PANWA 77 SUGAR PLAM RESORT 78 THE EVASON PHUKET RESORT&SIX
SENSES SPA 79 THE VIJITT RESORT HOTEL PHUKET 80 TROPICAL GARDEN RESORT

138
VITAE
Name Miss Uraipan Socharoen Student ID 5030120015 Educational Attainment Degree Name of Institution Year of
Graduation Bachelor of Business Prince of Songkla University
2007 Administration (Phuket Campus) (Hotel Management) Work- Position and Address 99 Patipat Road, Muang, Phuket, Thailand 83000 Tel: 0-7622-4770 Mobile: 089-7278233, 085-8822422 Email: [email protected] List of Publication and Proceeding Socharoen, Uraipan and Naree Weerakit (2009). Hotel
Employee Perceptions towards First Line Managers’ Leadership Competencies in Phuket. The Eighth Asia Pacific Forum for Graduate Students’ Research in Tourism, July 7-9, 2009, Seoul, Korea.