hot beverages in kenya and east africa final... · 8 euromonitor international for the trade for...
TRANSCRIPT

This report was produced by Euromonitor International for the Trade for Development Centre of the Belgian development agency. The information in this report includes research estimates based on publically available sources, consumer and trade surveys and modelling. The bases and assumptions for the projections assume a stable social and economic environment and outlook in the relevant countries and assume there will not be any external shocks. All source material is therefore provided without any warranties or representations and any reliance on such material is made at users’ own risk. Excerpts from this report can be used on condition that their source and author are identified.
HOT BEVERAGES IN KENYA AND EAST AFRICAOpportunities for Fairtrade Certified Tea, Coffee and Powdered Hot Drinks Brands
A custom report compiled by Euromonitor International forTrade for Development Centre of the Belgian Development Agency
Fairtrade Africa
June 2017

Table of Contents
INTRODUCTION 3
EXECUTIVE SUMMARY 6
TEA, COFFEE AND COCOA SECTORS IN EAST AFRICA 18
MARKET SIZE & CHARACTERISTICS 35
FOCUSING ON KENYA: MARKET ANALYSIS
CONSUMERS
41
53
ASSESSMENT OF FAIRTRADE CERTIFICATION 65
ABOUT EUROMONITOR 72

Euromonitor International for the Trade for Development Centre
INTRODUCTION

4
Euromonitor International for the Trade for Development Centre
Project background, objectives and scope
INTRODUCTION / EXECUTIVE SUMMARY / SECTORS / MARKET SIZE / KENYA / CONSUMERS / FAIRTRADE / ABOUT EUROMONITOR
PROJECT BACKGROUND AND OBJECTIVES
Project background
The Trade for Development Centre (TDC) of the Belgian Development Agency and
Fairtrade Africa partnered with Euromonitor International to better understand the
hot beverages market, focussing on tea, coffee and powdered hot drinks sold
through both B2B (foodservice and institutions) and B2C (retail) channels, and the
potential commercial opportunity for Fairtrade certified tea, coffee and cocoa
brands in Kenya and the wider region.
Research objectives
Build market size and brand shares for tea, coffee and cocoa in Kenya for consumers,
foodservice and businesses or institutions.
Identify and understand the demands and trends in the hot beverage market in
Kenya, Uganda, Burundi, Tanzania and Rwanda.
Understand the local and regional trade supply chains for tea, coffee and cocoa in
East Africa.
Provide insights on consumer lifestyles, attitudes, preferences and purchasing
behaviour for tea, coffee and powdered hot drinks in Kenya.
Identify business preferences, trends and purchasing behaviour for tea, coffee and
cocoa in Kenya, including corporate offices, public institutions, healthcare providers,
faith-based institutions, restaurants, cafes, hotels, catering companies, etc.
Category coverage
Hot Beverages:
Tea
Coffee
Powdered Hot Drinks
Channels:
B2C (retail)
B2B (foodservice and institutions)
Country coverage
Uganda
Rwanda
Burundi
Tanzania
Kenya

5
Euromonitor International for the Trade for Development Centre
Euromonitor approach PROJECT RESEARCH METHODOLOGY
Desk research, analysis of internal Euromonitor Passport’s databases and discussions with in-house experts about:
Country profiles;
Production, marketing and trade;
Hot beverages market;
Fairtrade certified brands.
Data from the Euromonitor Passport’s databases and secondary sources were used to build a portrait of the tea, coffee and cocoa supply chains.
Initial estimated market size of tea, coffee and powdered hot drinks calculated based on Euromonitor’s Passport databases.
19 store audits were carried out in selected retail stores in Nairobi to collect data on product offer as well as Fairtrade certified brands and conduct interviews with staff.
501 online consumer surveys targeting tea, coffee and powdered hot beverages drinkers in Kenya who spend a minimum of KSh1,000 (US$10) per week or KSh5,000 (US$50) on groceries per month.
Up to 80 pulse interviews amongst institutional customers and foodservice providers in Kenya to determine the current demand for tea, coffee and chocolate-based hot beverages, procurement processes and key factors influencing purchase.
Up to 15 in-depth trade interviewswith key industry players in Kenya and Tanzania, e.g. government agencies, trade associations and brand owners.
Alignment of insights provided by different sources on the hot beverages market and Fairtrade certified brands. Quantitative and qualitative data cross-check, validation and finalisation:
Triangulation of all data to validate market size, trends, drivers, barriers, etc.;
Analysis and cross-check of consumer behaviour, attributes important to consumers when purchasing hot beverages, levels of awareness regarding Fairtrade certified brands, etc.
Putting together all research findings and building final Word and PowerPoint report.
INTRODUCTION / EXECUTIVE SUMMARY / SECTORS / MARKET SIZE / KENYA / CONSUMERS / FAIRTRADE / ABOUT EUROMONITOR
Analysis, validation and reporting
Field research, including store audits, consumer survey and interviews
Secondary research and analysis of internal Euromonitor data

Euromonitor International for the Trade for Development Centre
EXECUTIVE SUMMARY

7
Euromonitor International for the Trade for Development Centre
East Africa is a populous region with a burgeoning youth culture influencing market dynamics as disposable incomes improveand family size continues to contract. Tanzania has the largest population at 55 million, followed by Kenya with 47 million andUganda with 40 million. Both Burundi and Rwanda have under 12 million population but Burundi, in particular has a very lowGDP per capita, one sixth of Kenya’s, the country with the largest GDP per capita in the region. The populations are very young,for example, with 42% of Kenyans under 15 years of age. Immediate future potential is directly linked to the desires andconsumer behavior of teenagers and young adults particularly in the major cities of Kenya, Tanzania and Uganda.
East Africa is a mix of affluence and poverty even in major cities
East Africa population in 2015 GDP per capita in 2015 Median age of population
161.3 mn KSh90,060 17
EAST AFRICA OVERVIEWINTRODUCTION / EXECUTIVE SUMMARY / SECTORS / MARKET SIZE / KENYA / CONSUMERS / FAIRTRADE / ABOUT EUROMONITOR
Source: Euromonitor Passport Database

8
Euromonitor International for the Trade for Development Centre
EAST AFRICA OVERVIEWINTRODUCTION / EXECUTIVE SUMMARY / SECTORS / MARKET SIZE / KENYA / CONSUMERS / FAIRTRADE / ABOUT EUROMONITOR
Agriculture is an important engine of economic growth in East Africa
Source: Euromonitor International from national statisticsNote: * In Burundi, roughly 90% of the population dependent on subsistence agriculture.
Kenya
Agriculture’s Contribution to
GDP 2015
37%Employment in Agriculture 2015
17%
Tanzania
Agriculture’s Contribution to
GDP 2015
25%Employment in Agriculture 2015
73%
Burundi
Agriculture’s Contribution to
GDP 2015
40%Employment in Agriculture 2015*
90%
Agriculture remains the backbone of East African economies, but development varies between countries
Rwanda
Agriculture’s Contribution to
GDP 2015
32%Employment in Agriculture 2015*
87%
Uganda
Agriculture’s Contribution to
GDP 2015
17%Employment in Agriculture 2015*
23%
Kenya has a sophisticated, export-oriented agricultural sector for a number of crops, including tea and coffee. Farm outputis also a major earner of foreign exchange in Uganda, with coffee, tea and cotton being especially important. Meanwhile,higher levels of subsistence agriculture are observable in Tanzania, Burundi and Rwanda, which result in low crop yieldsand limit interest from foreign investors. The local impact of climate change and falling commodity prices constitutepotential downside risks for the regional agricultural sector.
9
Euromonitor International for the Trade for Development Centre
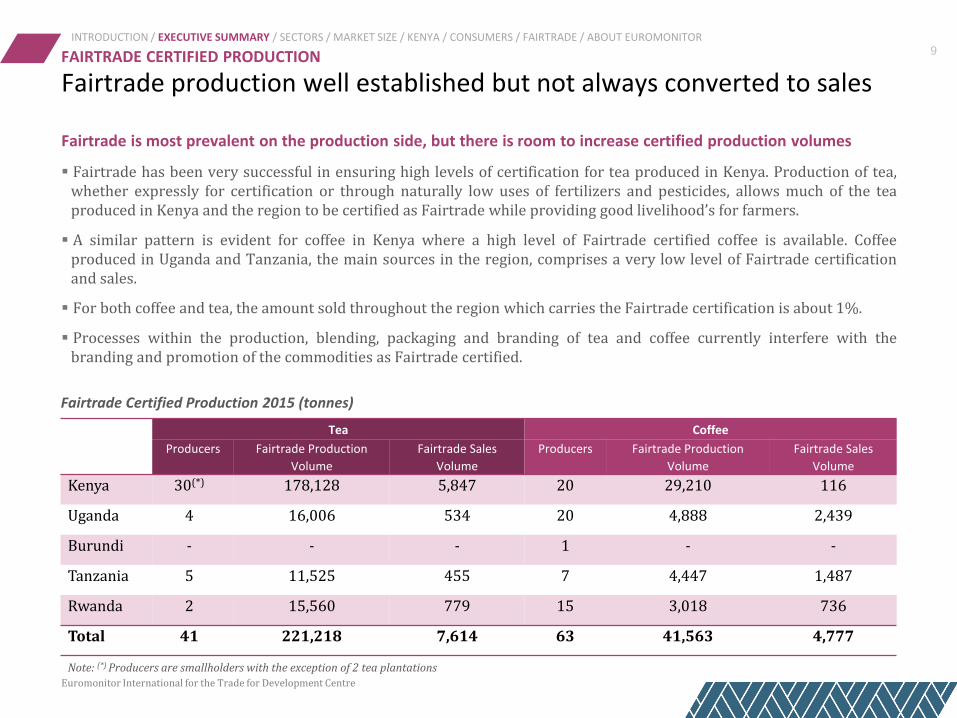
Fairtrade is most prevalent on the production side, but there is room to increase certified production volumes
Fairtrade has been very successful in ensuring high levels of certification for tea produced in Kenya. Production of tea,whether expressly for certification or through naturally low uses of fertilizers and pesticides, allows much of the teaproduced in Kenya and the region to be certified as Fairtrade while providing good livelihood’s for farmers.
A similar pattern is evident for coffee in Kenya where a high level of Fairtrade certified coffee is available. Coffeeproduced in Uganda and Tanzania, the main sources in the region, comprises a very low level of Fairtrade certificationand sales.
For both coffee and tea, the amount sold throughout the region which carries the Fairtrade certification is about 1%.
Processes within the production, blending, packaging and branding of tea and coffee currently interfere with thebranding and promotion of the commodities as Fairtrade certified.
FAIRTRADE CERTIFIED PRODUCTIONINTRODUCTION / EXECUTIVE SUMMARY / SECTORS / MARKET SIZE / KENYA / CONSUMERS / FAIRTRADE / ABOUT EUROMONITOR
Fairtrade production well established but not always converted to sales
Tea Coffee
Producers Fairtrade Production
Volume
Fairtrade Sales
Volume
Producers Fairtrade Production
Volume
Fairtrade Sales
Volume
Kenya 30(*) 178,128 5,847 20 29,210 116
Uganda 4 16,006 534 20 4,888 2,439
Burundi - - - 1 - -
Tanzania 5 11,525 455 7 4,447 1,487
Rwanda 2 15,560 779 15 3,018 736
Total 41 221,218 7,614 63 41,563 4,777
Note: (*) Producers are smallholders with the exception of 2 tea plantations
Fairtrade Certified Production 2015 (tonnes)

10
Euromonitor International for the Trade for Development Centre
FAIRTRADE CERTIFIED PRODUCTIONINTRODUCTION / EXECUTIVE SUMMARY / SECTORS / MARKET SIZE / KENYA / CONSUMERS / FAIRTRADE / ABOUT EUROMONITOR
High proportions of Fairtrade production in Kenya
Conventional Tea Production, Fairtrade Production and Fairtrade Production sold as Fairtrade Certified 2011, 2015
Kenya RwandaUganda Tanzania
76%
24%
95%
4% 1%
74%
25%
1%
55%
43%
2%
53%44%
3%
66%
33%
1%
88%
11%1% 30%
67%
3%
Conventional Tea Production Fairtrade Production Fairtrade Production sold as Fairtrade Certified
Conventional Coffee Production, Fairtrade Production and Fairtrade Production sold as Fairtrade Certified 2011, 2015
Kenya Uganda RwandaTanzania
90%
9% 1%36%
64%
99%
1%
98%
1%1%
89%
3%8%
82%
14%
4%
58%23%
19%
92%
5% 3%
Conventional Coffee Production Fairtrade Production Fairtrade Production sold as Fairtrade Certified
2015
2011
2015
2011
2015
2011
2015
2011
2015
2011
2015
2011
2015
2011
2015
2011

11
Euromonitor International for the Trade for Development Centre
1
2
3
Key challenges persist, inhibiting countries from achieving full potential
Unsustainable farming limits smallholders’ access to export markets
Although the cost of production for small-scale farmers is lower than for estates due to theirreliance on family labour, agricultural activities of smallholders are often less environmentally andsocially sustainable. This can create some difficulties in including these farmers in the exportmarket as big-name international companies such as Unilever Group and Nestlé require consistentand stable output meeting requisite sustainability standards.
Erratic weather due to climate change, poor information dissemination and lack of training onrecommended agronomical practices, crop diseases, limited access to credit, high cost of inputsparticularly fertilisers, and low farm gate prices are amongst the challenges faced by smallholders.
Besides a widespread sense of poor governance, cooperatives and management agencies, such asthe Kenya Tea Development Agency Holdings Ltd (KTDA), are also criticised for their reluctance orincapacity to ensure smallholders’ participation in their decision-making processes. This scenario,combined with limited information on market dynamics, has an adverse impact on theredistribution of the value added through the supply chain to the smallholder.
A number of technical and financial vulnerabilities
A general perception of mismanagement and corruption along the supply chain persists
KEY TEA, COFFEE AND COCOA SECTORS’ CHALLENGESINTRODUCTION / EXECUTIVE SUMMARY / SECTORS / MARKET SIZE / KENYA / CONSUMERS / FAIRTRADE / ABOUT EUROMONITOR

Euromonitor International for the Trade for Development Centre
Certification has been achieved but downstream activities need attention
12INTRODUCTION / EXECUTIVE SUMMARY / SECTORS / MARKET SIZE / KENYA / CONSUMERS / FAIRTRADE / ABOUT EUROMONITOR
Among smallholders and at estate level Fairtrade has been very successful in achieving a high level of certification of tea and coffee production in Kenya.
However, the level of certified coffee and tea production in other East African countries is substantially lower.
Fairtrade Production
A key feature of certified production is the large volume of sales into the non-Fairtrade market, especially for tea sold through Kenya. The certification premium is, therefore, lost.
This may arise either through indiscriminate blending, packaging and sales into the non-Fairtrade export market or may be because of a lack of demand in both the domestic and export market.
Demand management
551,911 tonnes of tea are produced in the region, 90% of which is exported.
The KTDA is the main trader of tea in the region.
It has a close relationship with the Fairtrade organisation and plays a pivotal role in the marketing of certified tea both domestically and in the export market.
Key relationships
Recommendation
Refocus efforts and exploit Kenyan achievements as an example in the promotion of Fairtrade certification in other East African countries.
Recommendation
Flexibility of Fairtrade certified supply allows for any growth in demand to be accommodated with a review of the blending and packaging process ensuring certified production is not lost indiscriminately
Recommendation
Core marketing concepts should be explored directly with the KTDA to agree base principles and marketing strategies for Fairtrade certified produce.
CONCLUSIONS & RECOMMENDATIONS

Euromonitor International for the Trade for Development Centre
Consumer understanding of Fairtrade requires education and stimulation
13INTRODUCTION / EXECUTIVE SUMMARY / SECTORS / MARKET SIZE / KENYA / CONSUMERS / FAIRTRADE / ABOUT EUROMONITOR
Taste, quality and value are the criteria by which domestic consumers select their tea, coffee and other hot drinks purchases.
The carrying of Fairtrade certification is not, currently, a key motivator for consumer purchase not is it widely explored in the domestic market.
Conversion of the consumer to ethical purchasing is required to stimulate sales of certified products.
Consumer conversion
Consumers need to be aware of the values of Fairtrade and its positive effects on local industry.
Awareness of Fairtrade values is very low in both consumer and foodservice surveys in Kenya although attitudes towards these values are highly supportive.
Education of young consumers through schools can be achieved through targeted and co-operative campaigns around key values.
Targeted education
The current market expression of Fairtrade points to a niche and non-premium positioning in East Africa.
In other markets, Fairtrade’s express purpose is to achieve a premium for redistribution among producers.
An opportunity to exploit premium positioning within the domestic market still offers potential.
Clarity of concept
Recommendation
Develop sensitisation campaigns as well as actively pursuing both domestic and international taste and quality awards for Fairtrade certified produce.
Recommendation
Develop educational campaigns for schools and the wider community to foster a greater understanding of Fairtrade values and community involvement.
Recommendation
Fairtrade marketing concepts should be discussed with producers, brand holders and all intermediary, creative and government agencies.
CONCLUSIONS & RECOMMENDATIONS

Euromonitor International for the Trade for Development Centre
Market is deprived of clear, consistent and prominent Fairtrade branding
14INTRODUCTION / EXECUTIVE SUMMARY / SECTORS / MARKET SIZE / KENYA / CONSUMERS / FAIRTRADE / ABOUT EUROMONITOR
Few domestic brands currently opt for Fairtrade certification on their products.
Their perception of the added value of this certification may not reflect the clear values and premium positioning promoted by the Fairtrade organisation.
Kericho Gold, in Kenya, is one example of a successful launch of a new variant of tea that carries the Fairtrade logo with a premium.
Brand inclusion
Highly competitive companies in Kenya, Uganda and Tanzania currently market multiple domestic and international brands of tea, coffees and other hot drinks.
These multi-brand companies offer potential for co-operative relationships and may have the ability to adapt their marketing strategies to include Fairtrade values and collateral.
Co-operative environment
Recommendation
Ensure that packers and manufacturers are motivated and fully understand the value of including Fairtrade certification in their branding and packaging.
Recommendation
Develop close relationships with competitive brands and find direct and indirect ways in which co-operative marketing can be achieved.
CONCLUSIONS & RECOMMENDATIONS
Manufacturers currently seek to differentiate their products through price differentials as well as packaging formats and sizes.
Speciality teas and coffees are now readily available in middle to upper retail and some foodservice outlets.
The inherent value of Fairtrade certification underpins differentiation in other countries but is rarely seen in this region.
Supporting differentiation
Recommendation
Fairtrade should develop close relationships with competitive brands releasing new products and ensure certification inclusion on new packaging.

Euromonitor International for the Trade for Development Centre
Active marketing tailored to local trends will support Fairtrade positioning
15INTRODUCTION / EXECUTIVE SUMMARY / SECTORS / MARKET SIZE / KENYA / CONSUMERS / FAIRTRADE / ABOUT EUROMONITOR
In Kenya, the largest regional tea producer, direct sales outside Mombasa Tea Auction are possible since 2016. In addition, the removal of 1% ad-valorem tax on tea will increase competitiveness.
This allows greater access to alternative sources of tea for small scale specialist packers and manufacturers who will have greater flexibility of distribution and packaging
Expanding access
Currently more than 50% of the regional population is 17 years or younger.
This key consumer group will have more disposable income to hand as it ages and enters the workforce.
Capturing their interest in hot drink products now will lay down a foundation for a life time of consumption.
Branding, with Fairtrade certification, is an opportunity.
Targeting young consumers
Recommendation
Identify opportunities among specialist tea packers and manufacturers to develop Fairtrade certified brands.
Recommendation
Build strong relationships with hot drinks marketing companies and agencies to encourage understanding and support for Fairtrade certification.
CONCLUSIONS & RECOMMENDATIONS
Expansion of private label production is emerging with tea and coffee ideal product lines for conversion to fast moving own label brands, offering an opportunity for Fairtrade to partner with private label
Supply is likely to be from local sources, many of whom may already be Fairtrade certified.
Pricing and premium positioning, if required by the Fairtrade organisation, should be considered in light of strategic marketing plans.
Private label
Recommendation
Discussions should be undertaken with suppliers and packers of private label on how best to position Fairtrade and its approach to the value chain alongside those of the private label brand

Euromonitor International for the Trade for Development Centre
Foodservice and tourism offer the greatest opportunity for advancement
16INTRODUCTION / EXECUTIVE SUMMARY / SECTORS / MARKET SIZE / KENYA / CONSUMERS / FAIRTRADE / ABOUT EUROMONITOR
Tourism continues to expand in East Africa with Kenya leading the way with almost 5 million visitors a year and employing more than one in ten Kenyans.
A strong presence and association of Kenya with Fairtrade products, especially hot drinks, is important to an international understanding of the values of Kenyan production.
Tourism Opportunities
The coffee shop revolution is emerging in the region with expansion of chained and fast food outlets and the development of beverage services in forecourts and retail outlets.
As sophistication increases, opportunities for fresh coffee will expand with the introduction of new tastes and flavours in high quality ground coffee and beans in both foodservice and retail.
Foodservice revolution
Corporate social responsibility programmes, especially among international companies operating in East Africa, offers an educational tool as well as a way of promoting Fairtrade among consumers.
A strategy of engaging with larger corporates and encouraging use of Fairtrade products will support better recognition of Fairtrade and association with positive values.
Social responsibility
Recommendation
Target leading hotels, resorts, attractions and transportation companies and ensure that Fairtrade products are stocked and promoted in all locations.
Recommendation
Directly address the extremely low awareness of Fairtrade values within the foodservice sector through promotion, tastings and closer contact with producers.
Recommendation
A strategic objective of linking buying Fairtrade and buying locally produced products should underlie overall marketing goals and concepts in East Africa
CONCLUSIONS & RECOMMENDATIONS

17
Euromonitor International for the Trade for Development Centre
Multiple stakeholders influence the impact of Fairtrade in different ways in the East African market
either by supporting growth of the understanding of Fairtrade principles amongst consumers and
stimulating purchase, or by controlling access to and limiting promotion of Fairtrade certified and
branded products.
FAIRTRADE STAKEHOLDERSINTRODUCTION / EXECUTIVE SUMMARY / SECTORS / MARKET SIZE / KENYA / CONSUMERS / FAIRTRADE / ABOUT EUROMONITOR
Targeting Fairtrade marketing at consumers
Institutions such as KTDA
Small packers & brands
Kericho Tea
Potential Impact High
Low
High
Cu
rren
t le
vel o
f A
war
enes
s/
En
gage
men
t w
ith
Fai
rtra
de
Low
A
B
C
E
F
D
AB
C
D
Multi-brand companies
E
Foodservice outletsF
Consumer
Government agencies
GG
Export agents/Overseas Buyer
H
Corporate buyersI
H
I
Levels of engagement versus impact

Euromonitor International for the Trade for Development Centre
TEA, COFFEE AND COCOA SECTORS IN EAST AFRICA

19
Euromonitor International for the Trade for Development Centre
In 2015, Kenya contributed over 80% of total regional tea supplies exported overseas and about 20% of global exports. As oneof the top five global tea producers, not surprisingly, the tea sector is listed as one of the pillars for realising Kenya’s Vision2030. Nonetheless, Kenya’s tea sector continues to face a myriad of challenges, including climate change, price manipulationand post-auction, private sale of withdrawn teas, amongst others.
Kenya plays a pivotal role in East African tea as a top global producer
Regional tea production (tonnes) 2015
Share of the region in global tea supplies 2015
Share of the region in global tea exports 2015
551,911 10.4% 30.7%
TEA SECTOR IN KENYA, UGANDA, BURUNDI, TANZANIA AND RWANDAINTRODUCTION / EXECUTIVE SUMMARY / SECTORS / MARKET SIZE / KENYA / CONSUMERS / FAIRTRADE / ABOUT EUROMONITOR
Source: Euromonitor International from FAOSTAT, International Tea Committee and UN Comtrade Database

20
Euromonitor International for the Trade for Development Centre
The other East African countries produced less than halfof Kenya’s output in tea in 2015, less than 55,000 tonneseach. Uganda has witnessed a significant increase in teaoutput since 2011, supported by encouraging morefarmers to embrace the crop and expand the cultivatedland under tea to new areas.
Tea production in Kenya slightly increased over the2011-2015 period, through a steady rise in cultivatedland and the adoption of high yielding clonal types of tea.However, 2015 saw weather-related shortfalls withoutput down by over 10%.
TEA SECTOR: PRODUCTION TRENDSINTRODUCTION / EXECUTIVE SUMMARY / SECTORS / MARKET SIZE / KENYA / CONSUMERS / FAIRTRADE / ABOUT EUROMONITOR
Tea crop volumes in the region show an increasing trend
Poor weather hit Kenya’s tea production in 2015 Tea Production 2015 (tonnes); CAGR 2011-15
Tea Growing Areas in East Africa
Positive intervention in Uganda’s tea sector is elevating output
399,211 54,500 42,200 33,900
22,100 1.4%
11.5%
0.8% 1.5%
-2.1%
Kenya Uganda Burundi Tanzania Rwanda
Kenya is the world’s third-biggest producer of tea after
China and India.
Kenya ranks third, after China and India,
amongst the world’s tea growing countries, with increased production in 2015 representing 8% of
global tea production.
Rwanda’s government signed an agreement withUnilever Group in mid-2016 for the establishment of twolarge-scale tea sites and the construction of a teaprocessing factory in Nyaruguru District. Authoritiesdrafted a new tea leaf handling model along the valuechain aimed at introducing a quality benchmark. Areverse of decline observed over 2011-2015 due to aprolonged drought is now expected.
Encouragement of tea growing is also reaping benefitsin Rwanda
Source: Euromonitor International from Kenya’s Agriculture, Fisheries and Food Authority and FAOSTAT

21
Euromonitor International for the Trade for Development Centre
Tea Production and Processing Structure and Related Actors in Kenya
Smallholder Tea Farmer
Tea Estates
Tea Picker/Worker
Buying Centre
KTDA Managed Factory
Tea Estates -Private Factory
Tea Picker/Worker
PRODUCTION
COLLECTION
PROCESSING
Around half a million smallholder farmers in Kenya produce two thirdsof the country’s total tea outputThe plantation sector is dominated by multinationals, but smallholder
farmers contribute the largest percentage of tea production output. In2015, 65% of the total tea crop in Kenya is produced by an estimated450,000 to 570,000 smallholder farmers.
This arrangement is similar in other countries in the region with theexception of Uganda, as tea estates continue to dominate output.
The KTDA commands around 80% of tea processing in KenyaThe Kenyan Tea Development Agency (KTDA) controls much of the tea
processing and trading on behalf of smallholder farmers but faces criticismthat benefits do not accrue sufficiently to farmers. It currently manages 66tea cooperative manufacturing plants across the country. KTDA’scommission is established at 2% over selling price.
Tea estates operate their own processing factories Large-scale tea plantations, which are organised under the Kenya Tea
Growers Association (KTGA), operate 39 estate-owned processing factoriesin the country. Examples of large-scale tea plantations with operations inKenya include Unilever Tea, James Finlays, The Sotik Tea Companies andWilliamson Tea, among others
Smallholder farmers in Kenya are
generally well remunerated for their
tea, but are often kept out of the
decision-making process for
commission fees, business
investments and dividend sharing
even though all costs are deducted
from payments to them.
TEA SECTOR: PRODUCTION AND PROCESSING INTRODUCTION / EXECUTIVE SUMMARY / SECTORS / MARKET SIZE / KENYA / CONSUMERS / FAIRTRADE / ABOUT EUROMONITOR
The value chain exhibits extreme fragmentation at the grower level
Source: Euromonitor International from FAO Technical Notes, Kenya’s Agriculture, Fisheries and Food Authority and KTDA

22
Euromonitor International for the Trade for Development Centre
Consumer
Tea Supply Chain in Kenya
KTDA Managed FactoryTea Estates -Private
Factory
Direct Exports ~ 15%
Domestic Sales~ 7%
Sales at Farm Gate
~ 3%
International Blenders and Packers
Mombasa Tea Auction ~ 75%
Local Tea Packers
PROCESSING
MARKETING & TRADE
INDUSTRIAL END-USERS
The Mombasa Tea Auction plays a leading role inauctioning tea across East AfricaThe Mombasa Tea Auction in Kenya, one of the largest
auction bourses in the world, manages the trading of teafrom nine countries in Africa, including Uganda, Burundi,Tanzania and Rwanda. Weekly auctions are the mainprice discovery point for the tea trade, influenced bysupply and demand along with quality factors such asaroma, appearance and provenance.
Concentration of industry interests is characteristic ofthe tea supply chain in KenyaMombasa Tea Auction has faced many challenges in
recent years, including greater competition from theDubai Tea Trading Centre as well as credibility issuesderived from poor trading practices. Sales are controlledby a few buyers, which account for more than half of thetea traded through the auction.
A reversal of these fortunes is possible. In June 2016, the
Kenyan government yielded to pressure allowing
smallholder farmers to export tea directly and avoid
brokers, which is expected to boost sales outside the
Mombasa Tea Auction. A potential reduction of sales
commission / brokerage fees is also being evaluated.
TEA SECTOR: MARKETING AND TRADEINTRODUCTION / EXECUTIVE SUMMARY / SECTORS / MARKET SIZE / KENYA / CONSUMERS / FAIRTRADE / ABOUT EUROMONITOR
Kenya is the major tea trading hub in East Africa
Statutory deductions on tea farmers’ payments:1% Mombasa Tea Auction sales commission0.75% Authorised tea brokersKSh9.8 / kg Transport, warehousing and port handlingKSh224 Lot charge on export tea
Source: Euromonitor International from Africa Tea Brokers Ltd, KTDA and 2014 Tea Industry Status Report.

23
Euromonitor International for the Trade for Development Centre
TEA SECTOR: EXPORTSINTRODUCTION / EXECUTIVE SUMMARY / SECTORS / MARKET SIZE / KENYA / CONSUMERS / FAIRTRADE / ABOUT EUROMONITOR
Tea exports from East African countries have kept fairly stable
Mombasa Auction Average Price (US$ per kg) Kenya was the world’s top exporter of tea by weight in 2015
Kenya exported 447,650 tonnes of processed tea on averageannually over 2011-2015, or around 20% of global tea exports,equivalent to an average export value of KSh118.9 billion (US$1.2billion) per year. Kenya’s tea earnings represented 20% of totalKenyan exports, 16% of global tea export earnings and 1.8% ofKenya’s GDP.
Kenya relies excessively on a few export partners, whichenhances its vulnerability to external shocks
Key export destinations are Pakistan, Egypt and the UK, accountingfor more than half of national tea export volume as of 2015.Emerging markets of the United Arabs Emirates, Iran and SaudiArabia also provide attractive opportunities.
Direct sales have been gaining ground in Tanzania
Uganda and Tanzania ranked 8th and 11th as the world’s largest teaexporters in 2015, respectively. Around 97% of Uganda’s teaexport volume was shipped to Kenya to be sold at the MombasaTea Auction in 2015. Conversely, Tanzania’s bilateral trade withKenya was comparatively lower during 2015, accounting for only49% of the country’s total export volume. The remainder wasexported through negotiated contracts based on direct sales to theUnited Kingdom, Russia and Pakistan, which guaranteed stableprices and thus predictable revenue generation.
Source: Euromonitor International from Africa Tea Brokers Ltd and UN Comtrade Database
Processed Tea Exports 2015 (tonnes); CAGR 2011-15
2.983.18
2.64
2.14
2.95
1.761.87 1.83
1.43 1.4
2.732.87 2.58
2.24
2.96
2.77
2.99
2.39
2.12
3.06
1.38 1.561.68
1.28 1.21
2011 2012 2013 2014 2015
Kenya Uganda Burundi Tanzania Rwanda
443,461 53,311 10,03229,293
16,548
4.7%
-0.9%
1.6% 2.0%
-8.1%
Kenya Uganda Burundi Tanzania Rwanda
Kenya’s government has already lifted the 1% ad-valorem tax
charged on tea under the 2016/2017 budget to enhance
competitiveness and boost tea export earnings.

24
Euromonitor International for the Trade for Development Centre
Value addition levels through processing are low
Recent government efforts to entice multinational companies to relocatetheir factories to the country of origin of tea is hampered by the relativelysmall consumer base and disposable income levels within the region as wellas inadequate infrastructure, low logistics efficiency, corruption and safetyissues.
Investment by local companies in Kenya aim to increase the amount of valueadded processing, employment and to improve working conditions. Theseinclude Kenya Tea Packers’ tea processing and blending facilities as well asDormans Coffee Group’s coffee roasting factory and Nairobi Java HouseRoastery.
Initiatives such as VAT exemption and a ten-year tax holiday are offered inKenya as well Export Processing Zones.
Blending and packaging of processed tea offers secondary opportunitiesfor value addition
Blending and packaging can represent 80% of the final retail price to theconsumer. Currently nine private companies operate as tea packers inKenya, five in Tanzania and include Kenya Tea Packers, a company ownedby the KTDA which controls about 60% of locally consumed tea throughretailing.
The competitive edge of domestic
supply is restricted by currency
fluctuations and packaging
importation costs as well as 16%
VAT on packing costs to retail prices.
TEA SECTOR: END USERSINTRODUCTION / EXECUTIVE SUMMARY / SECTORS / MARKET SIZE / KENYA / CONSUMERS / FAIRTRADE / ABOUT EUROMONITOR
Adding value to domestic supply is difficult without intervention
Source: Euromonitor International from Africa Tea Brokers Ltd, KTDA and 2014 Tea Industry Status Report.
Examples of Kenyan-based tea packers:
Kenya Tea Packers (Kericho)
Chippendales Kenya Ltd (Nairobi)
Gold Crown Beverages Kenya Ltd (Mombasa, Nairobi)
Sasini Tea & Coffee Ltd (Nairobi)

25
Euromonitor International for the Trade for Development Centre
In 2015, Uganda was the largest producer and exporter of coffee surpassing exports from the other four countries combinedwith double the volume in sales. Uganda and Tanzania have both achieved large increases in their crop with support ofgovernment initiatives and focus strongly on Robusta production. The more highly valued Arabica is grown in small quantitiesin Kenya but also in Uganda and Tanzania.
East Africa generates about 4% of the world’s coffee production
Regional coffee production (tonnes) 2015
Share of the region in global coffee supplies 2015
Share of the region in global coffee exports 2015
418,588 4% 4%
COFFEE SECTOR IN KENYA, UGANDA, BURUNDI, TANZANIA AND RWANDAINTRODUCTION / EXECUTIVE SUMMARY / SECTORS / MARKET SIZE / KENYA / CONSUMERS / FAIRTRADE / ABOUT EUROMONITOR
Source: Euromonitor International from FAOSTAT, International Tea Committee and UN Comtrade Database

26
Euromonitor International for the Trade for Development Centre
COFFEE SECTOR: PRODUCTION TRENDSINTRODUCTION / EXECUTIVE SUMMARY / SECTORS / MARKET SIZE / KENYA / CONSUMERS / FAIRTRADE / ABOUT EUROMONITOR
Uganda is one of world’s largest Robusta coffee producers
Coffee Production 2015 (tonnes); CAGR 2011-15
Kenya’s coffee production has flattened since 2011
Kenya only contributes 0.5% of the world’s coffee productionalbeit of highly appreciated Arabica coffee. Coffee output in Kenyaflattened over the 2011-2015 period, due to low prices and the lossof production from large plantations in the suburbs of Nairobi.
Uganda and Tanzania have recorded sustained growth
Both Tanzania and Uganda grow both Robusta and Arabica coffee.In volume terms, Uganda's output of Robusta coffee is more thandouble that of Arabica coffee, in Tanzania around a third of outputcomprises Robusta. In 2015, Uganda and Tanzania recorded acombined output of 339,300 tonnes in 2015, which represented a26.4% increase over the previous year.
Ambitious government-sponsored programmes contribute tothe expansion of the coffee sector in Uganda and Tanzania
The substantial progress made by both countries has beenprompted by the implementation of ambitious government-sponsored programmes. For example, the Uganda CoffeeDevelopment Authority recently launched a productionenhancement plan, which includes the promotion of improvedvarieties, streamlining of farm inputs supply, and the revamping ofagricultural extension services.
Source: Euromonitor International from ICO and the 2016 Report of the National Task Force on Coffee Sub-Sector Reforms
Coffee Growing Area in East Africa
Uganda is the leading producer in the region whereas output in Kenya is relatively minor. The former is also one of the largest Robusta producers
globally, with 78% of its coffee production devoted to Robusta.
45,600 285,30016,984
54,00016,704
0.1%
11.2%
8.5%
13.4%
2.6%
Kenya Uganda Burundi Tanzania Rwanda
Uganda is Africa's second-biggest grower of coffee after Ethiopia.

27
Euromonitor International for the Trade for Development Centre
COFFEE SECTOR: PRODUCTION AND PROCESSING INTRODUCTION / EXECUTIVE SUMMARY / SECTORS / MARKET SIZE / KENYA / CONSUMERS / FAIRTRADE / ABOUT EUROMONITOR
As with tea, the coffee sector is defined by a dual production system
Coffee Production and Processing Structure and Related Actors in Kenya
In 2015, around 65% of coffee output in Kenya was produced bysmallholder farmers
About 600,000 smallholder farmers in Kenya produce around twothirds of the country’s coffee output from some 77% of the landarea under coffee. The remainder is generated by 3,217 mediumand large coffee growers (Estates). In countries like Burundi andRwanda, smallholder coffee farms might consist of only 100 trees.
Smallholder farmers in Kenya face limited choice in processing
Smallholder farmers are required by Kenya’s 2011 Coffee Act tojoin one of the existing 525 cooperative societies, which togetheroperate around 1,000 pulping stations where smallholder farmersdeliver their coffee cherries for primary processing.
The scenario is slightly different in Uganda, as smallholders areable to sell their coffee cherry to private sector traders meaningthat they are paid in cash upon delivery. The longer time periodbetween delivery of crops and payment in Kenya acts as adisincentive for local smallholder farmers.
Milling in Kenya is limited with only nine commercial millers
In 2015, there were 18 registered millers in Kenya licensed by theCoffee Directorate, with a combined milling capacity of over350,000 tonnes on the basis of an eight hour shift.
Source: Euromonitor International from the 2016 Report of the National Task Force on Coffee Sub-Sector Reforms
Coffee Picker/Farmer
Coffee Picker/Worker
PRODUCTION
COLLECTION
PROCESSING
Medium Growers
2-5 ha
Coffee Picker/Worker
Dry Millers
Estates
> 5 ha
Smallholder Coffee Farmer Cooperative
2-5 ha
Cooperative Society’sWet Milling
Factory~ 1,000
PrivateWet-process Millers
~ 3,000

28
Euromonitor International for the Trade for Development Centre
COFFEE SECTOR: MARKETING AND TRADEINTRODUCTION / EXECUTIVE SUMMARY / SECTORS / MARKET SIZE / KENYA / CONSUMERS / FAIRTRADE / ABOUT EUROMONITOR
Strong regulatory control is maintained through the region
Kenya acts as the regional trading hub in coffee
Kenya is the regional trading hub for coffee with a 4.6% rise involumes export between 2011-15 primarily from increasedproduction in Uganda and Tanzania. Products exported to smallnumber of traditional destination markets consist primary ofgreen coffee rather than processed output.
Kenya’s coffee is still primarily traded at the Nairobi CoffeeExchange
Although Uganda’s smallholder farmers are increasingly exploringdirect sales, around 85% of Kenya’s coffee is still traded throughwholesale auctions at the Nairobi Coffee Exchange.
Both estates and smallholder cooperatives contract one of fivelicensed marketing agents each year to represent them at thewholesale coffee auctions. The coffee is then purchased by one ormore of about 25 active coffee dealers.
Licensed coffee dealers then regrade and repack beans to suit theirexport clients.
Source: Euromonitor International from the 2016 Report of the National Task Force on Coffee Sub-Sector Reforms
Statutory deductions on coffee farmers’ payments:1% Coffee Board of Kenya 2% Coffee Research FoundationKSh10 / bag Nairobi Coffee Exchange sales commission0.8% Road board levy0.2% Council/County levyKSh4,675 / tonne Milling basic chargesKSh5,000 / tonne Other milling charges
Consumer
Coffee Supply Chain in Kenya
Wet & Dry Millers
Coffee Marketing Agents
Domestic Sales ~ 15%
Foreign Roasters
Nairobi Coffee Auction ~ 85%
PROCESSING
MARKETING &TRADE
Local Roasters
ROASTERS & MULTINATIONALS
Coffee Dealers

29
Euromonitor International for the Trade for Development Centre
Kenyan arabica is a high quality mild coffee suitablefor blending for speciality markets and is nowexported to 70 different destinations. Two-thirdstraditionally goes to Europe with Germany, Belgiumand Sweden key markets. The US is also a largedestination market.
Coffee exports represent a 6% of the country’sagricultural exports. Uganda’s exports, however, grewby 9.1% between 2011-15 with 97% exported bymore than 30 companies through direct sales ratherthan through Kenyan auctions. The high level ofRobusta produced in Uganda directly affects valuesales as Robusta achieves about half the value ofArabica per kilo.
COFFEE SECTOR: EXPORTSINTRODUCTION / EXECUTIVE SUMMARY / SECTORS / MARKET SIZE / KENYA / CONSUMERS / FAIRTRADE / ABOUT EUROMONITOR
A remarkable increase was noted in coffee exports over 2011-15
Kenya was the 16th largest coffee exporter globallyin 2015
Benchmark Export Coffee Price (US$ per kg)
Coffee Exports 2015 (tonnes); CAGR 2011-15
Kenyan Arabica is classed as among the world’s finest coffee
5.61
5.03
3.81
4.69 4.86
2.32 2.191.84 1.93 1.83
4.83
3.59
2.77
3.74
3.40
4.30
2.99
2.42
3.63
2.94
3.63 3.48
2.60
2.772.69
2011 2012 2013 2014 2015
49,373 219,883
13,070
58,75318,862
7.4%
2.2%
-7.0%
9.8%
4.5%
Kenya Uganda Burundi Tanzania Rwanda
Source: Euromonitor International from UN Comtrade Database
Kenya Uganda Burundi Tanzania Rwanda

30
Euromonitor International for the Trade for Development Centre
COFFEE SECTOR: END USERSINTRODUCTION / EXECUTIVE SUMMARY / SECTORS / MARKET SIZE / KENYA / CONSUMERS / FAIRTRADE / ABOUT EUROMONITOR
Investment and active marketing is creating international brands
Roasters and multinational companies are majorindustrial end-users of coffee
Overview of Major Companies' % Value Shares in Coffee Markets Worldwide 2015
Examples of Kenyan-based roasters
Local roasters are now exploring the export market
Source: Euromonitor International
22%
12%
3%
3%3%
3%
55%
Nestlé
Jacobs Douwe Egberts
Kraft Heinz
JM Smucker
Keurig Green Mountain
Starbucks
Others
Dormans Coffee Group is now the leading coffeeexporter and roaster in East Africa, producing over15,000 tonnes of roasted coffee per annum. DormansCoffee Group was the first to obtain the Fairtrade andUTZ certifications.
Nairobi Java House Roastery has established itself as amajor chain operator of coffee shops and restaurants in-and-around Nairobi and Uganda.
The commercial strategy of several local roasters isbased on the “Coffee Kenya”, “Kenya AA” and “Dormans”brandmarks.
The Coffee Directorate appointed KEBS to developindustrial standards and a code of practice on origindifferentiation for “Coffee Kenya” covering the entireprocess of production for coffee to selling.
COOP Danmark in 2016 established an industrial coffeeroasting and packaging facility, Africa Coffee Roasters,to create the locally-produced brand, Mount KenyaCirkel Kaffe which is targeted for sale in the Europeanmarket.

31
Euromonitor International for the Trade for Development Centre
Cocoa is a small industry practiced mainly in Uganda and Tanzania with small crop production in Kenya. As a small industry itis not well regulated with poor infrastructure and is focused on export of largely unprocessed beans. No processing facilitiesare present with little possibility of value addition to production.
Cocoa is a vastly underdeveloped small industry in East Africa
Regional cocoa production (tonnes) 2015
Share of the region in global cocoa supplies 2015
Share of the region in global cocoa exports 2015
25,300 1% 1%
COCOA SECTOR IN KENYA, UGANDA, BURUNDI, TANZANIA AND RWANDAINTRODUCTION / EXECUTIVE SUMMARY / SECTORS / MARKET SIZE / KENYA / CONSUMERS / FAIRTRADE / ABOUT EUROMONITOR
Source: Euromonitor International from FAOSTAT, Internation Tea Committee and UN Comtrade Database

32
Euromonitor International for the Trade for Development Centre
Limited production limited by weather and harvesting
Cocoa is a relatively minor and non-traditional cash cropin East Africa, with most of the region’s productioncoming from Uganda and Tanzania.
The combined crop of 25,300 tonnes is equal to 1% of theglobal cocoa bean market.
Cocoa Growing Area in East Africa
COCOA SECTOR: PRODUCTION TRENDSINTRODUCTION / EXECUTIVE SUMMARY / SECTORS / MARKET SIZE / KENYA / CONSUMERS / FAIRTRADE / ABOUT EUROMONITOR
Small scale production dedicated to export of unprocessed beans
20,500 5,600
3.3%
-12.4%
Kenya Uganda Burundi Tanzania Rwanda
Cocoa production 2011-15 (‘000 tonnes) and CAGR 2011-15
Government initiatives support planned growth
Through the Cocoa Development Project (CDP), Uganda’sMinistry of Agriculture, Animal Husbandry and Fisheriesdistributed over a million cocoa seedlings to farmersacross the country in 2015 and also pushed for the use ofhybrid cocoa varieties which mature earlier and are moreresistant to pest and diseases. These initiatives aim tofacilitate a target of 50,000 hectares of cocoa to bereached by the end of 2020.
Source: Euromonitor International from FAOSTAT, Internation Tea Committee and UN Comtrade Database

33
Euromonitor International for the Trade for Development Centre
COCOA SECTOR: PRODUCTION AND PROCESSING INTRODUCTION / EXECUTIVE SUMMARY / SECTORS / MARKET SIZE / KENYA / CONSUMERS / FAIRTRADE / ABOUT EUROMONITOR
A highly fragmented production process with small landowners only
Cocoa production has potential to be certified organic
It is estimated that around 35,000 smallholders areinvolved in the cultivation of cocoa across Uganda andTanzania using organic production methods where theapplication of pesticides is minimal. However, farmersgenerally remain uncertified due to the lack of formaltechnical skill, high certification costs and stringentprocedures.
Processing facilities are absent
Cocoa beans are merely harvested, fermented and sun-dried before being shipped overseas to cocoa consumingcountries. There is a lack of investment in training forpost-harvest handling of cocoa as well as lack ofprocessing factory facilities.
Very limited value added processing is undertaken withinTanzania or Uganda
Source: Euromonitor International

34
Euromonitor International for the Trade for Development Centre
Formal infrastructure and regulation is absent
Esco Uganda is a major exporter of organic cocoa beans.The company has been trading in cocoa and vanilla inBundibugyo district since 1994. Currently it is one of themajor buyers in the district. Both, cocoa and vanilla areexported as certified organic products.
ICAM Chocolate, Three Farmers and World Botanic Ltdalso export from Uganda and the Bundibugyo CocoaAssociation have recently been able to link up directlywith international buyers in Europe.
In Tanzania, Biolands and Kilimo Hai dominate shippingof raw cocoa
Leading exporters of coffee beans from Uganda
COCOA SECTOR: MARKETING AND TRADEINTRODUCTION / EXECUTIVE SUMMARY / SECTORS / MARKET SIZE / KENYA / CONSUMERS / FAIRTRADE / ABOUT EUROMONITOR
Foreign exchange earnings increase at unit price of cocoa rises
Most of the buyers are local traders, who purchase cocoa beans at the farm gate for export. Due to the absence of established cooperatives and a lack of unionisation, smallholder farmers have little bargaining power and thus are vulnerable to the price set by private buyers.
After the purchase is finalised, buyers transport the cocoa to store facilities for cleaning and aggregation before shipping.
Nearly all cocoa produced both in Uganda and Tanzania are exported in raw form for industrial or consumer goods production, chiefly chocolate and related products.
Source: Euromonitor International
40%
30%
30%Esco Uganda
Olam
Others

Euromonitor International for the Trade for Development Centre
MARKET SIZE AND CHARACTERISTICS

36
Euromonitor International for the Trade for Development Centre
Coffee growth outstrips expansion of tea sales across the region
Kenya, Uganda and Tanzania are the most populous countries in the region and constitute the largest hot beveragesmarkets in East Africa in volume terms. Kenya has the highest per capita consumption (US$4.10), a reflection of thehigher incomes available in this country.
Tea is the traditional beverage in the region but CAGR 2011-15 shows strongest value growth for coffee at 13.9% aheadof 8.2% for tea.
Kenyan tea consumption greatly outstrips its use in other countries in the region. In comparison Ugandans drinksignificantly less and favour coffee more strongly. Tanzanians, likewise, are much more likely to drink coffee than tea.
36
US$1.68
5.3%
10.4%
Average consumer spending 2015
Volume CAGR 2011-15
Value CAGR 2015-20
Strong value growth reflects premiumisation
53,900 tonnes / KSh34 billion (US$344 million), 2015East African Hot Beverage Consumption
7,620 t29,700 t 16,650 t
INTRODUCTION / EXECUTIVE SUMMARY / SECTORS / MARKET SIZE / KENYA / CONSUMERS / FAIRTRADE
KSh 7.7bn (US$77.6mn)
KSh 16.1bn (US$162.8mn)
KSh 10.2bn (US$103.6mn)
Tea Coffee Other hot drinks
HOT BEVERAGES MARKET IN EAST AFRICA

Euromonitor International for the Trade for Development Centre
Tradition
Tea drinking patterns are well established and
appeal to both low and middle income
consumers.
New varieties, flavours, premium products and promises of therapeutic
value of tea supports growth in this category.
Modernity
Coffee represents the modern hot beverage of
choice for young consumers through its
association with novelty, affluence, westernised
values and its increasing availability through modern retail and
forecourt channels.
37
Population
The large population of children and young adults
in the region underpins the growth and popularity
of powdered flavoured hot drinks including chocolate, malt or
fortified varieties. An affordable option for low
and middle income families.
Retailing
The expansion of modern retailing and forecourt modernisation offers a
wider variety of product formats, sizes and price
points that is increasingly attractive in urban areas. Development outside the
major cities is now underway.

38
Euromonitor International for the Trade for Development Centre
Informal and formal sales channels are important for tea penetration
Tea bags are also popular but retail at a higher pricepoint than loose tea but appeal to consumers because oftheir convenience, speed and ease of use.
Branded fruit, herbal or green teas appeal to moreaffluent, city based consumers with health andtherapeutic benefits strongly marketed. Distribution,however, is still limited to upmarket supermarkets andhypermarkets in larger cities.
Forecast growth in the region for tea is 4.4% but only amarginal increase in per capita consumption is expected.
Tea is sold in traditional and modern grocers but also iswidely available from kiosks and informal street marketsacross the region. Affordability is a key criteria in choiceof formats and package size in the region. Loose black tea,which is usually sold at a much lower price, is popular inrural areas and among low income consumers.
Domestic and regional brands often comes in foil bags of300-500g but can be found in packages of 100g.
INTRODUCTION / EXECUTIVE SUMMARY / SECTORS / MARKET SIZE / KENYA / CONSUMERS / FAIRTRADE / ABOUT EUROMONITOR
TEA CONSUMPTION IN EAST AFRICA

39
Euromonitor International for the Trade for Development Centre
Rising popularity of coffee supported by increased accessibility
INTRODUCTION / EXECUTIVE SUMMARY / SECTORS / MARKET SIZE / KENYA / CONSUMERS / FAIRTRADE / ABOUT EUROMONITOR
Increasing consumption of coffee is supported bygrowing disposable income and aspirations towards awestern lifestyle. Per capita consumption is low acrossthe region but has reached US$2.60 (KSh255) per annumsupported by a rapid expansion of chained specialistcoffee shops in affluent areas.
Informal markets, corner shops and street vendorsparticularly in Tanzania, are a leading channel ofdistribution of ready to drink volumes in the traditionalform of hot Arab style “Kahawa chungu”. Officeenvironments are also developing as an importantchannel for distribution.
Instant coffee is estimated to make up about 90% of totalvolume with single serve sachets popular due toconvenience and affordability.
Coffee comes in tins and pouches of 50g, 100g and 250gand varies in price by brand.
Pods and capsules are now coming to the market withmachines available in leading stores but uptake is stillvery low.
Forecast growth to 2020 is CAGR 6.6% due to increasingdisposable income and higher out of home consumption.
COFFEE CONSUMPTION IN EAST AFRICA

40
Euromonitor International for the Trade for Development Centre
A small but dynamic market targeting families and children
INTRODUCTION / EXECUTIVE SUMMARY / SECTORS / MARKET SIZE / KENYA / CONSUMERS / FAIRTRADE / ABOUT EUROMONITOR
Chocolate flavoured drinks take a 47% volume share ofthe regional market followed in popularity by maltbased drinks.
Products are heavily promoted as a healthy andaffordable option for families with young children.
Drinks are consumed both in hot and cold form andcome in single serve sachets as well as larger containers,tins and pouches.
Single serve sachets allow for greater portability andaffordability for low to middle income consumers.
Major European brands such as Nestlé and Cadbury arevery active in this market with leading product sales.
With a very young population the region offers a largeconsumer market and forecast growth of CAGR 6.3% to2020 is expected with chocolate based drinks the mostdynamic
OTHER HOT DRINKS CONSUMPTION IN EAST AFRICA

Euromonitor International for the Trade for Development Centre
FOCUSING ON KENYA: MARKET ANALYSIS

Euromonitor International for the Trade for Development Centre
Premiumisation is developing as consumers acquire new drinking habits and expectations
Trading up from unpackaged to higher value packaged, branded products is occurring as consumers look to newcategories such as bagged and speciality teas for convenience, novelty and alternatives to traditional products.
Rising disposable incomes, wider availability and ranges of ready to drink varieties encourages impulse purchase andthe development of new drinking occasions.
42
37.8%
11.9%
8.4%
Absolute value growth 2011-15
Volume CAGR 2011-15
Value CAGR 2015-20
Tea sales dominate the market
Kenya’s Hot Beverage Consumption24,176 tonnes / KSh 11.8 billion (US$191 million)
2,716 t20,452 t 1,008 t
INTRODUCTION / EXECUTIVE SUMMARY / SECTORS / MARKET SIZE / KENYA / CONSUMERS / FAIRTRADE
KSh 4.1bn (US$42.4mn)
KSh 11.8bn (US$102.7mn)
KSh 2.7bn (US$27.9mn)
HOT BEVERAGES MARKET IN KENYA
Tea Coffee Other hot drinks

Euromonitor International for the Trade for Development Centre
MA
RK
ET
DR
IVE
RS
A growing, young, affluent population underlines market growth
Growth in incomes, poverty reduction and a growing urban consumer classattracts consumers to the benefits of packaged, added-value hot beverageproducts.
Kenyan consumers now seek to taste new products, origins, deliveryformats as well as an array of exotic flavours and blends that offernutritional and medicinal benefits. Coffee, powdered hot drinks andflavoured instant mixes constitute favourable ground to develop the existingoffering.
Growth of a coffee shop culture in business districts, shopping malls andhigher income neighbourhoods positions coffee clearly as an aspirationalitem.
International hotels targeting the high-end consumer are also jostling for aspace in Nairobi, which is expected to increase demand for locally-sourcedhot beverages.
Income growth + urbanisation
Innovation and new product developments
The coffee shop revolution
Nairobi: A rising star amongst global hotel brands
INTRODUCTION / EXECUTIVE SUMMARY / SECTORS / MARKET SIZE / KENYA / CONSUMERS / FAIRTRADE / ABOUT EUROMONITOR
Eating out has increased in frequency with new restaurants and chained
fast food outlets offer sit down and delivery options. Coffee consumption, in
particular, has benefitted from higher growth rates in foodservice than tea
(6.1% CAGR vs 3.7% CAGR 2011-2015).
Expansion of internal foodservice chains
HOT BEVERAGES MARKET IN KENYA: KEY TRENDS

44
Euromonitor International for the Trade for Development Centre
Modern retail is the leading channel for sales of tea with 65% share
Total volume sales of tea increased at 2.5% CAGR between 2011-15 while value sales increased by 7.3% CAGR. Strong
demand for higher value, better quality products with new flavours has supported increases in product prices and variety
in packaging formats.
Strong marketing campaigns by the Tea Directorate and leading brands continue to position tea as popular drink
throughout the day for all the family. Black tea remains popular as well as herbal teas with therapeutic effects with new
product development keenly watched by consumers.
Total Volume Sales: 2011-2020 Tonnes Retail Value Sales: 2011-2020 KSh billion*
INTRODUCTION / EXECUTIVE SUMMARY / SECTORS / MARKET SIZE / KENYA / CONSUMERS / FAIRTRADE / ABOUT EUROMONITOR
HOT BEVERAGES MARKET IN KENYA: TEA
17,565 17,846 18,143 18,648 19,178 22,613
1,134 1,175 1,213 1,242 1,274
1,422
2,847 2,953 3,056 3,174 3,289
3,959
2.0% 2.0% 2.0%
2.9% 2.9%
2.5%
2011 2012 2013 2014 2015 2020
Black Tea, Other Tea, Sales through Foodservice, YOY % Growth and CAGR 2015-2020
ForecastCAGR
2015-20
Source: Euromonitor International*Exchange rate, 2015: KSh98.18 = US$1.00Note: Other Tea includes fruit/herbal tea, green tea, instant tea and “other tea”
8.1 9.0 9.5 10.1 10.7
11.9
0.70.8
0.91.0
1.1
1.2
14.3%
11.4%
6.1%6.7% 6.3%
2.1%
2011 2012 2013 2014 2015 2020
ForecastCAGR
2015-20

45
Euromonitor International for the Trade for Development Centre
Growing attraction to coffee seen in offices, coffee shops and retail
Although consumption is low in comparison with tea, coffee is finding a foothold among the growing middle class and
young working professionals as exposure in office environments and local stores allows for greater experimentation with
the range of products available.
In central business districts, shopping malls and urban centres, coffee shop chains are expanding. Instant coffee sales
take a 52% share of the market in tins, containers and single serve sachets as well as being available in street kiosks and
the majority of retail outlets. Sales of fresh ground coffee are also growing as tastes change with greater consumer
willingness to spend on these products.
INTRODUCTION / EXECUTIVE SUMMARY / SECTORS / MARKET SIZE / KENYA / CONSUMERS / FAIRTRADE / ABOUT EUROMONITOR
HOT BEVERAGES MARKET IN KENYA: COFFEE
Total Volume Sales: 2011-2020 Tonnes Retail Value Sales: 2011-2020 KSh billion*
Source: Euromonitor International*Exchange rate, 2015: KSh98.18 = US$1.00
Fresh Coffee Beans, Fresh Ground Coffee, Instant Coffee, YOY % Growth and CAGR 2015-2020
139 142 143 145 163
398 416 436 454 473 566
491
504 518 530 539596
-0.4%
3.3% 3.4%2.9% 2.7% 2.7%
2011 2012 2013 2014 2015 2020
ForecastCAGR
2015-20
0.2 0.2 0.2 0.2 0.2 0.2
0.5 0.5 0.6 0.6 0.7
1.4 1.5 1.6
1.81.9
2.1
17.6%
10.0%9.1%
8.3%7.7%
2.3%
2011 2012 2013 2014 2015 2020
ForecastCAGR
2015-20
0.8

46
Euromonitor International for the Trade for Development Centre
Nutritional value is important to families and central to promotion
Key drivers of the other hot drinks market are a fast growing young population and increasing high income consumer
base attracted by fortified and innovative products and packaging with vibrant marketing activities by leading brands.
Retail sales showed an increase of CAGR 12.1% between 2011-15 pushed upwards by malt flavoured as a healthy
alternative to chocolate.
Malt based drinks are promoted as have a beneficial effect on children’s physical and mental development. With over
42% of the population under 15 years consumption is expected to grow alongside increasing disposal income.
INTRODUCTION / EXECUTIVE SUMMARY / SECTORS / MARKET SIZE / KENYA / CONSUMERS / FAIRTRADE / ABOUT EUROMONITOR
HOT BEVERAGES MARKET IN KENYA: OTHER HOT DRINKS
Total Volume Sales: 2011-2020 Tonnes Retail Value Sales: 2011-2020 KSh billion*
Source: Euromonitor International*Exchange rate, 2015: KSh98.18 = US$1.00
1,392 1,437 1,479 1,543 1,6071,919
1,184 1,250 1,314
1,367 1,433
1,603
4.2% 4.3%3.9%
4.2%4.5%
3.0%
2011 2012 2013 2014 2015 2020
Chocolate-based Flavoured Powdered Drinks, Malt-based Powdered Drinks, YOY % Growth and CAGR 2015-2020
ForecastCAGR
2015-20
1.5 1.6 1.8 1.9 1.92.2
1.5 1.71.9
2.2 2.2
3.0
16.1%
13.2%
11.0% 10.9%12.0%
4.5%
2011 2012 2013 2014 2015 2020
ForecastCAGR
2015-20

Euromonitor International for the Trade for Development Centre
Modern Grocery
Supermarkets and hypermarkets comprise 65% of all sales of hot drinks. Branded products in tins, containers, sachets and ready to go form are widely available with
many varieties of origin and flavour present.
Private label ranges are now marketed by the leading retailers and are growing in popularity due
to price and value for money.
Traditional Grocery
Black loose tea and instant coffee packaged in smaller volumes are
more affordable for lower income consumers and retain their
position in traditional grocers. Few modern varieties of tea or
coffee are available through this channel.
Small grocers, open air markets, kiosks and corner shops account
for 31% of sales.
47
On-The Go
Forecourt sales currently account for 3.3% of hot drink sales in Kenya, growing strongly since 2011 as beverage services are
more widely introduced in modernised service stations.
Vending service on forecourts and in offices are also being
introduced to offer a wider range of hot drinks including teas for
on-the-go consumption.

Euromonitor International for the Trade for Development Centre
The tea market is concentrated with a small number ofleading manufacturers. Price is very competitive withall brands leveraging consumer recognition with newproducts, packaging formats and a range of products atall price points. New players such as Dormans Coffeegroup have expanding into tea offering competitivelypriced quality tea bags.
Strengthening competition continues to encourage localmanufacturers to focus on expanding their flavouredand speciality teas, which also include green, white andpurple varieties. This strategy was credited to theproducts’ alleged health benefits for consumers.
INTRODUCTION / EXECUTIVE SUMMARY / SECTORS / MARKET SIZE / KENYA / CONSUMERS / FAIRTRADE / ABOUT EUROMONITOR
National brands show their strength in teaHOT BEVERAGES MARKET IN KENYA: COMPETITIVE LANDSCAPE
The leading three local players accounted for an impressive 81%
value share, down from 84% in 2011.
61%17%
3%2%1%
15%Kenya Tea Packers
Karirana Estates
Gold Crown Beverages
Sasini Tea & Coffee
Pure Health Products
Meru Herbs
Others
Tea Market Retail Value Share % by Company 2015
International brand Nescafé dominates in coffeethrough its range of instant coffees in many formatsbacked by continuous marketing and promotionalcampaigns and a nationwide distribution network.
Other brands such as Sasini offer fresh and instantcoffee at more affordable prices while Fairtrade-certified Dormans capitalises on catering services tooffices and institutions in addition to retail.
44%
15%
15%
5%
3%3%3%
2%
12%
Nestlé Foods Kenya
Dormans Coffee Group
Sasini Tea & Coffee
Afri Tea & Coffee
Nairobi Java House Roastery
Gibsons Coffee
Chandaria Industries
Cacique de Café Solúvel
Others
Nestlé Foods Kenya retains its lead to reach a 44% value share in 2015 compared to 41% in 2011.
Coffee Market Retail Value Share % by Company 2015

Euromonitor International for the Trade for Development Centre
Nestlé’s brand Milo is a category winner and issupported by sustained promotional campaigns andsponsorship of youth activities, sports and popularfestivals. Cadbury positions itself as a high quality,family drink that can be consumed at any time. ExcelChemical’s Raha brand is also seeing growth whileHorlicks, a recent market entrant, is offered atcompetitive, affordable prices in a range of packagingsizes including single serve sachets.
INTRODUCTION / EXECUTIVE SUMMARY / SECTORS / MARKET SIZE / KENYA / CONSUMERS / FAIRTRADE / ABOUT EUROMONITOR
Concentration in all markets requires investment for new entrantsHOT BEVERAGES MARKET IN KENYA: COMPETITIVE LANDSCAPE
Powdered Hot Beverages Market Retail Value Share % by Company 2015
51%
34%
9%6%
Nestlé Foods Kenya
Cadbury Kenya
Excel Chemicals
Others
Nestlé Foods Kenya and Cadbury Kenya retains accounted for an 85% value share in 2015.
Strong promotion wins
National brands show their strength but are under
pressure from international brands such as Nestlé
and Mondelez which are showing stronger growth
particularly in coffee and other hot drinks.
Nestlé’s Nesquik and Cadbury Drinking Chocolate
are the fastest growing brands with CAGR 2011-15
of 20.6% and 14.8% respectively compared to 7.4%
for Farahi ya Kenya.
“Many Kenyans prefer imported products due to awidespread perception of better quality and stricterproduction standards. This pushes local producers to focuson packaging, flavours, colours and branding to reflecthigh quality of Kenyan products and entice consumers.”
- Market Researcher at a Processing Company, Kenya

Euromonitor International for the Trade for Development Centre
Retailing
CoffeeShelf space dedicated to coffee is significantly less than for teas. However, in more affluent
areas a wider range of coffees, including fresh coffee and pods, are stocked than in less well-
off areas.
Instant coffee dominates the shelves with market leading brands offered in all stores.
TeaAll leading brands are sold in modern retailing outlets with Fahari Ya Kenya more likely to be
found in lower income areas while Kericho Gold was sold in middle to upper class stores.
Black tea dominates in either loose or as higher priced tea bags with newer exotic flavours
limited to up market areas.
Other hot drinksPricing differentials between chocolate and malt based drinks affects their accessibility with malt based products more likely to be
found in lower income areas.
The range of products available is also more limited than for coffee or tea.
Due to the wide range of urbanisation and income levels across Kenya retailers adapt their
offering to suit their clientele expanding or limiting the offering based on price and
sophistication of their customers.
Euromonitor International for the Trade for Development Centre
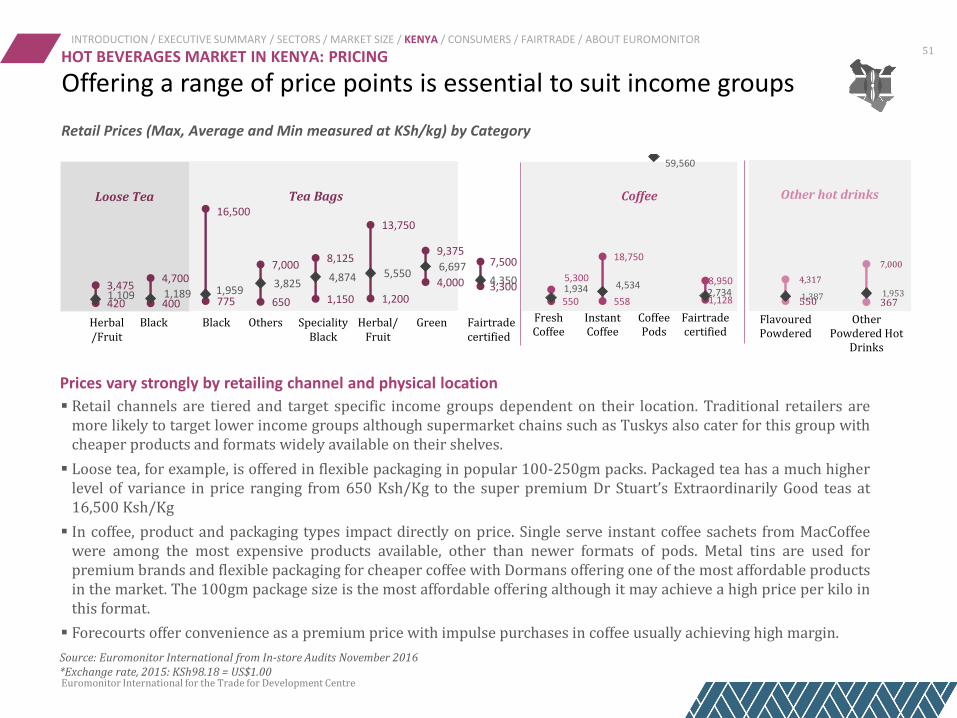
Offering a range of price points is essential to suit income groups
51INTRODUCTION / EXECUTIVE SUMMARY / SECTORS / MARKET SIZE / KENYA / CONSUMERS / FAIRTRADE / ABOUT EUROMONITOR
Retail channels are tiered and target specific income groups dependent on their location. Traditional retailers aremore likely to target lower income groups although supermarket chains such as Tuskys also cater for this group withcheaper products and formats widely available on their shelves.
Loose tea, for example, is offered in flexible packaging in popular 100-250gm packs. Packaged tea has a much higherlevel of variance in price ranging from 650 Ksh/Kg to the super premium Dr Stuart’s Extraordinarily Good teas at16,500 Ksh/Kg
In coffee, product and packaging types impact directly on price. Single serve instant coffee sachets from MacCoffeewere among the most expensive products available, other than newer formats of pods. Metal tins are used forpremium brands and flexible packaging for cheaper coffee with Dormans offering one of the most affordable productsin the market. The 100gm package size is the most affordable offering although it may achieve a high price per kilo inthis format.
Forecourts offer convenience as a premium price with impulse purchases in coffee usually achieving high margin.
Prices vary strongly by retailing channel and physical location
550 558 1,1281,934 4,534
2,734
5,300
18,750
59,560
8,950
FreshCoffee
InstantCoffee
CoffeePods
Fairtradecertified
420 400 775 650 1,150 1,200
4,000 3,300 1,109 1,189 1,959
3,8254,874 5,550
6,6974,350 3,475
4,700
16,500
7,0008,125
13,750
9,3757,500
Loose Tea Tea Bags
Herbal/Fruit
Black Black Others Speciality Black
Herbal/ Fruit
Green Fairtrade certified
Coffee
550 367 1,387 1,953
4,317
7,000
FlavouredPowdered
OtherPowdered Hot
Drinks
Other hot drinks
HOT BEVERAGES MARKET IN KENYA: PRICING
Source: Euromonitor International from In-store Audits November 2016*Exchange rate, 2015: KSh98.18 = US$1.00
Retail Prices (Max, Average and Min measured at KSh/kg) by Category

52
Euromonitor International for the Trade for Development Centre
25-fold increase in value of tea from production to a cup
Most value is added at the end of the supply chain through the foodservice channel
Retailers achieve value addition of approximately 10 times the price of the raw commodity but the largest value additionoccurs through foodservice mark-ups.
A cup of masala or green/herbal tea in a coffee shop can sell for KSh160 (US$1.63) which is 2,600% higher than theaverage retail value.
A cup of fresh coffee usually costs around KSh160 (US$1.53) in a specialist coffee shop but mark-ups can reach 600-1,000% of the equivalent coffee at home.
Hot chocolate prices in food service are more than 1,000% higher than when making it at home. For example, a cup of hotchocolate can be made at home for the equivalent of KSh18 (US$0.19) per serving while it can cost KSh200 (US$2.3) in acoffee shop.
Value creation along Kenya’s tea, coffee and cocoa value chain (KSh per kg) 2015
INTRODUCTION / EXECUTIVE SUMMARY / SECTORS / MARKET SIZE / KENYA / CONSUMERS / FAIRTRADE / ABOUT EUROMONITOR
HOT BEVERAGES MARKET IN KENYA: VALUE CREATION
Source: Euromonitor International from Africa Tea Brokers Ltd, UN Comtrade Database, ICCO, store audits, selected foodservice.Note: The price of a cup of instant coffee in food service is assumed to be the same as fresh coffee. Cocoa content assumed at 15%.
29
0
62
0
46
7
29
0
3,0
28
1,9
34
4,5
35
9,2
43
80
,00
0
21
,43
0
21
,43
0
11
1,0
00
Tea Fresh Coffee Instant Coffee Cocoa
Processed value (benchmark export price) Retail price Foodservice price

Euromonitor International for the Trade for Development Centre
CONSUMERS

Euromonitor International for the Trade for Development Centre
Remarkably, tea is more commonly consumed in Kenya than water.
34% drink on-the-go coffee at least once a month, but only 24% take tea and 19% hot chocolate drinks.
Tea is purchased weekly or monthly dependent on the size of the household with purchases of coffee and other hotbeverages less frequent. Super/hypermarkets are the usual channel of purchase while coffee purchases may be made aspecialist stores or at open markets.
5473%
52%
37%
Drink 3-5 cups of tea daily
Drink 1-2 cups of coffee daily
Never drink coffeeOlder consumers prefer tea while those under 35 years prefer coffee
Tea is the most popular drink for all ages
Black tea is favoured by all ages but younger consumers prefer tea
bags to loose tea.
50% drink tea or coffee out of home a couple of times a week.
Coffee is typically drunk in the morning or at work.
Cocoa is an in-home drink with consumption limited to once or
twice a week.
Source: Euromonitor International from consumer surveys conducted in November, 2016 (n=501)
3%
4%
11%
11%
41%
57%
58%
65%
72%
83%
94%
Cordials /…
Spirits
Wine
Beer
Carbonated drinks
Fruit juice
Cocoa
Coffee
Milk / Dairy
Water
Tea
Consumer survey(daily consumption)

55
Euromonitor International for the Trade for Development Centre
As heavy tea drinkers Kenyan’spurchase tea more frequently thanany other type of drink. Tea ispurchased on weekly basis by 17%of respondents while this figurereaches less than 10% for other hotbeverages. Nearly a third ofrespondents purchase tea severaltimes a month, whilst only about14% buy coffee and chocolate-basedhot beverages at least monthly.
Proximity to local services influences
purchasing with local convenience
stores the second most favoured
location for purchase of hot drinks of
all kinds.
INTRODUCTION / EXECUTIVE SUMMARY / SECTORS / MARKET SIZE / KENYA / CONSUMERS / FAIRTRADE / ABOUT EUROMONITOR
Supermarkets are the source of the majority of hot drink purchases
95%
52%
16%
18%
2%
9%
2%
95%
56%
23%
24%
4%
11%
1%
98%
57%
16%
21%
3%
10%
1%
Supermarket / hypermarket
Local convenience store
Open market
Specialist coffee or tea shop
From the internet
Direct from the producer
Other
Tea Coffee Cocoa
Source: Euromonitor International from consumer surveys conducted in November, 2016 (n=501)
CONSUMER SURVEY

56
Euromonitor International for the Trade for Development Centre
For both tea and coffee, quality and taste are key selection criteria
INTRODUCTION / EXECUTIVE SUMMARY / SECTORS / MARKET SIZE / KENYA / CONSUMERS / FAIRTRADE / ABOUT EUROMONITOR
Source: Euromonitor International from consumer surveys conducted in November, 2016 (n=501)
CONSUMER SURVEY
81%
78%
62%
50%
36%
Quality
Taste
Made in Kenya
Value for money
Popular brand
75%
72%
42%
41%
26%
Quality
Taste
Value for money
Popular brand
Packaging
67%
64%
37%
33%
25%
Taste
Quality
Popular brand
Value for money
Favoured by my kids
Top drivers of Hot Beverages Purchases in Kenya
As local tea brands dominate themarket and offer a wide assortmentand price points for every pocket, itcould be assumed that local teamanufacturers have proved to besuccessful in offering teas of highquality and taste.
Industry experts are howeversceptical whether the Kenyanconsumer is really knowledgeableabout quality or taste of coffee.
More consumers look for value formoney in coffee than in tea, which isin line with the average per kg pricefor coffee being 1.4 times higherthan tea in Kenya.
Consumers are more concernedabout the brand popularity in cocoaand similar products, thus mostprobably trusting more well-knownand international brands, i.e.Cadbury.
As powdered hot beverages arecommonly consumed by children,their opinion is also an importantcriteria.
Quality and good taste are mostcommon drivers of consumer choiceto buy tea
Quality, followed by taste, remainkey purchasing drivers in coffee
Taste is key in powdered hot drinks as the target consumers for these products are primarily children

57
Euromonitor International for the Trade for Development Centre
Tea Consumption Patterns
Tea is typically consumed at home, at work and infoodservice outlets throughout the day.
It is an occasional drink for some consumers atdifferent points in the day but lunch and before bedare the least favoured occasions for consumption.
Few consumers go to foodservice outlets expresslyto drink tea with 37% never purchasing a take-awaycup.
INTRODUCTION / EXECUTIVE SUMMARY / SECTORS / MARKET SIZE / KENYA / CONSUMERS / FAIRTRADE / ABOUT EUROMONITOR
Kenyans love tea and drink at least three cups of tea a day
Daily Tea Drinking Patterns (Number of Cups per Day)
Source: Euromonitor International from consumer surveys conducted in November, 2016 (n=501)
Tea Consumption Occasions and Frequency
Daily Tea Drinking Patterns
2%
29
%
65
%
41
%
54
%
55
%
58
%
32
%
51
%
42
%
38
%
11
%
2% 6
%
3%6%
2%
0% 1%
In the morningaround
breakfast
Between mealsduring the day
At lunch withor after food
At dinner withor after food
Before bed
None 1 cup 2 cups 3+ cups
CONSUMER SURVEY: TEA CONSUMPTION

58
Euromonitor International for the Trade for Development Centre
Favourite Tea Formats Top of Mind Tea Brands
Tea bags are preferred by 67% of consumers between 18-29 years while loose tea is favoured by 79% of 50-59 year olds.
For 80% of respondents quality and taste are the most important criteria when purchasing tea.
60% believe it is important to buy locally produced or “Made in Kenya” tea.
Value for money is a major purchasing criteria for about 50% of respondents.
Kericho Gold is the only brand that carries the Fairtrade logo but it is widely available across all channels.
Kericho Gold is popular among loose tea drinkers.
Loyalty is strong with half always buying the same brand of tea
INTRODUCTION / EXECUTIVE SUMMARY / SECTORS / MARKET SIZE / KENYA / CONSUMERS / FAIRTRADE / ABOUT EUROMONITOR
Convenience, quality and value for money influence tea purchasing
60%13%
3%
3%2%
5%
13%
Ketepa Kericho Gold
Fahari Ya Kenya Tea Melvins
Eden Tea None
Other
Source: Euromonitor International from consumer surveys conducted in November, 2016 (n=501)
CONSUMER SURVEY: TEA CONSUMPTION
62%
44%
25%
18%
18%
60%
46%
26%
18%
18%
Blackteabags
Looseblack tea
Instant tea
Specialtytea
Herbal tea
Total sample Daily tea drinkers

59
Euromonitor International for the Trade for Development Centre
31
%
43
%
78
%
63
% 73
%
61
%
51
%
20
% 34
%
24
%6%
4%
1% 2%
2%
2%
1%
1%
1%
1%
In the morningaround
breakfast
Between mealsduring the day
At lunch withor after food
At dinner withor after food
Before bed
None 1 cup 2 cups 3+ cups
Coffee lovers consistently favour this beverage regardless of location
Coffee is predominantly drunk only once or twice aweek with around one third of respondentsdrinking at least one cup of coffee every day.
Confirmed coffee lovers drink coffee with the samefrequency at home and at work and although thefrequency of visiting foodservice or take-awayoutlets is generally low in Kenya coffee is still afrequent choice among consumers.
INTRODUCTION / EXECUTIVE SUMMARY / SECTORS / MARKET SIZE / KENYA / CONSUMERS / FAIRTRADE / ABOUT EUROMONITOR
Less coffee is consumed on a daily basis than tea
Daily Coffee Drinking Patterns (Number of Cups per Day)
Source: Euromonitor International from consumer surveys conducted in November, 2016 (n=501)
Coffee Consumption Occasions and Frequency
Daily Coffee Drinking Patterns
30%
31%
4%
4%
4%
49%
39%
28%
20%
13%
8%
11%
26%
30%
17%
11%
13%
28%
32%
36%
2%
7%
14%
15%
31%
At home
At work
At restaurant
Going out to drinkcoffee
Buy a take-away cup
Daily/almost every day 1-2 times a week 1-2 times a month
Rarely/ Once every few months Never
CONSUMER SURVEY: COFFEE CONSUMPTION

60
Euromonitor International for the Trade for Development Centre
Favourite Coffee Formats Top of Mind Coffee Brands
Instant coffee dominates consumer choice despite being over twice the price of fresh ground coffee.
Quality and taste are the key purchasing criteria for 74% of consumers.
With a higher overall price, value for money in coffee is of greater importance to consumers than for tea.
Nescafé is the leading brand but Fairtrade-certified Dormans is a strong local brand with a good foothold in both instant and ground coffee and also sells at lower price points than Nescafé.
Loyalty to brand is strong with 57% often purchasing the same brand of coffee.
Preferences and purchase criteria are strongly held
INTRODUCTION / EXECUTIVE SUMMARY / SECTORS / MARKET SIZE / KENYA / CONSUMERS / FAIRTRADE / ABOUT EUROMONITOR
Younger consumers look to experiment and offer low brand loyalty
Source: Euromonitor International from consumer surveys conducted in November, 2016 (n=501)
22%
12%
3%
3%3%
3%
55%
Nestlé
Jacobs Douwe Egberts
Kraft Heinz
JM Smucker
Keurig Green Mountain
Starbucks
Others
CONSUMER SURVEY: COFFEE CONSUMPTION
83%
24%
11%
7%
6%
2%
86%
25%
13%
5%
7%
2%
Instant coffee
Fresh groundcoffee
Instantdecaffeinated
coffee
Freshdecaffeinated
coffee
Fresh coffeebeans
Coffee pods
Total sample Daily coffee drinkers

61
Euromonitor International for the Trade for Development Centre
Breakfast is a key drinking time for cocoa drinks
Cocoa based drinks are generally consumed athome or, with less frequency, at work.
It is not a popular drink in Kenya in a take-awayformat or in a restaurant.
Cocoa is most popular at breakfast time with 53%of respondents most likely to drink it at this time.Bedtime is also popular with 45% of respondentsliking a hot drink before bed.
INTRODUCTION / EXECUTIVE SUMMARY / SECTORS / MARKET SIZE / KENYA / CONSUMERS / FAIRTRADE / ABOUT EUROMONITOR
Cocoa based drinks are popular on an occasional basis
Daily Chocolate-based Hot Beverages Drinking Patterns (Number of Cups per Day)
Source: Euromonitor International from consumer surveys conducted in November, 2016 (n=501)
Chocolate-based Hot Beverages Consumption Occasions and Frequency
Daily Chocolate-based Hot Beverages Drinking Patterns
33%
16%
4%
2%
2%
42%
34%
19%
13%
9%
12%
15%
17%
15%
8%
11%
24%
37%
37%
32%
2%
13%
24%
33%
49%
At home
At work
At restaurant
Going out to drinkcocoa
Buy a take-away cup
Daily/almost every day 1-2 times a week 1-2 times a month
Rarely/ Once every few months Never
34
%
53
%
79
%
66
%
52
%
53
%
42
%
19
% 30
%
45
%
12
%
4%
2% 3%
3%
1% 1%
0%
0% 0%
In the morningaround
breakfast
Between mealsduring the day
At lunch withor after food
At dinner withor after food
Before bed
None 1 cup 2 cups 3+ cups
CONSUMER SURVEY: COCOA CONSUMPTION

62
Euromonitor International for the Trade for Development Centre
Favourite Flavoured Drinks Formats Top of Mind Other Hot Drink Brands
Chocolate flavoured drinks are marginally more popular than malt base drinks despite the higher price for chocolate.
Quality and taste are important but brand and trust in the brand quality are key as consumers focus on the quality of children’s consumption. A premium will be paid to ensure good nutritional value.
Cadbury Drinking chocolate is the most widely available brand but local brand Raha which mimics it sells at a much lower price.
Brand loyalty is high at 70% with a high reliance on the preference of children in the ultimate choice of brand and product.
Pricing is under least pressure among hot drinks for flavoured drinks
INTRODUCTION / EXECUTIVE SUMMARY / SECTORS / MARKET SIZE / KENYA / CONSUMERS / FAIRTRADE / ABOUT EUROMONITOR
Taste is important in keeping children happy as primary consumers
52%
4%3%
3%0%
29%
9%
Cadbury
Milo
Raha
Choco Primo
Cadburys and Horlicks
None
Other
59%
59%
11%
2%
68%
65%
16%
4%
Instant hot chocolatepowder
Cocoa powder
Chocolate flavouredmalt drink
Other flavour
Total sample
Daily powder beverages drinkersDaily powdered beverages drinkers
Source: Euromonitor International from consumer surveys conducted in November, 2016 (n=501)
CONSUMER SURVEY: COCOA CONSUMPTION

Euromonitor International for the Trade for Development Centre
Expanding foodservice and office sectors fuels growth in sales
63
While retail is the dominant channel for sales of alltypes of hot beverages, increasing out-of-home, homedelivery services and on-the-go purchasing has led toCAGR 4.1% sales increase through foodservice outlets.Coffee and other hot drinks are the fastest growingcategories in foodservice.
Growth in foodservice is driven by the growing numberof established and new entrants in the chained andindependent coffee shops, fast food outlets, hotels andcatering companies.
Coffee drives food service sales
86% 14%87% 13%89% 11%
Retail Foodservice & Institutions
Tea
Coffee
Other Hot Drinks
Channel sales by drink type
Tea and coffee are the most commonly consumed hotdrinks with wide availability in all establishments.
57% of establishments prefer tea bags, 14% preferloose tea but only 12% purchase multiple formats oftea. 85% of coffee purchased is instant with freshground coffee or beans only present in 10% ofestablishments.
Vending machines are used in some larger institutionslike hospitals but pod coffee machines are rare.
Tea bags and instant coffee dominate Consumption: Average grams per person per month
41
26
52
23
38
47
25
50
23
4340
3740
Corporateoffices
Publicinstitutions
Healthcareproviders
Faith-basedorganisations
Average
Tea Coffee Cocoa
Source: Euromonitor International from pulse interviews conducted in November and December, 2016 (n=43)
INTRODUCTION / EXECUTIVE SUMMARY / SECTORS / MARKET SIZE / KENYA / CONSUMERS / FAIRTRADE / ABOUT EUROMONITOR
FOODSERVICE AND INSTITUTIONAL CHANNELS IN KENYA
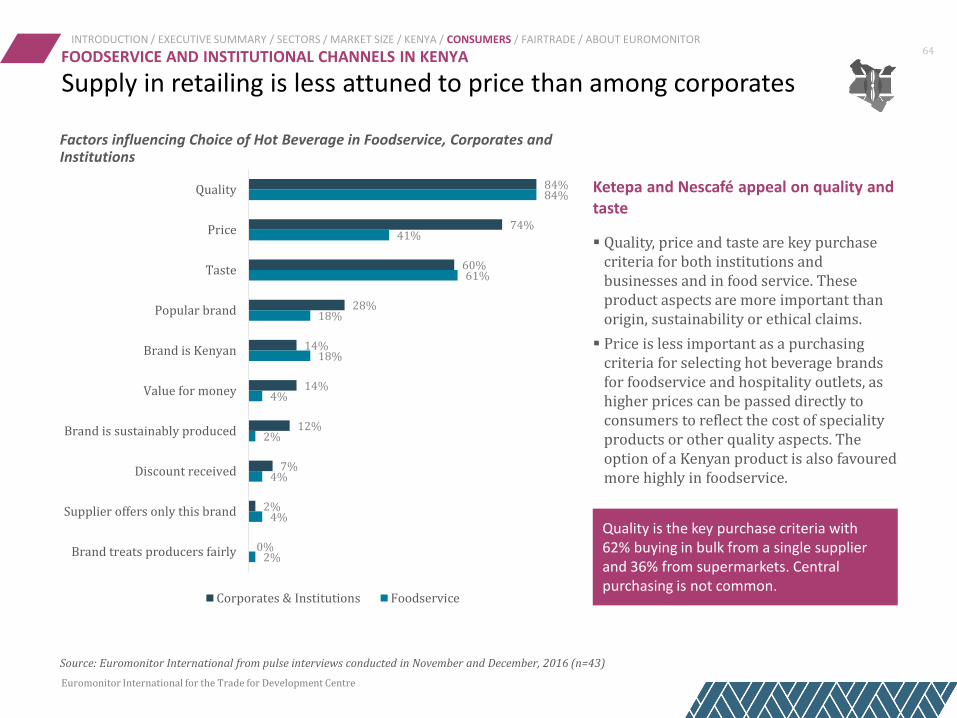
Euromonitor International for the Trade for Development Centre
Supply in retailing is less attuned to price than among corporates
64INTRODUCTION / EXECUTIVE SUMMARY / SECTORS / MARKET SIZE / KENYA / CONSUMERS / FAIRTRADE / ABOUT EUROMONITOR
Factors influencing Choice of Hot Beverage in Foodservice, Corporates and Institutions
Quality, price and taste are key purchase criteria for both institutions and businesses and in food service. These product aspects are more important than origin, sustainability or ethical claims.
Price is less important as a purchasing criteria for selecting hot beverage brands for foodservice and hospitality outlets, as higher prices can be passed directly to consumers to reflect the cost of speciality products or other quality aspects. The option of a Kenyan product is also favoured more highly in foodservice.
Ketepa and Nescafé appeal on quality and taste
Quality is the key purchase criteria with 62% buying in bulk from a single supplier and 36% from supermarkets. Central purchasing is not common.
Source: Euromonitor International from pulse interviews conducted in November and December, 2016 (n=43)
84%
74%
60%
28%
14%
14%
12%
7%
2%
0%
84%
41%
61%
18%
18%
4%
2%
4%
4%
2%
Quality
Price
Taste
Popular brand
Brand is Kenyan
Value for money
Brand is sustainably produced
Discount received
Supplier offers only this brand
Brand treats producers fairly
Corporates & Institutions Foodservice
FOODSERVICE AND INSTITUTIONAL CHANNELS IN KENYA

Euromonitor International for the Trade for Development Centre
ASSESSMENT OF FAIRTRADE CERTIFICATION

Euromonitor International for the Trade for Development Centre
Fairtrade is well represented among smallholders and estates in the region and substantial volumes of tea and coffee production is Fairtrade certified. This has not, however, translated into large volumes sold of certified tea and coffee. Poor presence in retail with only two local brands has translated into low market share for Fairtrade-certified hot drinks. Consumers in Kenya were also generally found to lack knowledge of the label although they support many of the values underpinning Fairtrade, creating opportunities which can be exploited through educational campaigns.
Production volumes of Fairtrade certified tea & coffee, Kenya 2015
Local Sales of Fairtrade certified hot drinks, Kenya
2015
Retail RSP sales of Fairtrade certified hot drinks, Kenya 2015
207,338 t 166 t KSh399.4 mn
Source: Euromonitor Passport Database
INTRODUCTION / EXECUTIVE SUMMARY / SECTORS / MARKET SIZE / KENYA / CONSUMERS / FAIRTRADE / ABOUT EUROMONITOR
FAIRTRADE IN KENYA
Ethical narratives remain the preserve of smaller, niche brands

67
Euromonitor International for the Trade for Development Centre
Fairtrade branding is small but takes an increasing share of sales
Retail sales by value of Fairtrade certified hot drinksexpanded by 39.5% in absolute terms between 2011 and2015 to reach KSh399.4 million (US$4.1 million).
Local competitors are producing high quality, ethicallysourced products in attractive packaging to attract moreaffluent and selective purchasers with some success.Premiumisation of ethically sourced products drivesgrowth in value in this market.
Fairtrade sales in Kenya are estimated at 165.6 tonnes,up 13.9% in absolute terms since 2011. Fairtradecomprises 6.1% of the total retail market by volume.
Local brands in coffee such as Gold Crown BeveragesKenya, Dormans Coffee Group and Vava Coffee arecertified. Imported certified brand Percol was also foundin one store.
In tea, Kenya Tea Development Authority supportscertification with many of its grower cooperatives andprocessing factories fully certified by Fairtrade. Certifiedproducts are sold locally under brands such as KerichoGold.
INTRODUCTION / EXECUTIVE SUMMARY / SECTORS / MARKET SIZE / KENYA / CONSUMERS / FAIRTRADE / ABOUT EUROMONITOR
Source: Euromonitor InternationalNote: Value provided in local currency at retail sales price RSP; fixed exchange rate; historic current prices, forecast constant 2015 prices
FAIRTRADE: NICHE ETHICAL CONSUMERISM IN KENYA
21,798
22,225
22,667
23,320
24,011
145.4
156.8
163.0
164.5
165.6
10.4%
7.8%
4.0%
0.9% 0.7%
2011 2012 2013 2014 2015
13.2
14.8
15.816.9
18.2
0.3
0.3 0.40.4
0.4
19.9%
16.0%
6.9%5.7% 6.4%
2011 2012 2013 2014 2015
Retail Volume Sales of Hot Drinks 2011-2015 tonnes Retail RSP Sales of Hot Drinks 2011-2015 KSh billion
Fairtrade Certified vs Conventional Hot Drinks, Fairtrade YOY % Growth

68
Euromonitor International for the Trade for Development Centre
Hot drinks shelf facings with Fairtrade certification as proportion of total tea, coffee and powdered hot drinks facings
Certification is not a usual feature in Kenyan shelves
100%
13%
7%
2%
1%
Specialist coffee shop
Small grocer
Health food specialist
Hypermarket
Supermarket
The presence of ethical labelling in stores across Kenya isvery low. Specialist coffee shops which trade on thepromise of ethical sourced ingredients are the only placewhere stock purchasing is from certified sources.
Fairtrade certification featured only on three brands thatare widely stocked: local brands Kericho Gold includingKericho Gold Attitude Teas and Dormans as well asimported brand Percol.
In hypermarkets operated by Nakumatt Holdings, forexample, from a selection of 1,000 hot drinks facings only38 were from certified sources. Similarly, Fairtradecertified hot beverage brands were not prevalent onsupermarket shelves, and were encountered in only twoout of nine supermarkets visited in Nairobi.
Staff in store also have a very low level of recognition ofFairtrade or other ethical certifications.
Products carrying ethical labelling are also most likely tocome from specialist ingredients from varied origins and,as a result, sell at a premium.
Low presence of products from ethical sources on retail shelves
INTRODUCTION / EXECUTIVE SUMMARY / SECTORS / MARKET SIZE / KENYA / CONSUMERS / FAIRTRADE / ABOUT EUROMONITOR
Source: Euromonitor International from store audits conducted in November and December, 2016
FAIRTRADE: PENETRATION OF CERTIFIED BRANDS IN KENYA

69
Euromonitor International for the Trade for Development Centre
Promotion of Fairtrade should focus on under 25 year olds
Consumers over 35 years generally have a greaterawareness of the underlying concepts of Fairtrade thanyounger consumers.
Consumers under 30 years consistently show a lowerknowledge of the key values associated with Fairtrade,particularly about the more popular concept ofenvironmental sustainability to which they would bewider exposed to online.
Awareness of UTZ and Rainforest Alliance is very low.
INTRODUCTION / EXECUTIVE SUMMARY / SECTORS / MARKET SIZE / KENYA / CONSUMERS / FAIRTRADE / ABOUT EUROMONITOR
Top five associations with Fairtrade by age segment
Fair price to producers is most widely known concept Older consumers are more aware than younger
50%
38%
50%50%
75%
42%42%
58%50%
73%
62%
38%
48%41%
69%
37%44%
52%56%
70%
33%
50%
38%46%
63%
27%
42%33%36%
55%
Environmental sustainabilityGood qualityEmpowerment ofsmallholder farmers
Equal trading relationshipsFair price to producers
Awareness of most recognised Fairtrade concept, “Fairprice to producers”, is highest among cocoa drinkers(83%) than among coffee (59%) or tea drinkers (65%) aswell as among older consumers.
One of the leading Cadbury chocolate bars in Kenyacarries the Fairtrade logo which is thus stronglyassociated with the Cadbury brand at present.
Overall awareness levels of Fairtrade show littledifference between coffee (43%) and tea drinkers (36%)
Source: Euromonitor International from consumer surveys conducted in November, 2016 (n=501)
FAIRTRADE: CONSUMERS PERCEPTION
18 - 24 25 – 29 30 – 34 35 – 39 40 – 49 50 - 59

70
Euromonitor International for the Trade for Development Centre
INTRODUCTION / EXECUTIVE SUMMARY / SECTORS / MARKET SIZE / KENYA / CONSUMERS / FAIRTRADE / ABOUT EUROMONITOR
Kenyans express strong concern for ethical business activity
While about 90% of all respondentsagree that ethical farming, action onchild labour and fair payment tofarmers will help increase thequality of their lives, theassociations with the values ofFairtrade needs to be expandedamong Kenyan consumers.
The challenge is to convert suchpositive Fairtrade attitudes intopurchasing practices.
While consumers are committed tobuying ethically produced productsthey are much less committed tobuying local or organic products.
Over 92% of all respondentsexpressed strong concerns aboutthe protection of nature and theenvironment as well as climatechange.
However, about a third (37%) aresceptical about protecting theenvironment at the expense of locallivelihoods.
95% 95%94%
4% 4%
4%
1% 1%2%
Farmers andworkers who
make theproducts I use
should be treatedfairly and get paid
the right
More needs to bedone to eradicate
child labour
Investment inlocal
communities willhelp to uplift
them
85%
44%34%
14%
6%
21%27%
51%
9%
36% 39% 35%
The product Ibuy must followethical principles
and guidelines
The product I buymust be organic
The products Ibuy should come
from Kenya
Importedproducts have a
better qualitythan localproducts
95% 94% 92%
37%
4% 3%3%
35%
1% 3% 5%
28%
We need to livein harmony with
our naturalenvironment
It is importantthat we dosomething
about climatechange
People need tomake sacrifices
to help theenvironment
People worrytoo much about
theenvironment
when comparedto the
livelihoods oflocal community
Source: Euromonitor International from consumer surveys conducted in November, 2016 (n=501)
FAIRTRADE: CONSUMERS PERCEPTION
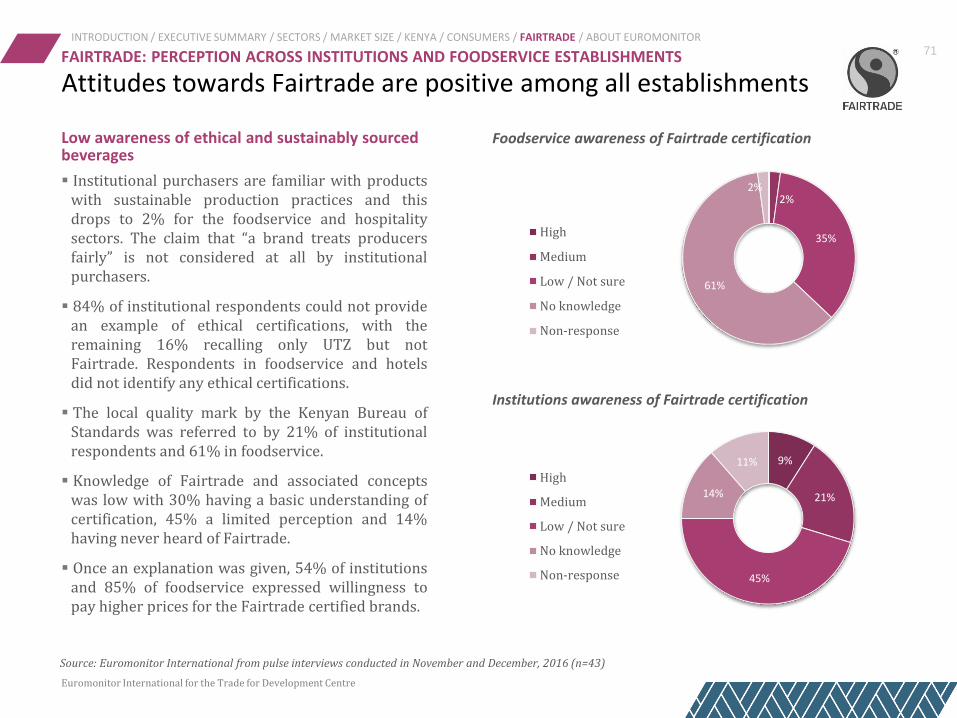
71
Euromonitor International for the Trade for Development Centre
Low awareness of ethical and sustainably sourced beverages
Institutional purchasers are familiar with productswith sustainable production practices and thisdrops to 2% for the foodservice and hospitalitysectors. The claim that “a brand treats producersfairly” is not considered at all by institutionalpurchasers.
84% of institutional respondents could not providean example of ethical certifications, with theremaining 16% recalling only UTZ but notFairtrade. Respondents in foodservice and hotelsdid not identify any ethical certifications.
The local quality mark by the Kenyan Bureau ofStandards was referred to by 21% of institutionalrespondents and 61% in foodservice.
Knowledge of Fairtrade and associated conceptswas low with 30% having a basic understanding ofcertification, 45% a limited perception and 14%having never heard of Fairtrade.
Once an explanation was given, 54% of institutionsand 85% of foodservice expressed willingness topay higher prices for the Fairtrade certified brands.
INTRODUCTION / EXECUTIVE SUMMARY / SECTORS / MARKET SIZE / KENYA / CONSUMERS / FAIRTRADE / ABOUT EUROMONITOR
Foodservice awareness of Fairtrade certification
Institutions awareness of Fairtrade certification
Attitudes towards Fairtrade are positive among all establishments
9%
21%
45%
14%
11%
High
Medium
Low / Not sure
No knowledge
Non-response
2%
35%
61%
2%
High
Medium
Low / Not sure
No knowledge
Non-response
Source: Euromonitor International from pulse interviews conducted in November and December, 2016 (n=43)
FAIRTRADE: PERCEPTION ACROSS INSTITUTIONS AND FOODSERVICE ESTABLISHMENTS

Euromonitor International for the Trade for Development Centre
ABOUT EUROMONITOR INTERNATIONAL

73
Euromonitor International for the Trade for Development Centre
What is Euromonitor International
Our Services
Syndicated Market Research
Custom Research and Consulting
Expansive Network
On the ground researchers in 80 countries
Complete view of the global marketplace
Cross-comparable data across every market
Our Expertise
Consumer trends & lifestyles
Companies & brands
Product categories & distribution channels
Production & supply chains
Economics & forecasting
Comparable data across markets
ABOUT EUROMONITOR INTERNATIONALINTRODUCTION / EXECUTIVE SUMMARY / SECTORS / MARKET SIZE / KENYA / CONSUMERS / FAIRTRADE / ABOUT EUROMONITOR

74
Euromonitor International for the Trade for Development Centre
74
Euromonitor International network and coverageABOUT EUROMONITOR INTERNATIONAL
INTRODUCTION / EXECUTIVE SUMMARY / SECTORS / MARKET SIZE / KENYA / CONSUMERS / FAIRTRADE / ABOUT EUROMONITOR

CONTACT DETAILS
Protea HirschelProject [email protected]: +27 (0) 21 524 3000
Quinton [email protected]: +27 (0) 21 524 3000
Sarah McArthurConsulting Business Development [email protected]: +44 (0) 207 251 8024
Simone SfranagoAccount [email protected]: +44 (0) 207 251 8024