hospital authority convention 2016 use of … authority convention 2016 use of extracorporeal...
TRANSCRIPT

Hospital Authority Convention 2016
Use of Extracorporeal Membrane
Oxygenation in Respiratory Failure
Yan Wing Wa
Department of Intensive Care
Pamela Youde Nethersole Eastern Hospital
3 May 2016

2


Principles of ECMO
Temporary support the failed lung
Not suitable for irreversible lung failure
Less suitable for the lung condition required long time
to heal (complication risk > benefit)
Buy time for the lung to recover
Keep patient alive
Create an optimal condition for the lung to heal
Avoid complications related to ECMO

5
Zapol, : (NIH Trial) (VA ECMO +ventilation and ventilation only) Severe ARF. A
Randomized Prospective Study.
JAMA 1979:242:2193-6
90 patients from across the US between 1974 and 1977.
No benefit shown with survival of <10% in both groups
Issues with the study: Primitive ECMO design
Limited experience with ECMO and IPPV
During ECMO, lungs were not put to rest
High bleeding complications

Morris et al. PC-IRV vs Extracorporeal CO2 Removal
Am J Respir Crit Care Med 1994;149:295-305
40 patients with severe ARDS enrolled
33% survival in 21 patients ECCO2R + LFPPV
42% survival in 19 patients PCIRV
P = 0.8
7/19 cases on ECCO2R with bleeding resulting in premature discontinuation of Rx
High pressure ventilation used before and ECCO2R with peak inspiratory pressure 45-50cm H2O

177 UK patients, aged 18-65 years
Randomly allocated
Consideration for treatment by ECMO or to receive conventional management
Survival to 6 months without disability
63% (57/90) in the group considered for treatment by ECMO
47% (41/87) in the group of conventional management
Relative risk 0.69 (0.05-0.97) & p=0.03
No. needed to save one life without disability is 6
Lancet 2009, 374:1351-63

ECMO for 2009 Influenza A(H1N1)
Acute Respiratory Distress Syndrome The Australia and New Zealand Extracorporeal Membrane Oxygenation (ANZ ECMO) Influenza Investigators
JAMA. 2009;302(17):1888-1895. Published online October 12, 2009(doi:10.1001/jama.2009.1535)
During winter 2009 (1 June 2009 to 31 August 2009), Australia
& New Zealand ICUs
68(34%) required ECMO out of 133 patients with IPPV
For patients given ECMO
48/68 (71%) survived ICU
32/68 (47%) survived hospital
16/68 (24%) still in hospital
6/68 (9%) still in ICU
14/68 (21%) died

Referral to an ECMO center and mortality among
patients with severe 2009 H1N1 – UK Study JAMA. 2011;306(15):doi:10.1001/jama.2011.1471
Cohort study involving 4 adult ECMO centers 80 ECMO referred patients: H1N1 with severe ARDS,
referred, accepted and transferred
69(86.3%) actually received ECMO therapy
22(27.5%) died
Hospital mortality Individual matching: 23.7% vs 52.5%, RR 0.45, p=0.006
Propensity score: 24.0% vs 46.7%, RR 0.51, p=0.008
GenMatch matching: 24.0% vs 50.7%, RR 0.47, p=0.001
Number needed to refer to save 1 life is 4

International Summary - January, 2016
Pediatric Respiratory (> 30 days and < 18 years)
Annual Respiratory Pediatric Runs
0
100
200
300
400
500
600
Count 108 139 142 188 207 210 209 229 215 198 201 202 210 240 239 285 247 289 333 455 382 411 472 493 486 445
1990 1991 1992 1993 1994 1995 1996 1997 1998 1999 2000 2001 2002 2003 2004 2005 2006 2007 2008 2009 2010 2011 2012 2013 2014 2015
Pediatric Respiratory Runs by Year
Annual Runs No. Survived % Survived
AverageRun Time
LongestRun TimeCumulative Runs
20<=1986 30%6182 45020
121987 50%6195 59532
381988 34%13245 64870
501989 58%29215 612120
1081990 45%49268 853228
1391991 53%73293 1,256367
1421992 49%69298 933509
1881993 53%99285 1,144697
2071994 58%121287 1,156904
2101995 52%109282 1,3721,114
2091996 60%125295 1,4831,323
2291997 61%139278 1,2581,552
2151998 59%127251 1,0151,767
1981999 61%120247 1,3321,965
2012000 54%108265 2,4372,166
2022001 48%96240 2,2392,368
2102002 62%130229 1,1082,578
2402003 60%144227 8812,818
2392004 59%140234 1,2223,057
2852005 54%154241 1,2803,342
2472006 53%130268 1,3263,589
2892007 56%163255 1,3093,878
3332008 53%176251 1,9874,211
4552009 56%257287 2,9684,666
3822010 59%226268 2,1405,048
4112011 59%242280 2,4655,459
4722012 62%293249 2,7815,931
4932013 62%305280 3,0866,424
4862014 62%302257 1,9326,910
4452015 60%267283 2,4217,355
Run time in hours. Survived = survival to discharge or transfer based on number of runs
Page 5 of 26(C) 2015 Extracorporeal Life Support Organization
International Summary - January, 2016
Adult Respiratory (18 years and over)
Annual Respiratory Adult Runs
0
200
400
600
800
1000
1200
1400
1600
1800
2000
Count 20 15 25 35 72 70 95 92 97 82 112 93 93 117 117 150 121 154 200 493 536 672 952 1442 1899 1568
1990 1991 1992 1993 1994 1995 1996 1997 1998 1999 2000 2001 2002 2003 2004 2005 2006 2007 2008 2009 2010 2011 2012 2013 2014 2015
Adult Respiratory Runs by Year
Annual Runs No. Survived % Survived
AverageRun Time
LongestRun TimeCumulative Runs
11986 0%016 161
11987 100%1300 3002
51988 20%1189 3307
21989 50%1234 3799
201990 50%10197 67129
151991 33%5387 1,24644
251992 56%14260 1,08369
351993 54%19299 1,326104
721994 49%35245 788176
701995 57%40199 1,357246
951996 46%44178 826341
921997 45%41242 981433
971998 47%46212 1,238530
821999 48%39206 803612
1122000 55%62211 1,308724
932001 59%55231 1,417817
932002 56%52195 1,942910
1172003 60%70214 2,0351,027
1172004 52%61208 1,1421,144
1502005 49%74198 1,2201,294
1212006 40%48255 5,0141,415
1542007 52%80227 2,7501,569
2002008 52%104195 1,5961,769
4932009 58%288258 3,0182,262
5362010 59%317247 1,6632,798
6722011 59%394255 2,5543,470
9522012 57%544254 6,2484,422
1,4422013 60%867280 6,7455,864
1,8992014 61%1,154293 3,2887,763
1,5682015 57%886263 4,2729,331
Run time in hours. Survived = survival to discharge or transfer based on number of runs
Page 8 of 26(C) 2015 Extracorporeal Life Support Organization

Respiratory ECMO in Hong Kong
0
10
20
30
40
50
60
70
2009 2010 2011 2012 2013 2014 2015
Died
Survived
Survival rate 72.1%

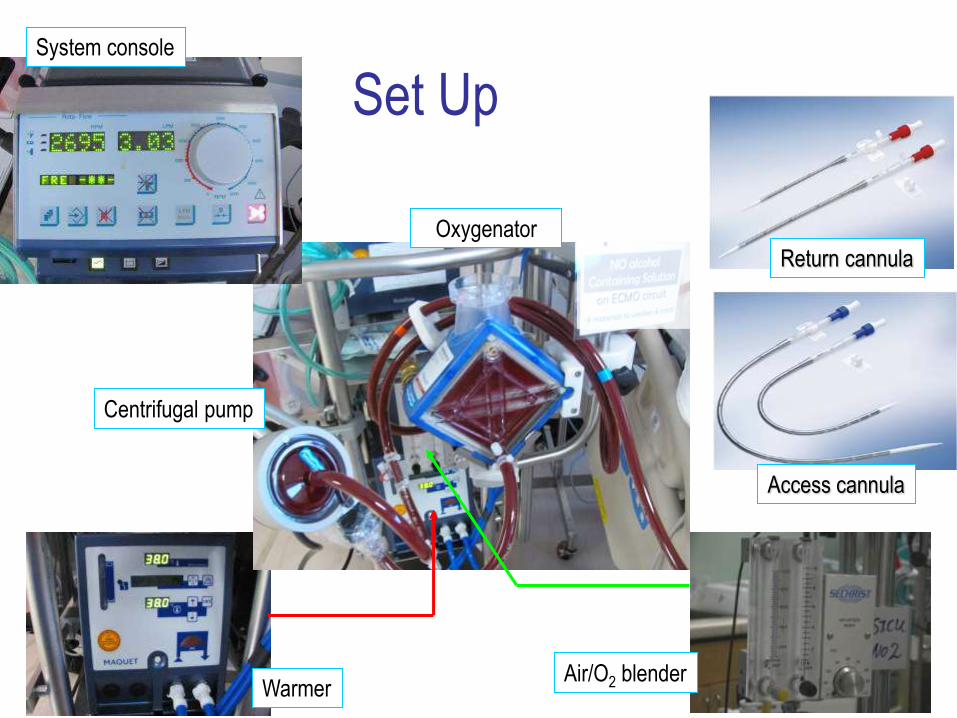
Air/O2 blender
Centrifugal pump
Warmer
Oxygenator
System console
Access cannula
Return cannula
Set Up

Types of ECMO
Bad lung
good Heart
Good lung
Bad heart
Bad lung
Bad heart
V-V X X
V-A X
V-V ECMO
V-A ECMO

International Summary - January, 2016
Adult Respiratory Runs by Diagnosis
Total Runs Survived % SurvivedAvg Run Time Longest Run Time
751Viral pneumonia 66%495321 3208
1,239Bacterial pneumonia 61%760257 3288
190Aspiration pneumonia 64%122239 2634
445ARDS, postop/trauma 56%251253 1993
778ARDS, not postop/trauma 54%420311 6248
1,597Acute resp failure, non-ARDS 56%897269 4527
4,331Other 56%2,407239 6745
Run time in hours. Survived = survival to discharge or transfer based on number of runs
Adult Respiratory Support Mode
Cumulative Past Year
VV
VVDL
VA
Not Collected
VV-VA
VVDL+V
VA-VV
VA+V
Other
VVA
VV
VVDL
VA
Unknown
VV-VA
VA-VV
VA+V
Other
VVA
VVDL+V
Total Runs Survived % SurvivedAvg Run Time Longest Run Time
Adult Respiratory Support Mode Details
4,855VV 59%2,852255 5014
2,337VVDL 65%1,521279 4272
981VA 45%444187 6745
516Not Collected 51%261231 1525
217VV-VA 28%61423 3018
123VVDL+V 66%81394 4527
115VA-VV 52%60326 1521
73VA+V 42%31185 2308
66Other 48%32359 6248
48VVA 19%9333 1993
Run time in hours. Survived = survival to discharge or transfer based on number of runs
Page 9 of 26(C) 2015 Extracorporeal Life Support Organization
ECLS Registry Report
International Summary
Extracorporeal Life Support Organization2800 Plymouth Road
Building 300, Room 303Ann Arbor, MI 48109January, 2016
Overall Outcomes
Centers
Survived ECLSTotal Patients Survived to DC or Transfer
Neonatal
28,723Respiratory 24,155 84% 21,274 74%
6,269Cardiac 3,885 62% 2,599 41%
1,254ECPR 806 64% 514 41%
Pediatric
7,210Respiratory 4,787 66% 4,155 58%
8,021Cardiac 5,341 67% 4,067 51%
2,788ECPR 1,532 55% 1,144 41%
Adult
9,102Respiratory 5,989 66% 5,254 58%
7,850Cardiac 4,394 56% 3,233 41%
2,379ECPR 948 40% 707 30%
51,837 42,94773,596Total 70% 58%
Centers by Year
0
50
100
150
200
250
300
350
0
1000
2000
3000
4000
5000
6000
7000
8000
Count 83 86 98 111 111 112 115 112 115 111 114 115 118 115 117 128 130 133 148 161 178 194 232 253 289 298
Cases 1644 1775 1933 1910 1879 1876 1868 1743 1720 1722 1859 1855 1906 1971 1907 2182 2342 2561 2797 3255 3419 3933 4877 5878 6962 6177
1990 1991 1992 1993 1994 1995 1996 1997 1998 1999 2000 2001 2002 2003 2004 2005 2006 2007 2008 2009 2010 2011 2012 2013 2014 2015
Page 1 of 26(C) 2015 Extracorporeal Life Support Organization
International Summary - January, 2016
Neonatal Respiratory Runs by Diagnosis
Total Runs Survived % SurvivedAvg Run Time Longest Run Time
7,584CDH 51%3,865256 2549
8,915MAS 94%8,345133 1327
5,011PPHN/PFC 77%3,862156 1908
1,556RDS 84%1,307136 1093
2,884Sepsis 73%2,101143 1200
385Pneumonia 58%223249 1002
135Air Leak Syndrome 74%100169 979
2,669Other 61%1,623185 1843
Run time in hours. Survived = survival to discharge or transfer based on number of runs
Neonatal Respiratory Support Mode
Cumulative Past Year
VA
VVDL
VA+V
VV-VA
VVDL+V
VV
Unknown
VA
VVDL
VVVVDL+V
VV-VA
VA+V
Total Runs Survived % SurvivedAvg Run Time Longest Run Time
Neonatal Respiratory Support Mode Details
19,465VA 71%13,748182 2549
5,913VVDL 84%4,984150 1908
1,417VA+V 72%1,027182 1176
846VV-VA 62%522246 1229
755VVDL+V 80%601157 682
600VV 75%451164 1227
76Unknown 63%48178 1072
37VA-VV 68%25281 956
28Other 68%19235 956
2VVA 50%198 158
Run time in hours. Survived = survival to discharge or transfer based on number of runs
Page 3 of 26(C) 2015 Extracorporeal Life Support Organization
Adults, 18 years and over

VV & VV-DL ECMO
Dual Lumen ECMO Cannula
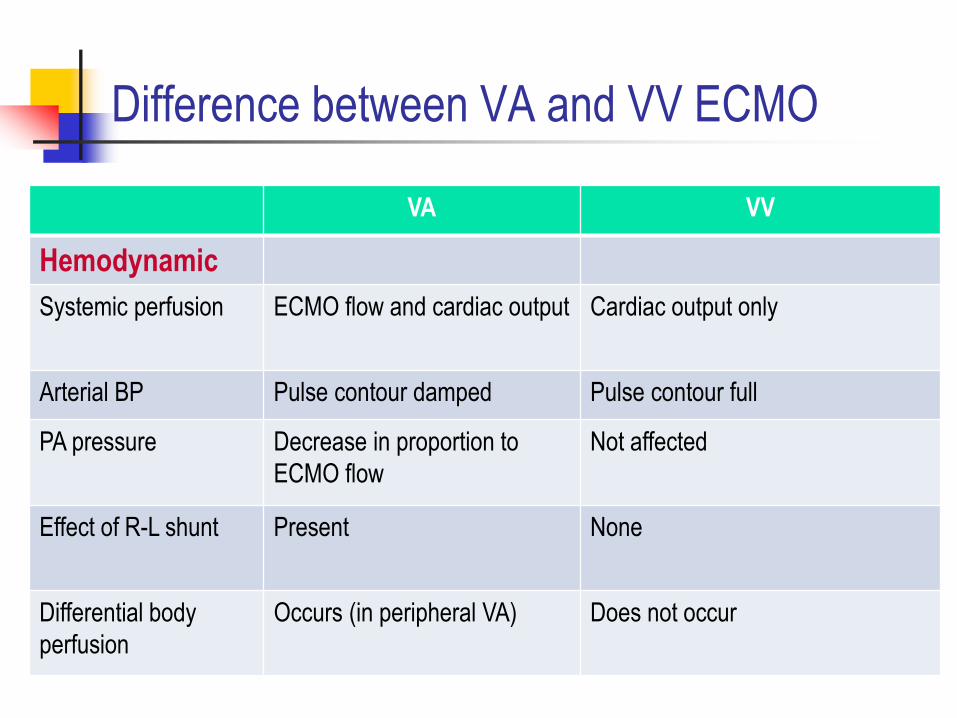
Difference between VA and VV ECMO
VA VV
Hemodynamic
Systemic perfusion ECMO flow and cardiac output Cardiac output only
Arterial BP Pulse contour damped Pulse contour full
PA pressure Decrease in proportion to
ECMO flow
Not affected
Effect of R-L shunt Present None
Differential body
perfusion
Occurs (in peripheral VA) Does not occur
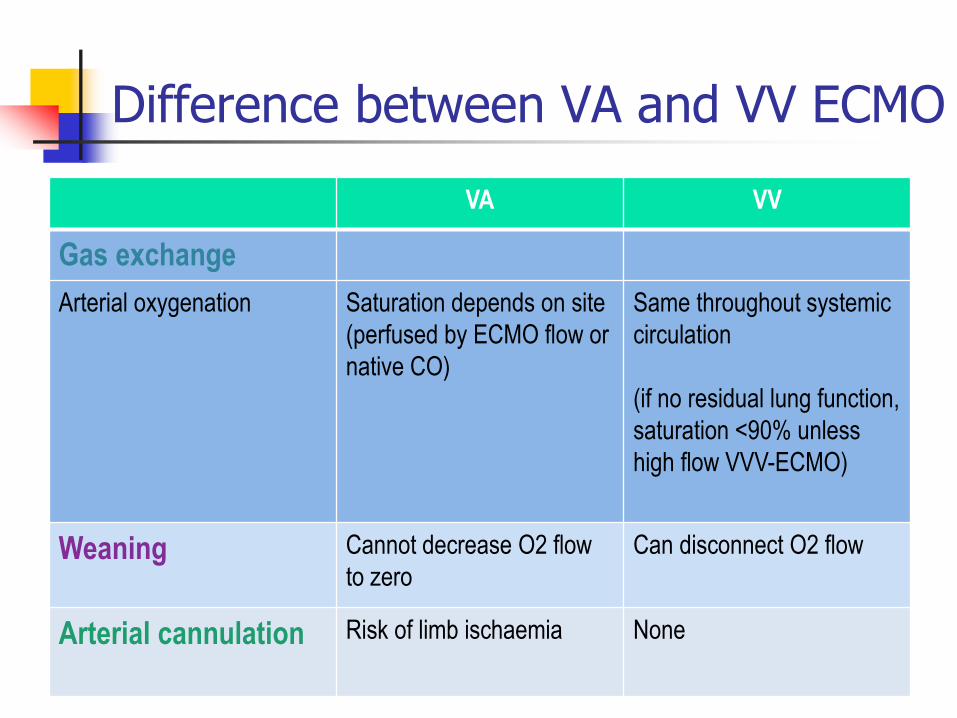
VA VV
Gas exchange
Arterial oxygenation Saturation depends on site
(perfused by ECMO flow or
native CO)
Same throughout systemic
circulation
(if no residual lung function,
saturation <90% unless
high flow VVV-ECMO)
Weaning Cannot decrease O2 flow
to zero
Can disconnect O2 flow
Arterial cannulation Risk of limb ischaemia None
Difference between VA and VV ECMO
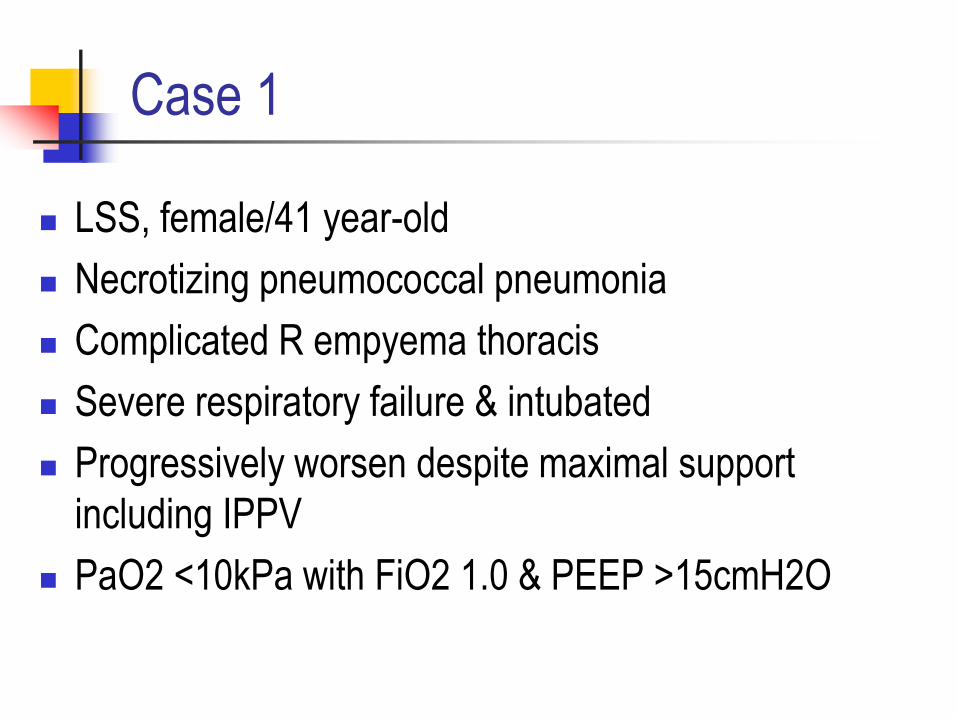
Case 1
LSS, female/41 year-old
Necrotizing pneumococcal pneumonia
Complicated R empyema thoracis
Severe respiratory failure & intubated
Progressively worsen despite maximal support
including IPPV
PaO2 <10kPa with FiO2 1.0 & PEEP >15cmH2O

On admission After intubation

On ECMO

LSS, F/41
VV-ECMO was started
R chest drain, pus drainage was good initially
Later blocked by fibrin
Urokinase locally instilled to R chest drain
Developed massive hemoptysis two days later
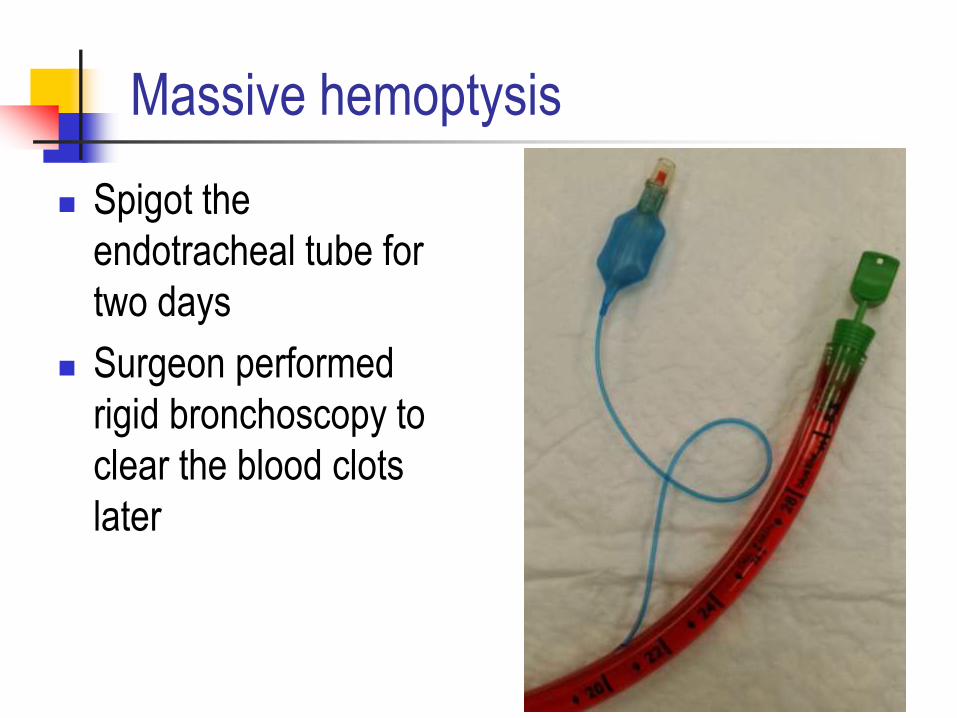
Massive hemoptysis
Spigot the
endotracheal tube for
two days
Surgeon performed
rigid bronchoscopy to
clear the blood clots
later
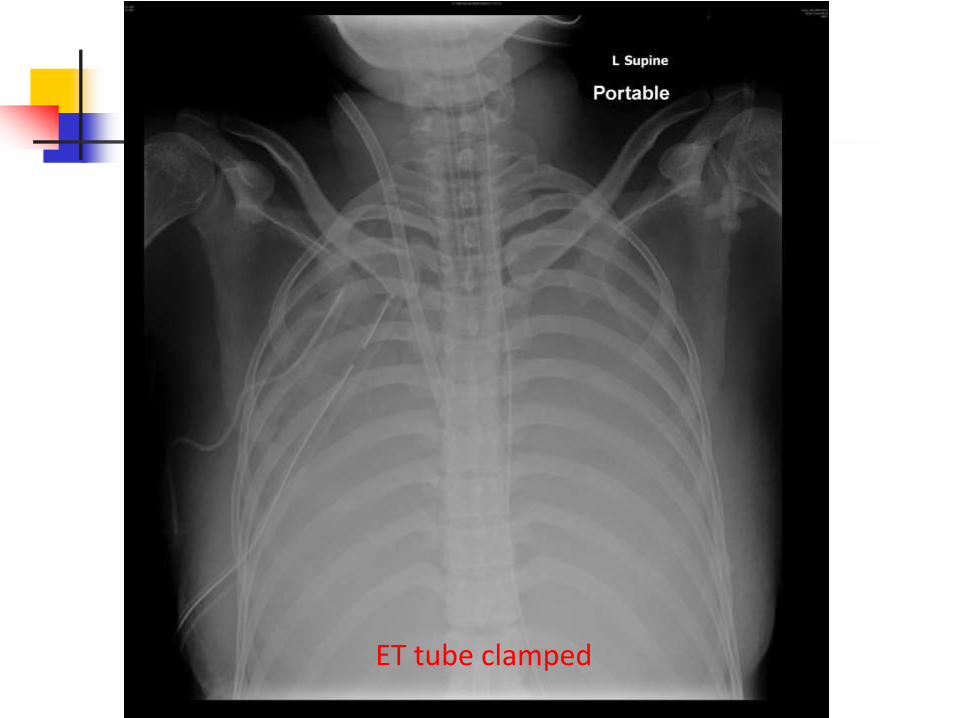
ET tube clamped

Rigid bronchoscopy record

Immediate post bronchoscopy

LSS, F/41
On day 26, hemodynamics stabilized but oxygenation remained very poor
Patient was put on “awake ECMO”, i.e. extubated the patient & off mechanical ventilation
Gradually patient’s oxygenation improved
Weaned off ECMO on day 35
Discharged from ICU on day 39
Discharged from hospital on day 77
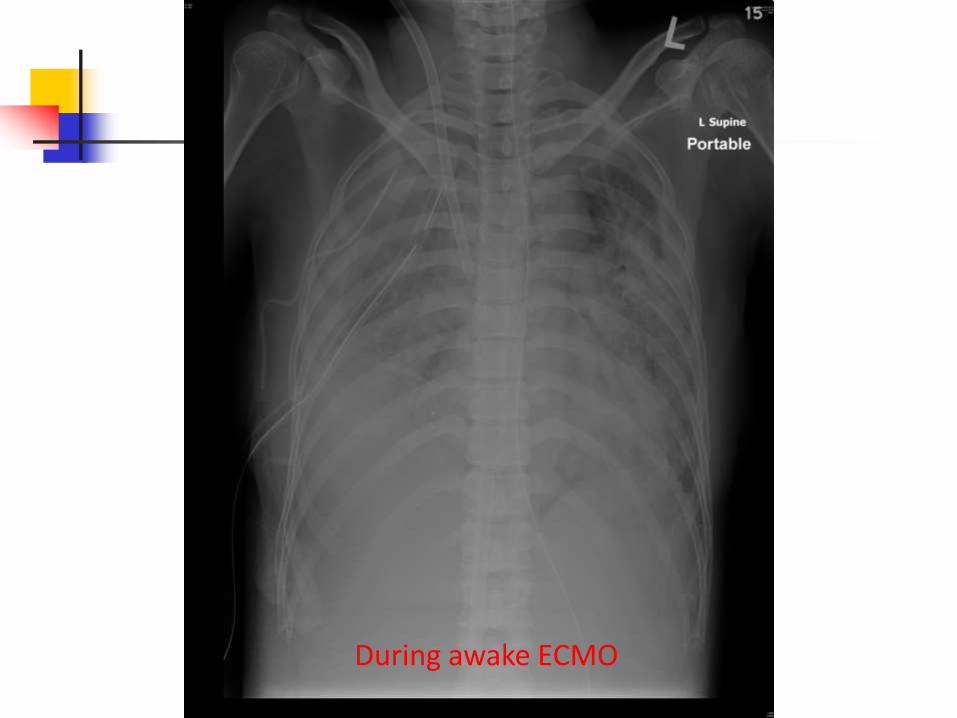
During awake ECMO

After decanulation

ICU discharge

Hospital discharge

FU at OPD 5 months later

FU at OPD 8 months later

Awake ECMO
Body saturation supported by ECMO only
No intubation
Improve patient’s comfort
Easy to monitor neurological status
No ventilator associated lung injury
Already having pneumothorax with persistent gas leak
No ventilator associated pneumonia
Immunocompromised patient
Patient waiting for transplant
Allow patient to cough but needs
A conscious and cooperative patient


37


Complications of ECMO
Vessel damage during insertion
Unidentified heart failure
Bleeding
Circuit thrombosis
Oxygenator failure
Haemolysis
Air embolism
Circuit rupture
Infection
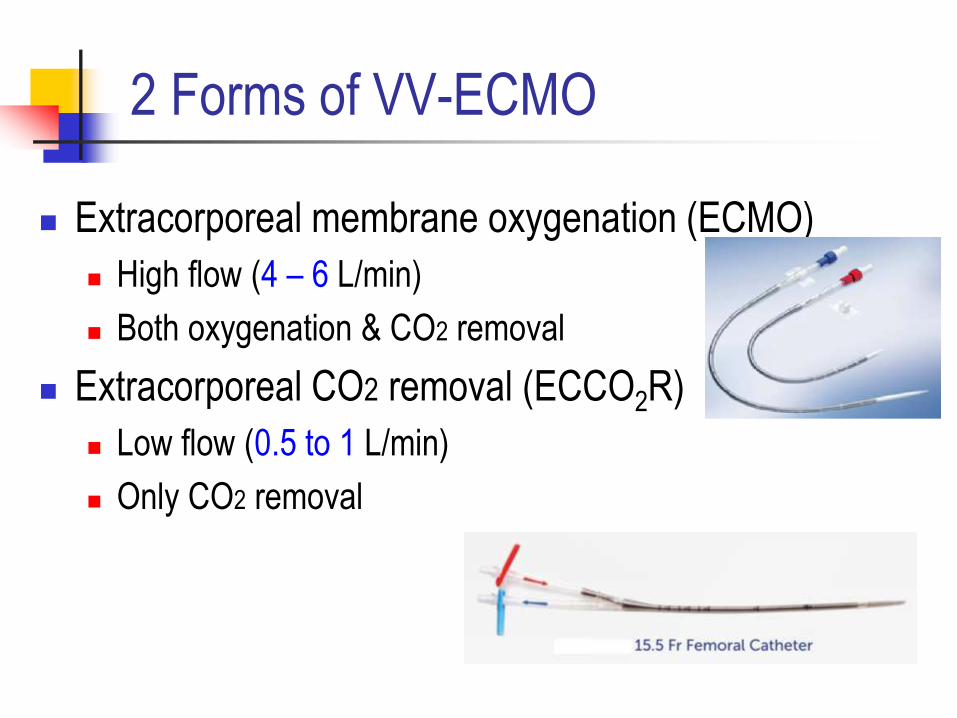
2 Forms of VV-ECMO
Extracorporeal membrane oxygenation (ECMO)
High flow (4 – 6 L/min)
Both oxygenation & CO2 removal
Extracorporeal CO2 removal (ECCO2R)
Low flow (0.5 to 1 L/min)
Only CO2 removal
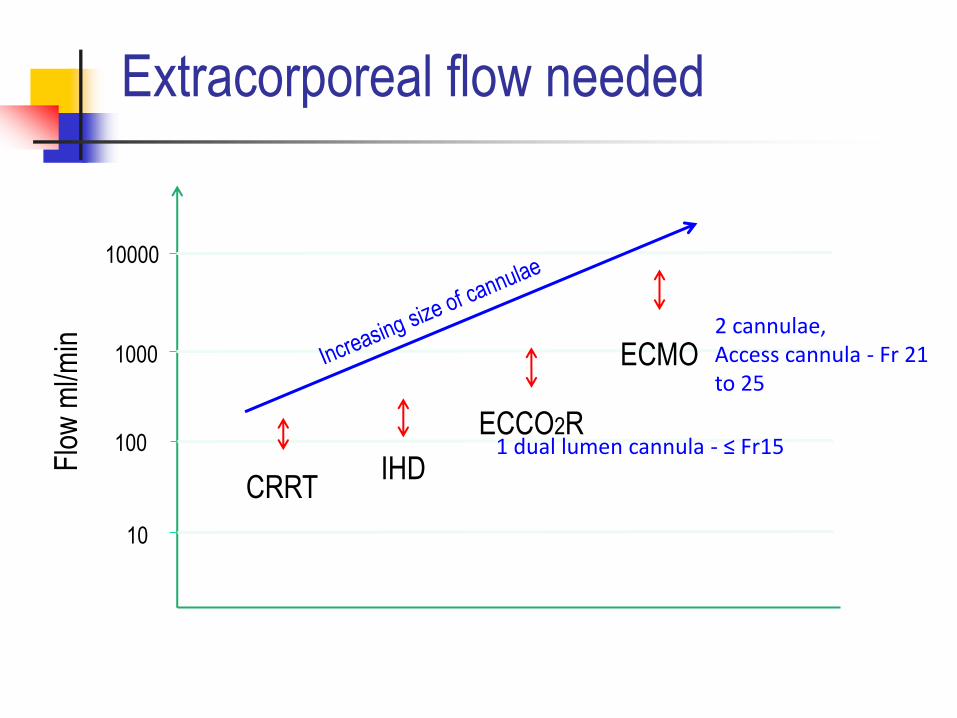
Extracorporeal flow needed F
low
ml/m
in
10
100
1000
10000
CRRT IHD
ECMO
ECCO2R
2 cannulae, Access cannula - Fr 21 to 25
1 dual lumen cannula - ≤ Fr15

Physiology Of O2 delivery
O2 consumption ~ 240 ml/min
Amount of O2 added to the
blood via ECMO ~ 40-60 ml/L
1.34 * Hb * (SoutO2 – SinO2)
4 – 6 L/min blood flow is
needed
Physiology of CO2 removal
CO2 generation ~ 200 ml/min
Amount of CO2 stored in blood
~ 500 ml/L
Achieved adequate CO2
removal with < 1L/min

Anesthesiology 2009;111:826-35
Ultra-Protective Lung Ventilation

ECCO2R potential applications
ARDS (moderate severity) with ultra-protective lung ventilation Ventilated using tidal volume of 4 ml/kg,
Less lung injury but hypercapnia
COPD exacerbation Failed NIV
Status Asthmaticus
Bridge to lung transplant (CO2 retention problem only)
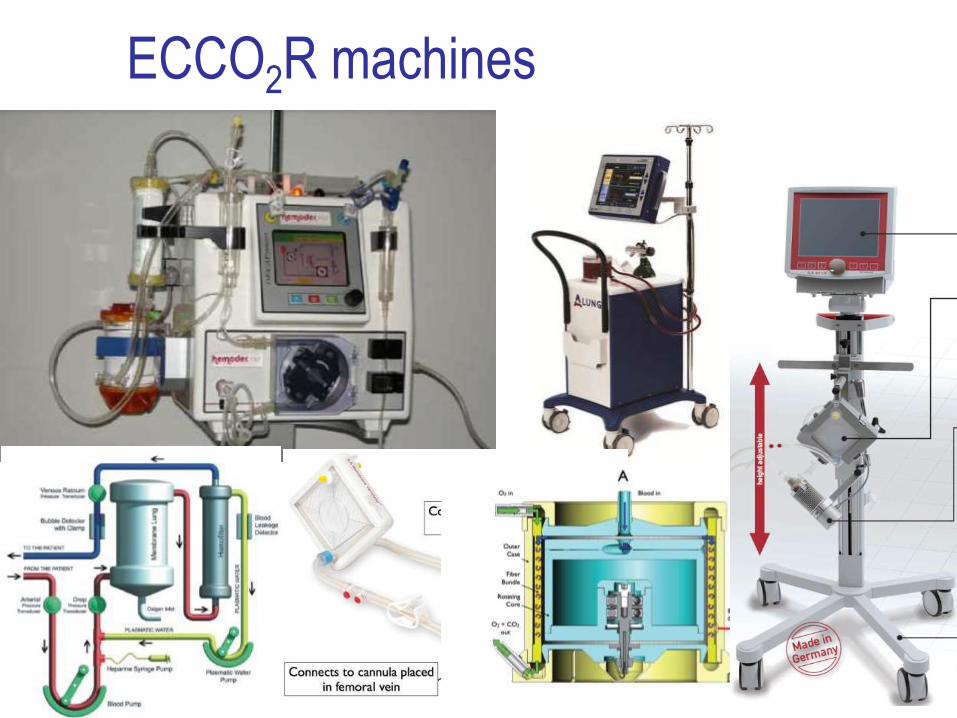
ECCO2R machines

Conclusions
ECMO - Evolving life support technology for respiratory
failure
Definite role in very severe respiratory failure
? How about its role in less severe failure
? What should be the positions of
ECCO2R (low flow & less invasive)
Especially in the presence of new modes of ventilation,
prone positioning, ……etc.

Thank you for your attention.