hosford middle school - portland public schools · hosford middle school how to use this workbook...
TRANSCRIPT

Hosford Middle School 2004 Assessment Workbook
August 2004

Hosford Middle School
This workbook was prepared by the staff of the Research, Evaluation & Assessment. While nu-merous staff contributed to the workbook, special thanks go to Karin Fallon, Jenny Miller, Joe Suggs, and Dori Torrence. Questions or comments about the workbook should be directed to Dr. Sue Hiscox, 503/916-2000, extension 4286 or [email protected].
Copyright 2004, Portland Public Schools

Hosford Middle School
Assessment Workbook 2004
Table of Contents
How to Use This Workbook Checking Assumptions Assessment Issues
Issue 1 How did our school do against the assessment benchmarks?............................................ 1 Graph: 2004 School “Meets” and “Exceeds” Percentages in Reading and Math Graph: 2004 School “meets” and “Exceeds” Percentages in Science, Problem Solving and
Writing Issue 2 Has our school’s performance improved over time? ........................................................... 3 Graph: Total of “Meets” and “Exceeds” Percentages Over Time by Grade Graph: RIT Scores Over Time by Grade Issue 3 Are our school’s demographic groups performing equally? ................................................ 5 Graph: Total of “Meets” and “Exceeds” Percentages by Ethnic Group in 2004 Graph: Total of “Meets” and “Exceeds” Percentages by Gender in 2004 Issue 4 How do special populations compare to school performance? ........................................... 7 Graph: Total of “Meets” and “Exceeds” Percentages by Special Populations in 2004 Issue 5 How successful are long-term students?............................................................................. 8 Graph: Total of “Meets” and “Exceeds” Percentages by Group in 2004 Issue 6 Are our students at all performance levels showing growth? .............................................. 9 Graph: Change in Average RIT Scores by 2003 Performance Level Issue 7 What are our school’s weakest and strongest content areas? .......................................... 10 Graph: Percent Meeting Each Goal for Reading and Math Tests Issue 8 Did our school meet adequate yearly progress (AYP) standards?.................................... 11 Table: Overall AYP
Appendix: Supporting Results
Table: Three-year reading, math and science results for all students............................. 12 Table: Three-year reading and math results by ethnic group.......................................... 13 Table: Three-year reading and math for long-term students ........................................... 15 Table: Average RIT gains by spring 2003 RIT status .................................................... 16 Graphs: Goal area strengths and weaknesses by grade .................................................. 17

Hosford Middle School
How to Use This Workbook
This workbook is intended for use by school staff and site councils as they analyze their assessment results for the prior year and develop a school improvement plan for the next year. The enclosed summary information addresses eight key questions that schools should ask about the results of their programs on all students. Through the workbook, users can identify key areas of strength or concern and identify additional resources for more in-depth information.
Assessment information from standardized achievement tests is only one source of data for school improvement plans. The workbook should be used jointly with other school-based data (such as grades, local assessments, and surveys) to develop and refine school improvement plans.
Reviewing data is particularly useful if you first consider your own assumptions about how students perform. The Checking Assumptions page that follows allows you to do this. Then move to the as-sessment data in the rest of this workbook to see where it confirms assumptions or surprises you as one step in understanding your school and where it can improve.
You will find the following sections on each of the subsequent pages:
An Issue Assessment results in isolation may be interesting, but they are most useful when used to an-swer questions about student performance. The eight questions in this workbook focus atten-tion on both the performance of students overall and specific subgroups of students. These are the key questions that should impact a school’s improvement plan.
What to Look For This section gives specific guidance on how to use the graph(s) and supporting results at the back of the workbook and on the PPS Assessment Test Results web page to identify strengths and areas for improvement.
The section is followed by a graph that provides the overview answer to the question. A quick look at this graph should answer the basic question for the page. (Note: In some cases, very few students are in a specific category. Small groups are tremendously affected by scores for even one individual and are not useful for reviewing trends. In most cases, you will not see re-sults if there are fewer than ten students in a category.)
Key Findings and Follow Up Questions In this section, users should note information that surprised them, apparent strengths of the school, and likely areas for improvement based on the graph(s) and supporting results in the workbook or on the web. They should also note how the data in this section relate to other in-formation from grades, in-school tests, surveys, etc.
Supporting Results
The graph in the “What to Look For” section often generates immediate questions. The supporting re-sults section at the end of this document contains tables that will often provide the answer. In addition, the Assessment Test Results section of the PPS website (use “test results” as a shortcut from PPS In-side) contains additional graphs and tables that provide considerable grade-level, subject-specific, and group-level information.

Hosford Middle School

Hosford Middle School
Checking Assumptions
Take five minutes to note your assumptions about the following questions. As you look through the workbook, review where results differed from your assumptions.
1. In general, would you expect to be below or above the district average scores?
2. What percent of your students would you expect to meet benchmarks?
Exceed benchmarks?
Show as low/very low?
3. How well is your curriculum aligned to the state standards at each grade?
Reading
Math
Writing
Science
4. Over that past two years, what changes have you made in your curriculum or teaching methods for:
Reading
Math
Writing
Science
5. How would you expect students who have been in your school for 2-3 years to compare
with students who have been here less time?
6. Is there a grade (e.g., this year’s 5th or 7th graders) that has been outstanding or tough compared to other years?
7. How would you expect the following subgroups of students to compare to your school av-erage? Higher? Lower? Same? English Language Learners Free/Reduced Price Meals Special Education Talented and Gifted African American American Indian Asian American European American Hispanic American

Hosford Middle School
1
Issue 1: How did our school do against the assessment benchmarks?
What to Look For The graphs on this and the next page show the percent of students who meet (solid box) and exceed (striped box) benchmarks. Benchmark scores for grades four, six and seven are based on PPS standards, since the Oregon Department of Education has not established standards at those grades. They will be based on Oregon standards and count toward Adequate Yearly Progress (AYP) in 2005-06.
If one grade is different than others, remember that this can be due to a number of reasons including align-ment with standards or characteristics of that particular grade’s group of students. It would take more re-search to determine why a grade may be low or unusually high.
The 2004 test results for reading, writing, math knowledge and skills (multiple choice) and math problem solving will be half of the 2004-05 AYP reports, when targets will increase to 50% for English/Language Arts and 49% for math. How well is your school prepared to meet the new targets?
Key Findings and Follow Up Questions Which results surprised you? Which results are you pleased with? What do you need to improve? What questions do you want answered? Be sure to check the test results section of the PPS web site (under site shortcuts) for more in-depth information on this issue. Who will get those answers, and how?
____________________________________________________________________________
____________________________________________________________________________
____________________________________________________________________________
____________________________________________________________________________
____________________________________________________________________________
____________________________________________________________________________

Hosford Middle School
2
Issue 1 (continued): How did our school do against the assessment benchmarks?
What to Look For After a year’s interruption, Oregon administered math problem solving, writing and science assessments
at grades five and eight. For the 2003-04 and 2004-05 Adequate Yearly Progress (AYP) reports, the math problem solving and writing tests will count in calculations. Only students who meet and exceed standards are counted in state AYP calculations as meeting benchmarks. The Oregon school report card has histori-cally also counted students who conditionally met the standard as meeting benchmarks.
Writing assessment will move to the fourth and seventh grades in 2005 and results will be included in the 2004-05 AYP calculations. Science results will become part of 2007-08 AYP calculations.
Key Findings and Follow Up Questions Which results surprised you? Which results are you pleased with? What do you need to improve? What questions do you want answered? Be sure to check the test results section of the PPS web site (under site shortcuts) for more in-depth information on this issue. Who will get those answers, and how? ____________________________________________________________________________
____________________________________________________________________________
____________________________________________________________________________
____________________________________________________________________________
____________________________________________________________________________

Hosford Middle School
3
Issue 2: Has our school’s performance improved over time?
What to Look For The chart below shows the percent of students meeting standards over the past four years, by grade. Benchmark scores for grades four, six and seven are based on PPS standards, since the Oregon Depart-ment of Education has not established standards at those grades. They will be based on Oregon standards and count towards Adequate Yearly Progress (AYP) in 2004-05. In 2003, students who took modified or ex-tended assessments, CLRAS, or challenged down to a lower grade’s test counted as “Not Meeting.” In 2004, though, it was possible for students to “meet standards” on extended assessments and CLRAS.
Differences in overall percent meeting standards for grades four, six and seven may be due to differences between the district (2003) and state (2004) tests
What grades have shown upward trends? How does this data fit with your knowledge about the student groups each year? If you see a major improvement or decline in a particular year, did something specific happen to explain it?
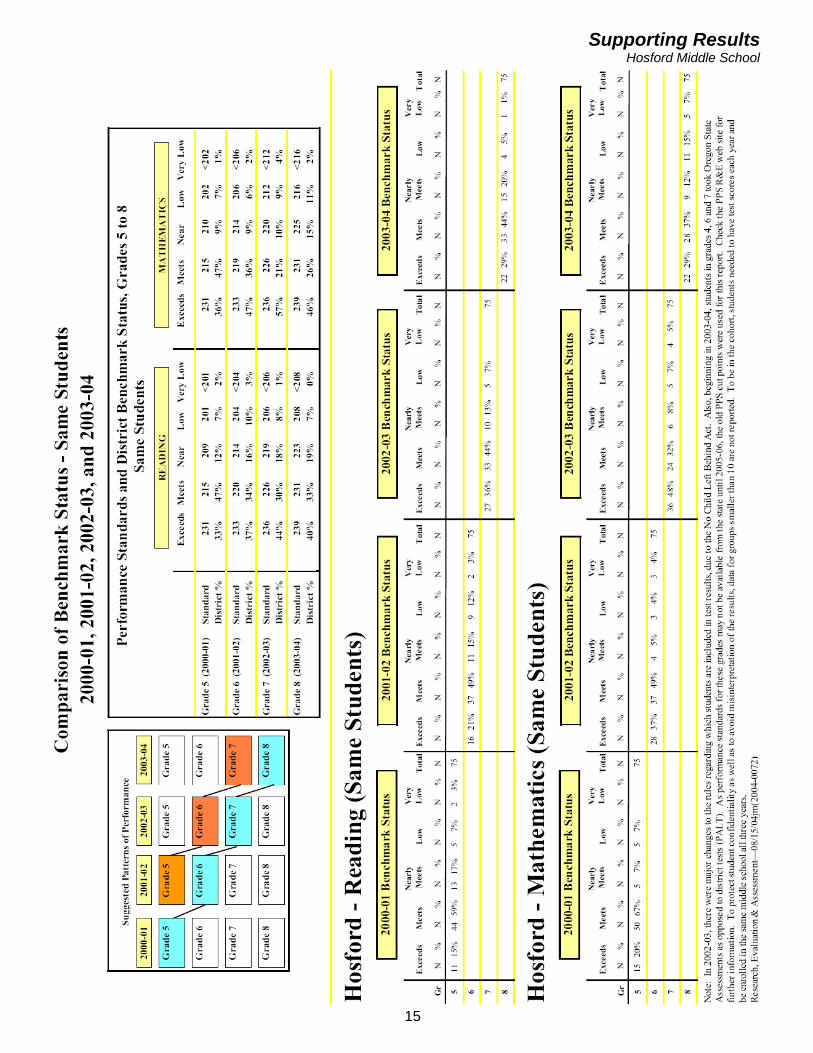
Look at page 12 in Supporting Results to consider what would happen to your percent of students meeting benchmark if “Nearly Meets” students moved to “Meets” next year.
Key Findings and Follow Up Questions Which results surprised you? Which results are you pleased with? What do you need to improve? What questions do you want answered? Be sure to check the test re-sults section of the PPS web site (under site shortcuts) for more in-depth information on this issue. Who will get those answers, and how? ____________________________________________________________________________
____________________________________________________________________________
____________________________________________________________________________

Hosford Middle School
4
Issue 2 (continued): Has our school’s performance improved over time?
What to Look For The graph below shows the mean RIT scores for your students over the past four years, by grade. As you consider 2004 data, remember that students in grades four, six and seven took state tests this year. RIT score changes at those grades may be due to differences between the state and district tests.
How do the RIT score trends compare to the chart of students meeting benchmarks? It’s possible to in-crease the percent meeting benchmarks by moving a few students near the benchmark higher and ignoring ongoing improvements for other students. In such a case, the RIT average would change little from year to year. A better pattern is to see improvements in both percent meeting and average RIT score over time.
How does the pattern of mean RIT scores compare to the pattern of percent of students meeting bench-mark at each grade.
Key Findings and Follow Up Questions Which results surprised you? Which results are you pleased with? What do you need to improve? What questions do you want answered? Be sure to check the test re-sults section of the PPS web site (under site shortcuts) for more in-depth information on this issue. Who will get those answers, and how? ____________________________________________________________________________
____________________________________________________________________________
____________________________________________________________________________
____________________________________________________________________________

Hosford Middle School
5
Issue 3: Are our school’s demographic groups performing equally?
What to Look For The graph below combines grades and compares different ethnic groups in terms of achievement. Look at the 2004 data to see the pattern of which groups are succeeding and which are falling behind. Use 2002 and 2003 bars to see if the pattern is consistent over time.
Are any groups considerably behind or ahead of the European American group? Are some groups clos-ing the gap? Do you see the same patterns all three years?
You will not see information for fewer than ten students in a category. For your own information, consider looking at those students as individuals to make sure they are not all at the lowest benchmark lev-els. Use pages 13 and 14 in supporting results to see how many students were tested in each subgroup. This table also shows three years of data to give you a better idea of trends.
Key Findings and Follow Up Questions Which results surprised you? Which results are you pleased with? What do you need to improve? What questions do you want answered? Be sure to check the test re-sults section of the PPS web site (under site shortcuts) for more in-depth information on this issue. Who will get those answers, and how? ____________________________________________________________________________
____________________________________________________________________________
____________________________________________________________________________
____________________________________________________________________________
____________________________________________________________________________
____________________________________________________________________________

Hosford Middle School
6
Issue 3 (continued): Are our school’s demographic groups performing equally?
What to Look For The graph below combines grades and compares males versus females in terms of achievement.
Is there a noticeable difference between males’ and females’ scores? How does the difference compare to 2002 and 2004?
Additional data broken down by gender are not available in this workbook. Additional reports, including three-year trends, are available from the assessment test results web page.
Key Findings and Follow Up Questions Which results surprised you? Which results are you pleased with? What do you need to improve? What questions do you want answered? Be sure to check the test re-sults section of the PPS web site (under site shortcuts) for more in-depth information on this issue. Who will get those answers, and how? ____________________________________________________________________________
____________________________________________________________________________
____________________________________________________________________________
____________________________________________________________________________
____________________________________________________________________________
____________________________________________________________________________

Hosford Middle School
7
Issue 4: How do special program students perform on assessments?
What to Look For This graph compares the performance of students in special programs with the total population of students in the school (shown in the box on the right margin of the graph).
Which subgroups are scoring below the overall population? Which ones are closing the gap between their percent meeting and the school average? Which ones aren’t? How well did the data match your assump-tions? If students are below the total group average, is the percent of students in “Very Low” and “Low” decreasing over time? Check the assessment test results website for multiple years of data for each group by subject area and grade to help look at trends.
The calculations regarding Limited English and Special Education students have changed over time. In 2002, only students who took standard tests were counted at all. In 2003, students who took a modified or extended assessment, CLRAS, or challenged down were counted as “Not Meeting.” In 2004, students who took the extended assessment or CLRAS could meet the standards. In 2004, the LEP category was changed to exclude students in their first year in the U.S. and to include students for two years after they exited the ESL program. All of these changes resulted from changes to the federal No Child Left Behind Act.
You will not see information for fewer than ten students in a category. Consider looking at those students as individuals to ensure they are not all at the lowest benchmark levels.
Key Findings and Follow Up Questions Which results surprised you? Which results are you pleased with? What do you need to improve? What questions do you want answered? Be sure to check the test re-sults section of the PPS web site (under site shortcuts) for more in-depth information on this issue. Who will get those answers, and how? ____________________________________________________________________________
____________________________________________________________________________

Hosford Middle School
8
Issue 5: How successful are our school’s long-term students?
What to Look For This graph shows results for students who have been in your school multiple years and also how their per-formance compares to all students at that grade.
Are long-term students increasing in the percent meeting benchmarks? Our district goal is that more stu-dents will meet standards in the higher grade than in the lower grade. How does their performance com-pare to the total group of students? If there is a difference, how much is acceptable?
If your long-term students represent most of the students at the grade tested in 2004, you won’t see much difference between their performance and that for the total group. Page 15 and the test results website pro-vide more detail about specific groups of long-term students.
Key Findings and Follow Up Questions Which results surprised you? Which results are you pleased with? What do you need to improve? What questions do you want answered? Be sure to check the test re-sults section of the PPS web site (under site shortcuts) for more in-depth information on this issue. Who will get those answers, and how? ____________________________________________________________________________
____________________________________________________________________________
____________________________________________________________________________
____________________________________________________________________________
____________________________________________________________________________
____________________________________________________________________________
Hosford Middle School
9
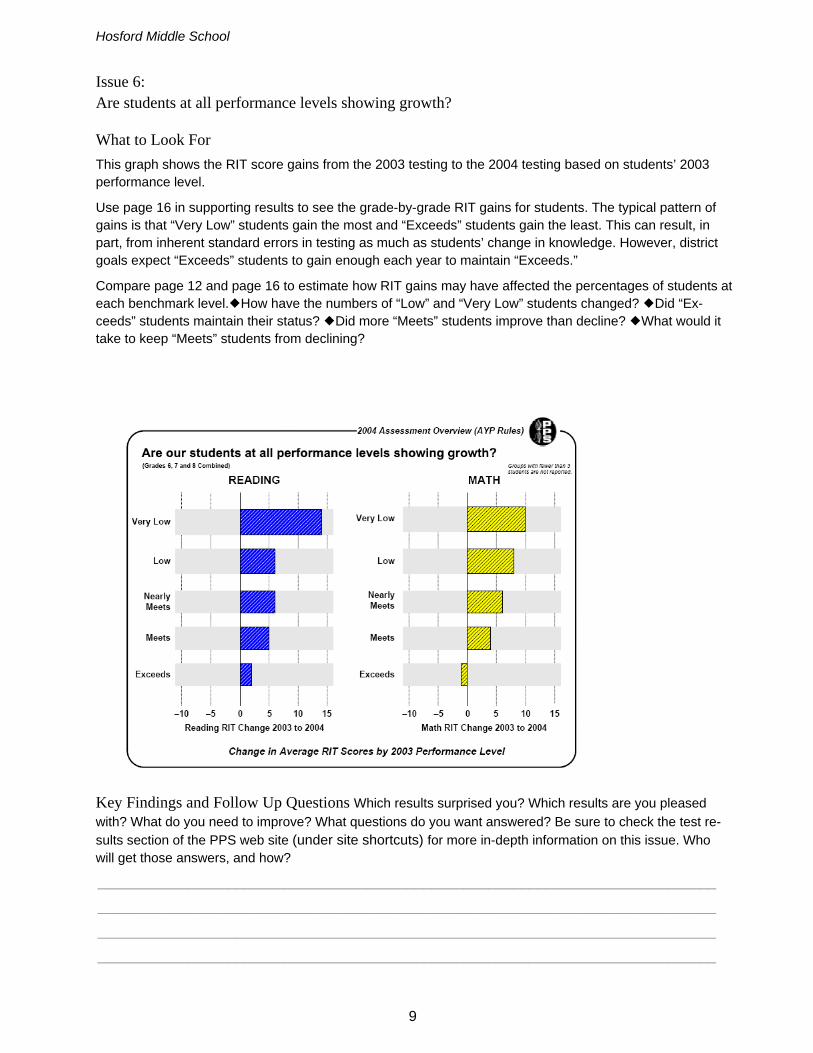
Issue 6: Are students at all performance levels showing growth?
What to Look For This graph shows the RIT score gains from the 2003 testing to the 2004 testing based on students’ 2003 performance level.
Use page 16 in supporting results to see the grade-by-grade RIT gains for students. The typical pattern of gains is that “Very Low” students gain the most and “Exceeds” students gain the least. This can result, in part, from inherent standard errors in testing as much as students’ change in knowledge. However, district goals expect “Exceeds” students to gain enough each year to maintain “Exceeds.”
Compare page 12 and page 16 to estimate how RIT gains may have affected the percentages of students at each benchmark level. How have the numbers of “Low” and “Very Low” students changed? Did “Ex-ceeds” students maintain their status? Did more “Meets” students improve than decline? What would it take to keep “Meets” students from declining?
Key Findings and Follow Up Questions Which results surprised you? Which results are you pleased with? What do you need to improve? What questions do you want answered? Be sure to check the test re-sults section of the PPS web site (under site shortcuts) for more in-depth information on this issue. Who will get those answers, and how? ____________________________________________________________________________
____________________________________________________________________________
____________________________________________________________________________
____________________________________________________________________________

Hosford Middle School
10
Issue 7: What are our school’s strongest and weakest content areas?
What to Look For This graph shows how your students performed on various goal areas in the assessment tests.
Which areas show the best performance? Which areas show a substantially lower percent of ”Meets” and “Exceeds” students? Do you know how well your curriculum aligns to standards in these areas?
While this graph combines grades, separate graphs for reading and math at each grade level start on page 17. Writing, math problem-solving and science graphs will be available at the PPS test results web site. Look to see whether all grades show the same strengths or weaknesses. Check grade level alignment with the state test specifications, which define the topics for each goal and relative percent of items for each topic. The specifications also show the possible content and sample items. New test specification for all grades should be posted in October. (Test specifications are linked to the PPS test results web page.)
The state provides grade-by-grade reports about goals, showing how your school compares to similar schools throughout the state. These reports will be available later in the fall.
Key Findings and Follow Up Questions Which results surprised you? Which results are you pleased with? What do you need to improve? What questions do you want answered? Be sure to check the test re-sults section of the PPS web site (under site shortcuts) for more in-depth information on this issue. Who will get those answers, and how? ____________________________________________________________________________
____________________________________________________________________________
____________________________________________________________________________

Hosford Middle School
11
Issue 8: Did our school meet adequate yearly progress (AYP) standards?
What to Look For These tables are taken from the Summary page of the OR Department of Education’s AYP report. One ta-ble shows your school’s results in English/Language Arts (ELA), the combination of reading and writing as-sessment results. The other shows results in mathematics (combined knowledge and skills tests and the problem solving assessment).
Schools must meet test participation and achievement targets for all student subgroups that are of a mini-mum size. A subgroup is judged on the participation criterion once it has a minimum of 40 tests for the two-year period covered by the AYP report. A subgroup is judged on the achievement criterion, if it has a mini-mum of 42 tests. The participation target for all subgroups is 95%.
The achievement target for 2003–04 was 40% meeting standards in ELA and 39% in Math. In 2004–05, the targets move to 50% and 49%, respectively. If a subgroup fails to meet these targets, AYP can still be made through sufficient growth in the percent of students meeting standards from the prior year to the cur-rent year. “Sufficient” growth for each subgroup is based on their prior year’s percent meeting standards.
In addition to participation and achievement for various subgroups, the overall attendance rate (at Middle School and Middle Schools) or graduation rate (at Middle Schools) is another criterion for making AYP. The attendance target is 92%. The graduation target is 68.1%.
A link to the full AYP reports is provided on the test results page of the PPS website.
Key Findings and Follow Up Questions ____________________________________________________________________________
____________________________________________________________________________
____________________________________________________________________________
____________________________________________________________________________
2004 Assessm ent Overview (AYP Rules)
Did our school m eet adequate yearly progress (AYP) standards?


Supporting Results Hosford Middle School
12

Supporting Results Hosford Middle School
13

Supporting Results Hosford Middle School
14
Supporting Results Hosford Middle School
15

Supporting Results Hosford Middle School
16

Supporting Results Hosford Middle School
17

Supporting Results Hosford Middle School
18

Supporting Results Hosford Middle School
19

Supporting Results Hosford Middle School
20

Supporting Results Hosford Middle School
21

Supporting Results Hosford Middle School
22