horticulture below the barmah choke
TRANSCRIPT

Horticulture below the Barmah Choke
Prepared for the Independent Murray-Darling Basin Social and Economic Assessment Panel
A Marsden Jacob Report

Marsden Jacob Associates
March 2020 ABN 66 663 324 657 ACN 072 233 204
e. [email protected] t. 03 8808 7400 Melbourne Level 4, 683 Burke Road, Camberwell Victoria 3124 AUSTRALIA
Perth Level 13, 37 St Georges Terrace, Perth WA, 6000 AUSTRALIA
Sydney Suite 203, 84 Alexander Street, Crows Nest NSW, 2065 AUSTRALIA
Authors Gavan Dwyer Matthew Clarke Makere Hurst Jeremy Cheesman Lachlan Dawson
Marsden Jacob Associates | O438 389 597 Marsden Jacob Associates Marsden Jacob Associates Marsden Jacob Associates Marsden Jacob Associates
www.marsdenjacob.com.au Acknowledgements All final recommendations and views in this report are attributable to Marsden Jacob unless otherwise stated. We acknowledge and thank the people we consulted with for this paper.
About Us Marsden Jacob Associates are leading economics, public policy, markets and strategy advisors. We can help you shape the future wisely. We are a national practice of talented economists and policy advisors. We specialise in solving practical and real world problems relating to water, energy, environment, natural resources, agriculture, earth resources, public policy and transport. We work with a wide range of cross-disciplinary partner firms to deliver best project outcomes for our clients.
Statement of Confidentiality The contents of this report and any attachments are confidential and are intended solely for the addressee. The information may also be legally privileged. If you have received this report in error, any use, reproduction or dissemination is strictly prohibited. If you are not the intended recipient, please immediately notify the sender by reply e-mail or phone and delete this report and its attachments, if any.

Horticulture below the Barmah Choke 2
Contents
1. Introduction 6
1.1 This discussion paper 6
2. Context 7
2.1 Background 7
2.2 Understanding the implications of salinity management 8
2.3 Understanding data constraints 12
3. Industry characteristics and trends 13
3.1 Wine 13
3.2 Table Grapes 22
3.3 Citrus 24
3.4 Almonds 26
3.5 Olives 30
4. Horticulture irrigation development in the Mallee 33
4.1 Understanding the changing composition of irrigation in the Mallee 33
4.2 Understanding the impact of change on high reliability water share 41
5. Processing of horticulture below the Barmah Choke 43
5.1 Ready to eat crops – table grapes and citrus 43
5.2 Almond and olive processing 43
5.3 Wine grapes 45

Horticulture below the Barmah Choke 3
6. Key factors affecting forward outlook 46
6.1 Key internal factors 46
6.2 Key external factors 46
6.3 Key needs going forward 48
References 49

Horticulture below the Barmah Choke 4
Key points
This Marsden Jacob case study discussion paper focuses on the horticulture industries below the Barmah Choke in the southern connected region of the Murray-Darling Basin. We use publically available data, key stakeholder interviews and modelling to assess how horticulture activity levels could change subject to changing water availability in the future. • Horticulture below the Choke overwhelmingly comprised of perennial plantings. The composition of the plantings has
changed significantly over time. Wine grapes and citrus now represent a smaller proportion of total plantings as these industries restructured in response to market pressures. Large greenfield developments of almonds and, to a lesser extent, olives have emerged and grown in scale.
• Prior to the Millennium Drought, the horticulture industry typically used over 800 GL of water to support more than 800,000 tonnes production per year.
• There has been a substantial decline in the number of horticulture farms in the older irrigation areas below the Choke. Large farms of over 100 hectares now make up a larger share of total production than previously as mid-sized blocks, in the order of 10 to 50 hectares, have been consolidated.
• Like other irrigation districts above the Choke, older irrigation areas below the Choke have patchworks of vacant blocks where irrigation enterprises have ceased. There has been some recent growth in water use in wine grapes, table grapes and citrus industries as they experience recovery resulting of improved market conditions and market access. In some areas, smaller scale almond growers are also developing sites

Horticulture below the Barmah Choke 5
• Almonds developments outside of the older irrigation areas are continuing to grow. There is evidence a recent slow-down in plantings has reversed and further expansion can be expected. Water use by almond developments are continuing to grow as past plantings mature.
• Processing capacity for horticulture varies according to the industry and concentration of historical and new development. Wine processing continues to predominantly occur in the Barossa and Riverina.
• Table grape and citrus packing has become more sophisticated as sheds comply with new market access and pest free status requirements.
• Almond and olive processing is a mix of smaller scale contract processing for smaller growers and large scale vertically integrated processing.
• Large scale horticulture developments are now reaching the point where further development may impinge on the ability to meet the water needs of the region in some circumstances.
• Capacity constraints are emerging in the River Murray and Goulburn at certain times. There is limited scope for horticulture developments to expand as constraints become binding. There are risks demand may not be met in the future under very dry conditions and peak summer crop needs.
• Horticulture water demand below the Choke will be meet by in part by available water above the Choke. It is not unusual for horticulture to meet some of its peak needs through the temporary water market.
• In very dry years the farmgate impacts of over-development of the basin will be mainly observed in semi-interruptible agriculture enterprises and supply chain infrastructure that depend a mix of high and general security allocations, rather than sectors such as rice that rely on general security allocations and the temporary market water. This will be primarily high reliability water allocations above the Choke not utilised by horticulture above the Choke and, therefore, primarily the dairy industry in northern Victoria.
• Our sense is that under further water recovery and the impacts of climate change, the periods of very low allocation will be longer and deeper than previously experienced. This will place considerable pressure water needs below the Choke and will see further trade to the region from above the Choke.

Horticulture below the Barmah Choke 6
1. Introduction
At the request of the former Minister for Water, The Hon David Littleproud, the MDBA has convened an Independent Panel (‘the Panel’) to assess economic and social conditions in the Murray-Darling Basin. The Panel’s assessment is a critical opportunity to shape understanding of current economic and social conditions in the Basin, and future Basin policy. Marsden Jacob is supporting the Panel by delivering case studies of Basin industries with high water consumption dependency. Our case studies complement the regional impact modelling and trends and drivers analyses Marsden Jacob is completing for the Panel in parallel, through more detailed examination and ground-truthing, and a tighter regional focus.
The Panel asked that our reports look at each sectors current situation and their outlook. We were asked to be concise in our evaluations, and take into account how water reform, weather and climate, technology, prices, structural, demographic and preference change and other factors known to impact on industries in the Basin might impact in the future. The Panel will use the evidence from these case studies to support key findings and recommendations in the Panel’s draft report. The Panel encourages all readers of this case study to read the Panel draft report.
1.1 This discussion paper This Marsden Jacob discussion paper focuses on horticulture below the Barmah Choke. The Panel has made this document publicly available as part of its commitment to transparency. The views in this report do not necessarily represent the views of the Panel.

Horticulture below the Barmah Choke 7
2. Context
Historically, irrigation below the River Murray Choke was dominated by small block horticulture enterprises in older irrigation areas in the Murray Valley and Riverland. Substantial structural change in these areas, along with signficant expansion of new irrigation developments outside of these districts, has dramatically reshaped the region. The major horticulture areas below the Choke are the Riverland and the Murray Valley. These areas have a long history of horticulture production, in particular, wine grape and citrus growing.
2.1 Background Horticulture below the Choke is comprised primarily of perennial crops that thrive in the dry Mediterranean climate. The major crops by area planted are:
• Wine grapes
• Table grapes
• Dried fruit
• Citrus – orange and to a lesser degree lemons and limes
• Almonds
• Olives

Horticulture below the Barmah Choke 8
The Murray Valley, like the Riverland, developed in phases. Some key phases include: prior to Federation; various Solider Settlement Schemes; and post war development. The first Riverland and Murray Valley developments were commenced by the Chaffey brothers in 1887 at Renmark and Mildura respectively with each 250,000 acres in size. Pumped irrigation districts in the region have a legacy of small block developments and the tight patchwork of land development has constrained individual farm expansion and the benefits of economies of scale. Grape and citrus industries have faced significant pressures at various times and there have been a number of periods of structural adjustment that prompted various Government reviews.
Over the last two decades, many small block growers have struggled to remain viable when commodity prices fell and the Australian dollar rose. Additionally,
• a large increase in wine grape varieties created excess supply and a change in consumer tastes and preferences changed led to lower demand.
• table grape growers have faced more constrained market access due to biosecurity constraints
• citrus growers faced increased international competition in juicing markets.
Small scale family farms producing almonds and olives have been in pumped irrigation districts for many years. However, over the last two decades, large corporate developments have established extensive almond and olive groves outside of the old irrigation footprint. Key drivers of this were Managed Investment Schemes (MIS) schemes, with favourable taxation incentives, and increasing global demand for these commodities – since then there has been substantial change in the ownership of these operations and a maturing of processing capacity.
2.2 Understanding the implications of salinity management Before reviewing the structure and compositional changes of horticulture below the Barmah Choke it is useful to have some appreciation of salinity management. This is because changes to the location and scale of water use in the region are shaped by Salinity management arrangements. We provide a brief introduction to this below

Horticulture below the Barmah Choke 9
Salinity management zones were introduced along the Murray in the mid 1990s. They were introduced alongside water reforms enabling the separation of water entitlements from the land and introduction of water trade. Figure 7 shows the zones between Nyah and the south Australian border.
Figure 1 Salinity impact zones Nyah to the South Australian Border
Source: DELWP
South Australia has simplified its multiple zones to one high impact and one low impact zone. Maps are provided at fine scale – for example, see Renmark and Loxton respectively (Figure 8). By merging zones, the total site use approval volume available in the High Salinity Impact Zone increased. This allows for easier exchange of site use approval volumes between authorisation holders.

Horticulture below the Barmah Choke 10
Development in Riverland comprises older pumped districts close to the river and intersect High Impact Zone (HIZ) and Low Impact Zone (LIZ). The upshot is development has focussed on the outer areas of the districts as corresponding with LIZ areas.
Figure 2: Renmark and Loxton Salinity impact zones
Renmark Loxton
Source: Natural Resources SA Murray-Darling Basin (2018)
With the potential for increased water trade into the Victorian Mallee, there was a risk of increased salinity impact caused by the action of root zone drainage recharging saline groundwater systems and displacing groundwater-borne salt to the River Murray. Zoning systems were developed to direct irrigation development resulting from water trade away from areas that result in high river salinity and included rules on the level of maximum water use on properties in the zones based on crop type, transfer rules for these use levels between properties and off set charges reflecting the cost of removing salt impacts caused by increased irrigation.

Horticulture below the Barmah Choke 11
Irrigators can apply for an increase in Annual Use Limit (AUL) on water use licences (WUL), with payment of a salinity offsetting charge, in order to water new irrigation (including the redevelopment of previous irrigation) in the LIZ. This category includes:
• New irrigation development on land for which there has never been a licence;
• New irrigation development on land which has not been irrigated for 10 years;
• New irrigation development on land where the previous WUL has been cancelled;
• Increase in the existing AUL above the level specified on an existing WUL; or,
• Increase in the area allowed to be irrigated outside the area of irrigation outlined on an existing licence.
The Federal government launched its Small Block Irrigators Exit Grant (SBIEG) Package in September 2018. This package assisted small block irrigators to exit the irrigation industry in exchange for their water entitlement. Irrigators who received the grant were required to remove all permanent plantings and above-ground production-related infrastructure from their properties. The WUL owned by grant recipients was then cancelled; however, the AUL associated with the cancelled WUL has been ‘preserved’ within the SIZ as an interim measure as agreed between DELWP and LMW.
As for all redevelopment in the Mallee, irrigation designs and meters (assuming that soils information is largely known for these properties) are required for these properties. The irrigation area and proposed crop type will determine the AUL required for redevelopment. AUL was available to each SBIEG property up to the volume associated with the property when the SBIEG was granted. If a greater volume of AUL is required, irrigators are advised to seek AUL from existing WUL holders to obtain the additional AUL. Because the AUL was ‘preserved’ within the system by way of agreement there is no requirement to report on the re-issue of this AUL within the annual salinity impact report. The net AUL is Neutral/Variable and the reinstatement of SBIEG cannot be greater than the original grant application. No AUL is associated with this category in 2016-17 in the Victorian Mallee.

Horticulture below the Barmah Choke 12
2.3 Understanding data constraints Also before reviewing the horticulture in the region it is helpful to understand that the gathering of data is not straight forward as ABS statistical areas that do not tightly align with location of industry (Box 1). As a result we use selected ABS statistical areas.
We also draw on industry data sources and more region specific data particular for the Mallee region where detailed farm compositional data has been collected and published.
Box 1: Use of ABS statistics to estimate horticulture below the Choke
Estimating the composition and value of industry output is not straight forward as the region is made up of multiple irrigation districts, private diverter systems and overlapping government and statistical boundaries. Furthermore, some industries are dominated by a small number of vertically integrated firms. In this case study, data is sourced from a range of industry and government publications. In some cases, ABS data has been used to provide insights into horticulture below the Choke. The ABS data for below the Choke is based on three Statistical Areas Level 4 regions (shaded in yellow below), which are a reasonable approximation for most industries of interest below the Choke.
Selected ABS Statistical Regions – statistical areas level 4

Horticulture below the Barmah Choke 13
3. Industry characteristics and trends
There have been substantial changes in the composition and outlook of horticulture industries below the Choke over the last decade. Almond plantations have grown substantially as the major growing region of California struggled under difficult conditions. Earlier large growth in olives has since ebbed and flowed as the imported oil competes vigourously for reflected Some traditional industries including wine grapes and citrus have had mixed fortunes that have improved of late and are now seeing some resurgence.
3.1 Wine Australian wine grape growing regions are generally described as either warm climate or cool climate. The Riverina (NSW), Riverland (SA) and Murray Valley (NSW/Vic) are three regions regarded by the industry as warm climate (Figure 9). Wine Australia estimate that around 1,500 wine grape growers and approximately 70% of Australia’s wine grape production comes from these regions.

Horticulture below the Barmah Choke 14
Figure 3: Wine growing regions in the Southern connected system and below the River Murray Choke
Source: Murray Valley Wine Growers Inc (2019)
There are approximately 1,200 wine grape growers below the Choke who are overwhelmingly located in older pumped districts with close patterns of historical settlement. Average block sizes vary between regions. Almost three quarters are located in the Riverland and the remainder in the Murray Valley. Riverland wine crush represents approximately 60 percent of the total South Australian industry. Murray Valley growers generally operate larger vineyards with just over 12,000 hectares under wine grapes in the Riverland and 157,000 hectares in the Murray Valley representing 14 and 9 percent respectively on the national vineyard area. Chardonnay, Shiraz and Cabernet are the main varieties grown (Table 5).
The Riverland produces up to 30 per cent of Australia's annual crush and approximately half of the South Australian crush. The overall region produces approximately 400,000 tonnes annually. The largest winery produces as much as 200,000 tonnes each year, while the smallest winery produces 60 tonnes. Murray Valley production is of relatively similar scale (Figure 10).

Horticulture below the Barmah Choke 15
Table 1: Key characteristics of winegrowers below the River Murray Choke
Key statistic Riverina Murray Valley Riverland Total
Number of Growers 300 310 900 1,510
Vineyard area (ha) 18,765 15,700 19,024 53,489
Percentage of national 14 9 14 40
Volume of grapes harvested (tonnes) 333,682 345,458 526,235 1,205,375
Percentage of national 19 19 29 67
Main grape varieties %
Chardonnay (23) Shiraz (19) Cabernet
Sauvignon (9) Semillon (8) Pinot Gris/Grigio (6)
Chardonnay (28) Shiraz (18)
Cabernet Sauvignon (12)
Pinot Gris/Grigio (8) Merlot (7)
Chardonnay (27) Shiraz (15) Cabernet
Sauvignon (14) Colombard (6)
Merlot (5)
Source: Wine Australia
The environment in warm climate regions is more naturally suited to high volume wine grape growing, with higher average temperatures, longer growing seasons, less exposure to disease and access to irrigation. Accordingly, production is focussed on bulk production and the average cost of production is generally lower (e.g. higher tonnes per hectare – Figure 12). Additionally, most of the wine grapes from the water climate regions end up in lower priced (Figure 11), generic blended or bulk wine.

Horticulture below the Barmah Choke 16
Figure 4: Historical crush from the Murray-Darling Basin and Swan Hill regions 2004-2019
Source: Murray Valley Wine Growers Inc (2019)
Average 2004-2018 373,745 tonnes
0
50
100
150
200
250
300
350
400
450
500
Tonn
es C
rush
ed (0
00's
)

Horticulture below the Barmah Choke 17
Figure 5: Average price per tonne in top 32 growing regions
Note: Warm climate regions illustrated in orange columns
Source: ACCC calculations based on Wine Australia (2019)
$0
$500
$1,000
$1,500
$2,000
$2,500
$3,000
$3,500
Rive
rina
Mur
ray D
arlin
g - S
wan
Hill
Rive
rland
Goul
burn
Val
ley
Cow
raKi
ng V
alle
yCu
rren
cy C
reek
Long
horn
e Cr
eek
Alpi
ne V
alle
ysO
rang
eSo
uthe
rn F
leur
ieu
Padt
haw
ayAd
elai
de P
lain
sRu
ther
glen
Geog
raph
eSt
rath
bogi
e Ra
nges
Wra
tton
bully
Pyre
nees
Grea
t Sou
ther
nM
ount
Ben
son
Robe
Clar
e Va
lley
Heat
hcot
eCo
onaw
arra
Hunt
erGr
ampi
anM
arga
ret R
iver
Adel
aide
Hill
sM
clare
n Va
leEd
en V
alle
yYa
rra
Valle
yBa
ross
a Va
lley
Mor
ning
ton
Peni
nsul
a
Wei
ghte
d Av
erag
e Pr
ice
($/t
onne
)

Horticulture below the Barmah Choke 18
Figure 6: Average wine grape yield in top 32 growing regions
Note: Warm climate regions illustrated in orange columns
Source: Wine Australia
$0
$5
$10
$15
$20
$25
$30
Hunt
erM
orni
ngto
n pe
nins
ula
Robe
Grea
t Sou
ther
nSt
rath
bogie
Ran
ges
Yarra
Vall
eyPy
rene
esM
arga
ret R
iver
Ruth
ergle
nOr
nage
Sout
hern
Fleu
rieu
Adel
aide
Plain
sCo
wra
Eden
Vall
eyCl
are
Valle
yGr
ampi
ans
Geog
raph
eM
ount
Ben
son
McL
aren
Vale
Coon
awar
raBa
ross
a Va
lley
Goul
burn
Vall
eyHe
athc
ote
Adel
aide
Hills
Alpi
ne V
alley
sCu
rrenc
y Cre
ekW
ratto
nbul
lyLa
ngho
rne
Cree
kKi
ng V
alley
Padt
hawa
yRi
verin
aM
urra
y-Da
rling
- Sw
an H
illRi
verla
nd
Aver
age P
rodu
ctio
n (t/
Ha)

Horticulture below the Barmah Choke 19
Consequently, vineyards in these regions generally produce high volumes of grapes, which are sold to large processors. There tends to be less emphasis (or at least the perception of less emphasis) on the individual qualities of either grapes or wines produced in these regions.
Around 70-80% of wine made from grapes in these regions is exported and, accordingly, the wine industry is particularly exposed to fluctuations in international wine prices. Australia’s largest winemakers’ processing facilities are concentrated in the warm climate regions.
The wine crush in the region declined in the late 2000s, rose sharply in 2013 and declined for the remainder of the decade. Changes in consumer preferences resulted in declining returns for wineries in these varieties and price point categories. Crush prices declined significantly, on the back of declining international demand and a relatively strong Australian dollar (Figure 16). These factors, together with limits to economies of scale on small block sizes, resulted in significant structural adjustment pressures. So much so that it helped precipitate, along with pressures at the time for small citrus and table grape growers, the Small Block Exit Grant.
For the remain sections drawing on ABS data we use the selected areas specified in Box 1.
Average wine prices in the region are recovering but a still well below those experienced over a decade or more ago (Figure 14). Significant exit, together with the abandonment of some plantings in the 2006/07 drought, resulted in significant declines in the wine crush for the region. On farm programs, together with wash through of this adjustment and a weakening of the Australian dollar, is resulting in a stabilisation and slight recovery for wine grape growers in the region. For example, there is now a shortfall in the supply of chardonnay.

Horticulture below the Barmah Choke 20
Figure 7: Average wine price per tonne for wine grapes crushed in selected ABS regions (2007/08 to 2017/18)
Source: ABS 7503.0 and 7121.0, various issues
The adjustments to the industry still has some way to go as wine grape plantings are continuing to decline. Increases in output in response to rising prices has resulted in an increase in average yields per hectare in part reflecting the multi-year lags in production between establishing new plantings and maturing of crush from those vines (Figure 15).
0
200
400
600
800
1,000
Aver
age
Pric
e ($/
t)

Horticulture below the Barmah Choke 21
Figure 8: Total area planted and average yield in selected ABS regions (2007/08 to 2017/18)
Source: ABS 7121.0, various issues
Lags are also observed in the effect between the exchange rate and wine grape prices (Figure 16). Recent economic modelling of the wine industry by Victoria University concluded there was generally a two year delay between exchange rate changes and wine prices received by Australian growers.
0
20,000
40,000
60,000
80,000
Tota
l Are
a (h
a)
0
5
10
15
20
Aver
age
Yiel
d (t/
ha)

Horticulture below the Barmah Choke 22
Figure 9: Australian/US exchange rate 2007-2015
Source: Macrotrends.net
3.2 Table Grapes The area planted to table grapes is around a quarter of that of wine grapes and, like wine grapes, is overwhelmingly located in the older pumped districts. It is not uncommon for some growers to have a mix of wine grapes, table grapes and other horticulture plantings.
Tables grapes are experiencing a resurgence as market access improves and prices recover with new varieties finding favour in emerging Asian markets – particularly China. Table grape prices have risen in nominal terms to earlier peaks a decade ago (Figure 17).
0.5
0.6
0.7
0.8
0.9
1
1.1
1.2
Jan-07 Jan-08 Jan-09 Jan-10 Jan-11 Jan-12 Jan-13 Jan-14 Jan-15
AUD/
USD
Exch
ange
Rat
e

Horticulture below the Barmah Choke 23
Figure 10: Table grapes average price per tonne in selected ABS regions
Source: ABS 7503.0 and 7121.0, various issues
Both the South Australia and Victorian governments have invested in developing new market access in co-operation with the Australian Government. This has included new access through recognition of their Pest Free Areas and biosecurity protocols, and fruit treatments to enable entry into new markets particularly in Asia.
As a consequence, the area planted to table grapes has more than doubled over the last decade with production more than doubling volumes of over a decade ago.
0
500
1,000
1,500
2,000
2,500
3,000
Aver
age
Pric
e ($/
t)

Horticulture below the Barmah Choke 24
Figure 11: Total table grape area planted and produced in selected ABS regions
Source: ABS 7121.0, various issues
3.3 Citrus Citrus is grown in both the Riverland and Murray Valley. Over 12,000 hectares of citrus are planted in the region with each the Riverland and Murray Valley sharing roughly an equal proportion of the plantings. Most plantings in each area are Navels for fresh eating.
The Riverland comprises in the order of 400 growers and approximately 200 packing sheds and are a mix of very large and smaller growers including those with the mix of other horticulture enterprises. Similar structure exists in the Murray Valley.
0
2,500
5,000
7,500
10,000
12,500
15,000
Tota
l Are
a (h
a)
0
25,000
50,000
75,000
100,000
125,000
150,000
Tota
l pro
duct
ion
(t)

Horticulture below the Barmah Choke 25
Like table grapes, and for much the same reason, the citrus industry has experienced a resurgence. Average prices for oranges have more than doubled over the last decade (Figure 19).
New fresh easy peel varieties, access to new markets and disease problems in competitor suppliers from South America have been important factors in the resurgence. The recognition of the Riverland as a Pest Free Area has enabled new market access opportunities. PFA status is recognised by the USA, Thailand, Japan, New Zealand, China and Indonesia. Previous drought and programs that have encouraged small block exit have also been important in rebalancing supply and demand. Citrus Australia estimated that the millennium drought resulted in the exit of around 150 citrus growers and the loss of around 800 hectares of permanent citrus plantings.
The resurgence is also linked to the on-farm water recovery programs which, along- side irrigation upgrades, also resulted in investment in other aspects of farm systems that improved overall productivity and crop returns — such as machinery upgrades, the planting of new varieties and more drought tolerant rootstocks and grading storage and packaging facilities.
Figure 12: Total number of orange trees and average price per kilogram of oranges in selected ABS regions
Source: ABS 7503.0 and 7121.0, various issues
0
1
2
3
4
5
Tota
l Tre
e no
. (M
illio
ns)
0
0.5
1
1.5
2
Aver
age
Pric
e ($
/kg)

Horticulture below the Barmah Choke 26
Citrus is the largest South Australian fresh fruit export — $71 million worth of exports annually to around 40 export destinations around the world. The industry is a significant seasonal employer of labour at harvest time employing around 5,000 permanent and seasonal workers annually.
3.4 Almonds The area under Almond production in the region has grown significantly. The ABS estimate the total number of trees has grown from approximately 1.2 million to just over 10 million between 2008 and 2018 (Figure 20).
Figure 13 Estimated number of Almond trees by financial year in selected ABS regions
Source: ABS 7121.0, various issues
Recent national kernel production estimates indicate production is continuing to rise (Figure 21).
0
2
4
6
8
10
Tota
l tre
e no
. (M
illio
ns)

Horticulture below the Barmah Choke 27
Figure 14: Estimated national almond kernel production
Source: Almond Board of Australia
Most of the almond plantings are in Victoria in the Sunraysia region and the vast majority of kernel production occurs below the River Murray Choke (Figure 22).
Figure 15: Almond kernel production and area under production by production region
Source: Almond Board of Australia
0
20,000
40,000
60,000
80,000
100,000
2010 2011 2012 2013 2014 2015 2016 2017 2018 2019 E 2020 F
Kern
el P
rodu
ctio
n (T
onne
s)
52,369 Tonnes
19,292 Tonnes
7,674 Tonnes566 Tonnes
0%
20%
40%
60%
80%
100%
Victoria South Australia New South Wales WatesternAustralia
Aust
ralia
n Ke
rnel
s pro
duce
d (%
)
23,876 HA
10,665 HA 9,106 HA
753 HA 688 HA0
0.2
0.4
0.6
0.8
1
Sunraysia(VIC)
Riverina(NSW)
Riverland(SA)
Swan (WA) AdelaidePlains (SA)
Aust
ralia
n O
rcha
rd P
lant
ings
(%)

Horticulture below the Barmah Choke 28
High and generally increasing returns from almonds has stimulated expansion over the last decade. Rising prices over the period (Figure 23) reflected on-going poor seasons in the major growing region of California and the weakening of the Australian dollar.
Over the last few years, rate of growth of planting has slowed reflected in the fall in the share of almond plantings under 3 years. Recent data and reports from nurseries suggest renewed growth.
Figure 16: Almond average price per kilogram in selected ABS regions
Source: ABS 7503.0 and 7121.0, various issues
The growth in almond output is primarily being driven by large scale green field development and the extension of these areas. Small scale almond production existed prior to these developments but its growth has been constrained by a variety of factors – a significant factor being the constraints and costs of redeveloping brown field sites including salinity management zones.
0
2
4
6
8
10
Aver
age
Pric
e ($/
kg)
Horticulture below the Barmah Choke 29
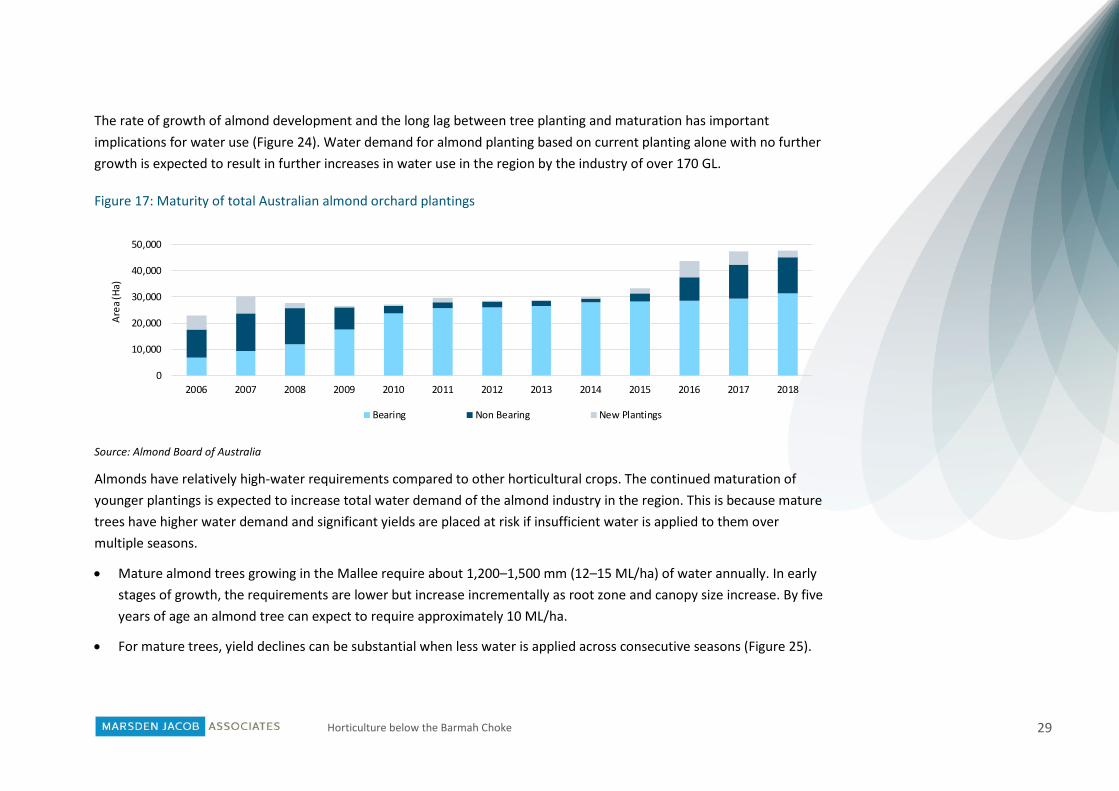
The rate of growth of almond development and the long lag between tree planting and maturation has important implications for water use (Figure 24). Water demand for almond planting based on current planting alone with no further growth is expected to result in further increases in water use in the region by the industry of over 170 GL.
Figure 17: Maturity of total Australian almond orchard plantings
Source: Almond Board of Australia
Almonds have relatively high-water requirements compared to other horticultural crops. The continued maturation of younger plantings is expected to increase total water demand of the almond industry in the region. This is because mature trees have higher water demand and significant yields are placed at risk if insufficient water is applied to them over multiple seasons.
• Mature almond trees growing in the Mallee require about 1,200–1,500 mm (12–15 ML/ha) of water annually. In early stages of growth, the requirements are lower but increase incrementally as root zone and canopy size increase. By five years of age an almond tree can expect to require approximately 10 ML/ha.
• For mature trees, yield declines can be substantial when less water is applied across consecutive seasons (Figure 25).
0
10,000
20,000
30,000
40,000
50,000
2006 2007 2008 2009 2010 2011 2012 2013 2014 2015 2016 2017 2018
Area
(Ha)
Bearing Non Bearing New Plantings

Horticulture below the Barmah Choke 30
Figure 18: Almond yield response to water in the Sunraysia and Riverland 2007/08 to 2011/12
Source: Skewes (2013)
3.5 Olives Major production areas of olives are the Murray Valley and Riverina.
Estimating olive production below the Barmah Choke is challenging given the data limitations associated with an industry characterised by and small number of large growers and a large number of small growers and mix of end uses.
The olive industry grew substantially during the large scale horticulture development phase. It then experienced a decline then more recent rise again in tree numbers. Production has varied quiet significantly over time reflecting changing seasonal conditions (Figure 26).

Horticulture below the Barmah Choke 31
Figure 19: Total number of Olive trees and production (thousand tonnes) – selected ABS regions below River Murray Choke
Source: ABS 7121.0, various issues
Boundary Bend is the largest single producer of olives with 2.2 million trees in 6278 hectares of groves at Boort and Boundary Bend. Its 3500 hectare Boundary Bend grove is below the Barmah Choke while the Boort grove is supplied via the Goulburn system.
Prices received for olives are not well reported by the ABS — available data indicate that prices have been weak over recent years as volumes of imported oil rose and there has been an oversupply of fruit (Figure 27).
0
1
2
3
Tota
l tre
e no
. (M
illio
ns)
0
25
50
75
Tota
l Pro
duct
ion
(000
's T)

Horticulture below the Barmah Choke 32
Figure 20 Olive average price per kilogram – selected ABS regions below River Murray Choke
Source: ABS 7503.0 and 7121.0, various issues
0
0.5
1
1.5
2
2.5
2008/09 2010/11 2012/13 2017/18
Aver
age
Pric
e ($
/kg)

Horticulture below the Barmah Choke 33
4. Horticulture irrigation development in the Mallee
The composition and size of the horticulture industry below the Choke has changed substantially over the last decade in response to a variety of factors. To illustrate this we focus on changes within the Victorian Mallee where there has been a substantial increased the demand for water by new horticulture developments below the Barmah Choke. Towards the end of the Millennium drought, the area planted to almonds increased substantially and, to a lesser extent, olives. Area planted to almonds increased by approximately 10,700 hectares from 2006 to 2009 (>100% increase), while areas planted to olives increase by approximately 2,800 hectares over the same period (>200% increase).
Substantial changes have also occurred in the varieties of citrus and grapes grown. The increase in the area planted on new greenfield sites to new crops has substantially increased the demand for water in the region. The development of new crop varieties and markets for grapes and citrus appear to have been important factors in reducing the level of exit of growers in pumped irrigation districts.
The changing composition of irrigation in the below the Choke region and the impact of salinity is discussed in the following sections.
4.1 Understanding the changing composition of irrigation in the Mallee Given data limitations, it is challenging to present detailed disaggregated data on the compositional change of horticulture across all the irrigation districts in the Riverland and Murray Valley. Using the most comprehensive data, which is contained in the Sunrise 21 Mallee Crop Report (2018 and 2019 addendum), this section focuses on the Murray Valley to illustrate

Horticulture below the Barmah Choke 34
changes in land use, irrigation technologies and plantings that have occurred widely across irrigation districts in the wider region.
Similar to above the Choke, there has been a significant decline in the volume of high reliability water shares held within the irrigation districts. There has been a 41 per cent decline in high reliability water shares in Lower Murray Water (LMW) irrigation districts below the choke since 2001 (Victorian Water Registry).
Older pumped irrigation districts below that Choke are characterised by the so called ‘Swiss Cheese Effect’ (i.e. like holes in slices of Swiss cheese) in much the same way as above the Choke and the pattern of irrigation development varies across districts.
Table 3 shows irrigation development in the Mallee catchment between 1997 and 2018. Major changes evident in this period include:
• Significant net growth in development in some pumped districts - Nyah and Robinvale
• Negative growth in the pumped districts in Mildura and Merbein
• Significant growth in private diverters at Boundary Bend and Wemen.
• Smaller growth in diverters on the outskirts of pumped districts.
In Mildura, the growth of diverters on the outskirts of the district almost offsets the net loss of development with the pumped district.

Horticulture below the Barmah Choke 35
Table 2: Mallee Catchment – irrigation development 1997 to 2018
Study Area 1997 (ha) 1997 to 2018 2018 (ha) Change (ha) 1997 -2018
Growth % 1997 - 2018
Retired (ha)
New (ha)
Pumped irrigation district
Nyah 1,120 -10 460 1,570 450 40%
Robinvale 2,320 -30 130 2,420 100 4%
Red Cliffs 4,450 -135 125 4,440 -10 <-1%
Mildura 6,450 -890 270 5,830 -620 -10%
Merbein 3,145 -140 0 3,005 -140 -4%
Sub-total 17,485 -1,205 985 17,265 -220 -1%
Private diverters
Nyah 4,730 -45 5,260 9,945 5,215 110%
Boundary Bend 5,365 -230 16,780 21,915 16,550 308%
Wemen 2,150 -50 10,600 12,700 10,550 491%
Clignan 6,925 -75 4,975 11,825 4,900 71%
Mildura 1,445 -65 590 1,970 525 36%
Lock10 to SA 1,640 -220 1,735 3,155 1,515 92%
Murrayville Groundwater Management Area (GMA)
585 0 1,790 2,375 1,790 306%
Mallee Catchment Total 40,325 -1,890 42,715 81,150 40,825 101%
Source: Sunrise 21 2018 Mallee Crop report
Given a large share of these districts are located within High Impact Zone (HIZ) salinity zones, there are usually higher hurdle rates and greater costs of re-establishing development in those areas compared to greenfield sites. These greenfield

Horticulture below the Barmah Choke 36
sites also have a range of other comparative advantages in terms of development including access to a very large aggregate of unoccupied land, lower land development costs, avoided costs of farm reconfiguration and the ability to scale and self-manage water access infrastructure to suit needs. Such factors explain why “swiss cheese” prevails in the districts despite the large overall development of horticulture in the region.
All irrigation development in the Mallee region, as measured by area under crop, has increased substantially – primarily due to the expansion of almonds and, to a lesser extent, olives and citrus (Figure 2).
Grapevines and nuts are the dominant crop in the Mallee region and jointly comprised approximately 66% of total area planted in 2018. Some key changes over the period 1997 to 2018 include:
• Area planted for grapevines are at similar levels in 2018 than they were in 1997. While area planted increased from 1997 to 2006 (5,405 hectares), the period 2006 to 2009 saw dried, table and wine grape plantings decline by 3,675 hectares.
• Table grape plantings expanded by 116% (4,810) between 1997 and 2018, with an accompanying large fall in area planted to dried grapes.
• Area planted to almonds increased by 22,740 hectares between 1997 and 2018.

Horticulture below the Barmah Choke 37
Figure 21: Composition of Mallee horticulture industry by year
Source: Sunrise 21 2018 Mallee Crop report
The overall trend is for fewer, larger irrigation properties (Figure 3).
• the area has approximately 1,925 irrigation properties. While the average property size (irrigable area) was 42 hectares in 2018, approximately 88% of properties were less than 40 hectares.
• there has been a steady decline in the number of properties over the period 1997 to 2018.
• between 1997 and 2018, the number of properties irrigating less than 20 hectares decreased by 586 properties, and the number of those irrigating over 20 hectares increased by 63 properties. A key driver of this has been dried off blocks being redeveloped and aggregated into holdings above 20 hectares. The net result was 523 fewer irrigation properties in 2018 than in 1997; a 21% decline in property numbers.
0
10,000
20,000
30,000
40,000
50,000
60,000
70,000
80,000
1997 2003 2006 2009 2012 2015 2018
Area
(Ha)
Grapes Field Crop Vegetables Citrus Nut Almond Fruit Other Nut Other Fruit Olive Other Vacant

Horticulture below the Barmah Choke 38
Figure 22: Number of Mallee horticulture farms by area size
Source: Sunrise 21 2018 Mallee Crop report
The composition of plantings in Mallee pumped irrigation districts has changed considerably over the last twenty years. Production of wine and dried grapes has fallen considerably, and this has been offset somewhat by growth of table grape plantings (Figure 4).
0
500
1,000
1,500
2,000
2,500
1997 2003 2006 2009 2012 2015 2018
Num
ber
of P
rope
rtie
s
1 to 5 ha 5 to 10 ha 10 to 20 ha 20 to 40 ha 40 to 100 ha 100 to 500 ha > 500 ha

Horticulture below the Barmah Choke 39
Figure 23: Area of Mallee pumped irrigation districts planted by horticulture enterprises – 1997 to 2018
Source: Sunrise 21 2018 Mallee Crop report
As with all forms of horticulture in the Southern Basin, there has been substantial uptake of water efficient irrigation technologies in the Mallee (Figure 5). Most plantings are under drip and only a very small area remains under furrow irrigation.
Consequently, any new technology upgrade growth will occur where dryland blocks that previously exited to production are converted to new horticulture enterprises.
0
5,000
10,000
15,000
20,000
1997 2003 2006 2009 2012 2015 2018
Area
(ha)
Grape Dried Grape Table Grape Wine Field Crop Vegetables Citrus Nut Almond Fruit Olive Other Vacant

Horticulture below the Barmah Choke 40
Figure 24: Hectares of Mallee horticulture by irrigation technology
Source: Sunrise 21 2018 Mallee Crop report
The rate of growth in the number of plantings under three years recently fell but is beginning to rise again, reflecting resurgence in some of the traditional horticulture industries (citrus and grapes) and the continued development of greenfield sites and the management of their existing plantings (Figure 6).
0
20,000
40,000
60,000
80,000
100,000
1997 2003 2006 2009 2012 2015 2018
Hect
ares
Vacant Furrow Overhead Low Level Drip

Horticulture below the Barmah Choke 41
Figure 25: Percentage of Mallee perennial plantings under or over 3 years of age
Source: Sunrise 21 2018 Mallee Crop report
4.2 Understanding the impact of change on high reliability water share The substantial changes in the composition of horticulture in the Mallee is reflected in changes in the volumes of high security water shares held in different regions by different users. different users There has been a substantial reduction (41 per cent) in the volume of high reliability water shares held by horticulture irrigators in Lower Murray Water districts.
0
10,000
20,000
30,000
40,000
50,000
60,000
1997 2003 2006 2009 2012 2015 2018
Area
(Ha)
<3 year old plantings >3 year old plantings

Horticulture below the Barmah Choke 42
Table 3: Comparison of high reliability water shares between 2001 and 2018
User group Location High reliability water share
volume % increase
30 June 2001 30 June 2018
Irrigator
LMW diverters 203 209 3
LMW districts 189 111 -41
GMW diverters 243 159 -35
GMW districts
Torrumbarry 378 209 -45
Loddon Valley 230 118 -49
Rochester/Campaspe 208 103 -50
Central Goulburn 391 213 -46
Shepparton 181 106 -41
Murray Valley 259 138 -47
Subtotal 1,648 887 -46
Not tied to land 0 298 N/A
Water corporation Not tied to land
0 63 N/A
Environment Not tied to land 0 661 N/A
Total 2,283 2,388 5
Note: GMW is Goulburn Murray Water
Source: Victorian Government (2019)

Horticulture below the Barmah Choke 43
5. Processing of horticulture below the Barmah Choke
The processing sector for horticulture differs across the crops grown in the region. Fresh fruit crops such as tables grapes and citrus are packed at on-site orchard sheds or larger nearby export accredited sheds. Large scale processing of almond and olive crops occurs in the region whereas wine grapes are processed primarily outside of the region. We group processing of horticulture crops into like arrangements below.
5.1 Ready to eat crops – table grapes and citrus Table grape and citrus fruit are picked on farm and then prepared for domestic and export markets usually on site or at nearby accredited facilities. Preparation usually includes sorting and grading, packing and treatments for required biosecurity protocols.
5.2 Almond and olive processing The composition of almond and olive process share similarities. Processing is dominated by a small number of large vertically integrated plants in close proximity to the businesses plantations. Significant investment occurred in developing these new processing plants as the new plantations were developed and expanded. There are also a number of small smaller processors distributed across the region that contract to private growers – some of these processors also operate small to medium scale plantations.

Horticulture below the Barmah Choke 44
5.2.1 Almonds There are five key almond processing facilities – two are very large scale operated by the vertically integrated businesses Olam and Selected Harvest. The remainder are smaller scale and process most of the crops of private growers.
Almondco – Renmark South Australia
Almondco represents 85 per cent of Australian growers and processes about 30 per cent of the national almond crop. Almondco receives the crops of more than 140 growers annually. The large majority of this intake is hulled and shelled at the company’s Lyrup site. A new hulling and shelling facility is being constructed at Griffith to meet the growth and provide the Riverina with a purpose built facility to service the increasing number of new growers joining Almondco.
Costa Brothers - Swan Reach
Costa Brothers is an approved huller and sheller for Almondco employing up to 35 people at its Swan Reach facility. The $6 million facility was recently commissioned and can handle 1,500 tonnes to 5,000 tonnes of kernels per season. The new facility is expected to increase the region's hulling and shelling capacity from 8,000 to 22,000 tonnes a year. The company already grew almonds in the area but has expanded its orchards to supply the new facility.
Laragon – Lindsay Point
In 2010 Laragon completed of the 3rd and final stage of its Lindsay Point $2 million expansion. This gave the facility the ability to process in excess of 10,000 tonnes per year. In 2013, an additional in-shell deck and colour sorter have further improved the capability of producing finished quality in-shell almonds.
Olam – Carwarp
Olam opened its $60 million Carwarp hulling and processing plant in 2013. At the time the plant was the largest of its kind in the Southern Hemisphere. Olam processes its own orchard production and purchases almonds from other private growers for processing.

Horticulture below the Barmah Choke 45
Select Harvest - Carina West
Select Harvest processes its orchard production at Carina West in north-west Victoria and at a value added processing facility at Thomastown in the Northern Suburbs of Melbourne. Select Harvest also processes contracted production from other privately owned orchards.
Carina West has a 6 month hulling and shelling capacity of 20,000 and 45,000 tonnes hulled storage area. The plant employs approximately 120 people in peak season.
5.2.2 Olives Boundary Bend operates processing plants close to plantations to prevent oil deterioration in picked olives. Boort estate has an on-site olive processing plant which is capable of processing more than 46 tonnes of olives per hour or 1,104 tons per day, to make premium extra virgin olive oil. There are a number of smaller scale olive oil processors across the region – many are on the site of smaller groves and who also process for other nearby growers.
5.3 Wine grapes Most wine grape processing occurs outside the region reflecting the concentration of wineries in the Barossa and Murrumbidgee region. There has been very limited investment in new wine processing facilities in the Riverland Murray Valley regions – the exception being Weilong Wine recently building a new $75 million facility at Red Cliffs with an expected capacity of 170,000 tonnes.

Horticulture below the Barmah Choke 46
6. Key factors affecting forward outlook
Financial returns from horticulture below the Barmah Choke will depend on a range of internal and external factors to the region. Some will enhance opportunities for the industry while others will be countervailing – the relative balance of which will depend primarily on the pattern of future water availability, external commodity and specialist markets, exchange rates market access and biosecurity, technology and practice change, and regulatory responses.
6.1 Key internal factors Key internal factors include:
• Skills of farmers and the ability to manage risk including biosecurity risks and achieve further productivity gains
Most farm systems are at the boundaries of irrigation technology and further opportunities for productivity gains are likely to be focus on the management of individual parcels – retiring old varieties and strategically introducing new ones.
For fresh fruit crops there are increasingly sophisticated supply chains emerging requiring stringent biosecurity compliance. Farmers will require increased skills and investment to optimise the opportunities they present
• Closer pattern of settlement creates higher costs of farm amalgamation
Individual circumstances will affect individual capacity of achieve economies through block amalgamation and land parcelling.
6.2 Key external factors Key external factors include:
• Expected availability of water and the pattern of availability over time –
Irrigators that rely on temporary water markets to meet annual crop needs will be further exposed to increasing water demand from new horticulture development and the recovery of water through on farm programs as they will further affect patterns of trade and water prices. Depth and length of drought and seasonal conditions will place pressure on

Horticulture below the Barmah Choke 47
producers that have higher water costs and are experiencing industry down turns. These will create long term decision points for some growers on whether to invest or with draw from industries.
Ongoing changes to water demand create seasonal peak issues and, in some years, may affect the capacity of the system to meet all needs in a timely manner. At present, there does not appear to be sufficiently sophisticated tools to manage the risks posed by further large scale development.
• Commodity prices and exchange rates –
Overseas demand and supply conditions will continue to driver longer term industry fortunes in most of the industries. Horticulture industries have long histories of boom and bust conditions with lagged effects from perennial plantings affecting supply and consumer tastes and preference changes affecting varietal demand. At present, the region is entering a boom cycle but, at some point in the future, pressures will again emerge. Current low exchange rates are helping fuel the relatively positive outlook.
• Market access and biosecurity
Maintaining and growing market access will require ongoing government and business investment. There are always risks that unforeseen events can place market access at risk in very short periods of time there are also narrow windows when the fruit can be most successfully exported.
• Location of development constraints including salinity credits
Development constraints will continue to be a major factor in the pattern of land-use change. Some areas will be affected more than others given their underlying contribution to river salinity.
• Climate change
Ongoing climate change is increasing summer temperatures and risks of early ripening and exposure to extreme weather events. Horticulture, particularly fruits, are vulnerable to these risks.
• Increasing transport efficiency is seeing bulk commodities being shipped large distances more cheaply.
Wine grapes and almonds continue to be transported large distances from vineyards and orchards for processing. Improved truck configurations are continuing to lower theses costs and there are significant economies of scale in existing operations. As result, the development of new processing facilities within the regions are going to be the exception rather than the norm.

Horticulture below the Barmah Choke 48
6.3 Key needs going forward The horticulture industry has significant opportunities but also some challenges. To maximise opportunities going forward, the following are likely to be required:
• R&I on new resilient farm systems including – new crop varieties • Improving management of existing patches – removing poorer performing patches and replacing with better
performing crops • Investment in market access and biosecurity innovation • Investment in skills and training to address labour and skill gaps required for these complex new systems • Investment in the consolidation of farms to enable stable flexible systems to succeed • Refinement of planning regulations to address right to farm issues • Continued reform of road access and heavy vehicle charging to enable more efficient transport of produce long
distances • Address limits to expansion according to river capacity constraints – cap and trade of access and/or enable trade
through channel capacity

Horticulture below the Barmah Choke 49
References
Almond Board of Australia 2019 Almond Insight 2018-19: https://2q1ee4456oc52trll42uctl1-wpengine.netdna-ssl.com/wp-content/uploads/2019/11/ABA-Almond-Insights-2019.pdf
ABS Data 7121.0 – Agricultural Commodities, Australia, 2017/18: https://www.abs.gov.au/AUSSTATS/[email protected]/DetailsPage/7121.02017-18?OpenDocument
ABS Data 7121.0 – Agricultural Commodities, Australia, 2016/17 to 2008/09: https://www.abs.gov.au/AUSSTATS/[email protected]/second+level+view?ReadForm&prodno=7121.0&viewtitle=Agricultural%20Commodities,%20Australia~2017-18~Latest~30/04/2019&&tabname=Past%20Future%20Issues&prodno=7121.0&issue=2017-18&num=&view=&
ABS Data 7503.0 -Value of Agricultural Commodities Produced, Australia, 2017/18: https://www.abs.gov.au/AUSSTATS/[email protected]/DetailsPage/7503.02017-18?OpenDocument
ABS Data 7503.0 -Value of Agricultural Commodities Produced, Australia, 2016/17:
https://www.abs.gov.au/AUSSTATS/[email protected]/second+level+view?ReadForm&prodno=7503.0&viewtitle=Value%20of%20Agricultural%20Commodities%20Produced,%20Australia~2017-18~Latest~30/04/2019&&tabname=Past%20Future%20Issues&prodno=7503.0&issue=2017-18&num=&view=&
AUD/USD Exchange rate data: https://www.macrotrends.net/2551/australian-us-dollar-exchange-rate-historical-chart
https://vinehealth.com.au/wp-content/uploads/2019/03/SA-state-summary-2019.pdf
Murray Valley Wine Growers Inc 2019 2019 Vintage Crush Report: http://www.mvwi.com.au/items/1193/Wine%20Grape%20Crush%20Report%202019%20-%20Murray%20Darling%20%20Swan%20Hill.pdf

Horticulture below the Barmah Choke 50
Natural Resources SA Murray-Darling Basin 2018, Salinity zoning and boundaries, https://www.naturalresources.sa.gov.au/samurraydarlingbasin/water/river-murray/issues-for-river-health/salinity/salinity-zoning-and-boundaries
Skewes, M.A., 2013. Tree Crop Drought Information Package, Factsheet. PIRSA, Adelaide, p. 6.
Sunrise 21 2018 Mallee Crop report: https://mk0malleecmacomvmcpd.kinstacdn.com/wp-content/uploads/2019/12/2018-Mallee-Horticulture-Crop-Report-Final.pdf
Victorian Government 2019, Water Market Trends, https://waterregister.vic.gov.au/images/documents/Water-Market-Trends-Update-2018_web.pdf