hormone concentrations during pregnancy and maternal...
TRANSCRIPT

UMEÅ UNIVERSITY MEDICAL DISSERTATIONS
New Series No. 1715 * ISSN 0346-6612 * ISBN 978-91-7601-273-4
Hormone Concentrations during Pregnancy and Maternal Risk of
Epithelial Ovarian Cancer
Helena Schock
Faculty of Medicine Umeå University, 2015

Copyright© Helena Schock 2015 Responsible publisher under Swedish law: the Dean of the Medical Faculty This work is protected by the Swedish Copyright Legislation (Act 1960:729) ISBN: 978-91-7601-273-4 ISSN: 0346-6612 Electronic version available at http://umu.diva-portal.org/ Printed by: Print & Media Umeå, Sweden 2015

Promise me you'll always remember: You're braver than you believe, and stronger than you seem, and smarter than you think.
A. A. Milne

i
Abstract
Background: The aim of this thesis was to study the relationship of pre-diagnostic
circulating concentrations of sex steroid hormones (androgens, estradiol,
17-hydroxyprogesterone, and progesterone), growth factors (insulin-like growth factor-I
(IGF-I), placental growth hormone (GH)), sex hormone binding globulin (SHBG), and
anti-Müllerian hormone (AMH) with risk of epithelial ovarian cancer (EOC) overall, and
by tumor invasiveness and histology. A longitudinal study was used to assess patterns of
hormonal changes during a single pregnancy, and in two consecutive pregnancies.
Materials & Methods: A case-control study was nested within the Finnish Maternity
Cohort and the Northern Sweden Maternity Cohort. A total of 1 052 EOC cases were
identified through linkages with the cancer registries in both countries. For each case,
2-3 controls were selected. Cases and controls were matched on cohort, age and date at
blood draw, as well as for parity at blood draw and at diagnosis (n=2 695). Odds ratios
(OR) and corresponding 95% confidence intervals [CI] were estimated using conditional
logistic regression. The longitudinal study was based on 71 pregnant Finnish women,
who donated blood samples in each trimester of pregnancy.
Results: Higher androgen concentrations were associated with an increased risk of
overall EOC (e.g., testosterone ORT3 vs. T1: 1.56 [1.30-1.87], ptrend<0.0001), while the risk
of endometrioid tumors increased with higher estradiol concentrations (ORT3 vs. T1: 2.76
[1.04-7.33], ptrend=0.03). Higher IGF-I was associated with a non-significant decrease in
risk for invasive (ORT3 vs. T1: 0.79 [0.62-1.02], ptrend=0.07) and endometrioid tumors
(ORT3 vs. T1: 0.55 [0.28-1.07], ptrend=0.07). The inverse association between IGF-I levels
and risk of invasive EOC was stronger in analyses limited to women aged <55 years at
diagnosis (ORT3 vs. T1: 0.74 [0.57-0.96], ptrend=0.03). No associations were observed
between pre-diagnostic progesterone, SHBG, placental GH, and AMH with EOC risk
overall, or by tumor invasiveness and histology.
The longitudinal study showed that hormone concentrations were more strongly
correlated between consecutive trimesters of a pregnancy than between the 1st and 3rd
trimesters. Further, 3rd trimester hormone concentrations can be estimated from 1st or
2nd trimester measurements.
Conclusion: Higher pre-diagnostic androgens, estradiol, and IGF-I are associated with
EOC risk, and associations differ by tumor invasiveness and histology.
Keywords:
epithelial ovarian cancer; sex steroid hormones; IGF-I; placental GH; AMH;
pregnancy; prospective study.
ii
Table of Contents
Abstract ................................................................................... i
Table of Contents ....................................................................ii
Abbreviations ......................................................................... iv
List of Tables and Figures....................................................... vi
Original Papers ..................................................................... vii
1. Introduction ........................................................................ 1
1.1 Ovarian Cancer ................................................................................................ 1
1.2 Pregnancy and Ovarian Cancer ..................................................................... 5
1.3 Hormones in Pregnancy and Ovarian Cancer............................................... 6
1.3.1 Progesterone ............................................................................................ 8
1.3.2 17-OHP ..................................................................................................... 9
1.3.3 Androgens ................................................................................................ 9
1.3.4 Estradiol ................................................................................................. 10
1.3.5 IGF-I and placental GH.......................................................................... 11
1.3.6 anti-Müllerian Hormone ...................................................................... 12
1.4 Hormone Measurements throughout Pregnancy ....................................... 13
2. Aims .................................................................................. 15
3. Materials and Methods ...................................................... 16
3.1 Nested Case-Control Study .......................................................................... 16
3.1.1 Cohort Descriptions ............................................................................... 16
3.1.2 Selection of Study Subjects ................................................................... 16
3.1.3 Tumor Data ............................................................................................ 17
3.1.4 Covariate Data ....................................................................................... 18
3.1.5 Participants by Study ............................................................................ 19
3.1.6 Laboratory Analyses .............................................................................. 20
3.1.7 Statistical Methods ................................................................................ 21
3.2 Longitudinal Study ....................................................................................... 23
3.2.1 Selection of Study Subjects ................................................................... 23
iii
3.2.2 Laboratory Analyses ............................................................................. 23
3.2.3 Statistical Methods ............................................................................... 24
4. Results .............................................................................. 26
4.1 Case-Control Study ....................................................................................... 26
4.1.1 Descriptive Statistics ............................................................................. 26
4.1.2 Associations between Hormones and EOC .......................................... 31
4.1.3 Mutual Adjustment ............................................................................... 35
4.1.4 Stratified Analyses ................................................................................. 38
4.1.5 Analyses by Tumor Stage ...................................................................... 42
4.1.6 Sensitivity Analyses ............................................................................... 42
4.2 Longitudinal Study....................................................................................... 43
4.2.1 One Pregnancy....................................................................................... 44
4.2.2 Two Consecutive Pregnancies .............................................................. 47
4.2.3 Sensitivity Analyses .............................................................................. 48
5. Discussion ......................................................................... 49
5.1 Methodological Considerations: Case-Control Study ................................. 49
5.2 Methodological Considerations: Longitudinal Study ................................ 52
5.3 General Discussion: Case-Control Study .................................................... 53
5.4 General Discussion: Longitudinal Study .................................................... 62
6. Conclusions ....................................................................... 64
7. Outlook and Future Directions .......................................... 65
Acknowledgments ................................................................. 66
References ............................................................................ 68
iv
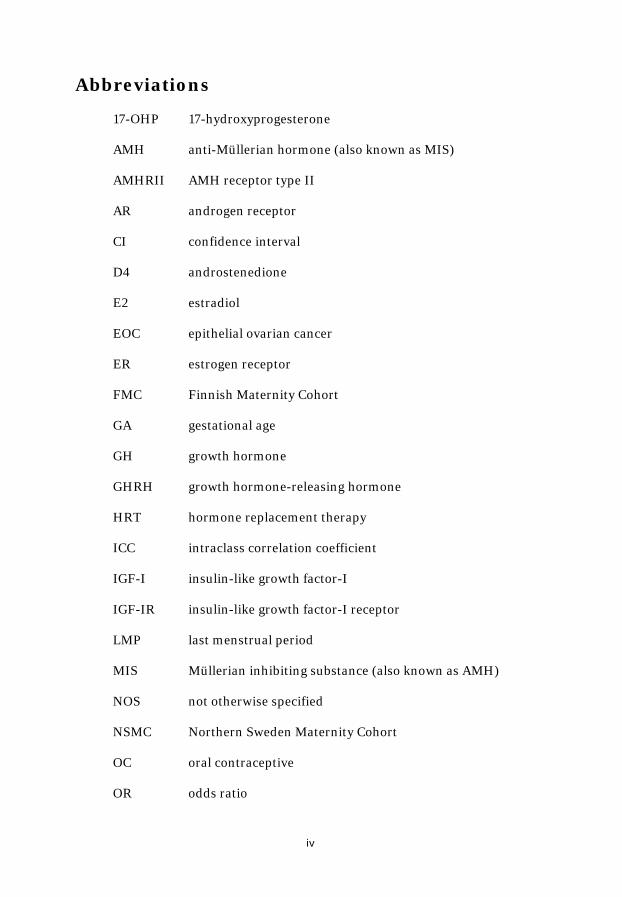
Abbreviations
17-OHP 17-hydroxyprogesterone
AMH anti-Müllerian hormone (also known as MIS)
AMHRII AMH receptor type II
AR androgen receptor
CI confidence interval
D4 androstenedione
E2 estradiol
EOC epithelial ovarian cancer
ER estrogen receptor
FMC Finnish Maternity Cohort
GA gestational age
GH growth hormone
GHRH growth hormone-releasing hormone
HRT hormone replacement therapy
ICC intraclass correlation coefficient
IGF-I insulin-like growth factor-I
IGF-IR insulin-like growth factor-I receptor
LMP last menstrual period
MIS Müllerian inhibiting substance (also known as AMH)
NOS not otherwise specified
NSMC Northern Sweden Maternity Cohort
OC oral contraceptive
OR odds ratio

v
OSE ovarian surface epithelium
P progesterone
PCOS polycystic ovary syndrome
PR progesterone receptor
SHBG sex hormone binding globulin
T testosterone
vi
List of Tables and Figures
List of Tables
Table 1. Epithelial ovarian carcinomas – the main histologic subtypes.............. 2
Table 2. Distribution of characteristics of EOC cases by tumor histology ........ 27
Table 3. Spearman partial correlation coefficients ............................................. 30
Table 4. ORs by tumor invasiveness and histology across tertiles .................... 32
Table 5. Effect of mutual adjustment .................................................................. 36
Table 6. Longitudinal Study - Baseline characteristics ...................................... 43
Table 7. Spearman correlation coefficients between successive trimesters ...... 44
Table 8. Median hormone concentrations by parity .......................................... 45
Table 9. Percentage changes in 3rd trimester hormone concentrations ............ 46
Table 10. Median hormone concentrations by number of children .................. 47
Table 11. Characteristics of prospective studies on endogenous androgens ..... 54
Table 12. Characteristics of prospective studies on endogenous IGF-I ............ 58
List of Figures
Figure 1. Age-standardized incidence rates of ovarian cancer ............................. 1
Figure 2. Classification of epithelial ovarian tumors ........................................... 2
Figure 3. Circulating hormone concentrations (ng/mL) during pregnancy ...... 6
Figure 4. Main hormone production sites during pregnancy ............................. 7
Figure 5. Number of study participants per studied hormone .......................... 19
Figure 6. ORs for doubling of circulating hormone concentrations by age ..... 39
Figure 7. ORs of EOC for circulating androgen concentrations ........................ 55
Figure 8. ORs of EOC for circulating IGF-I in women age <55 years at dx ...... 59
vii
Original Papers
This thesis is based upon the following papers, which are referred to in the text
by their Roman numerals:
I. Schock H, Lundin E, Vääräsmäki M, Grankvist K, Fry A, Dorgan JF,
Pukkala E, Lehtinen M, Surcel HM, Lukanova A. Anti-Müllerian hormone
and risk of invasive serous ovarian cancer. Cancer Causes Control 2014;
25(5):583-9.
II. Schock H, Surcel HM, Zeleniuch-Jacquotte A, Grankvist K, Lakso HÅ,
Fortner RT, Kaaks R, Pukkala E, Lehtinen M, Toniolo P, Lundin E. Early
pregnancy sex steroids and maternal risk of epithelial ovarian cancer.
Endocr Relat Cancer 2014; 21(6):831-44
III. Schock H, Fortner RT, Surcel HM, Grankvist K, Pukkala E, Lehtinen M,
Lundin E. Early pregnancy IGF-I and placental GH and risk of epithelial
ovarian cancer: A nested case-control study.
Int J Cancer 2015; doi: 10.1002/ijc.29387
IV. Schock H, Zeleniuch-Jacquotte A, Lundin E, Grankvist K, Lakso HÅ,
Idahl A, Surcel HM, Fortner RT. Longitudinal assessment of pregnancy
hormones.
Manuscript submitted
All previously published papers were reproduced with kind permission from
BioScientifica (Endocrine-Related Cancer), John Wiley and Sons (International
Journal of Cancer), and Springer (Cancer Causes and Control).

1
1. Introduction
1.1 Ovarian Cancer
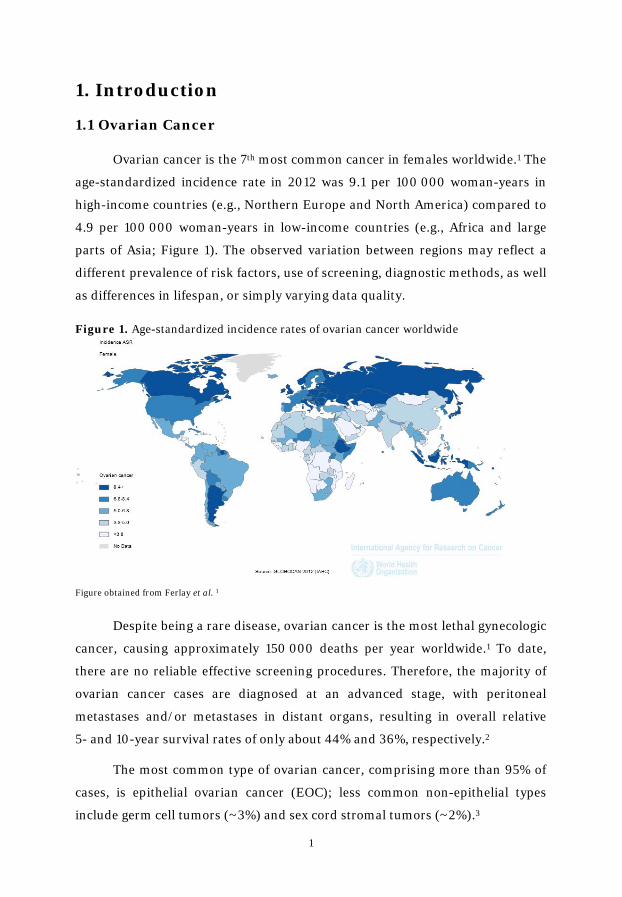
Ovarian cancer is the 7th most common cancer in females worldwide.1 The
age-standardized incidence rate in 2012 was 9.1 per 100 000 woman-years in
high-income countries (e.g., Northern Europe and North America) compared to
4.9 per 100 000 woman-years in low-income countries (e.g., Africa and large
parts of Asia; Figure 1). The observed variation between regions may reflect a
different prevalence of risk factors, use of screening, diagnostic methods, as well
as differences in lifespan, or simply varying data quality.
Figure 1. Age-standardized incidence rates of ovarian cancer worldwide
Figure obtained from Ferlay et al. 1
Despite being a rare disease, ovarian cancer is the most lethal gynecologic
cancer, causing approximately 150 000 deaths per year worldwide.1 To date,
there are no reliable effective screening procedures. Therefore, the majority of
ovarian cancer cases are diagnosed at an advanced stage, with peritoneal
metastases and/or metastases in distant organs, resulting in overall relative
5- and 10-year survival rates of only about 44% and 36%, respectively.2
The most common type of ovarian cancer, comprising more than 95% of
cases, is epithelial ovarian cancer (EOC); less common non-epithelial types
include germ cell tumors (~3%) and sex cord stromal tumors (~2%).3

2
Table 1. Epithelial ovarian carcinomas – the main histologic subtypes
Serous Mucinous Endometrioid Clear Cell
Mean age at diagnosis
~ 60 years 54 years 55-58 years 50-53 years
Distribution ~75% ~3% ~10% ~10%
Morphological resemblance to
Fallopian tube epithelium
Endocervical epithelium
Endometrial gland epithelium
Clear and hobnail-like
cells
Usual stage at diagnosis
Localized / advanced *
Localized Localized Localized
Response to chemotherapy
Intermediate / high *
Low High Low
Prognosis Favorable / poor * Favorable Favorable Intermediate
* serous tumors are further divided into low- and high-grade serous carcinomas
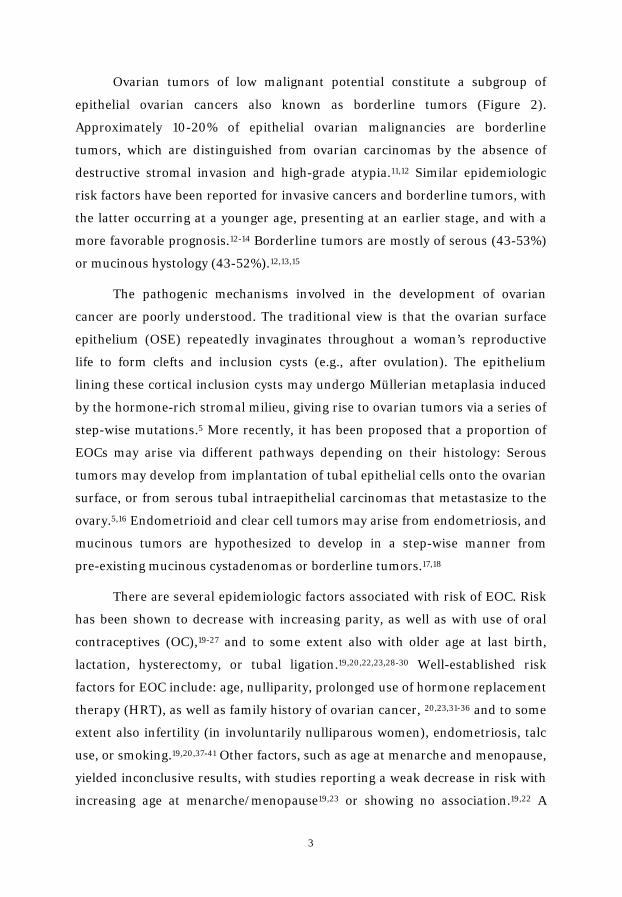
Accumulating evidence indicates that EOC histologic subgroups represent
clinically, morphologically, and molecularly distinct diseases, with the main
subtypes being serous, endometrioid, clear cell, and mucinous (Table 1).4-8 The
remaining invasive ovarian tumors are classified as not otherwise specified
(NOS) or “other” (Figure 2).9 While clear cell tumors account for about 10% of
invasive epithelial ovarian cancers in Western countries, the frequency in
Japanese women is substantially higher (~25%).4,10
Figure 2. Classification of epithelial ovarian tumors by histology and invasiveness
invasive mucinous
borderline mucinous
borderline serous
invasive serous
endometrioid
clear cell
other
borderline tumors
invasive tumors
3
Ovarian tumors of low malignant potential constitute a subgroup of
epithelial ovarian cancers also known as borderline tumors (Figure 2).
Approximately 10-20% of epithelial ovarian malignancies are borderline
tumors, which are distinguished from ovarian carcinomas by the absence of
destructive stromal invasion and high-grade atypia.11,12 Similar epidemiologic
risk factors have been reported for invasive cancers and borderline tumors, with
the latter occurring at a younger age, presenting at an earlier stage, and with a
more favorable prognosis.12-14 Borderline tumors are mostly of serous (43-53%)
or mucinous hystology (43-52%).12,13,15
The pathogenic mechanisms involved in the development of ovarian
cancer are poorly understood. The traditional view is that the ovarian surface
epithelium (OSE) repeatedly invaginates throughout a woman’s reproductive
life to form clefts and inclusion cysts (e.g., after ovulation). The epithelium
lining these cortical inclusion cysts may undergo Müllerian metaplasia induced
by the hormone-rich stromal milieu, giving rise to ovarian tumors via a series of
step-wise mutations.5 More recently, it has been proposed that a proportion of
EOCs may arise via different pathways depending on their histology: Serous
tumors may develop from implantation of tubal epithelial cells onto the ovarian
surface, or from serous tubal intraepithelial carcinomas that metastasize to the
ovary.5,16 Endometrioid and clear cell tumors may arise from endometriosis, and
mucinous tumors are hypothesized to develop in a step-wise manner from
pre-existing mucinous cystadenomas or borderline tumors.17,18
There are several epidemiologic factors associated with risk of EOC. Risk
has been shown to decrease with increasing parity, as well as with use of oral
contraceptives (OC),19-27 and to some extent also with older age at last birth,
lactation, hysterectomy, or tubal ligation.19,20,22,23,28-30 Well-established risk
factors for EOC include: age, nulliparity, prolonged use of hormone replacement
therapy (HRT), as well as family history of ovarian cancer, 20,23,31-36 and to some
extent also infertility (in involuntarily nulliparous women), endometriosis, talc
use, or smoking.19,20,37-41 Other factors, such as age at menarche and menopause,
yielded inconclusive results, with studies reporting a weak decrease in risk with
increasing age at menarche/menopause19,23 or showing no association.19,22 A

4
recent meta-analysis of 27 epidemiologic studies supported the inverse
association of older age at menarche and risk of ovarian cancer.42 Associations
between epidemiologic factors and disease risk have been reported to vary by
menopausal status at diagnosis,43 to differ in mucinous tumors as compared to
non-mucinous tumors (e.g., association of smoking with increased risk of
mucinous tumors only),44,45 and to vary by histologic subgroups46,47 or to be
similar among them.23,48
All of the major etiological hypotheses for carcinogenesis of EOC are
partially supported by epidemiologic observations, but none of them can explain
EOC carcinogenesis on its own: The ‘Incessant Ovulation Hypothesis’ postulates
that the repetitive wounding and healing of the OSE and the adjacent tubal
epithelium, induced by monthly ovulation, increases cell proliferation and thus
the likelihood of genomic instability which could lead to oncogenesis.49 This
hypothesis is in line with the observed risk reduction with parity, lactation, and
OC use. The ‘Gonadotropin Hypothesis’ implicates direct and indirect
stimulation of the OSE by gonadotropins, leading to the development and
progression of ovarian tumors.50 Support comes from the observed protective
effects of parity and OC use, but this hypothesis does not explain the increased
risk with HRT use, even though HRT reduces gonadotropin concentrations.51
Another hypothesis postulates that ovulation entails inflammation of the OSE,
promoting mutagenic factors such as oxidative stress, DNA damage and repair,
as well as elevated concentrations of cytokines and prostaglandins.52 In fact,
factors associated with inflammation (e.g., endometriosis, ovulation, talc use)
increase risk of EOC. On the other hand, no clear association was observed for
anti-inflammatory drugs with reduced risk.53 The ‘Incessant Menstruation
Hypothesis’ suggests that repeated exposure to retrograde menstruation
exposes the ovary and fallopian tube to reactive oxygen species and oxidative
iron from the blood.54 This hypothesis is supported by the reduced risk
associated with hysterectomy and tubal ligation. The ‘Wash-out Hypothesis’ is
based on the observed protective effect of pregnancy, implicating that cells that
have undergone malignant transformation are removed from the ovaries during
each pregnancy.21,55 Endogenous hormones are hypothesized to be involved in
the pathogenesis of EOC.56 Hormonal factors, such as steroid hormones or the
5
growth hormone (GH) / insulin-like growth factor-I (IGF-I) axis, may be
involved in the etiology of EOC, as they play a central role in regulating cell
proliferation, differentiation, and apoptosis.56-58 This work explores the
endogenous hormones hypothesis in detail.
1.2 Pregnancy and Ovarian Cancer
The overall protective effect of parity seems to pertain to all epithelial
ovarian tumors, with differing magnitude, irrespective of invasiveness,21,59-62
histological subtype,25,63,64 or other histo-pathological classifications.65,66
However, there are also studies indicating that pregnancy may not be related to
mucinous tumors or may even increase risk.61,67-69
Observations of low disease rates among groups with high parity, such as
Mormons and Seventh-Day Adventists,70,71 and high disease rates among
nulliparous women, such as nuns,72 provided some of the first evidence for a
possible protective effect of parity on risk of EOC. Since then, epidemiological
studies have consistently showed the protective effect of pregnancy irrespective
of maternal race/ethnicity.73
In comparison to nulliparous women, parous women have a 30 to 50%
lower risk of developing ovarian cancer.19,25,62 While the first childbirth is
considered to confer the greatest risk reduction (~40%),74 each subsequent birth
further decreases risk by 8-14%.19,21,25,75
Results from observational studies on the effect of incomplete
pregnancies on risk of EOC are inconclusive; some studies have reported a
decrease in risk,19,23 while others showed no association.20,76 Yet another study
observed an increased risk of EOC for women with multiple miscarriages.77 One
reason for the inconsistent findings might be that incomplete pregnancies
included voluntary abortions, miscarriages, and other terminations with
differing duration of pregnancy. These subtypes of incomplete pregnancy may
have a different association with risk due to associated medical conditions or
hormonal changes (e.g., underlying infertility, progesterone insufficiency).
Another reason could be under- or misreporting of incomplete pregnancies.78
Furthermore, women with voluntary abortions tend to have completed fewer

6
pregnancies over their reproductive lifespan and failure to study the effect of
incomplete pregnancies across strata of women with the same number of
full-term pregnancies could mask a possible association with risk of EOC. A
large pooled analysis indicated similar rates of protection per month of
gestation in full-term and incomplete pregnancies.19 The lesser protection
conferred by incomplete pregnancy was attributed to its shorter duration.19
1.3 Hormones in Pregnancy and Ovarian Cancer
The biological mechanisms underlying the protective effect of pregnancy
on EOC risk are largely unknown. The ovulation interruption related to
pregnancy is associated with greater decrease in risk as compared to 12 months
of anovulation induced by oral contraceptive use, delayed menarche, or early
menopause.19,56,74 Thus, it was proposed that hormonal changes associated with
pregnancy (other than gonadotropins) mediate the protective effect of
pregnancy on ovarian cancer risk.
Figure 3. Circulating hormone concentrations (ng/mL) during pregnancy. Adapted from references 79-82
17-OHP AMH D4
E2 IGF-I Placental GH
P T
Pre-conception concentrations are midcycle values obtained from ref 83
0
100
200
300
400
0
2
4
6
8
pre-conception 1st trimester 2nd trimester 3rd trimester
IGF
-I, placen
tal GH
, P 17
-OH
P, A
MH
, D4
, E2,
T
Luteal-placental shift

7
There are substantial alterations in the secretion, metabolism, and
concentrations of circulating hormones in maternal serum during gestation
(Figure 3). The main source of estradiol and progesterone production during
pregnancy is the placenta. The liver continuous the production of IGF-I and the
ovaries remain the main source of the anti-Müllerian hormone (AMH) and
androgens. A simplified illustration of the main hormone production sites
during pregnancy is presented in Figure 4.
During the very first weeks of pregnancy, the corpus luteum secretes
progesterone, 17-hydroxyprogesterone (17-OHP), and estradiol in increasing
quantities. The major site of synthesis for progesterone and estradiol shifts to
the placental trophoblasts as the corpus luteum declines (after approximately
the seventh week of gestation), and concentrations of these hormones further
increase as pregnancy progresses, whereas the concentration of 17-OHP
decreases.82 Early pregnancy androgen concentrations are similar to those in
non-pregnant women, and increase more modestly with progressing gestation.
Early pregnancy IGF-I concentrations are lower than those of non-pregnant
premenopausal women, but rise with progressing pregnancy, following the
Figure 4. Main hormone production sites during pregnancy
Mother Placenta Fetus
Cholesterol Cholesterol
Progesterone
3β-HSD
Adrenal glands Adrenal glands
3β-HSDAromatase
Estradiol
Placental GHIGF-I
AMHandrostenedione
testosterone
Liver
DHEA-SDHEADHEA-S
Ovary
Pituitary GH
Figure composed of information obtained from references 84-86
8
increasing concentrations of placental GH. AMH levels in early pregnancy are
similar to pre-pregnancy concentrations and decline across gestation.
1.3.1 Progesterone
In premenopausal, non-pregnant women, progesterone is mainly
synthesized by the corpus luteum in the luteal phase, with relatively low
concentrations in the follicular phase of the menstrual cycle. The site of
production in early pregnancy is the corpus luteum; this changes to the placenta
after the luteal-placental shift (between weeks 7-10 of pregnancy).87
Progesterone concentrations rise from <50 ng/mL in the first trimester to ~200
ng/mL in the third trimester (Figure 3).87
Progesterone is the most likely candidate to mediate a ‘washout effect’ of
pregnancy, i.e., to eliminate cells from the ovary that have undergone malignant
transformation.21 Progesterone has been shown to increase apoptosis, to induce
cellular senescence of ovarian cancer cells through FOXO1,88 and to inhibit the
growth of normal ovarian surface epithelial cells,89,90 as well as of benign and
malignant ovarian tumor cells.91-95
Exposure to high levels of progesterone as observed during pregnancy
(~3-15 - times higher with progressing pregnancy as compared to non-pregnant
women),96 combined with the strong pro-apoptotic effect of progesterone on the
ovarian surface epithelium, is one possible explanation for the observation that
the protection associated with pregnancy is stronger than the protection accrued
through simple ovulation suppression (e.g., by OC use). This hypothesis is also
supported by the beneficial effect of twin pregnancies, where progesterone
concentrations at gestation week 26 are 1.8-times higher as compared to a
singleton pregnancy.97 Several studies, but not all,98-100 have indicated that
women who had a twin pregnancy tend to have lower risk of ovarian cancer,
irrespective of tumor invasiveness, as compared to women who had only
singleton pregnancies.69,101,102

9
1.3.2 17-OHP
In premenopausal, non-pregnant women 17-OHP, the precursor hormone
for ovarian and adrenal synthesis of androgens, is secreted by the corpus
luteum, and concentrations peak during the luteal phase (~2.9 ng/mL), while
throughout the remaining menstrual cycle lower levels are observed (<2.25
ng/mL).83 In pregnant women, 17-OHP concentrations peak during weeks 5-6 of
gestation and gradually decrease and plateau after the luteal-placental shift
(Figure 3), as the placenta lacks P450C17 to convert progesterone to 17-OHP.82
Little is known about the biologic activity of 17-OHP, but it has been
shown that elevated 17-OHP levels are associated with 17-hydroxylase excess as
well as 21-hydroxylase deficiency both resulting in hyper-androgenism.103,104
To our knowledge, no prior epidemiologic data exist on the association of
17-OHP with EOC risk.
1.3.3 Androgens
During pregnancy, as in non-pregnant women, androgens are produced
by the ovaries and the adrenal cortex; the adrenal glands and liver of the fetus
are additional minor sources of androgens (Figure 4).105 Circulating testosterone
concentrations increase gradually (~2-fold) between preconception and the
third trimester, while concentrations of androstenedione remain stable across
gestation (Figure 3).82,96,106 Given that androgens are relatively stable in early
pregnancy, the androgens quantified in this study (testosterone and
androstenedione) are likely representative of circulating premenopausal
androgen concentrations.
Support for the involvement of androgens in the pathogenesis of EOC is
derived from results of in vitro studies demonstrating increased cell
proliferation of normal ovarian surface epithelial cells after androgen
administration.107,108 Epidemiological studies show a protective effect of OC use,
which reduces ovarian androgen synthesis and circulating androgen levels.58,107-
109 Women diagnosed with polycystic ovary syndrome (PCOS), a
hyper-androgenic disorder, might be at increased risk, however, available data
are sparse and inconclusive.110-112
10
To date, studies directly relating pre-diagnostic endogenous androgen
concentrations to risk of EOC are inconclusive and only few considered EOC
subtypes. Two studies reported that women with higher androstenedione
concentrations were at increased risk of developing EOC,113,114 whereas two
other studies observed no association between serum concentrations of
androgens with EOC risk.115,116 The most recent study observed no association
with risk overall, but a decreased risk of serous EOC with higher levels of
androstenedione.117
1.3.4 Estradiol
Estradiol is synthesized by aromatization of androgens that are derived
from the ovary and the maternal and fetal adrenal, and synthesized de novo in
placental syncytiotrophoblasts (Figure 4).105,118 In premenopausal, non-pregnant
women estradiol is secreted by the granulosa cells of the ovary, whereas during
pregnancy it is synthesized mainly in the placenta. Estradiol concentrations rise
from ~1 ng/mL at week 5 of gestation to ~15 ng/mL at week 40.82,106
In vitro and animal studies have shown the potential of estrogens to
stimulate cell proliferation and inhibit apoptosis of OSE and ovarian cancer
cells.119-123 To date, only one epidemiologic study (n=31 cases) reported a
non-significant association of endogenous estradiol and EOC risk.113 However,
prior studies reported increased risk of endometrial cancer with higher
endogenous estradiol concentrations in postmenopausal women.124,125 As
endometrioid ovarian tumors are histologically similar to endometrial tissue,
increased estradiol levels may also be associated with an increased risk of
endometrioid EOC.
It has also been observed that women with endometriosis, which is
associated with molecular aberrations that favor higher local production of
estradiol,126 are at an increased risk of developing endometrioid EOC.37,38
Furthermore, recent large-scale epidemiologic studies observed that women
using estrogen-progestin HRT regimens for more than 5 years or those using
estrogen-only regimens are at increased risk of developing EOC.34-36

11
1.3.5 IGF-I and placental GH
During pregnancy, IGF-I is involved in the regulation of fetal and
placental growth and development. Maternal concentrations of circulating IGF-I
are regulated by liver synthesis dependent on pituitary GH, which, by
mid-pregnancy, is replaced by placental GH (Figure 4).
Placental GH
Placental GH is a biologically active variant of the pituitary GH, with
similar somatogenic bioactivity, i.e., growth-related effects. In contrast to the
pulsatile secretion of pituitary GH, placental GH is secreted in a continuous
manner, providing an estimate of exposure through a single measurement.127,128
In sera of pregnant women, placental GH has been detected as early as weeks
5-8 of gestation. During pregnancy, it increases gradually (Figure 3), reaches
peak levels at 36-37 weeks, and is undetectable at delivery after placental
expulsion.79,129 Cross-sectional studies of normal pregnancies, as well as
pregnancies complicated by conditions such as pre-eclampsia or gestational
diabetes, have shown that placental GH correlates with IGF-I, regardless of
complications, confirming its role in the control of IGF-I synthesis during
pregnancy.130-132
IGF-I
Early pregnancy circulating IGF-I concentrations are slightly lower than
concentrations in non-pregnant women.79,130-132 However, pre-pregnancy IGF-I
concentrations are correlated with those measured at pregnancy week 8
(r=0.57) or week 16 (r=0.39).80 The observed decrease in IGF-I is a consequence
of the pregnancy-associated increase in circulating estradiol, which results in
hepatic resistance to pituitary GH.133 Maternal IGF-I levels increase by >40%
after 24-27 weeks of pregnancy and decrease rapidly postpartum to return to
pre-pregnancy values (Figure 3).80,87,134,135
IGF-I signaling may promote tumor development, including gynecologic
cancers,136 by exerting its well-established mitotic, anti-apoptotic, and
pro-angiogenic effects.137 IGF-I and its binding proteins are involved in the

12
regulation of ovarian follicle development, steroidogenesis, and cellular mitosis
and apoptosis in ovarian tissue.138,139 Experimental studies have shown the
presence of IGF-I protein, receptor, and mRNA in ovarian cancer cells and
tissues and have confirmed the association with progression of ovarian
cancer.136,140 It has also been reported that IGF-I levels are significantly higher
in cyst fluid from invasive malignant epithelial ovarian neoplasms compared to
cyst fluid from benign neoplasms, and that higher serum concentrations are
associated with a more favorable outcome.141,142
Prior prospective studies investigating the association between IGF-I and
ovarian cancer either did not see an overall association143-145 or observed a
modest inverse association.146
1.3.6 anti-Müllerian Hormone
The anti-Müllerian hormone (AMH), also known as the Müllerian
inhibiting substance (MIS), is responsible for the regression of the Müllerian
ducts during fetal life in males.147 Absence of AMH production in female fetuses
results in the development of the uterus, the fallopian tubes, and the upper
vagina from the Müllerian ducts.
During the reproductive life of women, AMH is secreted by the granulosa
cells of the growing follicles (i.e., primary, secondary, pre-antral, and small
antral follicles).148,149 AMH is a marker of the ovarian reserve; its concentrations
are very low at birth, increase significantly at puberty, remain stable thereafter
until age ~25 years, and then slowly decline to be undetectable at the onset of
menopause, when the ovarian follicle pool is exhausted.148,150 In early
pregnancy, AMH concentrations are similar to those in non-pregnant women,
with AMH levels decreasing ~50% by the third trimester of pregnancy
(Figure 3), and returning to pre-pregnancy concentrations shortly after
delivery.81,151,152 Possible reasons for the decline across gestation are
hypothesized to be the reduced follicular maturation, pregnancy-associated
haemodilution, and increased plasma-protein binding.153
The clinical use of AMH is well established. Serum AMH is utilized for the
diagnosis and follow-up of patients with granulosa cell tumors, it can be
13
predictive of ovarian response after in vitro fertilization treatments, and it is
under discussion to become a diagnostic criterion for patients with PCOS.153-155
AMH is a member of the transforming growth factor superfamily and
binding to its specific type II receptor (AMHRII) activates down-stream
pathways notable for differentiation and growth inhibition.156 AMH has been
shown to inhibit the growth and migration of EOC and to induce G1 arrest of
ovarian cancer stem/progenitor cells.147,156,157 Based on these properties and
with the advantage of limited toxicity (high expression of functioning AMHRII
in EOCs, but not in most healthy tissues), AMH was proposed as a candidate for
adjuvant treatment of patients with ovarian cancer.147
To our knowledge, no prior epidemiologic data are available on the
associations of AMH with EOC risk.
1.4 Hormone Measurements throughout Pregnancy
The in utero conditions of pregnancy may impact subsequent disease risk
in the mother and the offspring.158 Parity is associated with maternal
cardiovascular disease,159 and is an established protective factor in breast,160
endometrial,161 and ovarian cancers.66 Early pregnancy hormones have been
investigated in the context of breast cancer in the mother,162 and are
investigated in relation to risk of ovarian cancer as part of this thesis. In the
offspring, the intrauterine environment might influence the risk of breast and
testicular cancer, the development of autistic disorders, and several other
adverse health outcomes.163-165
Depending on the outcome of interest, hormone concentrations measured
at different periods during pregnancy may be of relevance. For instance,
hormones measured in early pregnancy, during which the fetal organogenesis
takes place, may be particularly important when cancer in the offspring is of
interest, whereas hormone concentrations during late pregnancy may be
relevant in relation to maternal risk of breast and ovarian cancers given
evidence that complete pregnancies are most strongly associated with these
malignancies.77,166

14
Established biorepositories in Northern Europe (e.g., Finland, Iceland,
Sweden) store sera collected during early pregnancy (mostly in weeks 8 to 14)
for screening on systemic infections such as HIV, hepatitis, or rubella.
Worldwide, several pregnancy and birth cohorts have been established over the
last three decades to study associations between early-life exposures
(e.g., genetic, environmental, or lifestyle factors) with health and disease
outcomes in the mother and/or the offspring. Many of the existing cohorts
include specimens drawn once during the first half of pregnancy,167-171 with few
collections obtaining a blood sample later in pregnancy.172,173 Furthermore, the
majority of cohorts with 2 or more specimens sampled in the same woman
during various periods of pregnancy have a limited number of participants
(<15 000 women).172,174-176 Few studies obtained blood in consecutive trimesters
from sizeable cohorts of pregnant women.177-179 A sufficiently large study base is
necessary as for some diseases (e.g., maternal cancer or chronic adult diseases
in the offspring) cohort members must be followed as long as decades to
accumulate a reasonable number of cases before an investigation can start.
It is not established whether the hormonal measurement from a single
blood specimen collected during one pregnancy is representative of the
exposure throughout gestation, or exposure in a subsequent pregnancy. Some
insights come from what is known about the regulation of hormonal synthesis
during pregnancy82,87 and initial epidemiological data.106,180 However,
characterizing the extent to which a single measurement in early pregnancy is
representative of concentrations in the third trimester of the same pregnancy, as
well as in a subsequent pregnancy, could help optimize the use of existing
maternity cohorts, in which only one single blood specimen is available.

15
2. Aims
Given essentially no data on endogenous hormones in pregnancy and
subsequent risk of ovarian cancer in the mother, we investigated the aims as
summarized below:
1) Examine the associations of circulating first trimester hormone
concentrations with risk of maternal epithelial ovarian cancer overall and in
subgroups defined by histological subtypes. Hormones of interest, and the
direction of association hypothesized, are:
a) Testosterone and androstenedione are expected to be positively
associated with risk.
b) Progesterone is expected to be inversely associated with risk.
c) 17-OHP is expected to be positively associated with risk.
d) Estradiol is expected to be positively associated with risk.
e) SHBG is expected to be inversely associated with risk.
f) IGF-I and placental GH are expected to be positively associated with.
2) Evaluate the associations of circulating first trimester AMH concentrations
with risk of maternal invasive serous ovarian cancer. Higher AMH levels are
expected to be inversely associated with risk.
3) Examine how well first and second trimester hormone concentrations are
representative of the concentrations in the third trimester during the same
or subsequent pregnancies.

16
3. Materials and Methods
3.1 Nested Case-Control Study
3.1.1 Cohort Descriptions
The Northern Sweden Maternity Cohort (NSMC) and the Finnish
Maternity Cohort (FMC) are two long-standing maternity cohorts that preserve
serum samples drawn from women during early pregnancy. Blood samples are
drawn and tested for systemic infections before being centrally stored at -20°C
(NSMC) or -25°C (FMC).
The NSMC at Umeå University, with more than 120 000 samples from
91 000 women (as of 2013), was established in 1975 and includes pregnancies
from the four northernmost counties of Sweden (Västerbotten, Norrbotten,
Jämtland, Västernorrland).167,181 The FMC, a nationwide initiative at the
National Institute of Health and Welfare in Oulu, was established in 1983 and
contains close to 2 million serum samples from more than 850 000 pregnant
women (as of 2011).167,182
3.1.2 Selection of Study Subjects
Study subjects were selected among members from the two cohorts with:
i) no history of twin or multiple pregnancies; ii) a blood sample obtained during
the first trimester of a pregnancy leading to childbirth; and iii) no history of
invasive cancer (except for non-melanoma skin cancer) or borderline ovarian
tumors before blood draw. Furthermore, due to changes in sample handling that
may affect hormone measurements, samples in the NSMC drawn after
December 31st, 1987 were excluded.183
Identification of Cases
Cases diagnosed with invasive or borderline EOC after blood donation
were identified through linkages with the Finnish Cancer Registry (founded in
1952) and the Swedish Cancer Registry (founded in 1958). Reporting of newly
diagnosed cases is mandatory in both nationwide cancer registries, leading to
very high (>95%) completeness of coverage for solid tumors.184,185 We identified
1 105 incident EOC cases among FMC participants diagnosed between July 1984
17
and December 2009 and 146 incident EOC cases among NSMC members
diagnosed between February 1979 and March 2011. The serum sample from the
last singleton pregnancy (or the most recent available for 69 cases) resulting in
delivery of a neonate before diagnosis was selected for the study.
Selection of Controls
Up to 12 potentially eligible controls per case were identified through
linkages with the national population registries. Controls were matched on
study cohort, age at sampling (±6 months), date of sampling (±3 months),
parity at sampling (1, 2, >2), and parity at diagnosis (1, 2, >2); eligible controls
were alive at the time of the diagnosis of the index case. In a second step, three
controls were selected at random for cases with information on gestational age
(n=906; 72%) at blood collection and two controls were randomly selected for
those cases without this information (n=345; 28%). This approach was chosen
to improve the statistical power in analyses on women with information on
gestational age.
Cases with insufficient serum volume for laboratory measurements
(FMC: n=157 and NSMC: n=31) and cases for whom no eligible controls could
be identified (FMC: n=5 and NSMC: n=6) were excluded. Therefore, a total of
1 052 EOC cases (FMC: n=943 and NSMC: n=109) and 2 695 controls (FMC:
n=2 384 and NSMC: n=311) were included in the final study population.
3.1.3 Tumor Data
Morphology codes were provided by the Finnish and Swedish cancer
registries and classified into the EOC histological subgroups serous (n=477,
45%), mucinous (n=356, 34%), endometrioid (n=102, 10%), clear cell (n=26,
3%), and NOS (n=66, 6%), using the World Health Organization guidelines.186
Data on histology were not available for 25 cases (2%), and, thus, these cases
were included only in overall analyses and analyses of tumor invasiveness, as
were tumors diagnosed as NOS. Data on stage at diagnosis were not available
for cases from the NSMC, but were available for 87% of cases from the FMC. For
cases from the FMC, stage I (n=482, 58%) was classified as localized, whereas
18
stages II (n=6), III (n=306), and IV (n=30) were classified as advanced EOC
(n=342, 42%).
3.1.4 Covariate Data
Characteristics related to pregnancy (e.g., pregnancy length, smoking
during pregnancy) and to the newborn (i.e., gender, and birth weight and
length) were obtained through linkages from the country-specific birth
registries. The completeness of the Swedish Birth Registry is limited,187 thus, a
full copy of the maternity and delivery records was requested for members from
the NSMC and information from the medical records was abstracted by trained
personnel. To ensure quality control, dates of sampling and last menstrual
period were computerized in duplicate.
Gestational age (GA) was calculated as difference in days between dates at
blood donation and last menstrual period (LMP) for participants from the
NSMC. As information on date of LMP was not available for the FMC,
gestational age was calculated using the following formula:
280 - (date of expected delivery - date at blood draw)
For 2 200 members of the FMC (n=629 case-control sets; 60%),
information on malignant cancers diagnosed among first-degree relatives was
obtained through linkages with the Finnish population and cancer registries.
Missing values of the continuous covariates maternal age at first birth
(2%), birth weight (22%), and birth length (22%) were assigned the individual
cohort (NSMC or FMC) case-control-specific median value for the respective
variable. Missing values for the categorical covariates smoking during index
pregnancy (24%), family history of breast and/or ovarian cancer (40%), and
child’s sex (0.1%) were assigned to a ‘missing’ category.
19
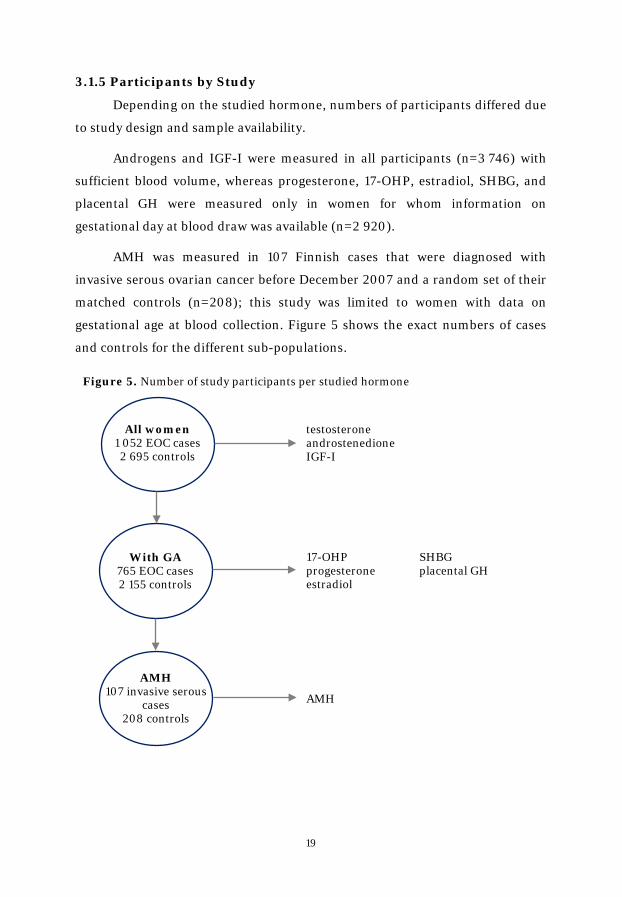
3.1.5 Participants by Study
Depending on the studied hormone, numbers of participants differed due
to study design and sample availability.
Androgens and IGF-I were measured in all participants (n=3 746) with
sufficient blood volume, whereas progesterone, 17-OHP, estradiol, SHBG, and
placental GH were measured only in women for whom information on
gestational day at blood draw was available (n=2 920).
AMH was measured in 107 Finnish cases that were diagnosed with
invasive serous ovarian cancer before December 2007 and a random set of their
matched controls (n=208); this study was limited to women with data on
gestational age at blood collection. Figure 5 shows the exact numbers of cases
and controls for the different sub-populations.
Figure 5. Number of study participants per studied hormone
All women 1 052 EOC cases 2 695 controls
With GA 765 EOC cases 2 155 controls
AMH 107 invasive serous
cases 208 controls
testosterone androstenedione IGF-I
17-OHP SHBG progesterone placental GH estradiol
AMH

20
3.1.6 Laboratory Analyses
The hormone analyses were performed on serum samples obtained from
the NSMC and the FMC. All hormonal measurements were performed at the
Clinical Chemistry Laboratory of the Umeå University Hospital, Umeå, Sweden.
Samples from case subjects and their matched control subjects were always
analyzed within the same batch, assay kit, and on the same day. The technicians
performing the assays were blinded to the case, control, or quality control status
of the specimens. In addition to routine laboratory quality controls, two pools of
serum from each of the cohorts were created at the beginning of the study and 3
aliquots, undistinguishable from the test samples, were inserted in each
laboratory run.
Concentrations of testosterone (ng/mL), androstenedione (ng/mL),
17-OHP (ng/mL), progesterone (ng/mL), and estradiol (ng/mL) were quantified
by high-performance liquid chromatography tandem mass spectrometry on an
Applied Biosystems API4000 triple stage quadrupole mass spectrometer.
SHBG (nmol/L) was quantified with solid-phase competitive
chemiluminescence assays on Immulite 2000 Siemens analyzer.
Concentrations of IGF-I (ng/mL) were measured on the Immulite 2000
Siemens analyzer, a solid-phase enzyme-labeled chemiluminescent
immunometric assay, using reagents from Siemens Medical Solutions
Diagnostics (Siemens, Los Angeles, CA, USA).
Placental GH (ng/mL) was quantified by an in-house method as no
commercial methods were available at the beginning of the project. A mouse
antihuman monoclonal antibody (Abnova, Taipei City, Taiwan) was used
against full-length placental growth hormone as capture antibody and a rabbit
polyclonal antibody (Abnova) as detection antibody. Detection was done by
electrochemoluminescence on a MSD Sector Imager 2400-instrument (Meso
Scale Discovery, Gaithersburg, MD, USA).
AMH (ng/mL) was quantified by a second generation specific ELISA
(Diagnostic Systems Laboratories, Webster, USA). One case and three controls
had AMH concentrations below the detection limit of the assay and they were

21
assigned the value of 0.08 ng/mL, which is the midpoint between 0 and the
assay detection limit of 0.16 ng/mL.
Inter- and intra-assay coefficients of variation (CV) based on the blinded
pooled quality controls were <15% for samples from the FMC and the NSMC for
all sex steroids, SHBG, IGF-I, placental GH, and AMH.
3.1.7 Statistical Methods
All statistical analyses were conducted using the Statistical Analyses
System (SAS) software, versions 9.2 and 9.3 (SAS Institute, Inc., Cary, North
Carolina). All statistical tests were two-sided and considered significant at
p<0.05.
All hormone values were log2-transformed to better normalize their
distributions and to allow estimation of the effect of a doubling of the hormone
concentrations on EOC risk. Concentrations of 17-OHP, progesterone, SHBG,
estradiol, and placental GH were correlated with gestational age (r=-0.26, 0.49,
0.57, 0.69, and 0.75, respectively; p<0.0001). Analyses including these
hormones were limited to women with information on GA (n=765 case-control
sets; 73%) and GA was included as a covariate in the statistical models.
Spearman correlation coefficients, adjusted for study cohort and gestational age,
where necessary, were used to assess correlations between individual hormone
concentrations and with covariates separately in cases and controls.
We used conditional logistic regression, appropriate for the individually
matched study design, to assess differences between cases and controls and to
calculate odds ratios (OR) and corresponding 95% confidence intervals [CI]. For
each of the hormones, ORs were calculated for tertiles of hormone
concentrations using the cohort-specific distribution in controls. Likelihood
ratio tests were used to assess linear trends across categories based on the
median hormone values for the tertiles. In addition, ORs were calculated for a
one-unit change of log2-transformed hormones (ORlog2).
The effect of potential confounders (maternal age at first birth, smoking
during index pregnancy, family history of breast and/or ovarian cancers, child’s
sex, birth length and weight) was evaluated. Apart from family history of
22
ovarian and/or breast cancer (no, yes, unknown) in the analyses of AMH,
adjustment for potential confounders had a negligible effect (<10%) on risk
estimates and were not retained in the final models. We repeated the analyses
for each of the hormones mutually adjusting for the other hormones.
Analyses were performed by histology, ages at sampling and diagnosis
(histology-specific; below/above median), time between blood donation and
diagnosis (i.e., ‘lag-time’; below/above median), stage (localized vs. advanced
disease), and number of children at diagnosis / selection as a control (1 vs. >1).
To assess risk of EOC occurring before and after menopause, analyses were
stratified by age at diagnosis <46 (premenopausal), 46-55, and ≥55 years
(postmenopausal).
Tests of heterogeneity between the ORs in different subgroups were based
on chi-square statistics, calculated as the deviations of logistic regression
coefficients observed in each of the subgroups, relative to the overall regression
coefficient.188
We conducted sensitivity analyses excluding women diagnosed <2 years
(n=85 case-control sets; 8%) or <3 years (n=130 case-control sets; 12%) after
blood donation to assess whether the study results were influenced by the
presence of undiagnosed, but hormonally active tumors. Further sensitivity
analyses were limited to women who provided a blood sample during a full-term
pregnancy (n=724 case-control sets; 69%) or to women who donated blood
during the last pregnancy before diagnosis or selection as a control (n=983
case-control sets; 93%). Finally, we repeated the analyses excluding statistical
outliers, i.e. women with hormone concentrations exceeding 3 times the
interquartile range (2 for analyses on androgens, progesterone, and placental
GH; 4 for analyses on 17-OHP; 8 for analyses on SHBG).

23
3.2 Longitudinal Study
3.2.1 Selection of Study Subjects
The longitudinal study was designed to establish how well first and
second trimester hormone concentrations represent hormone concentrations in
the third trimester of the same or subsequent pregnancies. The study is based
on serial samples available from the Finnish Maternity Cohort.
Study subjects were women participating in a population-based screening
trial for congenital infections conducted between January 1, 1988 and June 30,
1989 in the 76 maternity centers in the metropolitan Helsinki area. All pregnant
women aged 15-45 years (n=18 616) were invited to donate a blood sample
during the 1st, 2nd, and 3rd trimesters of pregnancy.179
Among the 16 793 participants who donated serum samples at three time
points during pregnancy (90% of women invited), we first selected women with
a singleton, healthy offspring at term resulting from a natural pregnancy. In a
second step, we randomly selected 25 women giving birth to their first child
(primiparous) and 25 women giving birth to their second child (biparous), aged
20-34 years at blood collection, and whose blood samples were obtained at
weeks 10-12 (1st trimester, T1), weeks 20-22 (2nd trimester, T2), and weeks 35-37
(3rd trimester, T3) of one pregnancy. Additionally, 21 women with two
consecutive singleton pregnancies during the study period were included. These
women donated samples for both pregnancies in gestational weeks 8-14, 18-24,
and 33-38. All blood samples were processed using a standardized protocol and
stored at -20ºC.179
Characteristics related to pregnancy (e.g., smoking during pregnancy,
pregnancy length, parity) and to the newborn (e.g., gender, birth weight and
length) were obtained through linkages from the Finnish Birth Registry.
3.2.2 Laboratory Analyses
All hormonal measurements were performed at the Clinical Chemistry
Laboratory of the Umeå University Hospital, Umeå, Sweden. Samples from a
single pregnancy were always analyzed within the same batch, assay kit, and on
the same day. Laboratory personnel were blinded to the study and quality
24
control status of the samples. In addition to routine laboratory quality controls,
a pool of serum was created at the beginning of the study and 2 aliquots,
undistinguishable from the test samples, were inserted in each laboratory run.
All reported intra- and inter-assay CVs are based on the blinded pooled quality
controls.
Serum concentrations of estradiol (ng/mL), progesterone (ng/mL), and
testosterone (ng/mL) were quantified by high-performance liquid
chromatography tandem mass spectrometry (HPLC-MS) on an Applied
Biosystems API4000 triple stage quadrupole mass spectrometer.
Inter- and intra-assay CVs were <18% for estradiol and progesterone,
whereas the inter-assay CV for testosterone was 44%. After removing a single
batch for testosterone, the inter-assay CV decreased to 12%.
3.2.3 Statistical Methods
Women with one pregnancy were analyzed separately from those with
two pregnancies.
Spearman's rank correlation coefficients were used to assess the
correlations between the investigated hormones at the same point in time
(e.g., correlation between estradiol and testosterone in the 1st trimester), as well
as between-trimester correlations for each hormone (e.g., correlation between
1st and 2nd trimester estradiol), and to measure the correlation of hormone
concentrations between two consecutive pregnancies in the same woman
(e.g., correlation between 1st trimester estradiol in pregnancy 1 and
pregnancy 2).
We calculated median percentage changes from the 1st to 3rd trimester to
assess the changes in maternal hormone concentrations throughout pregnancy
and tested the differences in hormone concentrations between the trimesters
with the Kruskal Wallis test (pKW).189 The Mann-Whitney-U test (pMW) was used
to assess whether hormone concentrations in the three trimesters were
significantly different by parity (primi- (n=25) vs. biparous (n=25)), smoking
status at first blood draw (current (n=8) vs. no (n=39)), and fetal gender (male
(n=23) vs. female (n=27)).
25
The percentage change in the 3rd trimester hormone concentrations were
estimated per 1% increase in hormone levels measured in the 1st and/or 2nd
trimester, adjusted for gestational age.190 Maternal and newborn characteristics
were added to these models, one at a time, to assess their individual
contribution to 3rd trimester hormone concentrations, and as a full adjustment
set.
We used the Wilcoxon signed rank sum (pWS) test to compare differences
in hormone concentrations by trimesters of the two consecutive pregnancies.189
For the study population of women with one pregnancy, we conducted
sensitivity analyses limited to women who were pregnant for the first
(primigravid; n=19) or second time (bigravid; n=19) to assess whether observed
differences between primi- and biparous women were due to gravidity or parity.
All statistical tests were two-sided and considered significant at p<0.05.
Statistical analyses were performed with the Statistical Analyses System (SAS)
software, version 9.3 (SAS Institute, Inc., Cary, North Carolina).
26
4. Results
4.1 Case-Control Study
4.1.1 Descriptive Statistics
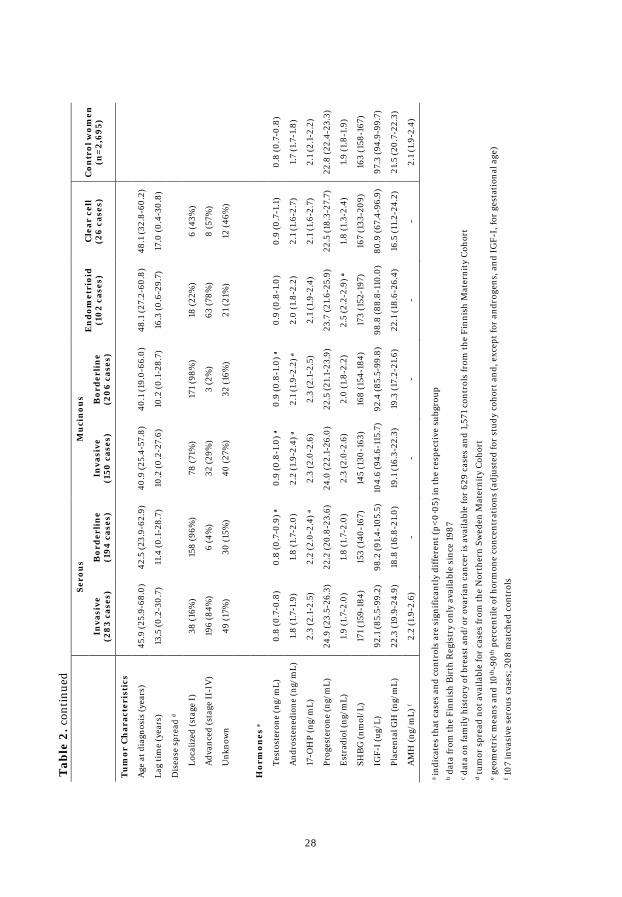
Key characteristics of the study population, with cases presented by
tumor histology, are displayed in Table 2. The majority of the 1 052 cases were
diagnosed with invasive EOC (n=642, 61%). Of these, 283 (44%) were serous,
150 (23%) mucinous, 102 (16%) endometrioid, 26 (4%) clear cell, and 81 (13%)
with NOS or unknown histology. Among the borderline tumors (n=410, 39%),
194 (47%) were serous, 206 (50%) mucinous, and 10 (2%) NOS or unknown
histology. The distribution by histological subtype and invasiveness was
consistent between the two cohorts. Invasive tumors were predominantly
diagnosed as advanced disease (69%), whereas almost all borderline tumors
were diagnosed as localized disease (97%). Median age at EOC diagnosis was
43.9 years and, on average, 12.2 years elapsed between blood donation and
diagnosis among all cases.
Cases with mucinous tumors (borderline and invasive) had the shortest
lag-time between blood collection and cancer diagnosis (10 years) and the
youngest median age at diagnosis (40.1 and 40.9 years, respectively), whereas
cases diagnosed with endometrioid or clear cell tumors had the longest lag-time
(16.3 and 17.0 years, respectively) and were the oldest at diagnosis (48.1 years).
Cases with borderline tumors were younger at first birth, cases with
borderline and invasive mucinous and invasive serous tumors were more likely
to smoke, and cases with invasive serous tumors were more likely to have a
family history of breast and/or ovarian cancer relative to their matched controls.
AMH was analyzed in 107 cases diagnosed with invasive serous ovarian
cancer and 208 controls. Case and control characteristics were similar to those
observed in the overall study population.

27
Se
rou
s M
uci
nou
s E
nd
omet
rioi
d (1
02
case
s)
Cle
ar c
ell
(26
case
s)
Con
trol
wom
en
(n=
2,69
5)
In
vasi
ve
(28
3 ca
ses)
B
ord
erli
ne
(194
cas
es)
Inva
sive
(1
50 c
ases
) B
ord
erli
ne
(20
6 ca
ses)
Stud
y co
hort
FMC
26
3 (2
8%)
174
(19%
) 14
3 (1
5%)
189
(20%
) 92
(10%
) 23
(2%
) 2,
384
(88%
)
NSM
C 20
(18%
) 20
(18%
) 7
(6%
) 17
(16%
) 10
(9%
) 3
(3%
) 31
1 (1
2%)
Age
at b
lood
don
atio
n (y
ears
) 32
.5 (1
6.4-
45.2
) 31
.1 (1
7.5-
44.0
) 31
.7 (1
9.4 -
45.7
) 30
.3 (1
7.3-
44.1
) 32
.3 (2
1.1-
41.0
) 31
.4 (2
2.2-
40.5
) 31
.5 (1
5.7-
45.5
)
Pari
ty a
t ind
ex p
regn
ancy
1 ch
ild
84 (3
0%)
41 (2
1%)
40 (2
7%)
62 (3
0%)
20 (2
0%)
11 (4
2%)
767
(28%
)
2 ch
ildre
n 97
(34%
) 82
(42%
) 64
(43%
) 79
(38%
) 47
(46%
) 11
(42%
) 1,
058
(39%
)
>2
child
ren
102
(36%
) 71
(37%
) 46
(30%
) 65
(32%
) 35
(34%
) 4
(15%
) 87
0 (3
2%)
Ges
tatio
nal a
ge (d
ay)
74 (3
9-13
6)
74 (3
8-14
1)
73 (4
4-14
2)
75 (4
2-13
4)
76 (4
1-12
5)
79 (4
3-11
7)
73 (3
8-14
8)
Age
at 1
st b
irth
(yea
rs) b
26.9
(14.
8-41
.6)
25.8
(16.
1-39
.5) a
27
.2 (1
5.8-
46.2
) 23
.9 (1
5.5-
42.5
) a
26.5
(16.
9-38
.4)
28.6
(20.
4-41
.1)
26.7
(14.
6-45
.9)
Full-
term
pre
gnan
cy le
ngth
b 19
1 (9
6%)
139
(97%
) 10
8 (9
4%)
147
(94%
) 57
(97%
) 16
(94%
) 2,
066
(96%
)
Chi
ld w
eigh
t (kg
) b 3.
6 (0
.8-4
.9)
3.7
(1.6
-4.9
) 3.
5 (1
.5-4
.5)
3.6
(0.5
-5.1
) 3.
6 (1
.8-5
.1)
3.4
(2.1
-4.3
) 3.
6 (0
.6-5
.9)
Chi
ld le
ngth
(cm
) b 51
(31-
56)
50 (4
2-57
) 51
(42-
56)
50 (2
9-56
) 50
(39-
55)
50 (4
3-53
) 50
(25-
56)
Chi
ld g
ende
r
Mal
e 13
9 (4
9%)
108
(56%
) 77
(52%
) 10
5 (5
1%)
51 (5
0%)
9 (3
5%)
1,41
6 (5
3%)
Fem
ale
144
(51%
) 86
(44%
) 72
(48%
) 10
1 (4
9%)
51 (5
0%)
17 (6
5%)
1,27
7 (4
7%)
Smok
ing
duri
ng p
regn
ancy
b 35
(18%
) a
22 (1
6%)
35 (3
1%) a
62
(40%
) a
6 (1
0%)
2 (1
2%)
330
(16%
)
Fam
ily h
isto
ry o
f bre
ast
and/
or o
vari
an c
ance
r c
21 (1
2%) a
7
(6%
) 3
(3%
) 10
(8%
) 5
(8%
) 2
(22%
) 81
(5%
)
Tab
le 2
. Dis
trib
utio
n of
cha
ract
eris
tics
of E
OC
cas
es b
y tu
mor
his
tolo
gy, m
edia
n (m
in, m
ax) o
r n
(%)
28
Se
rou
s M
uci
nou
s E
nd
omet
rioi
d (1
02
case
s)
Cle
ar c
ell
(26
case
s)
Con
trol
wom
en
(n=
2,69
5)
In
vasi
ve
(28
3 ca
ses)
B
ord
erli
ne
(194
cas
es)
Inva
sive
(1
50 c
ases
) B
ord
erli
ne
(20
6 ca
ses)
Tu
mor
Ch
arac
teri
stic
s
Age
at d
iagn
osis
(yea
rs)
45.9
(25.
9-68
.0)
42.5
(23.
9-62
.9)
40.9
(25.
4-57
.8)
40.1
(19.
0-66
.0)
48.1
(27.
2-60
.8)
48.1
(32.
8-60
.2)
Lag
tim
e (y
ears
) 13
.5 (0
.2-3
0.7)
11
.4 (0
.1-2
8.7)
10
.2 (0
.2-2
7.6)
10
.2 (0
.1-2
8.7)
16
.3 (0
.6-2
9.7)
17
.0 (0
.4-3
0.8)
Dis
ease
spr
ead
d
Loca
lized
(sta
ge I)
38
(16%
) 15
8 (9
6%)
78 (7
1%)
171
(98%
) 18
(22%
) 6
(43%
)
Adv
ance
d (s
tage
II-I
V)
196
(84%
) 6
(4%
) 32
(29%
) 3
(2%
) 63
(78%
) 8
(57%
)
Unk
now
n 49
(17%
) 30
(15%
) 40
(27%
) 32
(16%
) 21
(21%
) 12
(46%
)
Hor
mon
es e
Test
oste
rone
(ng/
mL)
0.
8 (0
.7-0
.8)
0.8
(0.7
-0.9
) a
0.9
(0.8
-1.0
) a
0.9
(0.8
-1.0
) a
0.9
(0.8
-1.0
) 0.
9 (0
.7-1
.1)
0.8
(0.7
-0.8
)
And
rost
ened
ione
(ng/
mL)
1.
8 (1
.7-1
.9)
1.8
(1.7
-2.0
) 2.
2 (1
.9-2
.4) a
2.
1 (1
.9-2
.2) a
2.
0 (1
.8-2
.2)
2.1
(1.6
-2.7
) 1.
7 (1
.7-1
.8)
17-O
HP
(ng/
mL)
2.
3 (2
.1-2
.5)
2.2
(2.0
-2.4
) a
2.3
(2.0
-2.6
) 2.
3 (2
.1-2
.5)
2.1
(1.9
-2.4
) 2.
1 (1
.6-2
.7)
2.1
(2.1
-2.2
)
Prog
este
rone
(ng/
mL)
24
.9 (2
3.5-
26.3
) 22
.2 (2
0.8-
23.6
) 24
.0 (2
2.1-
26.0
) 22
.5 (2
1.1-
23.9
) 23
.7 (2
1.6-
25.9
) 22
.5 (1
8.3-
27.7
) 22
.8 (2
2.4-
23.3
)
Est
radi
ol (n
g/m
L)
1.9
(1.7
-2.0
) 1.
8 (1
.7-2
.0)
2.3
(2.0
-2.6
) 2.
0 (1
.8-2
.2)
2.5
(2.2
-2.9
) a
1.8
(1.3
-2.4
) 1.
9 (1
.8-1
.9)
SHB
G (n
mol
/L)
171
(159
-184
) 15
3 (1
40-1
67)
145
(130
-163
) 16
8 (1
54-1
84)
173
(152
-197
) 16
7 (1
33-2
09)
163
(158
-167
)
IGF-
I (ug
/L)
92.1
(85.
5-99
.2)
98.2
(91.
4-10
5.5)
10
4.6
(94.
6-11
5.7)
92
.4 (8
5.5-
99.8
) 98
.8 (8
8.8-
110.
0)
80.9
(67.
4-96
.9)
97.3
(94.
9-99
.7)
Plac
enta
l GH
(ng/
mL)
22
.3 (1
9.9-
24.9
) 18
.8 (1
6.8-
21.0
) 19
.1 (1
6.3-
22.3
) 19
.3 (1
7.2-
21.6
) 22
.1 (1
8.6-
26.4
) 16
.5 (1
1.2-
24.2
) 21
.5 (2
0.7-
22.3
)
AM
H (n
g/m
L) f
2.2
(1.9
-2.6
) -
- -
- -
2.1
(1.9
-2.4
)
T
able
2. c
onti
nued
a in
dica
tes
that
cas
es a
nd c
ontr
ols
are
sign
ifica
ntly
diff
eren
t (p<
0·05
) in
the
resp
ecti
ve s
ubgr
oup
b dat
a fr
om th
e Fi
nnis
h B
irth
Reg
istr
y on
ly a
vaila
ble
sinc
e 19
87
c dat
a on
fam
ily h
isto
ry o
f bre
ast a
nd/o
r ov
aria
n ca
ncer
is a
vaila
ble
for
629
case
s an
d 1,
571
cont
rols
from
the
Finn
ish
Mat
erni
ty C
ohor
t d t
umor
spr
ead
not a
vaila
ble
for
case
s fr
om th
e N
orth
ern
Swed
en M
ater
nity
Coh
ort
e geo
met
ric
mea
ns a
nd 1
0th-9
0th p
erce
ntile
of h
orm
one
conc
entr
atio
ns (a
djus
ted
for
stud
y co
hort
and
, exc
ept f
or a
ndro
gens
, and
IG
F-I,
for
gest
atio
nal a
ge)
f 107
inva
sive
ser
ous
case
s; 2
08 m
atch
ed c
ontr
ols
29
Case subjects from both cohorts had significantly higher geometric means
of testosterone (FMC: 0.9 vs. 0.8 ng/mL; p<0.0001 and NSMC: 0.8 vs. 0.7
ng/mL; p=0.004) and androstenedione (FMC: 1.9 vs. 1.7 ng/mL; p<0.0001 and
NSMC: 2.0 vs. 1.7 ng/mL; p=0.007) relative to controls. In the FMC, 17-OHP
was also higher in cases compared to controls (2.4 vs. 2.2 ng/mL; p=0.006).
Concentrations of placental GH and IGF-I were lower in members from the
NSMC compared to those from the FMC. Geometric means of placental GH
were similar in cases and controls for both cohorts (FMC: 43 vs. 44 ng/mL;
p=0.28 and NSMC: 10 vs. 10 ng/mL; p=0.98). In the FMC population,
geometric means of IGF-I were significantly lower in case than control subjects
(113 vs. 117 ng/mL; p=0.01), whereas in the NSMC geometric means were
similar in case and control subjects (84 vs. 80 ng/mL; p=0.46). Geometric
means of AMH in case and control samples were similar (2.2 vs. 2.1 ng/mL,
p=0.76).
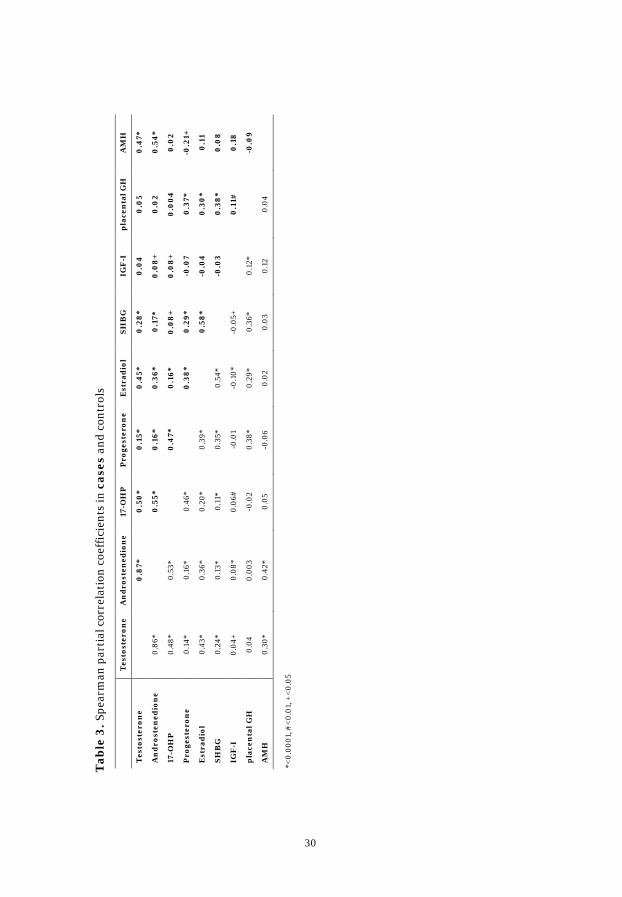
Spearman partial correlation coefficients between early pregnancy
hormone concentrations were similar for cases and controls and are presented
in Table 3. In brief the coefficients for controls: androgens were strongly
correlated with each other (r=0.86). 17-OHP, estradiol, and AMH were
positively correlated with testosterone (r=0.48, r=0.43, and r=0.30) and with
androstenedione (r=0.53, r=0.36, and r=0.42). Positive correlations were also
observed for progesterone with 17-OHP (r=0.46) and with estradiol (r=0.39).
Placental GH was correlated with IGF-I (r=0.12) and progesterone (r=0.38).
The observed inverse correlation of age at sampling with AMH was
substantially more pronounced in cases than in controls (r=-0.50 vs. r=-0.27).
30
T
esto
ster
one
An
dro
sten
edio
ne
17-O
HP
P
roge
ster
one
Est
rad
iol
SHB
G
IGF
-I
pla
cen
tal G
H
AM
H
Tes
tost
eron
e
0.8
7*
0.5
0*
0.1
5*
0.4
5*
0.2
8*
0.0
4 0
.05
0.4
7*
An
dro
sten
edio
ne
0.86
*
0.5
5*
0.1
6*
0.3
6*
0.1
7*
0.0
8+
0
.02
0.5
4*
17-O
HP
0.
48*
0.53
*
0.4
7*
0.1
6*
0.0
8+
0
.08
+
0.0
04
0.0
2
Pro
gest
eron
e 0.
14*
0.16
* 0.
46*
0
.38
* 0
.29*
-0
.07
0.3
7*
-0.2
1+
Est
rad
iol
0.43
* 0.
36*
0.20
* 0.
39*
0
.58
* -0
.04
0.3
0*
0.1
1
SHB
G
0.24
* 0.
13*
0.11
* 0.
35*
0.54
*
-0.0
3 0
.38
* 0
.08
IGF
-I
0.04
+ 0.
08*
0.06
# -0
.01
-0.1
0*
-0.0
5+
0
.11#
0
.18
pla
cen
tal G
H
0.04
0.
003
-0.0
2 0.
38*
0.29
* 0.
36*
0.12
*
-0.0
9
AM
H
0.30
* 0.
42*
0.05
-0
.06
0.02
0.
03
0.12
0.
04
T
able
3. S
pear
man
par
tial
cor
rela
tion
coe
ffic
ient
s in
cas
es a
nd c
ontr
ols
*<0.
0001
, #<
0.01
, +<
0.05

31
4.1.2 Associations between Hormones and EOC
Associations between early pregnancy hormones and EOC differed by
tumor histology and, for the serous subtype, also by tumor invasiveness
(Table 4). No association was observed between the evaluated hormones and
risk of invasive serous or clear cell tumors in our study population. High AMH,
placental GH, progesterone, and SHBG were not associated with risk of EOC
overall or with the histological subgroups.
Testosterone concentrations were positively associated with increased
risk of borderline serous tumors (ORT3 vs. T1: 1.87 [1.18-2.96]; ptrend=0.008) and
an almost 2-fold increased risk of invasive mucinous (ORT3 vs. T1: 1.79
[1.10-2.90]; ptrend=0.02) and borderline mucinous tumors (ORT3 vs. T1: 1.97
[1.30-2.99]; ptrend=0.001). High androstenedione concentrations were
associated with increased risk of invasive mucinous (ORT3 vs. T1: 1.78 [1.09-2.92];
ptrend=0.01) and borderline mucinous tumors (ORT3 vs. T1: 2.00 [1.32-3.02];
ptrend=0.001), while 17-OHP was associated with increased risk of borderline
serous tumors (ORT3 vs. T1: 1.85 [1.14-2.99]; ptrend=0.02). A significantly increased
risk of endometrioid and borderline mucinous tumors was observed with high
estradiol concentrations (endometrioid: ORT3 vs. T1: 2.76 [1.04-7.33]; ptrend=0.03;
borderline mucinous: ORT3 vs. T1: 1.80 [1.00-3.22]; ptrend=0.04).
IGF-I was suggestively inversely associated with overall EOC (ORT3 vs. T1:
0.83 [0.69-1.01]; ptrend=0.08), invasive tumors (ORT3 vs. T1: 0.79 [0.62-1.02];
ptrend=0.07), and endometrioid tumors (ORT3 vs. T1: 0.55 [0.28-1.07]; ptrend=0.07).
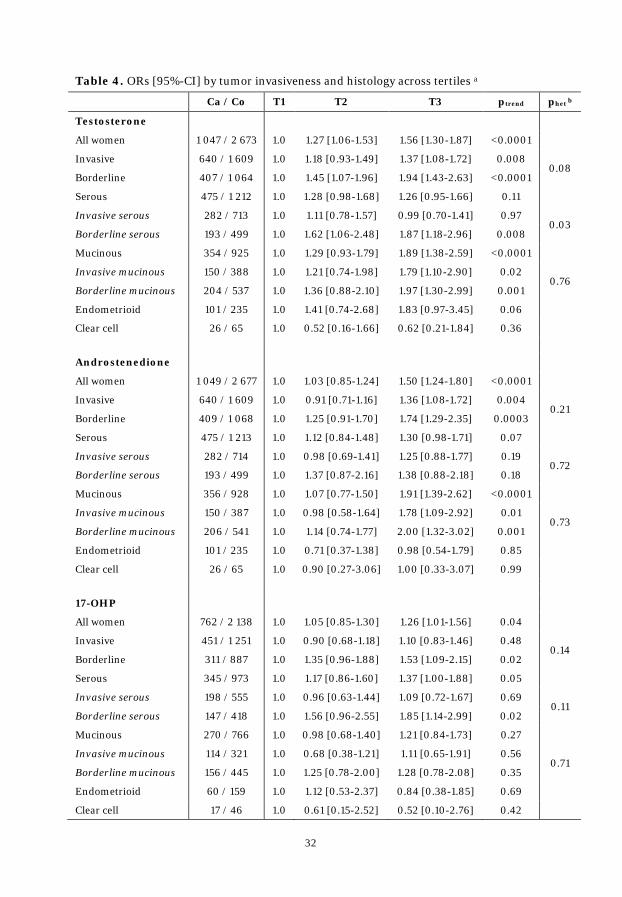
32
Table 4. ORs [95%-CI] by tumor invasiveness and histology across tertiles a
Ca / Co T1 T2 T3 ptrend phet b
Testosterone
All women 1 047 / 2 673 1.0 1.27 [1.06-1.53] 1.56 [1.30-1.87] <0.0001
Invasive 640 / 1 609 1.0 1.18 [0.93-1.49] 1.37 [1.08-1.72] 0.008 0.08
Borderline 407 / 1 064 1.0 1.45 [1.07-1.96] 1.94 [1.43-2.63] <0.0001
Serous 475 / 1 212 1.0 1.28 [0.98-1.68] 1.26 [0.95-1.66] 0.11
Invasive serous 282 / 713 1.0 1.11 [0.78-1.57] 0.99 [0.70-1.41] 0.97 0.03
Borderline serous 193 / 499 1.0 1.62 [1.06-2.48] 1.87 [1.18-2.96] 0.008
Mucinous 354 / 925 1.0 1.29 [0.93-1.79] 1.89 [1.38-2.59] <0.0001
Invasive mucinous 150 / 388 1.0 1.21 [0.74-1.98] 1.79 [1.10-2.90] 0.02 0.76
Borderline mucinous 204 / 537 1.0 1.36 [0.88-2.10] 1.97 [1.30-2.99] 0.001
Endometrioid 101 / 235 1.0 1.41 [0.74-2.68] 1.83 [0.97-3.45] 0.06
Clear cell 26 / 65 1.0 0.52 [0.16-1.66] 0.62 [0.21-1.84] 0.36
Androstenedione
All women 1 049 / 2 677 1.0 1.03 [0.85-1.24] 1.50 [1.24-1.80] <0.0001
Invasive 640 / 1 609 1.0 0.91 [0.71-1.16] 1.36 [1.08-1.72] 0.004 0.21
Borderline 409 / 1 068 1.0 1.25 [0.91-1.70] 1.74 [1.29-2.35] 0.0003
Serous 475 / 1 213 1.0 1.12 [0.84-1.48] 1.30 [0.98-1.71] 0.07
Invasive serous 282 / 714 1.0 0.98 [0.69-1.41] 1.25 [0.88-1.77] 0.19 0.72
Borderline serous 193 / 499 1.0 1.37 [0.87-2.16] 1.38 [0.88-2.18] 0.18
Mucinous 356 / 928 1.0 1.07 [0.77-1.50] 1.91 [1.39-2.62] <0.0001
Invasive mucinous 150 / 387 1.0 0.98 [0.58-1.64] 1.78 [1.09-2.92] 0.01 0.73
Borderline mucinous 206 / 541 1.0 1.14 [0.74-1.77] 2.00 [1.32-3.02] 0.001
Endometrioid 101 / 235 1.0 0.71 [0.37-1.38] 0.98 [0.54-1.79] 0.85
Clear cell 26 / 65 1.0 0.90 [0.27-3.06] 1.00 [0.33-3.07] 0.99
17-OHP
All women 762 / 2 138 1.0 1.05 [0.85-1.30] 1.26 [1.01-1.56] 0.04
Invasive 451 / 1 251 1.0 0.90 [0.68-1.18] 1.10 [0.83-1.46] 0.48 0.14
Borderline 311 / 887 1.0 1.35 [0.96-1.88] 1.53 [1.09-2.15] 0.02
Serous 345 / 973 1.0 1.17 [0.86-1.60] 1.37 [1.00-1.88] 0.05
Invasive serous 198 / 555 1.0 0.96 [0.63-1.44] 1.09 [0.72-1.67] 0.69 0.11
Borderline serous 147 / 418 1.0 1.56 [0.96-2.55] 1.85 [1.14-2.99] 0.02
Mucinous 270 / 766 1.0 0.98 [0.68-1.40] 1.21 [0.84-1.73] 0.27
Invasive mucinous 114 / 321 1.0 0.68 [0.38-1.21] 1.11 [0.65-1.91] 0.56 0.71
Borderline mucinous 156 / 445 1.0 1.25 [0.78-2.00] 1.28 [0.78-2.08] 0.35
Endometrioid 60 / 159 1.0 1.12 [0.53-2.37] 0.84 [0.38-1.85] 0.69
Clear cell 17 / 46 1.0 0.61 [0.15-2.52] 0.52 [0.10-2.76] 0.42
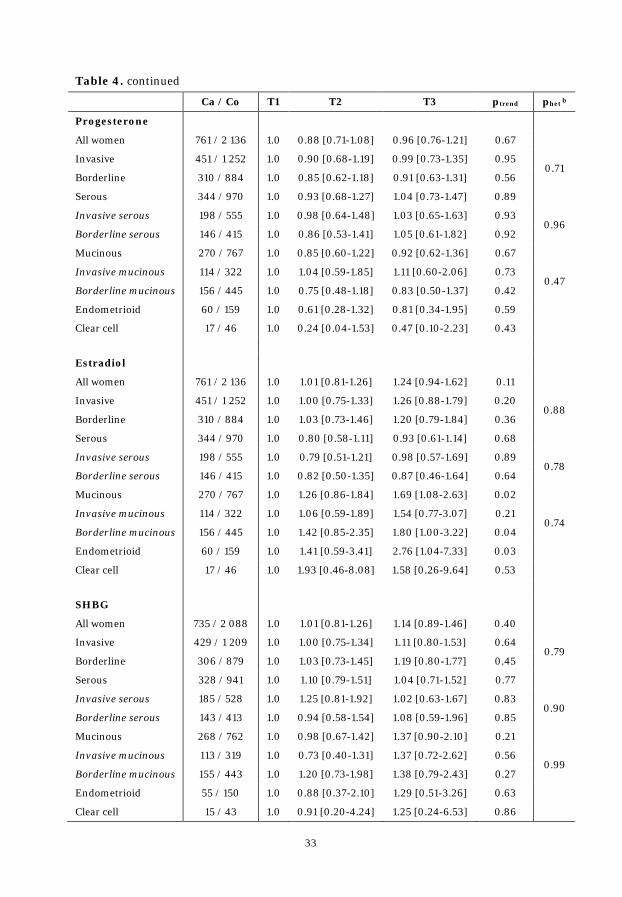
33
Table 4. continued
Ca / Co T1 T2 T3 ptrend phet b
Progesterone
All women 761 / 2 136 1.0 0.88 [0.71-1.08] 0.96 [0.76-1.21] 0.67
Invasive 451 / 1 252 1.0 0.90 [0.68-1.19] 0.99 [0.73-1.35] 0.95 0.71
Borderline 310 / 884 1.0 0.85 [0.62-1.18] 0.91 [0.63-1.31] 0.56
Serous 344 / 970 1.0 0.93 [0.68-1.27] 1.04 [0.73-1.47] 0.89
Invasive serous 198 / 555 1.0 0.98 [0.64-1.48] 1.03 [0.65-1.63] 0.93 0.96
Borderline serous 146 / 415 1.0 0.86 [0.53-1.41] 1.05 [0.61-1.82] 0.92
Mucinous 270 / 767 1.0 0.85 [0.60-1.22] 0.92 [0.62-1.36] 0.67
Invasive mucinous 114 / 322 1.0 1.04 [0.59-1.85] 1.11 [0.60-2.06] 0.73 0.47
Borderline mucinous 156 / 445 1.0 0.75 [0.48-1.18] 0.83 [0.50-1.37] 0.42
Endometrioid 60 / 159 1.0 0.61 [0.28-1.32] 0.81 [0.34-1.95] 0.59
Clear cell 17 / 46 1.0 0.24 [0.04-1.53] 0.47 [0.10-2.23] 0.43
Estradiol
All women 761 / 2 136 1.0 1.01 [0.81-1.26] 1.24 [0.94-1.62] 0.11
Invasive 451 / 1 252 1.0 1.00 [0.75-1.33] 1.26 [0.88-1.79] 0.20 0.88
Borderline 310 / 884 1.0 1.03 [0.73-1.46] 1.20 [0.79-1.84] 0.36
Serous 344 / 970 1.0 0.80 [0.58-1.11] 0.93 [0.61-1.14] 0.68
Invasive serous 198 / 555 1.0 0.79 [0.51-1.21] 0.98 [0.57-1.69] 0.89 0.78
Borderline serous 146 / 415 1.0 0.82 [0.50-1.35] 0.87 [0.46-1.64] 0.64
Mucinous 270 / 767 1.0 1.26 [0.86-1.84] 1.69 [1.08-2.63] 0.02
Invasive mucinous 114 / 322 1.0 1.06 [0.59-1.89] 1.54 [0.77-3.07] 0.21 0.74
Borderline mucinous 156 / 445 1.0 1.42 [0.85-2.35] 1.80 [1.00-3.22] 0.04
Endometrioid 60 / 159 1.0 1.41 [0.59-3.41] 2.76 [1.04-7.33] 0.03
Clear cell 17 / 46 1.0 1.93 [0.46-8.08] 1.58 [0.26-9.64] 0.53
SHBG
All women 735 / 2 088 1.0 1.01 [0.81-1.26] 1.14 [0.89-1.46] 0.40
Invasive 429 / 1 209 1.0 1.00 [0.75-1.34] 1.11 [0.80-1.53] 0.64 0.79
Borderline 306 / 879 1.0 1.03 [0.73-1.45] 1.19 [0.80-1.77] 0.45
Serous 328 / 941 1.0 1.10 [0.79-1.51] 1.04 [0.71-1.52] 0.77
Invasive serous 185 / 528 1.0 1.25 [0.81-1.92] 1.02 [0.63-1.67] 0.83 0.90
Borderline serous 143 / 413 1.0 0.94 [0.58-1.54] 1.08 [0.59-1.96] 0.85
Mucinous 268 / 762 1.0 0.98 [0.67-1.42] 1.37 [0.90-2.10] 0.21
Invasive mucinous 113 / 319 1.0 0.73 [0.40-1.31] 1.37 [0.72-2.62] 0.56 0.99
Borderline mucinous 155 / 443 1.0 1.20 [0.73-1.98] 1.38 [0.79-2.43] 0.27
Endometrioid 55 / 150 1.0 0.88 [0.37-2.10] 1.29 [0.51-3.26] 0.63
Clear cell 15 / 43 1.0 0.91 [0.20-4.24] 1.25 [0.24-6.53] 0.86

34
Table 4. continued
Ca / Co T1 T2 T3 ptrend phet b
IGF-I
All women 1 045 / 2 658 1.0 0.92 [0.77-1.10] 0.83 [0.69-1.01] 0.08
Invasive 635 / 1 591 1.0 0.89 [0.71-1.13] 0.79 [0.62-1.02] 0.07 0.54
Borderline 410 / 1 067 1.0 0.96 [0.72-1.28] 0.90 [0.66-1.22] 0.55
Serous 473 / 1 204 1.0 0.87 [0.66-1.14] 0.93 [0.70-1.23] 0.62
Invasive serous 279 / 703 1.0 0.97 [0.69-1.38] 1.01 [0.70-1.45] 0.97 0.46
Borderline serous 194 / 501 1.0 0.72 [0.47-1.12] 0.81 [0.52-1.26] 0.40
Mucinous 355 / 923 1.0 1.08 [0.80-1.46] 0.85 [0.61-1.18] 0.37
Invasive mucinous 149 / 383 1.0 0.89 [0.56-1.42] 0.71 [0.43-1.18] 0.16 0.37
Borderline mucinous 206 / 540 1.0 1.24 [0.83-1.84] 0.97 [0.63-1.50] 0.99
Endometrioid 102 / 238 1.0 0.71 [0.38-1.34] 0.55 [0.28-1.07] 0.07
Clear cell 26 / 64 1.0 0.57 [0.20-1.60] 0.34 [0.09-1.29] 0.10
Placental GH
All women 730 / 2 061 1.0 0.86 [0.68-1.09] 0.94 [0.70-1.26] 0.62
Invasive 423 / 1 186 1.0 0.85 [0.63-1.15] 1.00 [0.69-1.46] 0.91 0.56
Borderline 307 / 875 1.0 0.87 [0.61-1.25] 0.84 [0.53-1.33] 0.62
Serous 325 / 928 1.0 0.88 [0.62-1.24] 0.97 [0.62-1.49] 0.83
Invasive serous 181 / 517 1.0 0.96 [0.61-1.53] 0.90 [0.51-1.60] 0.73 0.69
Borderline serous 144 / 411 1.0 0.78 [0.47-1.32] 1.08 [0.55-2.11] 0.92
Mucinous 266 / 754 1.0 0.98 [0.67-1.45] 0.98 [0.60-1.61] 0.96
Invasive mucinous 111 / 312 1.0 0.95 [0.52-1.73] 1.55 [0.72-3.32] 0.30 0.13
Borderline mucinous 155 / 442 1.0 1.02 [0.62-1.70] 0.70 [0.36-1.37] 0.32
Endometrioid 57 / 151 1.0 1.06 [0.49-2.30] 1.00 [0.36-2.81] 0.98
Clear cell 15 / 42 1.0 0.20 [0.03-1.18] 0.17 [0.01-2.24] 0.08
AMH c
Invasive serous 107 / 208 1.0 0.99 [0.52-1.87] 0.93 [0.49-1.77] 0.83 a adjusted for gestational age (except for testosterone, androstenedione, and IGF-I) b heterogeneity tested between invasive and borderline tumors c adjusted for gestational age and family history

35
4.1.3 Mutual Adjustment
The effect of mutual adjustment for the evaluated hormones was assessed
(Table 5). After adjustment for androstenedione, the effect of a doubling of
testosterone concentrations on invasive and borderline mucinous tumors was
strongly attenuated and no longer statistically significant (invasive: crude
ORlog2: 1.33 [1.01-1.74], adjusted ORlog2: 0.77 [0.43-1.36]; borderline: crude
ORlog2: 1.50 [1.18-1.90], adjusted ORlog2: 1.12 [0.73-1.71]). On the other hand, the
association between testosterone and endometrioid tumors was strengthened
after adjustment for androstenedione (crude ORlog2: 1.39 [0.96-1.99], adjusted
ORlog2: 3.45 [1.62-7.35]). A doubling of androstenedione was associated with a
significantly increased risk of invasive serous tumors (crude ORlog2: 1.18
[0.95-1.46], adjusted ORlog2: 1.67 [1.09-2.55]) and a decreased risk of
endometrioid tumors (crude ORlog2: 1.02 [0.71-1.48], adjusted ORlog2: 0.33
[0.15-0.73]), after adjusting for testosterone.
After adjustment for testosterone or androstenedione, a doubling of
17-OHP was no longer significantly associated with the risk of borderline serous
tumors (crude ORlog2: 1.46 [1.08-1.97], adjusted for T ORlog2: 1.20 [0.87-1.67],
adjusted for D4 ORlog2: 1.27 [0.89-1.81]).
Adjusting for any of the remaining hormones did not change the direction
or the significance of the observed associations (data not shown).
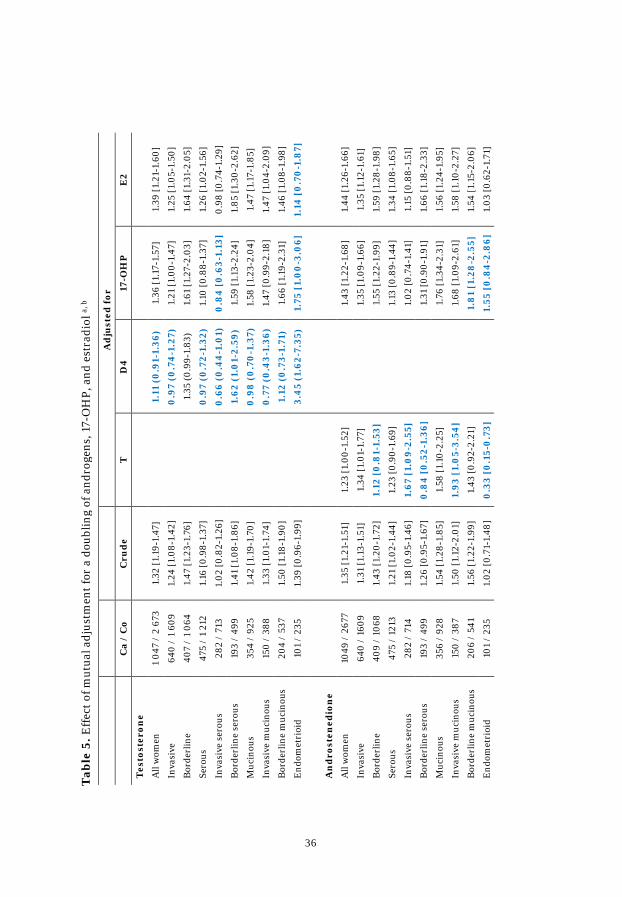
36
A
dju
sted
for
C
a /
Co
Cru
de
T
D4
17-O
HP
E
2
Tes
tost
eron
e
All
wom
en
1 04
7 /
2 67
3 1.
32 [1
.19-
1.47
]
1.11
(0
.91-
1.36
) 1.
36 [1
.17-
1.57
] 1.
39 [1
.21-
1.60
]
Inva
sive
64
0 /
1 60
9 1.
24 [1
.08-
1.42
]
0.9
7 (0
.74
-1.2
7)
1.21
[1.0
0-1.
47]
1.25
[1.0
5-1.
50]
Bor
derl
ine
407
/ 1
064
1.47
[1.2
3-1.
76]
1.
35 (0
.99-
1.83
) 1.
61 [1
.27-
2.03
] 1.
64 [1
.31-
2.05
]
Sero
us
475
/ 1
212
1.16
[0.9
8-1.
37]
0
.97
(0.7
2-1.
32)
1.10
[0.8
8-1.
37]
1.26
[1.0
2-1.
56]
Inva
sive
ser
ous
282
/ 71
3 1.
02 [0
.82-
1.26
]
0.6
6 (0
.44
-1.0
1)
0.8
4 [
0.6
3-1.
13]
0.98
[0.7
4-1.
29]
Bor
derl
ine
sero
us
193
/ 49
9 1.
41 [1
.08-
1.86
]
1.62
(1.
01-
2.59
) 1.
59 [1
.13-
2.24
] 1.
85 [1
.30-
2.62
]
Muc
inou
s 35
4 /
925
1.42
[1.1
9-1.
70]
0
.98
(0
.70
-1.3
7)
1.58
[1.2
3-2.
04]
1.47
[1.1
7-1.
85]
Inva
sive
muc
inou
s 15
0 /
388
1.33
[1.0
1-1.
74]
0
.77
(0.4
3-1.
36)
1.47
[0.9
9-2.
18]
1.47
[1.0
4-2.
09]
Bor
derl
ine
muc
inou
s 20
4 /
537
1.50
[1.1
8-1.
90]
1.
12 (
0.7
3-1.
71)
1.66
[1.1
9-2.
31]
1.46
[1.0
8-1.
98]
End
omet
rioi
d 10
1 /
235
1.39
[0.9
6-1.
99]
3.
45
(1.6
2-7.
35)
1.75
[1.
00
-3.0
6]
1.14
[0
.70
-1.8
7]
An
dro
sten
edio
ne
All
wom
en
1049
/ 2
677
1.35
[1.2
1-1.
51]
1.23
[1.0
0 -1.
52]
1.
43 [1
.22 -
1.68
] 1.
44 [1
.26-
1.66
]
Inva
sive
64
0 /
1609
1.
31 [1
.13-
1.51
] 1.
34 [1
.01-
1.77
]
1.35
[1.0
9-1.
66]
1.35
[1.1
2-1.
61]
Bor
derl
ine
409
/ 10
68
1.43
[1.2
0-1.
72]
1.12
[0
.81-
1.53
]
1.55
[1.2
2-1.
99]
1.59
[1.2
8-1.
98]
Sero
us
475
/ 12
13
1.21
[1.0
2 -1.
44]
1.23
[0.9
0-1.
69]
1.
13 [0
.89-
1.44
] 1.
34 [1
.08-
1.65
]
Inva
sive
ser
ous
282
/ 71
4 1.
18 [0
.95-
1.46
] 1.
67 [
1.0
9-2.
55]
1.
02 [0
.74-
1.41
] 1.
15 [0
.88-
1.51
]
Bor
derl
ine
sero
us
193
/ 49
9 1.
26 [0
.95-
1.67
] 0
.84
[0
.52-
1.36
]
1.31
[0.9
0-1.
91]
1.66
[1.1
8-2.
33]
Muc
inou
s 35
6 /
928
1.54
[1.2
8-1.
85]
1.58
[1.1
0-2.
25]
1.
76 [1
.34-
2.31
] 1.
56 [1
.24-
1.95
]
Inva
sive
muc
inou
s 15
0 /
387
1.50
[1.1
2-2.
01]
1.93
[1.
05-
3.54
]
1.68
[1.0
9-2.
61]
1.58
[1.1
0-2.
27]
Bor
derl
ine
muc
inou
s 20
6 /
541
1.56
[1.2
2-1.
99]
1.43
[0.9
2-2.
21]
1.
81
[1.2
8-2
.55]
1.
54 [1
.15-
2.06
]
End
omet
rioi
d 10
1 /
235
1.02
[0.7
1-1.
48]
0.3
3 [0
.15-
0.7
3]
1.
55 [
0.8
4-2
.86]
1.
03 [0
.62-
1.71
]
T
able
5. E
ffec
t of m
utua
l adj
ustm
ent f
or a
dou
blin
g of
and
roge
ns, 1
7-O
HP,
and
est
radi
ol a,
b
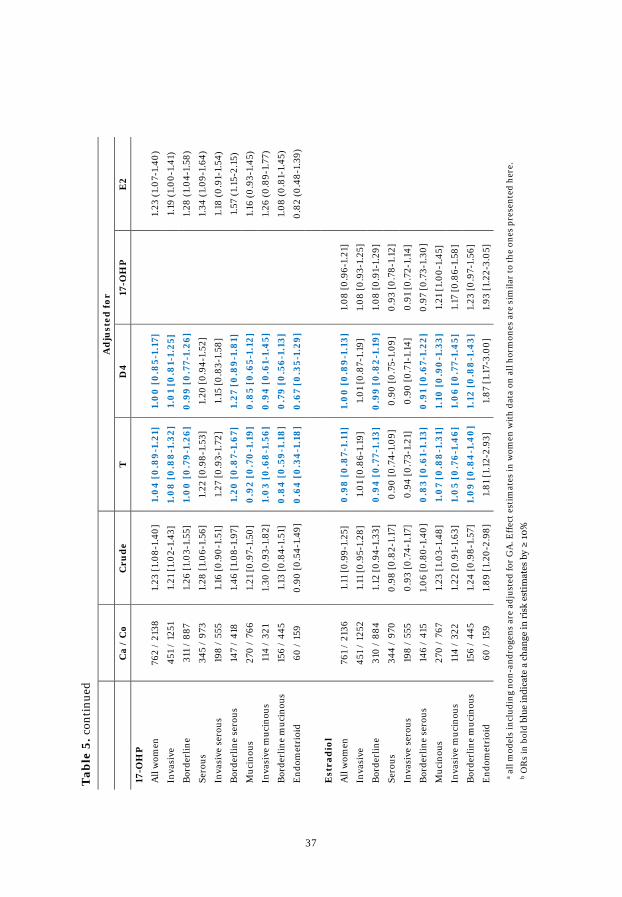
37
A
dju
sted
for
C
a /
Co
Cru
de
T
D4
17-O
HP
E
2
17-O
HP
All
wom
en
762
/ 21
38
1.23
[1.0
8-1.
40]
1.0
4 [
0.8
9-1.
21]
1.0
0 [
0.8
5-1.
17]
1.
23 (1
.07-
1.40
)
Inva
sive
45
1 /
1251
1.
21 [1
.02-
1.43
] 1.
08
[0
.88
-1.3
2]
1.0
1 [0
.81-
1.25
]
1.19
(1.0
0-1.
41)
Bor
derl
ine
311
/ 88
7 1.
26 [1
.03-
1.55
] 1.
00
[0
.79-
1.26
] 0
.99
[0.7
7-1.
26]
1.
28 (1
.04-
1.58
)
Sero
us
345
/ 97
3 1.
28 [1
.06-
1.56
] 1.
22 [0
.98-
1.53
] 1.
20 [0
.94-
1.52
]
1.34
(1.0
9-1.
64)
Inva
sive
ser
ous
198
/ 55
5 1.
16 [0
.90-
1.51
] 1.
27 [0
.93-
1.72
] 1.
15 [0
.83-
1.58
]
1.18
(0.9
1-1.
54)
Bor
derl
ine
sero
us
147
/ 41
8 1.
46 [1
.08-
1.97
] 1.
20 [
0.8
7-1.
67]
1.27
[0
.89-
1.8
1]
1.
57 (1
.15-
2.15
)
Muc
inou
s 27
0 /
766
1.21
[0.9
7-1.
50]
0.9
2 [0
.70
-1.1
9]
0.8
5 [0
.65-
1.12
]
1.16
(0.9
3-1.
45)
Inva
sive
muc
inou
s 11
4 /
321
1.30
[0.9
3-1.
82]
1.0
3 [0
.68
-1.5
6]
0.9
4 [
0.6
1-1.
45]
1.26
(0.8
9-1.
77)
Bor
derl
ine
muc
inou
s 15
6 /
445
1.13
[0.8
4-1.
51]
0.8
4 [
0.5
9-1.
18]
0.7
9 [0
.56-
1.13
]
1.08
(0.8
1-1.
45)
End
omet
rioi
d 60
/ 1
59
0.90
[0.5
4-1.
49]
0.6
4 [
0.3
4-1
.18
] 0
.67
[0.3
5-1.
29]
0.
82 (0
.48-
1.39
)
Est
rad
iol
All
wom
en
761
/ 21
36
1.11
[0.9
9-1.
25]
0.9
8 [
0.8
7-1.
11]
1.0
0 [
0.8
9-1.
13]
1.08
[0.9
6-1.
21]
Inva
sive
45
1 /
1252
1.
11 [0
.95-
1.28
] 1.
01 [0
.86-
1.19
] 1.
01 [0
.87-
1.19
] 1.
08 [0
.93-
1.25
]
Bor
derl
ine
310
/ 88
4 1.
12 [0
.94-
1.33
] 0
.94
[0
.77 -
1.13
] 0
.99
[0.8
2-1.
19]
1.08
[0.9
1-1.
29]
Sero
us
344
/ 97
0 0.
98 [0
.82 -
1.17
] 0.
90 [0
.74-
1.09
] 0.
90 [0
.75 -
1.09
] 0.
93 [0
.78-
1.12
]
Inva
sive
ser
ous
198
/ 55
5 0.
93 [0
.74-
1.17
] 0.
94 [0
.73-
1.21
] 0.
90 [0
.71-
1.14
] 0.
91 [0
.72-
1.14
]
Bor
derl
ine
sero
us
146
/ 41
5 1.
06 [0
.80-
1.40
] 0
.83
[0.6
1-1.
13]
0.9
1 [0
.67-
1.22
] 0.
97 [0
.73-
1.30
]
Muc
inou
s 27
0 /
767
1.23
[1.0
3-1.
48]
1.0
7 [0
.88
-1.3
1]
1.10
[0
.90
-1.3
3]
1.21
[1.0
0-1.
45]
Inva
sive
muc
inou
s 11
4 /
322
1.22
[0.9
1-1.
63]
1.0
5 [0
.76-
1.4
6]
1.0
6 [0
.77-
1.4
5]
1.17
[0.8
6-1.
58]
Bor
derl
ine
muc
inou
s 15
6 /
445
1.24
[0.9
8-1.
57]
1.0
9 [0
.84
-1.4
0]
1.12
[0
.88
-1.4
3]
1.23
[0.9
7-1.
56]
End
omet
rioi
d 60
/ 1
59
1.89
[1.2
0-2.
98]
1.81
[1.1
2-2.
93]
1.87
[1.1
7-3.
00]
1.93
[1.2
2-3.
05]
T
able
5. c
onti
nued
a all
mod
els
incl
udin
g no
n-an
drog
ens
are
adju
sted
for
GA
. Eff
ect e
stim
ates
in w
omen
wit
h da
ta o
n al
l hor
mon
es a
re s
imila
r to
the
ones
pre
sent
ed h
ere.
b O
Rs
in b
old
blue
indi
cate
a c
hang
e in
ris
k es
tim
ates
by
≥ 1
0%
38
4.1.4 Stratified Analyses
Sex steroids and growth factors
Due to the low proportion of cases diagnosed at age 55 years or older
(n=102 cases; 10%), heterogeneity by age at diagnosis (<46, 45-55, ≥55 years)
was assessed in all cases, invasive and borderline tumors, as well as serous,
mucinous, and endometrioid tumors (Figure 6). Heterogeneity was observed
overall for a doubling of IGF-I concentrations (ORlog2 <46 years: 0.75
[0.64-0.89], 46-55 years: 0.98 [0.78-1.23], ≥55 years: 1.41 [0.95-2.08];
phet=0.008). A similar pattern was observed for IGF-I in borderline and
mucinous tumors (Figure 6 G). Although heterogeneity was not observed for the
remaining hormones, associations with androgens in women diagnosed
<55 years were stronger than in older women overall and by tumor invasiveness
(Figure 6 A, B).
There was no evidence of heterogeneity (phet>0.05) by years between
blood donation and diagnosis (histology-specific; below/above median),
number of children, or study cohort.
AMH
Heterogeneous associations were observed for AMH with risk of invasive
serous ovarian cancer by median age at sampling (age=32.7 years; phet=0.002)
and age at diagnosis (age=42.9 years; phet=0.04). In women younger than the
median age at sampling, a doubling of AMH was associated with increased risk
of ovarian cancer (ORlog2: 1.64 [1.06-2.54]), whereas the opposite was observed
in older women (ORlog2: 0.69 [0.49-0.96]). When stratifying the analyses by age
at sampling in three groups (<30, 30-35, ≥35 years), a non-significant positive
association between AMH and risk was observed in women <30 years of age at
sampling (n=29 case-control sets; ORlog2: 1.42 [0.82-2.46]) and 30-35 years
(n=42 case-control sets; ORlog2: 1.36 [0.88-2.12]), whereas a significant inverse
association was observed in women older than age 35 years at sampling (n=36
case-control sets; ORlog2: 0.67 [0.45-0.97]). Analyses by median age at diagnosis
yielded lower risk estimates and the heterogeneity of the associations was less

39
pronounced. There was no heterogeneity by time between blood draw and
diagnosis or stage.
Figure 6. ORs [95%-CI] for doubling of circulating hormone concentrations by age at diagnosis a
A) Testosterone
B) Androstenedione
0
1
2
3
4
5
6
All Women Invasive Borderline Serous Mucinous Endometrioid
0
1
2
3
4
5
6
All Women Invasive Borderline Serous Mucinous Endometrioid
□<46 years □ 46-55 years □ ≥ 55 years
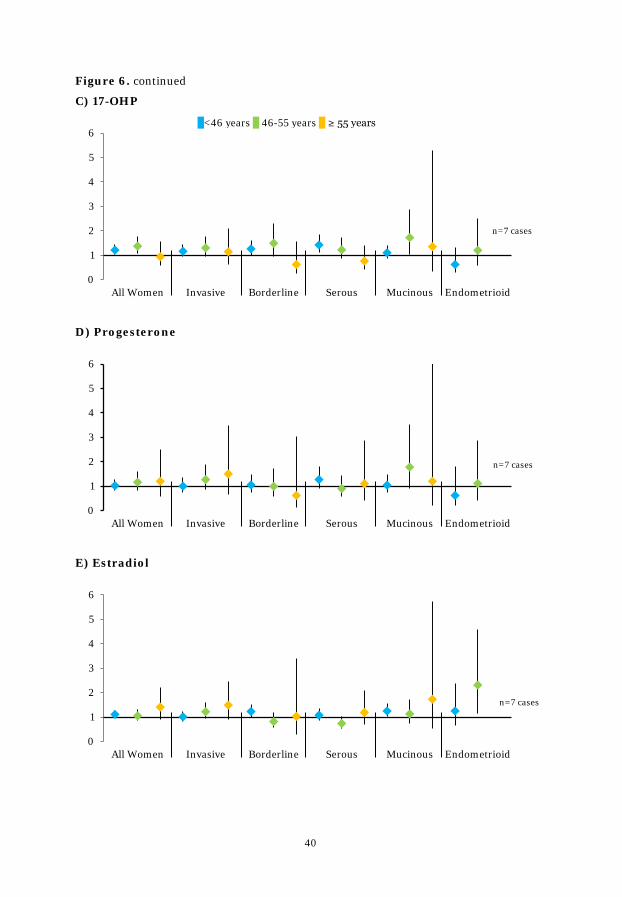
40
Figure 6. continued
C) 17-OHP
D) Progesterone
E) Estradiol
0
1
2
3
4
5
6
All Women Invasive Borderline Serous Mucinous Endometrioid
0
1
2
3
4
5
6
All Women Invasive Borderline Serous Mucinous Endometrioid
0
1
2
3
4
5
6
All Women Invasive Borderline Serous Mucinous Endometrioid
□<46 years □ 46-55 years □ ≥ 55 years
n=7 cases
n=7 cases
n=7 cases

41
Figure 6. continued
F) SHBG
G) IGF-I
H) Placental GH
a adjusted for gestational age (except for testosterone, androstenedione, and IGF-I)
0
1
2
3
4
5
6
All Women Invasive Borderline Serous Mucinous Endometrioid
0
1
2
3
4
5
6
All Women Invasive Borderline Serous Mucinous Endometrioid
0
1
2
3
4
5
6
All Women Invasive Borderline Serous Mucinous Endometrioid
pHet=0.02
□<46 years □ 46-55 years □ ≥ 55 years
pHet=0.008 pHet=0.02
n=5 cases
n=5 cases

42
4.1.5 Analyses by Tumor Stage
Heterogeneity by tumor stage at diagnosis was observed in invasive
serous tumors for a doubling of circulating IGF-I (ORlog2 localized: 0.42
[0.22-0.81], ORlog2 advanced: 0.99 [0.74-1.33]; phet=0.02), testosterone (ORlog2
localized: 1.91 [1.02-3.57], ORlog2 advanced: 0.88 [0.68-1.14]; phet=0.03) and
SHBG concentrations (ORlog2 localized: 2.38 [1.00-5.65], ORlog2 advanced: 0.88
[0.61-1.27]; phet=0.04), but not for any other hormones or EOC subtypes.
4.1.6 Sensitivity Analyses
Limiting the analyses of androgens to women with information on
gestational age at blood draw did not change risk estimates with the exception
of a strengthening of the association between androstenedione and borderline
serous tumors (ORlog2: 1.50 [1.10-2.05]; p=0.01).
Limiting the study population to women aged <55 years at diagnosis
strengthened the observed inverse associations for IGF-I with invasive
(ORlog2: 0.81 [0.68-0.96]) and invasive mucinous tumors (ORlog2: 0.70
[0.49-1.00]). Limiting the whole study population to women with lag-time
>2 years (n=960 cases; 85 cases diagnosed at age <55 years excluded)
attenuated the observed associations for IGF-I, but less so in women aged
<55 years at diagnosis (e.g., invasive tumors lag-time >2 years ORlog2: 0.88
[0.74-1.04]; lag-time >2 years and age at diagnosis <55 years ORlog2: 0.84
[0.70-1.01]).
No material change in risk estimates was observed when limiting the
study population to women i) with lag-time >2 or >3 years, ii) who provided a
blood sample during a full-term pregnancy, iii) who donated blood during the
last pregnancy before diagnosis or selection as a control, or iv) without hormone
levels exceeding 3 times the interquartile range. Analyses limited to members of
the FMC yielded similar results and analyses restricted to the NSMC (n=109
cases) were in the same direction but non-significant due to the small sample
size.

43
4.2 Longitudinal Study
Maternal and child characteristics were similar between primiparous
women, biparous women, and women participating with two consecutive
pregnancies (Table 6). Mean age of women with one pregnancy during the study
period was 27.2 years (range: 20.5-33.5 years) at first blood draw and in women
with two consecutive pregnancies 27.6 years (range: 17.8-42.7 years) at first
blood draw for the first birth. The median gestational ages at blood draw were
similar between women participating with one pregnancy (T1: 75, T2: 145, and
T3: 250 days) or two pregnancies (T1:75, T2: 148, and T3: 251 days). The majority
of study participants did not smoke during pregnancy (n=52; 73%) and a
somewhat higher percentage of pregnancies ended in the delivery of a boy
(n=51; 55%) than a girl (n=41; 45%).
Table 6. Baseline characteristics; median (range), or n (%)
One pregnancy during study period
Two consecutive pregnancies during study period
Characteristics Primiparous (n=25)
Biparous (n=25)
Pregnancy 1 (n=21)
Pregnancy 2 (n=21)
Maternal age, years 27.2 (20.6-33.5) 27.5 (20.5-33.1) 26.5 (17.8-42.7) 27.7 (18.6-44.0)
Pregnancy length, days 282 (255-296) 283 (266-292) 279 (258-294) 278 (262-291)
Parity (including the current pregnancy)
1 25 (100%) 13 (62%)
2 25 (100%) 6 (29%) 13 (62%)
3 2 (9%) 6 (29%)
4 2 (9%)
Child weight, kg 3.3 (2.4-4.7) 3.8 (2.8-4.6) 3.5 (2.8-4.5) 3.8 (2.9-4.3)
Child length, cm 49 (45-55) 51 (47-54) 50 (47-53) 50 (49-53)
Child sex
Boy 10 (40%) 13 (52%) 14 (67%) 14 (67%)
Girl 15 (60%) 12 (48%) 7 (33%) 7 (33%)
Maternal smoking
No 19 (76%) 20 (91%) 13 (62%) 13 (65%)
Yes 6 (24%) 2 (9%) 8 (38%) 7 (35%)
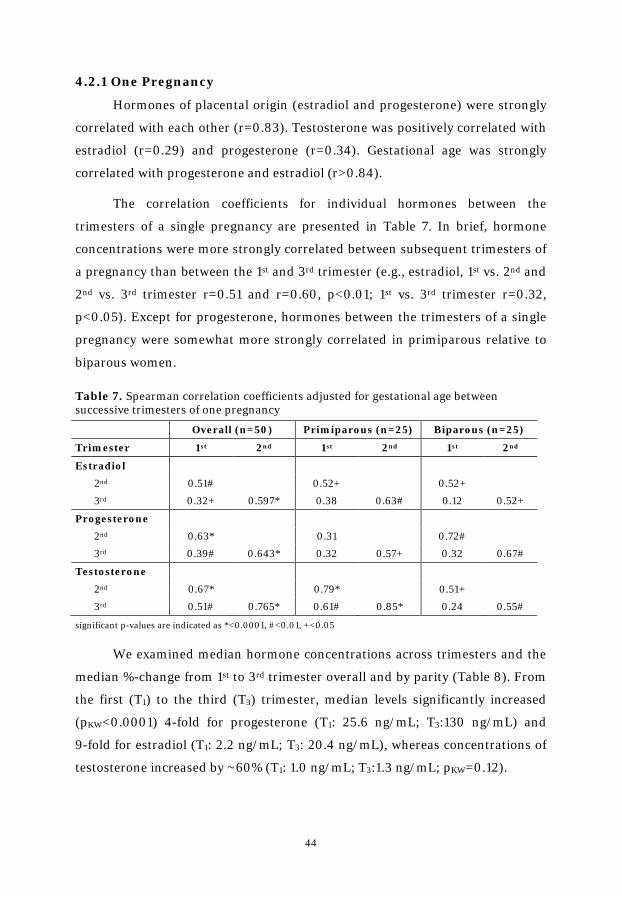
44
4.2.1 One Pregnancy
Hormones of placental origin (estradiol and progesterone) were strongly
correlated with each other (r=0.83). Testosterone was positively correlated with
estradiol (r=0.29) and progesterone (r=0.34). Gestational age was strongly
correlated with progesterone and estradiol (r>0.84).
The correlation coefficients for individual hormones between the
trimesters of a single pregnancy are presented in Table 7. In brief, hormone
concentrations were more strongly correlated between subsequent trimesters of
a pregnancy than between the 1st and 3rd trimester (e.g., estradiol, 1st vs. 2nd and
2nd vs. 3rd trimester r=0.51 and r=0.60, p<0.01; 1st vs. 3rd trimester r=0.32,
p<0.05). Except for progesterone, hormones between the trimesters of a single
pregnancy were somewhat more strongly correlated in primiparous relative to
biparous women.
Table 7. Spearman correlation coefficients adjusted for gestational age between successive trimesters of one pregnancy
Overall (n=50) Primiparous (n=25) Biparous (n=25)
Trimester 1st 2nd 1st 2nd 1st 2nd
Estradiol
2nd 0.51# 0.52+ 0.52+
3rd 0.32+ 0.597* 0.38 0.63# 0.12 0.52+
Progesterone
2nd 0.63* 0.31 0.72#
3rd 0.39# 0.643* 0.32 0.57+ 0.32 0.67#
Testosterone
2nd 0.67* 0.79* 0.51+
3rd 0.51# 0.765* 0.61# 0.85* 0.24 0.55#
significant p-values are indicated as *<0.0001, #<0.01, +<0.05
We examined median hormone concentrations across trimesters and the
median %-change from 1st to 3rd trimester overall and by parity (Table 8). From
the first (T1) to the third (T3) trimester, median levels significantly increased
(pKW<0.0001) 4-fold for progesterone (T1: 25.6 ng/mL; T3:130 ng/mL) and
9-fold for estradiol (T1: 2.2 ng/mL; T3: 20.4 ng/mL), whereas concentrations of
testosterone increased by ~60% (T1: 1.0 ng/mL; T3:1.3 ng/mL; pKW=0.12).

45
Progesterone and testosterone concentrations were lower in biparous
women as compared to primiparous women throughout gestation
(e.g., progesterone T3 primi=138 ng/mL, T3 bi=107 ng/mL; pMW=0.007;
testosterone T3 primi=2.6 ng/mL, T3 bi=0.7 ng/mL; pMW=0.0008).
Table 8. Median hormone concentrations (10th-90th percentiles) by parity
All women (n=50)
Primiparous (n=25)
Biparous (n=25) pMW a
Estradiol (ng/mL)
1st trimester 2.18 (1.16-3.59) 2.11 (1.19-4.00) 2.42 (1.12-3.12) 0.92
2nd trimester 9.71 (5.33-15.1) 10.3 (5.20-14.8) 9.45 (5.46-15.3) 0.64
3rd trimester 20.4 (12.8-32.9) 22.3 (13.6-35.6) 19.5 (12.8-31.5) 0.71
Median %-change b 876% 858% 889%
Progesterone (ng/mL)
1st trimester 25.6 (16.6-40.7) 27.3 (20.0-42.2) 23.0 (13.5-37.8) 0.03
2nd trimester 48.1 (31.6-78.5) 53.8 (37.8-85.2) 42.1 (28.7-71.3) 0.03
3rd trimester 130 (72.6-200) 138 (105-215) 107 (60.2-163) 0.007
Median %-change b 411% 422% 396%
Testosterone (ng/mL)
1st trimester 0.96 (0.42-1.98) 1.34 (0.78-2.15) 0.66 (0.36-1.11) <0.0001
2nd trimester 1.19 (0.55-3.35) 1.98 (1.05-3.96) 0.73 (0.44-1.43) <0.0001
3rd trimester 1.32 (0.50-4.07) 2.56 (0.54-6.06) 0.71 (0.50-2.41) 0.0008
Median %-change b 61% 74% 38% a p-value obtained from the Mann-Whitney-U test comparing primi- and biparous women b median %-change between the 1st and 3rd trimester
Testosterone concentrations were higher throughout gestation in women
who reported smoking in early pregnancy relative to non-smoking women
(e.g., T1 smoker=1.7 ng/mL, T1 non-smoker=0.9 ng/mL; pMW=0.03). Third trimester
concentrations of estradiol were higher in women reporting smoking in early
pregnancy as compared to non-smoking women (T3 smoker=25.7 ng/mL,
T3 non-smoker=18.6 ng/mL; pMW=0.01).
We further examined the effect of a 1% increase in 1st and/or 2nd trimester
hormone concentrations on the estimates of 3rd trimester hormone
concentrations. Hormone concentrations measured in the 1st trimester
accounted for 13% (progesterone), 16% (estradiol), and 31% (testosterone) of
the variation in the 3rd trimester (basic model, Table 9A). Addition of maternal
or newborn characteristics impacted all hormone concentrations (Table 9A).

46
Women who were pregnant with their second child had significantly lower
progesterone concentrations (24%) than primiparous women. Higher
concentrations of estradiol (42%) and testosterone (85%) were observed in
women who smoked at study enrollment compared to non-smoking women.
Second trimester hormone concentrations explained between 42%
(estradiol) and 63% (testosterone) of the variation in the 3rd trimester on their
own with similar changes in concentrations after addition of maternal or child
characteristics as observed for the 1st trimester concentrations (Table 9B).
Table 9. Percentage changes [95%-CI] in 3rd trimester hormone concentrations associated with 1st or 2nd hormone concentrations and covariates
Estradiol Progesterone Testosterone
A)
1st trimester hormone only 26 [7; 50] b 34 [10; 63] b 71 [36; 115] a
Adjusted R² - basic model 16% 13% 31%
1st trimester hormone +
+ Age at blood draw -2 [-5; 1] 0 [-3; 3] -2 [-8; 5]
+ Smoking 42 [11; 82] b 14 [-13; 45] 85 [2; 236] b
+ Parity -5 [-28; 16] -24 [-50; -3] b -57 [-158; 4] c
+ Child sex 27 [4; 54] b 16 [-4; 40] 11 [-39; 71]
+ Birth length (per 5 cm) -13 [-40; 9] -5 [-29; 17] 12 [-41; 76]
+ Birth weight (per 100 g) -1 [-2; 1] -1 [-2; 1] 0 [-4; 5]
Adjusted R² - full model 46% 20% 39%
B)
2nd trimester hormone only 57 [35; 83] a 57 [36; 82] a 103 [72; 140] a
Adjusted R² - basic model 42% 45% 63%
2nd trimester hormone only
+ Age at blood draw -1 [-3; 2] 0 [-2; 2] 1 [-4; 6]
+ Smoking 27 [2; 57] b 20 [0; 44] b 59 [1; 151] b
+ Parity -2 [-21; 16] -17 [-36; 0] b -8 [-63; 40]
+ Child sex 8 [-9; 27] 4 [-12; 22] -10 [-52; 27]
+ Birth length (per 5 cm) -10 [-31; 9] -11 [-31; 6] 11 [-26; 57]
+ Birth weight (per 100 g) -1 [-3; 1] -1 [-2; 0] 0 [-3; 3]
Adjusted R² - full model 51% 54% 70%
C)
1st & 2nd trimester hormones
Adjusted R² - basic model 45% 45% 61%
Adjusted R² - full model 55% 52% 67%
a<0.0001; b<0.05; c<0.10
all models include 1st or 2nd trimester hormone concentration and the respective gestational age

47
Models based on both the 1st and 2nd trimester hormone concentrations
accounted for 45% (estradiol and progesterone) to 61% (testosterone) of the
variation observed in the 3rd trimester (Table 9C); results were similar after
addition of all available maternal and newborn characteristics.
4.2.2 Two Consecutive Pregnancies
Next, we compared hormone concentrations by trimester in women
providing samples from two consecutive pregnancies. In terms of 1st trimester
hormone concentrations, progesterone was most strongly correlated between
two pregnancies (r=0.47; p<0.05), whereas for the 3rd trimester concentrations,
between pregnancy correlations were strongest for estradiol and testosterone
(rE2=0.68 and rT=0.69; p<0.01).
Median changes in hormone concentrations between the two pregnancies
were low and showed no significant differences with the exception of
testosterone in the 3rd trimester (T3 p1=1.04 ng/mL, T3 p2=0.89 ng/mL;
pWS=0.02). When comparing hormone concentrations by parity (Table 10),
primiparous women had higher 3rd trimester testosterone levels than biparous
women (T3 primi: 1.04 ng/mL, T3 bi: 0.98 ng/mL; pWS=0.007). However, no
further decrease in 3rd trimester testosterone levels was evident when
comparing biparous women to women with >2 children (T3 bi: 0.98 ng/mL,
T3 >2 ch: 0.87 ng/mL; pws>0.30).
Table 10. Median hormone concentrations (10th-90th percentiles) by number of children in 21 consecutive pregnancies
Child 1 (n=13) Child 2 (n=19) Child >2 (n=10)
Estradiol (ng/mL)
1st trimester 2.63 (1.25-4.04) 2.23 (1.13-3.75) 1.70 (0.98-2.89)
2nd trimester 9.00 (7.46-13.5) 8.11 (5.76-13.2) 6.97 (4.67-14.1)
3rd trimester 21.5 (16.6-34.7) 22.9 (13.3-31.0) 20.0 (16.2-32.0)
Progesterone (ng/mL)
1st trimester 33.5 (22.0-47.6) 34.6 (23.3-64.3) 27.2 (20.6-35.7)
2nd trimester 67.0 (39.3-90.6) 57.0 (41.1-82.2) 53.7 (37.9-75.8)
3rd trimester 183 (135-207) 149 (101-249) 165 (145-214)
Testosterone (ng/mL)
1st trimester 0.84 (0.57-1.49) 0.80 (0.46-1.43) 0.72 (0.40-1.27)
2nd trimester 1.10 (0.70-1.30) 1.02 (0.57-1.73) 1.01 (0.57-1.31)
3rd trimester 1.04 (0.74-2.81) 0.98 (0.59-2.16) 0.87 (0.46-1.77)

48
4.2.3 Sensitivity Analyses
The results presented for testosterone are based on all available
measurements. Excluding the testosterone measurements from the batch that
resulted in higher inter-assay CVs for this hormone (n=80 samples) did not
change the direction or significance of the associations with the exception of
attenuated results for 3rd trimester levels by parity (T3 original primi: 2.56 ng/mL vs.
T3 original bi: 0.71 ng/mL, pMW<0.01; T3 limited primi: 2.16 ng/mL vs. T3 limited bi: 0.69
ng/mL, pMW=0.13) and 1st trimester concentrations by smoking (T1 original smoker:
1.69 ng/mL vs. T1 original non-smoker: 0.89 ng/mL, pMW=0.03; T1 limited smoker: 1.04
ng/mL vs. T1 limited non-smoker: 0.74 ng/mL, pMW=0.08).
Results were similar after limiting the study population to primi- and
bi-gravid women.

49
5. Discussion
5.1 Methodological Considerations: Case-Control Study
Strengths
One strength of the nested case-control study is the well-defined source
population from two unique Maternity Cohorts in Finland and Northern
Sweden. It is the largest prospective study on the associations of pre-diagnostic
sex steroids and IGF-I with risk of EOC to date and the first with detailed
analyses by tumor histology. It is also the first prospective study on the
associations of placental GH and AMH with EOC risk.
The study population consisted of young women (median age at blood
draw=31.5 years; median age at diagnosis=43.9 years), which allowed us to
assess invasive and borderline tumors separately. Prior prospective studies
could not address risk by tumor invasiveness because study participants were
substantially older at recruitment (mean/median age at blood draw >50 years;
Tables 11 and 12) and borderline tumors are diagnosed at a younger age (~33%
<40 years, ~33% between 40 and 54 years);12,13 therefore, numbers would likely
have been too small to derive meaningful conclusions.
As the women in the current study were pregnant, we were able to
measure the continuously secreted placental GH, an analogue to the pulsatile
pituitary GH. Furthermore, it was methodologically easier to measure
progesterone and estradiol levels, as pregnancy concentrations of these
hormones do not cycle as observed in non-pregnant premenopausal women.
Case and control subjects were tightly matched for age and date at
sampling, as well as parity at the index pregnancy and parity at
diagnosis/selection as a control, thus controlling for several sources of potential
confounding factors (e.g., hormone concentrations differing by parity or
maternal age).
50
Missing / incomplete data
The lack of information on grade and the incomplete data on stage
(available for 824 (78%) cases) is a limitation of this study. Especially as
low- and high-grade serous cancers can be distinguished histologically and are
considered to be different tumor types.4 However, analyses by stage (as a proxy
for grade) for invasive serous tumors showed the expected heterogeneity.
Another limitation is the lack of data on OC use before pregnancy.
Previous studies investigating the effect of past OC use on levels of IGF-I were
inconclusive,191,192 however, it is known that oral estrogens can suppress hepatic
IGF-I production.193 Significantly lower AMH levels were observed in current
users as compared to never users, however, AMH levels were similar in previous
and never users.194 As the effect of OC use is reversible after cessation, previous
OC use is unlikely to substantially influence concentrations of sex steroid
hormones, IGF-I, or AMH during pregnancy.195,196
Samples
Although study samples had been in long-term storage (median=21 years)
at relatively high temperatures (-25/-20 °C), hormone concentrations were
uncorrelated with time in storage (r<0.15), as has been reported previously.197
Moreover, case and control samples were stored under the same conditions and
matched on date of blood draw. Furthermore, we used cohort-specific tertile
cutoff points to estimate risk.
Another limitation is that only one blood measurement was available.
Several longitudinal studies in premenopausal, non-pregnant women report
very high intraclass correlation coefficients (ICC) for AMH concentrations
measured during the same menstrual cycle phase: during three consecutive
cycles (ICC=0.89), one year apart (ICC=0.88), and also 4 years apart
(ICC=0.66), suggesting that AMH concentrations are well correlated over time
in the same woman.198-200 Another study in premenopausal women evaluated
the reproducibility of steroid hormones and IGF-I over a 2-3 year period and
concluded that a single measurement obtained during either the follicular or
luteal phase sufficiently characterizes the levels of IGF-I (ICCF=0.69;
51
ICCL=0.83), SHBG (ICCF=ICCL=0.83), and androgens (ICCF>0.57;
ICCL=0.56).201 On the other hand, relatively low ICCs were reported for
estradiol (ICCF=0.38; ICCL=0.45) and progesterone (ICCL=0.29).201 This is in
line with what is observed during pregnancy; while concentrations of androgens
can relatively reliably be characterized using a single measurement, this has
proved to be more difficult for levels of estradiol and progesterone.
Furthermore, the lack of association between pre-diagnostic circulating
hormones and EOC may reflect the possibility that intra-ovarian, rather than
circulating, hormone concentrations are more important in the etiology of this
disease.
Statistical analyses
It is important to take into account that several of the studied hormones
vary with gestational age. Exact matching for GA is not feasible and would have
resulted in substantial constraints for control selection. Instead, we included GA
as continuous term in the statistical models. Another approach is to model the
hormone levels as a function of GA using local linear regression, a
nonparametric smoothing technique that employs weighted regression and uses
varying subsets of the data to estimate the curve at each point,202 and to
calculate residuals, i.e. the difference between the woman’s measured level and
the estimated mean hormone value for the day of gestation on which the blood
sample was collected. For ease of interpretability, the presented results in this
thesis are based on analyses including GA as continuous term in the models.
However, we repeated the analyses using the ‘residual’ approach, which led to
very similar results.
Multiple statistical tests were carried out to analyze associations of
endogenous hormones with risk of EOC and thus some of our findings could be
due to chance.
Despite the large number of cases included in this study, numbers were
small for the clear cell subtype (n=26 cases) and for some groups in subgroup
analyses (e.g., by stage).
52
5.2 Methodological Considerations: Longitudinal Study
The longitudinal study has a number of strengths: 1) we specified 2-week
ranges in each trimester for sample collection to account for the changing
hormone concentrations during pregnancy; 2) with the equal number of primi-
and biparous women, we were able to investigate hormone variations by parity;
and 3) we focused on normal uncomplicated pregnancies with a healthy
singleton offspring, as pregnancy-related complications (e.g., pre-eclampsia)
can cause changes in the hormonal milieu.
The low number of women in some of the subgroup analyses is one
limitation but it is owed to the exploratory nature of our study.
The inter-assay CV for testosterone was relatively high (44%), however,
results did not change when excluding the measurements from the batch (n=80
samples) causing the high inter-assay CV.
Another limitation is that we could assess smoking status during the first
trimester only. However, more than 60% of women who smoke in the first
trimester are reported to continue throughout pregnancy.203,204 The observed
changes in estradiol and testosterone levels are therefore likely to represent
concentrations in current smokers.

53
5.3 General Discussion: Case-Control Study
The nested case-control study is the first study on hormone
concentrations measured during pregnancy and subsequent risk of maternal
EOC. The protective effect of parity on EOC risk has consistently been shown in
epidemiologic studies, but the underlying mechanisms are largely unknown.
The nested case-control study allowed us to explore associations of
pregnancy-related hormones (progesterone, estradiol, placental GH) with risk
of EOC. In addition, we assessed the relationship between hormones that are
not substantially affected by early pregnancy (androgens, AMH, IGF-I) and
consider them as a proxy for the associations in non-pregnant premenopausal
women. Furthermore, associations were assessed by tumor invasiveness and
histology providing further evidence for the heterogeneity of EOC.
We observed heterogeneity in the associations between endogenous
hormones measured in early pregnancy with respect to EOC subtypes: i) higher
androgen concentrations were associated with an increased risk of borderline
serous, as well as invasive and borderline mucinous tumors, ii) higher estradiol
was positively associated with the risk of endometrioid tumors, iii) higher IGF-I
was inversely associated with the risk of invasive tumors, especially in women
diagnosed at age <55 years, and iv) a heterogeneous association was observed
for AMH and invasive serous cancer by age at blood draw. None of the studied
hormones were associated with the risk of clear cell tumors. Progesterone,
SHBG, and placental GH were not associated with the risk of EOC, regardless of
tumor histology and invasiveness.
Five prior prospective studies explored the associations of circulating
androstenedione and testosterone with risk of EOC (Table 11). Rinaldi et al.115 is
based on a subset of the study population included in the more recent
publication by Ose et al.117
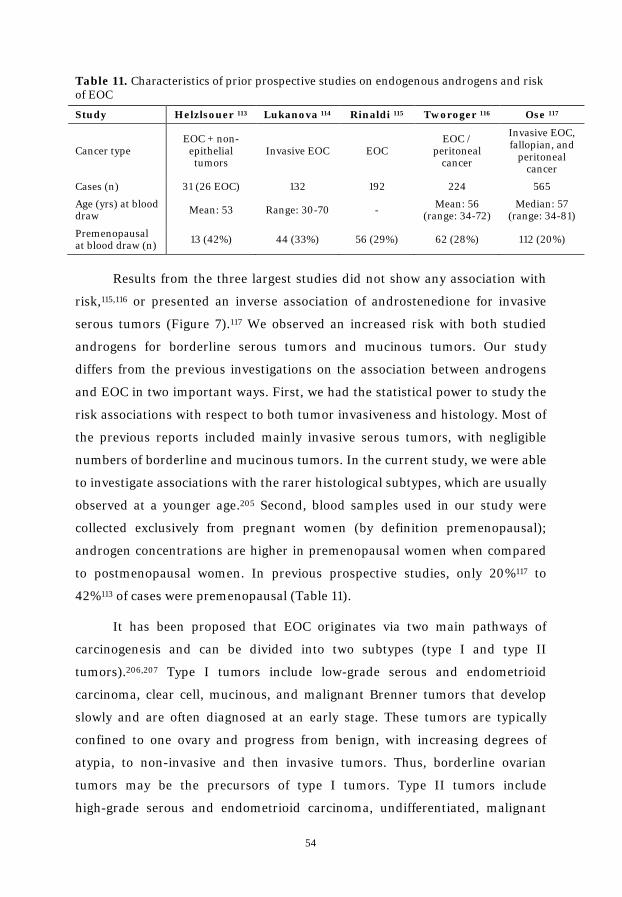
54
Table 11. Characteristics of prior prospective studies on endogenous androgens and risk of EOC
Study Helzlsouer 113 Lukanova 114 Rinaldi 115 Tworoger 116 Ose 117
Cancer type EOC + non-
epithelial tumors
Invasive EOC EOC EOC /
peritoneal cancer
Invasive EOC, fallopian, and
peritoneal cancer
Cases (n) 31 (26 EOC) 132 192 224 565
Age (yrs) at blood draw Mean: 53 Range: 30-70 - Mean: 56
(range: 34-72) Median: 57
(range: 34-81)
Premenopausal at blood draw (n) 13 (42%) 44 (33%) 56 (29%) 62 (28%) 112 (20%)
Results from the three largest studies did not show any association with
risk,115,116 or presented an inverse association of androstenedione for invasive
serous tumors (Figure 7).117 We observed an increased risk with both studied
androgens for borderline serous tumors and mucinous tumors. Our study
differs from the previous investigations on the association between androgens
and EOC in two important ways. First, we had the statistical power to study the
risk associations with respect to both tumor invasiveness and histology. Most of
the previous reports included mainly invasive serous tumors, with negligible
numbers of borderline and mucinous tumors. In the current study, we were able
to investigate associations with the rarer histological subtypes, which are usually
observed at a younger age.205 Second, blood samples used in our study were
collected exclusively from pregnant women (by definition premenopausal);
androgen concentrations are higher in premenopausal women when compared
to postmenopausal women. In previous prospective studies, only 20%117 to
42%113 of cases were premenopausal (Table 11).
It has been proposed that EOC originates via two main pathways of
carcinogenesis and can be divided into two subtypes (type I and type II
tumors).206,207 Type I tumors include low-grade serous and endometrioid
carcinoma, clear cell, mucinous, and malignant Brenner tumors that develop
slowly and are often diagnosed at an early stage. These tumors are typically
confined to one ovary and progress from benign, with increasing degrees of
atypia, to non-invasive and then invasive tumors. Thus, borderline ovarian
tumors may be the precursors of type I tumors. Type II tumors include
high-grade serous and endometrioid carcinoma, undifferentiated, malignant

55
mixed mesodermal, and transitional cell tumors that are highly aggressive and
usually present at an advanced stage. It has been suggested that type II tumors
mainly originate from epithelium outside the ovary and invade the ovary
secondarily.206,207
Figure 7. ORs [95% CIs] of overall EOC for top tertile/quartile of circulating androgen concentrations
A) Testosterone in women premenopausal at blood collection
B) Androstenedione in women premenopausal at blood collection
While we were unable to define EOC cases into type I / II due to missing
data on grade in our study, we observed significant positive associations
between androgen concentrations and borderline / invasive mucinous, as well
as borderline serous subtypes, suggesting that androgens may be involved in the
development of the slowly growing tumors in the ovaries, whereas they do not
appear to influence the risk of the most aggressive cancers, which are probably
of extra-ovarian origin. This hypothesis is also supported by the observation
that risk increased for a doubling of testosterone concentrations in invasive
Lukanova, 2003 (44 cases)
Rinaldi, 2007 (56 cases)
Tworoger, 2008 (62 cases)
Ose, 2014 (112 cases)
Present study (640 cases)
1.54 [0.56-4.24]
1.27 [0.60-2.69]
0.50 [0.20-1.40]
1.16 [0.57-2.38]
1.37 [1.08-1.72]
0.5 1.0 1.5 2.0 3.0 4.0
Helzlsouer, 1995 (31 cases)
Lukanova, 2003 (44 cases)
Rinaldi, 2007 (56 cases)
Tworoger, 2008 (62 cases)
Ose, 2014 (112 cases)
Present study (640 cases)
7.60 [1.20-48.70]
2.19 [0.80-6.01]
1.11 [0.55-2.24]
0.90 [0.30-2.90]
0.80 [0.38-1.70]
1.36 [1.08-1.72]
0.5 1.0 1.5 2.0 3.0 4.0 6.0 7.0 8.0

56
serous tumors diagnosed as localized (proxy for type I ORlog2: 1.91 [1.02-3.57]),
but not those diagnosed as advanced disease (proxy for type II ORlog2: 0.88
[0.68-1.14]; phet=0.03).
Associations of circulating 17-OHP concentrations with EOC risk have not
been evaluated previously. We observed a positive association between 17-OHP
concentrations and risk of borderline serous tumors. However, adjustment for
androgens resulted in substantial attenuation of the results (Table 5), suggesting
that higher circulating androgens are major determinants of borderline serous
tumors, whereas circulating 17-OHP contributes to tumor development mainly
as a precursor hormone for the synthesis of androgens.
Results from experimental studies, and a number of indirect
observations, indicate that elevated progesterone concentrations may be
inversely associated with the risk of EOC. Progesterone has been shown to have
a potent apoptotic effect on the surface epithelium and to induce cellular
senescence of ovarian cancer cells through FOXO1.88,90 Results from
epidemiological studies consistently show an inverse association between
increasing parity, and the use of OCs with EOC.25,65 Owing to its potent
apoptotic effect and elevated production during pregnancy, progesterone is the
most plausible candidate to mediate a ‘washout effect’, i.e., elimination from the
ovary of cells that have undergone malignant transformation, a hypothesis
proposed to explain the greater protective effect of pregnancies completed at an
older age.21 In addition, results from observational studies have indicated that
incomplete pregnancies confer less protection than a pregnancy conducted to
term or are not associated with EOC risk.19,20,23
However, we observed no association between early pregnancy
progesterone and risk of EOC. One explanation for the lack of association could
be that 1st trimester progesterone concentrations do not reflect exposure in the
3rd trimester. It is plausible that only very high progesterone concentrations, as
observed during the third trimester, are etiologically important, whereas the
57
substantially lower hormone concentrations during the first trimester are not.
Results obtained using cell culture models indicate that growth inhibition and
apoptosis occur only at very high concentrations (≥10-6M).108 In addition,
during multiple pregnancies, progesterone concentrations are higher compared
with singleton pregnancies, and women with a history of multiple births are at a
reduced risk of non-mucinous EOC.69,97
Our finding of a positive association between estrogen concentrations
with the risk of endometrioid tumors is novel. Elevated estrogen concentrations
are consistently associated with an increased risk of endometrial cancer in
postmenopausal women.124,125 Furthermore, endometrial cancer and
endometrioid EOC share similar risk factor profiles, as well as several common
genes and pathways that are involved in their molecular pathogenesis.208 It has
also been reported that patients with endometriosis, which is associated with
molecular aberrations that favor increased local production of estradiol,126 are at
an increased risk of developing endometrioid EOC.37,38 Although clear cell
tumors may originate in part from endometriosis, we did not find any
association between estradiol and clear cell tumors. This finding might be due to
the small number of cases in our study (n=26), but it is consistent with the
hypothesis that clear cell tumors may arise from endometriosis through
mechanisms independent of hormonal signaling.6
However, the direct association between estradiol and endometrioid EOC
should be interpreted cautiously and needs to be replicated in other studies in
premenopausal women.
Associations between GH and risk of EOC have not previously been
investigated directly, but only through investigations exploring the effect of
IGF-I on risk of EOC. We did not observe an association between placental GH
and EOC in our data. However, there is evidence from in vitro and animal
studies relating pituitary GH to other epithelial cancers, including breast,
prostate, and colon cancers.209 Evidence for the involvement of GH in human

58
carcinogenesis comes from patients suffering from acromegaly, i.e. GH
hyper-secretion, as they have an increased risk of developing colorectal cancer,
and potentially breast and prostate cancers.210 Conversely, in patients with
Laron syndrome, i.e. primary GH insensitivity, a reduced risk was observed.211
The release of pituitary GH is stimulated by the growth
hormone-releasing hormone (GHRH). Its antagonists have been shown to
reduce growth of human ovarian cancer cell lines in xenografted nude mice, but
it is not yet clear whether this effect is due to the inhibition of GH release, and
thus hepatic IGF-I synthesis, suppression of autocrine and/or paracrine IGF-I
production, or both.212,213
To date, four prospective studies evaluated the association of circulating
IGF-I with risk of EOC in pre- and postmenopausal women (Table 12). The
study by Peeters et al.144 is based on a subset of the study population included in
the more recent publication by Ose et al.145
Table 12. Characteristics of prior prospective studies on endogenous IGF-I and risk of EOC
Lukanova 143 Peeters 144 Tworoger 146 Ose 145
Cancer type Invasive EOC EOC EOC / peritoneal cancer
Invasive EOC, fallopian, and
primary peritoneal cancer
Age (yrs) at blood draw Range: 30-70 Median: 57 Mean: 56
(range: 34-73) Median: 57
(range: 34-80)
Cases (n) 132 214 222 565
Premenopausal at blood draw (n) 44 (33%) 56 (26%) 62 (28%) 112 (20%)
<55 years at diagnosis (n) 41 (31%) 66 (31%) 59 (27%) 105 (19%)
Study results were inconclusive and reported either no association143-145
or an inverse association with ovarian cancer risk.146 Two of these investigations
observed an increased risk in women diagnosed before age 55 years,143,144
whereas the remaining reported a non-significant decrease in risk for women
diagnosed before age 55 years (Figure 8).145,146 However, the proportion of
women <55 years in these studies was low (<35%; Table 12), whereas 90% of the
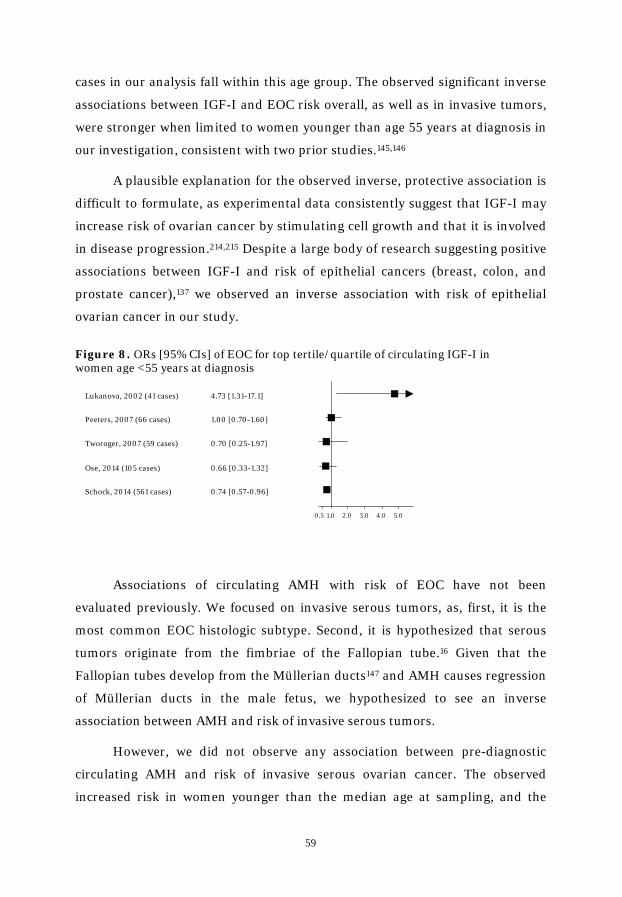
59
cases in our analysis fall within this age group. The observed significant inverse
associations between IGF-I and EOC risk overall, as well as in invasive tumors,
were stronger when limited to women younger than age 55 years at diagnosis in
our investigation, consistent with two prior studies.145,146
A plausible explanation for the observed inverse, protective association is
difficult to formulate, as experimental data consistently suggest that IGF-I may
increase risk of ovarian cancer by stimulating cell growth and that it is involved
in disease progression.214,215 Despite a large body of research suggesting positive
associations between IGF-I and risk of epithelial cancers (breast, colon, and
prostate cancer),137 we observed an inverse association with risk of epithelial
ovarian cancer in our study.
Figure 8. ORs [95% CIs] of EOC for top tertile/quartile of circulating IGF-I in women age <55 years at diagnosis
Associations of circulating AMH with risk of EOC have not been
evaluated previously. We focused on invasive serous tumors, as, first, it is the
most common EOC histologic subtype. Second, it is hypothesized that serous
tumors originate from the fimbriae of the Fallopian tube.16 Given that the
Fallopian tubes develop from the Müllerian ducts147 and AMH causes regression
of Müllerian ducts in the male fetus, we hypothesized to see an inverse
association between AMH and risk of invasive serous tumors.
However, we did not observe any association between pre-diagnostic
circulating AMH and risk of invasive serous ovarian cancer. The observed
increased risk in women younger than the median age at sampling, and the
Lukanova, 2002 (41 cases)
Peeters, 2007 (66 cases)
Tworoger, 2007 (59 cases)
Ose, 2014 (105 cases)
Schock, 2014 (561 cases)
4.73 [1.31-17.1]
1.00 [0.70-1.60]
0.70 [0.25-1.97]
0.66 [0.33-1.32]
0.74 [0.57-0.96]
0.5 1.0 2.0 3.0 4.0 5.0

60
opposite in older women in our study, was unexpected. These results may be
due to chance, or might reflect a different follicle recruitment rate pattern in
case and control subjects. A higher follicle recruitment rate before age
30-35 years would most likely result in higher circulating AMH at younger age,
but would cause a faster and earlier depletion of the primordial follicles,
resulting in a lower rate of follicle recruitment and lower AMH concentrations
at older reproductive age. Our data show a stronger inverse correlation of AMH
with age in cases (r=-0.50 [-0.62, -0.33]) relative to controls (r=-0.27
[-0.39, -0.14]), indicating a more rapid depletion of the pool of primordial
follicles with older age in cases. This observation is consistent with the
follicle-depletion hypothesis, which stipulates that slower follicle depletion may
decrease risk of developing EOC.216 High initial follicle recruitment rate and
early depletion of the primordial follicles have been observed in AMH null or
heterozygous mice that have preserved fertility.217,218 The growth inhibitory
effect of AMH on EOC risk could be more pronounced in older women, who
have accumulated greater genetic damage over time, than in younger women.
This may contribute to the inverse association of AMH with risk of invasive
ovarian cancer after age 35 years. The association of AMH with risk did not vary
by lag time.
As presented in this study, hormones are likely to play a role in the origin
and progression of EOC. They are primarily mediated through interaction with
their respective nuclear receptors, which are differently expressed in normal
ovarian tissue,219 fallopian tube epithelium,220 and in EOC depending on
histology.220-227
The androgen receptor (AR) is expressed in normal ovarian tissue (42%)
and fallopian tubes (69%).219,220 Positive staining (>10%) is observed in 18-44%
of EOC, with highest expression in serous tumors.220,221 Strong staining (>50%)
of the progesterone receptor (PR) is observed in 14% of EOC,227 with the highest
expression observed in endometrioid tumors.226,227 Estrogen action is mediated
by two estrogen receptor (ER) subtypes, ER-α and ER-β, with supposedly
different roles in the ovaries.228 Several studies report similar expression of
61
ER-α in normal and malignant ovarian tissue, but observe lower ER-β
expression and higher ER-α/ER-β ratio in malignant as compared to normal
ovarian tissue.229,230 No differences in expression of ER-α and ER-β mRNA were
observed in normal and malignant epithelial ovarian cell cultures.231,232
However, the ratio of ER-α/ER-β was increased in cell cultures derived from
EOC.231 One study (n=149 EOC) reported positive (≥10%) nuclear staining in
31% (ER-α) and 16% (ER-β) of patients diagnosed with serous EOC.233 The
IGF-I receptor (IGF-IR) is expressed in 50%-57% of serous tumors, but no
expression was detected in normal ovarian tissue.225,234 Two studies evaluated
the expression of AMHRII.223,224 While one study reported high expression of
AMHRII in mucinous (100%), serous (76%), endometrioid (55%), and clear cell
(40%) tumors,223 the other study observed positive staining in 25% of serous
EOC, with no or weak staining in the other histological subgroups.224 The wide
range of receptor expression within the same tissue may result from various
factors, e.g. type of the analyzed sample, differing immunohistochemical
platforms, sample size, and the lack of a standardized scoring system.
Given that EOC is a hormone-responsive cancer, endocrine therapy is an
attractive anticancer treatment, which can be easily administered. Studies on
cell lines and in mouse models were promising.88,235-238 In humans, high AR
expression was associated with prolonged disease specific survival in patients
with serous EOC.220 On the other hand, ER and PR expression were associated
with improved survival in patients diagnosed with endometrioid EOC.227
However, the limited number of small-scale clinical trials conducted so far
testing endocrine therapy in EOC have shown only modest response rates
overall with few patients that responded well.17,63

62
5.4 General Discussion: Longitudinal Study
The longitudinal study demonstrates patterns of change in hormone
concentrations throughout pregnancy. The substantial increase in maternal
serum concentrations of estradiol and progesterone throughout pregnancy is
well established82,106 and was also evident in our study. The gradual, more
modest increase in testosterone concentration across gestation has been
reported in prior longitudinal studies.106,239
Estradiol concentrations were correlated in successive pregnancies in our
investigation, with stronger correlation coefficients in the 3rd (r=0.68) as
compared to the 1st (r=0.47) trimester. A previous study based on 34 women
with uncomplicated first and second full-term pregnancies reported a strong
correlation (r=0.78) between early estradiol levels in the consecutive
pregnancies.180
We observed a non-significant suggestion of lower estradiol
concentrations throughout pregnancy in biparous women. This is consistent
with previous studies reporting lower first and second trimester estradiol levels
in multiparous as compared to primiparous women.240-245 The decreased
concentrations of estradiol in multiparous women are hypothesized to be a
result of increased pregnancy-induced 16α-hydroxylase activity in the maternal
liver during prior pregnancies leading to increased metabolism of estradiol, and
thus lower circulating estradiol in subsequent pregnancies.246 We observed
significantly lower progesterone and testosterone concentrations in biparous as
compared to primiparous women; this was also reported in prior studies on
early pregnancy hormones.241-244
Women who smoked during pregnancy had higher 3rd trimester estradiol
concentrations than non-smoking women. However, prior studies investigating
the relationship of estradiol and smoking in pregnant women, conducted in
1st or 2nd trimester samples, reported no association of estradiol concentrations
with smoking.241,242,244 Estradiol concentrations were also similar in
premenopausal smoking and non-smoking women, with blood samples
obtained during the early follicular phase or assessed longitudinally during two

63
cycles.247-249 In concordance with our results, higher testosterone levels in
smoking women were also observed in one large-scale study (1 343 pregnant
women),242 whereas a smaller study (420 pregnant women) did not observe
such an association.244 Studies in non-pregnant, premenopausal women are
inconclusive. While one large study reported no differences in testosterone
levels of smoking and non-smoking women,247 another study based on
10 women in both groups observed higher concentrations of testosterone among
smoking women as compared to non-smoking women.248
We observed no differences in hormone concentrations between women
pregnant with a boy or a girl. Prior studies are inconsistent, with some reporting
an increase in early pregnancy estradiol and testosterone concentrations in
women pregnant with a girl,242,243 and others observing no differences by fetal
sex.241,250 A decrease in pregnancy progesterone levels in women carrying a
female fetus was observed in one study that collected blood at gestational weeks
16 and 27,241 but not in studies conducted in gestational weeks 6-20.242,243,251
In conclusion, hormone concentrations measured in the 1st, 2nd, or
3rd trimester are correlated, as are hormone concentrations between
pregnancies. Furthermore, to some extent, it is possible to estimate selected
3rd trimester hormone concentrations based on one hormone measurement
drawn in early gestation and pregnancy characteristics. However, it is likely that
additional important factors are lacking to determine 3rd trimester
concentrations based on 1st and/or 2nd trimester levels.

64
6. Conclusions
Based on the results from the nested case-control study on endogenous
hormones and risk of EOC, we conclude that:
Early pregnancy androgen concentrations may be associated with
borderline serous, as well as borderline and invasive mucinous tumors.
Early pregnancy 17-OHP may be associated with borderline serous
tumors.
Early pregnancy estradiol concentrations may be associated with
endometrioid tumors.
Early pregnancy IGF-I concentrations may be inversely associated with
invasive EOC, especially in women aged <55 years at diagnosis.
Early pregnancy AMH concentrations may not be associated with
invasive serous EOC overall, but results by age at blood draw were
heterogeneous.
The study results do not support a role for early pregnancy placental
GH, progesterone, or SHBG in ovarian carcinogenesis.
Based on the results from the longitudinal study on circulating
concentrations of steroids throughout pregnancy, we conclude that:
Correlations between early pregnancy sex steroids are stronger between
consecutive trimesters of a pregnancy than between the 1st and
3rd trimester.
1st trimester measurement of testosterone represents the exposure
throughout pregnancy, whereas measurements of estradiol and
progesterone are representative for the first half only.
65
7. Outlook and Future Directions
Our results support the hypothesis of an involvement of hormones in the
etiology of EOC. To confirm our findings, studies in premenopausal,
non-pregnant women are necessary. Furthermore, this study supports EOC
heterogeneity. Future investigations by histologic EOC subgroups in consortia
are required for risk factor identification, risk prediction, and early detection.
To obtain knowledge on origin of EOC, underlying mechanisms of the
hormonal interplay in the female reproductive system have to be elucidated. It
is also necessary to explore pre-diagnostic hormone concentrations in relation
to the receptor status of the tumor, which may allow more refined investigations
of EOC etiology. To date this has been minimally explored in EOC, whereas in
breast cancer this approach has led to new insights and to development of
tailored treatment depending on the tumor receptor status.252
Data to predict risk of ovarian cancer in the general population are
sparse. So far, existing risk prediction models only include reproductive and
lifestyle factors and do not distinguish between the histological subgroups.253,254
Consideration of EOC heterogeneity and addition of endogenous hormone
concentrations to these models could improve the identification of women at
risk of developing EOC. Additional work investigating etiologic pathways by
histology is crucial.

66
Acknowledgments
There are many people involved in the process to complete a thesis. I wish to
express my sincere gratitude to those who have helped and supported me on
this journey. In particular I wish to express my deep and sincere gratitude to:
The women in the Northern Sweden Maternity Cohort and the Finnish
Maternity Cohort, without whose benevolence this work would have been
impossible.
Eva Lundin, my main supervisor, for your scientific guidance, endless support,
and encouragement. A big thank you for your hospitality and always warm
welcome!
Renée T Fortner, my assistant supervisor, for your enthusiasm, scientific
expertise, and constructive criticism. Thank you for all the inspiring
discussions!
My assistant supervisors Annika Idahl and Anne Zeleniuch-Jacquotte, for all
your support, scientific guidance, and constructive suggestions. It was great
having you on board!
Annie Lukanova, my initial supervisor, for your enthusiasm, scientific expertise,
and support. Thank you for introducing me to the world of research and giving
me the opportunity to grow!
Rudolf Kaaks, head of the department of Cancer Epidemiology, for giving me
the time and space to work on these exciting projects!
Kjell Grankvist, Hans-Åke Lakso, and all lab technicians for the high quality of
the laboratory work and support!
Robert Johansson, Lena Selbrand, Ritu Andersson, Heljä-Marja Surcel, Eero
Pukkala, and Matti Lehtinen for providing the Swedish and Finnish registry
data and constructive comments.
Terry Persson, Carina Ahlgren, Heike Weiss, and Petra Rössler for taking care
of travel arrangements, paperwork, and all .

67
Jasmine, Lisanne, Myrto, Kaja, Katja, Jennifer, and many other friends and
fellow doctoral students. I enjoyed sharing this experience with all of you!
Meinen Eltern, Katharina und Erwin, für Eure Liebe und Euer Vertrauen in
mich! Ihr seid immer für mich da und unterstützt mich bei all meinen Vorhaben
– dafür danke ich Euch von Herzen.
Meiner Schwester Olga für ihre Liebe und Geduld. Ich freue mich darauf
meinen Pflichten als Tante nachzukommen
All my colleagues at the department of Medical Biosciences in Umeå and at the
department of Cancer Epidemiology in Heidelberg for generating an inspiring
forum for scientific discussions.
All of you not mentioned, but nevertheless not forgotten, who have supported
and encouraged me during this work – my deepest thanks!
- THANK YOU -
This work was supported by grants from the National Cancer Institute at the
National Institute of Health, US and Lion’s Cancer Research Foundation at
Umeå University, Sweden.

68
References 1. Ferlay J, Soerjomataram I, Ervik M, Dikshit R, Eser S, Mathers C, et al. Globocan 2012
v1.0, Cancer Incidence and Mortality Worldwide: IARC CancerBase No. 112014.
2. Baldwin LA, Huang B, Miller RW, Tucker T, Goodrich ST, Podzielinski I, et al. Ten-year relative survival for epithelial ovarian cancer. Obstet Gynecol. 2012;120(3):612-8.
3. World Cancer Report 2014. Lyon, France: IARC Press; 2014.
4. Prat J. Ovarian carcinomas: five distinct diseases with different origins, genetic alterations, and clinicopathological features. Virchows Archiv : an international journal of pathology. 2012;460(3):237-49.
5. Auersperg N, Wong AS, Choi KC, Kang SK, Leung PC. Ovarian surface epithelium: biology, endocrinology, and pathology. EndocrRev. 2001;22(2):255-88.
6. Conklin CM, Gilks CB. Differential diagnosis and clinical relevance of ovarian carcinoma subtypes. Expert Review of Obstetrics & Gynecology. 2013;8(1):67-82.
7. Seidman JD, Cho KR, Ronnett BM, Kurman RJ. Surface Epithelial Tumors of the Ovary. In: Kurman RJ, Ellenson H, Ronnett BM, editors. Blaustein's Pathology of the Female Genital Tract. 6 ed: Springer US; 2011.
8. Brown J, Frumovitz M. Mucinous tumors of the ovary: current thoughts on diagnosis and management. Current oncology reports. 2014;16(6):389.
9. Soslow RA. Histologic subtypes of ovarian carcinoma: an overview. Int J Gynecol Pathol. 2008;27(2):161-74.
10. Yoshikawa N, Kajiyama H, Mizuno M, Shibata K, Kawai M, Nagasaka T, et al. Clinicopathologic features of epithelial ovarian carcinoma in younger vs. older patients: analysis in Japanese women. J Gynecol Oncol. 2014;25(2):118-23.
11. Morice P, Uzan C, Fauvet R, Gouy S, Duvillard P, Darai E. Borderline ovarian tumour: pathological diagnostic dilemma and risk factors for invasive or lethal recurrence. Lancet Oncol. 2012;13(3):e103-15.
12. Trope CG, Kaern J, Davidson B. Borderline ovarian tumours. Best Pract Res Clin Obstet Gynaecol. 2012;26(3):325-36.
13. du Bois A, Ewald-Riegler N, du Bois O, Harter P. Borderline-Tumoren des Ovars – eine systematische Übersicht. European Journal of Cancer. 2013;49(8):1905-14.
14. Auranen A, Grenman S, Makinen J, Pukkala E, Sankila R, Salmi T. Borderline ovarian tumors in Finland: epidemiology and familial occurrence. Am J Epidemiol. 1996;144(6):548-53.
15. Cadron I, Leunen K, Van Gorp T, Amant F, Neven P, Vergote I. Management of borderline ovarian neoplasms. J Clin Oncol. 2007;25(20):2928-37.
16. Kurman RJ, Shih Ie M. The origin and pathogenesis of epithelial ovarian cancer: a proposed unifying theory. Am J Surg Pathol. 2010;34(3):433-43.
17. Mungenast F, Thalhammer T. Estrogen biosynthesis and action in ovarian cancer. Frontiers in endocrinology. 2014;5:192.
18. Yang-Hartwich Y, Gurrea-Soteras M, Sumi N, Joo WD, Holmberg JC, Craveiro V, et al. Ovulation and extra-ovarian origin of ovarian cancer. Scientific reports. 2014;4:6116.
19. Whittemore AS, Harris R, Itnyre J. Characteristics relating to ovarian cancer risk: collaborative analysis of 12 US case-control studies. II. Invasive epithelial ovarian cancers in white women. Collaborative Ovarian Cancer Group. Am J Epidemiol. 1992;136(10):1184-203.
20. Risch HA, Marrett LD, Howe GR. Parity, contraception, infertility, and the risk of epithelial ovarian cancer. Am J Epidemiol. 1994;140(7):585-97.

69
21. Adami HO, Hsieh CC, Lambe M, Trichopoulos D, Leon D, Persson I, et al. Parity, age at first childbirth, and risk of ovarian cancer. Lancet. 1994;344(8932):1250-4.
22. Titus-Ernstoff L, Perez K, Cramer DW, Harlow BL, Baron JA, Greenberg ER. Menstrual and reproductive factors in relation to ovarian cancer risk. Br J Cancer. 2001;84(5):714-21.
23. Riman T, Dickman PW, Nilsson S, Correia N, Nordlinder H, Magnusson CM, et al. Risk factors for invasive epithelial ovarian cancer: results from a Swedish case-control study. Am J Epidemiol. 2002;156(4):363-73.
24. Beral V, Doll R, Hermon C, Peto R, Reeves G. Ovarian cancer and oral contraceptives: collaborative reanalysis of data from 45 epidemiological studies including 23,257 women with ovarian cancer and 87,303 controls. Lancet. 2008;371(9609):303-14.
25. Tsilidis KK, Allen NE, Key TJ, Dossus L, Lukanova A, Bakken K, et al. Oral contraceptive use and reproductive factors and risk of ovarian cancer in the European Prospective Investigation into Cancer and Nutrition. Br J Cancer. 2011;105(9):1436-42.
26. Faber MT, Jensen A, Frederiksen K, Glud E, Høgdall E, Høgdall C, et al. Oral contraceptive use and impact of cumulative intake of estrogen and progestin on risk of ovarian cancer. Cancer Causes Control. 2013;24(12):2197-206.
27. Pike MC, Pearce CL, Peters R, Cozen W, Wan P, Wu AH. Hormonal factors and the risk of invasive ovarian cancer: a population-based case-control study. Fertil Steril. 2004;82(1):186-95.
28. Rice MS, Murphy MA, Tworoger SS. Tubal ligation, hysterectomy and ovarian cancer: A meta-analysis. J Ovarian Res. 2012;5(1):13.
29. Rice MS, Hankinson SE, Tworoger SS. Tubal ligation, hysterectomy, unilateral oophorectomy, and risk of ovarian cancer in the Nurses' Health Studies. Fertil Steril. 2014;102(1):192-8.e3.
30. Whiteman DC, Siskind V, Purdie DM, Green AC. Timing of pregnancy and the risk of epithelial ovarian cancer. Cancer Epidemiology Biomarkers Prevention. 2003;12(1):42-6.
31. Bodelon C, Wentzensen N, Schonfeld SJ, Visvanathan K, Hartge P, Park Y, et al. Hormonal risk factors and invasive epithelial ovarian cancer risk by parity. Br J Cancer. 2013;109(3):769-76.
32. Stratton JF, Pharoah P, Smith SK, Easton D, Ponder BA. A systematic review and meta-analysis of family history and risk of ovarian cancer. Br J Obstet Gynaecol. 1998;105(5):493-9.
33. Granström C, Sundquist J, Hemminki K. Population attributable fractions for ovarian cancer in Swedish women by morphological type. Br J Cancer. 2008;98(1):199-205.
34. Trabert B, Wentzensen N, Yang HP, Sherman ME, Hollenbeck A, Danforth KN, et al. Ovarian cancer and menopausal hormone therapy in the NIH-AARP diet and health study. Br J Cancer. 2012;107(7):1181-7.
35. Koskela-Niska V, Pukkala E, Lyytinen H, Ylikorkala O, Dyba T. Effect of various forms of postmenopausal hormone therapy on the risk of ovarian cancer--a population-based case control study from Finland. Int J Cancer. 2013;133(7):1680-8.
36. Morch LS, Lokkegaard E, Andreasen AH, Kjaer SK, Lidegaard O. Hormone therapy and different ovarian cancers: a national cohort study. Am J Epidemiol. 2012;175(12):1234-42.
37. Pearce CL, Templeman C, Rossing MA, Lee A, Near AM, Webb PM, et al. Association between endometriosis and risk of histological subtypes of ovarian cancer: a pooled analysis of case-control studies. Lancet Oncol. 2012;13(4):385-94.
38. Heidemann LN, Hartwell D, Heidemann CH, Jochumsen KM. The relation between endometriosis and ovarian cancer - a review. Acta Obstet Gynecol Scand. 2014;93(1):20-31.

70
39. Faber MT, Kjær SK, Dehlendorff C, Chang-Claude J, Andersen KK, Høgdall E, et al. Cigarette smoking and risk of ovarian cancer: a pooled analysis of 21 case-control studies. Cancer Causes Control. 2013;24(5):989-1004.
40. Beral V, Gaitskell K, Hermon C, Moser K, Reeves G, Peto R. Ovarian cancer and smoking: individual participant meta-analysis including 28,114 women with ovarian cancer from 51 epidemiological studies. Lancet Oncol. 2012;13(9):946-56.
41. Ness RB, Grisso JA, Cottreau C, Klapper J, Vergona R, Wheeler JE, et al. Factors related to inflammation of the ovarian epithelium and risk of ovarian cancer. Epidemiology. 2000;11(2):111-7.
42. Gong TT, Wu QJ, Vogtmann E, Lin B, Wang YL. Age at menarche and risk of ovarian cancer: a meta-analysis of epidemiological studies. Int J Cancer. 2013;132(12):2894-900.
43. Moorman PG, Calingaert B, Palmieri RT, Iversen ES, Bentley RC, Halabi S, et al. Hormonal risk factors for ovarian cancer in premenopausal and postmenopausal women. American Journal of Epidemiology. 2008;167(9):1059-69.
44. Chiaffarino F, Parazzini F, Bosetti C, Franceschi S, Talamini R, Canzonieri V, et al. Risk factors for ovarian cancer histotypes. Eur J Cancer. 2007;43(7):1208-13.
45. Jordan SJ, Green AC, Whiteman DC, Webb PM. Risk factors for benign, borderline and invasive mucinous ovarian tumors: epidemiological evidence of a neoplastic continuum? Gynecol Oncol. 2007;107(2):223-30.
46. Gates MA, Rosner BA, Hecht JL, Tworoger SS. Risk factors for epithelial ovarian cancer by histologic subtype. American Journal of Epidemiology. 2010;171(1):45-53.
47. Yang HP, Trabert B, Murphy MA, Sherman ME, Sampson JN, Brinton LA, et al. Ovarian cancer risk factors by histologic subtypes in the NIH-AARP Diet and Health Study. International Journal of Cancer. 2012;131(4):938-48.
48. Modugno F, Ness RB, Wheeler JE. Reproductive risk factors for epithelial ovarian cancer according to histologic type and invasiveness. Ann Epidemiol. 2001;11(8):568-74.
49. Fathalla MF. Incessant ovulation--a factor in ovarian neoplasia? Lancet. 1971;2(7716):163.
50. Cramer DW, Welch WR. Determinants of ovarian cancer risk. II. Inferences regarding pathogenesis. J Natl Cancer Inst. 1983;71(4):717-21.
51. Webb P, Gertig D, Hunter D. Ovarian Cancer. In: Adami HO, Hunter D, Trichopoulos D, editors. Textbook of Cancer Epidemiology. 2nd ed. New York: Oxford Press; 2008. p. 494-516.
52. Ness RB, Cottreau C. Possible role of ovarian epithelial inflammation in ovarian cancer. J Natl Cancer Inst. 1999;91(17):1459-67.
53. Baandrup L, Faber MT, Christensen J, Jensen A, Andersen KK, Friis S, et al. Nonsteroidal anti-inflammatory drugs and risk of ovarian cancer: systematic review and meta-analysis of observational studies. Acta Obstet Gynecol Scand. 2013;92(3):245-55.
54. Vercellini P, Crosignani P, Somigliana E, Vigano P, Buggio L, Bolis G, et al. The 'incessant menstruation' hypothesis: a mechanistic ovarian cancer model with implications for prevention. Hum Reprod. 2011;26(9):2262-73.
55. Rostgaard K, Wohlfahrt J, Andersen PK, Hjalgrim H, Frisch M, Westergaard T, et al. Does pregnancy induce the shedding of premalignant ovarian cells? Epidemiology. 2003;14(2):168-73.
56. Risch HA. Hormonal etiology of epithelial ovarian cancer, with a hypothesis concerning the role of androgens and progesterone. J Natl Cancer Inst. 1998;90(23):1774-86.
57. Chhabra Y, Waters MJ, Brooks AJ. Role of the growth hormone-IGF-1 axis in cancer. Expert Review of Endocrinology and Metabolism. 2011;6(1):71-84.
58. Lukanova A, Kaaks R. Endogenous hormones and ovarian cancer: epidemiology and current hypotheses. Cancer Epidemiology Biomarkers Prevention. 2005;14 (1):98-107.
71
59. Riman T, Dickman PW, Nilsson S, Correia N, Nordlinder H, Magnusson CM, et al. Risk factors for epithelial borderline ovarian tumors: results of a Swedish case-control study. Gynecol Oncol. 2001;83(3):575-85.
60. Harris R, Whittemore AS, Itnyre J. Characteristics relating to ovarian cancer risk: collaborative analysis of 12 US case-control studies. III. Epithelial tumors of low malignant potential in white women. Collaborative Ovarian Cancer Group. Am J Epidemiol. 1992;136(10):1204-11.
61. Mills PK, Riordan DG, Cress RD. Epithelial ovarian cancer risk by invasiveness and cell type in the Central Valley of California. Gynecol Oncol. 2004;95(1):215-25.
62. Riman T, Nilsson S, Persson IR. Review of epidemiological evidence for reproductive and hormonal factors in relation to the risk of epithelial ovarian malignancies. Acta Obstet Gynecol Scand. 2004;83(9):783-95.
63. Modugno F, Laskey R, Smith AL, Andersen CL, Haluska P, Oesterreich S. Hormone response in ovarian cancer: time to reconsider as a clinical target? Endocr Relat Cancer. 2012;19(6):R255-R79.
64. Kurian AW, Balise RR, McGuire V, Whittemore AS. Histologic types of epithelial ovarian cancer: have they different risk factors? Gynecol Oncol. 2005;96(2):520-30.
65. Merritt MA, De PM, Vitonis AF, Titus LJ, Cramer DW, Terry KL. Reproductive characteristics in relation to ovarian cancer risk by histologic pathways. Human Reproduction. 2013;28(5):1406-17.
66. Fortner RT, Ose J, Merritt MA, Schock H, Tj Nneland A, Hansen L, et al. Reproductive and hormone-related risk factors for epithelial ovarian cancer by histologic pathways, invasiveness, and histologic subtypes: Results from the EPIC cohort. Int J Cancer. 2015.
67. Risch HA, Marrett LD, Jain M, Howe GR. Differences in risk factors for epithelial ovarian cancer by histologic type. Results of a case-control study. American Journal of Epidemiology. 1996;144(4):363-72.
68. Purdie DM, Siskind V, Bain CJ, Webb PM, Green AC. Reproduction-related risk factors for mucinous and nonmucinous epithelial ovarian cancer. Am J Epidemiol. 2001;153(9):860-4.
69. Whiteman DC, Murphy MF, Cook LS, Cramer DW, Hartge P, Marchbanks PA, et al. Multiple births and risk of epithelial ovarian cancer. J Natl Cancer Inst. 2000;92(14):1172-7.
70. Enstrom JE. Cancer mortality among Mormons in California during 1968--75. JNCI Journal of the National Cancer Institute. 1980;65(5):1073-82.
71. Phillips RL. Cancer among Seventh-Day Adventists. J Environ Pathol Toxicol. 1980;3(4 Spec No):157-69.
72. Fraumeni JF, Jr., Lloyd JW, Smith EM, Wagoner JK. Cancer mortality among nuns: role of marital status in etiology of neoplastic disease in women. JNCI Journal of the National Cancer Institute. 1969;42(3):455-68.
73. Banks E, Beral V, Reeves G. The epidemiology of epithelial ovarian cancer: a review. Int J Gynecol Cancer. 1997;7:425-38.
74. Pike MC, Pearce CL, Wu AH. Prevention of cancers of the breast, endometrium and ovary. Oncogene. 2004;23(38):6379-91.
75. Hankinson SE, Colditz GA, Hunter DJ, Willett WC, Stampfer MJ, Rosner B, et al. A prospective study of reproductive factors and risk of epithelial ovarian cancer. Cancer. 1995;76(2):284-90.
76. Dick ML, Siskind V, Purdie DM, Green AC. Incomplete pregnancy and risk of ovarian cancer: results from two Australian case-control studies and systematic review. Cancer Causes Control. 2009;20(9):1571-85.

72
77. Braem MG, Onland-Moret NC, Schouten LJ, Kruitwagen RF, Lukanova A, Allen NE, et al. Multiple miscarriages are associated with the risk of ovarian cancer: results from the European Prospective Investigation into Cancer and Nutrition. PloS one. 2012;7(5):e37141.
78. Wilcox AJ, Weinberg CR, O'Connor JF, Baird DD, Schlatterer JP, Canfield RE, et al. Incidence of early loss of pregnancy. N Engl J Med. 1988;319(4):189-94.
79. Chellakooty M, Vangsgaard K, Larsen T, Scheike T, Falck-Larsen J, Legarth J, et al. A longitudinal study of intrauterine growth and the placental growth hormone (GH)-insulin-like growth factor I axis in maternal circulation: association between placental GH and fetal growth. The Journal of clinical endocrinology and metabolism. 2004;89(1):384-91.
80. Clapp JF, III, Schmidt S, Paranjape A, Lopez B. Maternal insulin-like growth factor-I levels (IGF-I) reflect placental mass and neonatal fat mass. Am J Obstet Gynecol. 2004;190(3):730-6.
81. Köninger A, Kauth A, Schmidt B, Schmidt M, Yerlikaya G, Kasimir-Bauer S, et al. Anti-Mullerian-hormone levels during pregnancy and postpartum. Reprod Biol Endocrinol. 2013;11:60. doi: 10.1186/1477-7827-11-60.:60-11.
82. Taylor RN, Badell ML. The Endocrinology of Pregnancy. In: Gardner GD, Shoback D, editors. Greenspan's Basic & Clinical Endocrinology. 9th ed. New York: Lange Medical Books/McGraw-Hill; 2011. p. 553-71.
83. Gardner D, Shoback D. Greenspan's Basic and Clinical Endocrinology, Ninth Edition: McGraw-Hill Education; 2011.
84. Mesiano S. The Endocrinology of Human Pregnancy and Fetoplacental Neuroendocrine Development. In: Strauss JF, Barbieri RL, editors. Yen and Jaffe's Reproductive Endocrinology. 6th ed: Saunders Elsevier; 2009. p. 249-81.
85. Mittal P, Espinoza J, Hassan S, Kusanovic JP, Edwin SS, Nien JK, et al. Placental growth hormone is increased in the maternal and fetal serum of patients with preeclampsia. The journal of maternal-fetal & neonatal medicine : the official journal of the European Association of Perinatal Medicine, the Federation of Asia and Oceania Perinatal Societies, the International Society of Perinatal Obstet. 2007;20(9):651-9.
86. Miller WL, Auchus RJ. The molecular biology, biochemistry, and physiology of human steroidogenesis and its disorders. Endocr Rev. 2011;32(1):81-151.
87. Fritz MA, Speroff L. The Endocrinology of Pregnancy. Clinical Gynecologic Endocrinology and Infertility. 8 ed: Lippincott Williams & Wilkins, a Wolters Kluwer business; 2011. p. 269-330.
88. Diep CH, Charles NJ, Gilks CB, Kalloger SE, Argenta PA, Lange CA. Progesterone receptors induce FOXO1-dependent senescence in ovarian cancer cells. Cell Cycle. 2013;12(9):1433-49.
89. Ivarsson K, Sundfeldt K, Brannstrom M, Janson PO. Production of steroids by human ovarian surface epithelial cells in culture: possible role of progesterone as growth inhibitor. Gynecol Oncol. 2001;82(1):116-21.
90. Rodriguez GC, Walmer DK, Cline M, Krigman H, Lessey BA, Whitaker RS, et al. Effect of progestin on the ovarian epithelium of macaques: cancer prevention through apoptosis? J Soc Gynecol Investig. 1998;5(5):271-6.
91. Zhou H, Luo MP, Schonthal AH, Pike MC, Stallcup MR, Blumenthal M, et al. Effect of reproductive hormones on ovarian epithelial tumors: I. Effect on cell cycle activity. Cancer Biol Ther. 2002;1(3):300-6.
92. Bu SZ, Yin DL, Ren XH, Jiang LZ, Wu ZJ, Gao QR, et al. Progesterone induces apoptosis and up-regulation of p53 expression in human ovarian carcinoma cell lines. Cancer. 1997;79(10):1944-50.

73
93. Keith BM, Bonavida B. Inhibitory effects of 17beta-estradiol and progesterone on ovarian carcinoma cell proliferation: a potential role for inducible nitric oxide synthase. Gynecol Oncol. 2001;82(1):127-38.
94. Syed V, Ho SM. Progesterone-induced apoptosis in immortalized normal and malignant human ovarian surface epithelial cells involves enhanced expression of FasL. Oncogene. 2003;22(44):6883-90.
95. Yu S, Lee M, Shin S, Park J. Apoptosis induced by progesterone in human ovarian cancer cell line SNU-840. J Cell Biochem. 2001;82(3):445-51.
96. Abbassi-Ghanavati M, Greer LG, Cunningham FG. Pregnancy and laboratory studies: a reference table for clinicians. Obstet Gynecol. 2009;114(6):1326-31.
97. Smith R, Smith JI, Shen X, Engel PJ, Bowman ME, McGrath SA, et al. Patterns of plasma corticotropin-releasing hormone, progesterone, estradiol, and estriol change and the onset of human labor. The Journal of clinical endocrinology and metabolism. 2009;94(6):2066-74.
98. Neale RE, Darlington S, Murphy MF, Silcocks PB, Purdie DM, Talback M. The effects of twins, parity and age at first birth on cancer risk in Swedish women. Twin Res Hum Genet. 2005;8(2):156-62.
99. Albrektsen G, Heuch I, Thoresen S, Kvale G. Twin births, sex of children and maternal risk of ovarian cancer: a cohort study in Norway. BrJCancer. 2007;96(9):1433-5.
100. Jordan SJ, Green AC, Nagle CM, Olsen CM, Whiteman DC, Webb PM. Beyond parity: association of ovarian cancer with length of gestation and offspring characteristics. American Journal of Epidemiology. 2009;170(5):607-14.
101. Lambe M, Wuu J, Rossing MA, Hsieh CC. Twinning and maternal risk of ovarian cancer. Lancet. 1999;353(9168):1941.
102. La Vecchia C, Negri E, Talamini R, Conti E, Montella M, Franceschi S. Re: Multiple births and risk of epithelial ovarian cancer. J Natl Cancer Inst. 2001;93(4):319-20.
103. Markopoulos MC, Kassi E, Alexandraki KI, Mastorakos G, Kaltsas G. Hyperandrogenism after menopause. Eur J Endocrinol. 2015;172(2):R79-91.
104. Nestler JE, Jakubowicz DJ. Decreases in ovarian cytochrome P450c17 alpha activity and serum free testosterone after reduction of insulin secretion in polycystic ovary syndrome. The New England Journal of Medicine. 1996;335(9):617-23.
105. Makieva S, Saunders PT, Norman JE. Androgens in pregnancy: roles in parturition. Hum Reprod Update. 2014;20(4):542-59.
106. O'Leary P, Boyne P, Flett P, Beilby J, James I. Longitudinal assessment of changes in reproductive hormones during normal pregnancy. ClinChem. 1991;37(5):667-72.
107. Syed V, Ulinski G, Mok SC, Yiu GK, Ho SM. Expression of gonadotropin receptor and growth responses to key reproductive hormones in normal and malignant human ovarian surface epithelial cells. Cancer Res. 2001;61(18):6768-76.
108. Edmondson RJ, Monaghan JM, Davies BR. The human ovarian surface epithelium is an androgen responsive tissue. Br J Cancer. 2002;86(6):879-85.
109. Wiegratz I, Jung-Hoffmann C, Kuhl H. Effect of two oral contraceptives containing ethinylestradiol and gestodene or norgestimate upon androgen parameters and serum binding proteins. Contraception. 1995;51(6):341-6.
110. Schildkraut JM, Schwingl PJ, Bastos E, Evanoff A, Hughes C. Epithelial ovarian cancer risk among women with polycystic ovary syndrome. ObstetGynecol. 1996;88(4 Pt 1):554-9.
111. Olsen CM, Green AC, Nagle CM, Jordan SJ, Whiteman DC, Bain CJ, et al. Epithelial ovarian cancer: testing the 'androgens hypothesis'. Endocr Relat Cancer. 2008;15(4):1061-8.

74
112. Bodmer M, Becker C, Meier C, Jick SS, Meier CR. Use of metformin and the risk of ovarian cancer: a case-control analysis. Gynecol Oncol. 2011;123(2):200-4.
113. Helzlsouer KJ, Alberg AJ, Gordon GB, Longcope C, Bush TL, Hoffman SC, et al. Serum gonadotropins and steroid hormones and the development of ovarian cancer. JAMA: The Journal of the American Medical Association. 1995;274(24):1926-30.
114. Lukanova A, Lundin E, Akhmedkhanov A, Micheli A, Rinaldi S, Zeleniuch-Jacquotte A, et al. Circulating levels of sex steroid hormones and risk of ovarian cancer. Int J Cancer. 2003;104(5):636-42.
115. Rinaldi S, Dossus L, Lukanova A, Peeters PH, Allen NE, Key T, et al. Endogenous androgens and risk of epithelial ovarian cancer: results from the European Prospective Investigation into Cancer and Nutrition (EPIC). Cancer EpidemiolBiomarkers Prev. 2007;16(1):23-9.
116. Tworoger SS, Lee IM, Buring JE, Hankinson SE. Plasma androgen concentrations and risk of incident ovarian cancer. American Journal of Epidemiology. 2008;167(2):211-8.
117. Ose J, Fortner RT, Rinaldi S, Schock H, Overvad K, Tjonneland A, et al. Endogenous androgens and risk of epithelial invasive ovarian cancer by tumor characteristics in the European Prospective Investigation into Cancer and Nutrition. Int J Cancer. 2014.
118. Escobar JC, Patel SS, Beshay VE, Suzuki T, Carr BR. The human placenta expresses CYP17 and generates androgens de novo. The Journal of clinical endocrinology and metabolism. 2011;96(5):1385-92.
119. Nash JD, Ozols RF, Smyth JF, Hamilton TC. Estrogen and anti-estrogen effects on the growth of human epithelial ovarian cancer in vitro. Obstet Gynecol. 1989;73(6):1009-16.
120. Armaiz-Pena GN, Mangala LS, Spannuth WA, Lin YG, Jennings NB, Nick AM, et al. Estrous cycle modulates ovarian carcinoma growth. Clin Cancer Res. 2009;15(9):2971-8.
121. Laviolette LA, Garson K, Macdonald EA, Senterman MK, Courville K, Crane CA, et al. 17beta-estradiol accelerates tumor onset and decreases survival in a transgenic mouse model of ovarian cancer. Endocrinology. 2010;151(3):929-38.
122. Murdoch WJ, Van Kirk EA. Oestradiol inhibits spontaneous and cisplatin-induced apoptosis in epithelial ovarian cancer cells: relationship to DNA repair capacity. Apoptosis. 1997;2(5):478-84.
123. Choi KC, Kang SK, Tai CJ, Auersperg N, Leung PC. Estradiol up-regulates antiapoptotic Bcl-2 messenger ribonucleic acid and protein in tumorigenic ovarian surface epithelium cells. Endocrinology. 2001;142(6):2351-60.
124. Lukanova A, Lundin E, Micheli A, Arslan A, Ferrari P, Rinaldi S, et al. Circulating levels of sex steroid hormones and risk of endometrial cancer in postmenopausal women. Int J Cancer. 2004;108(3):425-32.
125. Allen NE, Key TJ, Dossus L, Rinaldi S, Cust A, Lukanova A, et al. Endogenous sex hormones and endometrial cancer risk in women in the European Prospective Investigation into Cancer and Nutrition (EPIC). EndocrRelat Cancer. 2008;15(2):485-97.
126. Worley MJ, Welch WR, Berkowitz RS, Ng SW. Endometriosis-associated ovarian cancer: a review of pathogenesis. IntJMolSci. 2013;14(3):5367-79.
127. Frankenne F, Closset J, Gomez F, Scippo ML, Smal J, Hennen G. The physiology of growth hormones (GHs) in pregnant women and partial characterization of the placental GH variant. JClinEndocrinolMetab. 1988;66(6):1171-80.
128. Fuglsang J, Ovesen P. Aspects of placental growth hormone physiology. Growth Horm IGF Res. 2006;16(2):67-85.
129. Lonberg U, Damm P, Andersson AM, Main KM, Chellakooty M, Lauenborg J, et al. Increase in maternal placental growth hormone during pregnancy and disappearance during parturition in normal and growth hormone-deficient pregnancies. Am J Obstet Gynecol. 2003;188(1):247-51.
75
130. Caufriez A, Frankenne F, Englert Y, Golstein J, Cantraine F, Hennen G, et al. Placental growth hormone as a potential regulator of maternal IGF-I during human pregnancy. Am J Physiol. 1990;258(6 Pt 1):E1014-E9.
131. Caufriez A, Frankenne F, Hennen G, Copinschi G. Regulation of maternal IGF-I by placental GH in normal and abnormal human pregnancies. Am J Physiol. 1993;265(4 Pt 1):E572-E7.
132. Mirlesse V, Frankenne F, Alsat E, Poncelet M, Hennen G, Evain-Brion D. Placental growth hormone levels in normal pregnancy and in pregnancies with intrauterine growth retardation. Pediatr Res. 1993;34(4):439-42.
133. Persechini ML, Gennero I, Grunenwald S, Vezzosi D, Bennet A, Caron P. Decreased IGF-1 concentration during the first trimester of pregnancy in women with normal somatotroph function. Pituitary. 2014.
134. Olausson H, Lof M, Brismar K, Lewitt M, Forsum E, Sohlstrom A. Longitudinal study of the maternal insulin-like growth factor system before, during and after pregnancy in relation to fetal and infant weight 17. HormRes. 2008;69(2):99-106.
135. Monaghan JM, Godber IM, Lawson N, Kaur M, Wark G, Teale D, et al. Longitudinal changes of insulin-like growth factors and their binding proteins throughout normal pregnancy. AnnClinBiochem. 2004;41(Pt 3):220-6.
136. Bruchim I, Werner H. Targeting IGF-1 signaling pathways in gynecologic malignancies. Expert opinion on therapeutic targets. 2013;17(3):307-20.
137. Renehan AG, Zwahlen M, Minder C, O'Dwyer ST, Shalet SM, Egger M. Insulin-like growth factor (IGF)-I, IGF binding protein-3, and cancer risk: systematic review and meta-regression analysis. Lancet. 2004;363(9418):1346-53.
138. Wang HS, Chard T. IGFs and IGF-binding proteins in the regulation of human ovarian and endometrial function. J Endocrinol. 1999;161(1):1-13.
139. Giudice LC. Growth factor action on ovarian function in polycystic ovary syndrome. EndocrinolMetab ClinNorth Am. 1999;28(2):325-39, vi.
140. Beauchamp MC, Yasmeen A, Knafo A, Gotlieb WH. Targeting insulin and insulin-like growth factor pathways in epithelial ovarian cancer. Journal of oncology. 2010;2010:257058.
141. Karasik A, Menczer J, Pariente C, Kanety H. Insulin-like growth factor-I (IGF-I) and IGF-binding protein-2 are increased in cyst fluids of epithelial ovarian cancer. J Clin EndocrinolMetab. 1994;78(2):271-6.
142. Huang YF, Cheng WF, Wu YP, Cheng YM, Hsu KF, Chou CY. Circulating IGF system and treatment outcome in epithelial ovarian cancer. Endocr Relat Cancer. 2014;21(2):217-29.
143. Lukanova A, Lundin E, Toniolo P, Micheli A, Akhmedkhanov A, Rinaldi S, et al. Circulating levels of insulin-like growth factor-I and risk of ovarian cancer. Int J Cancer. 2002;101(6):549-54.
144. Peeters PH, Lukanova A, Allen N, Berrino F, Key T, Dossus L, et al. Serum IGF-I, its major binding protein (IGFBP-3) and epithelial ovarian cancer risk: the European Prospective Investigation into Cancer and Nutrition (EPIC). EndocrRelat Cancer. 2007;14(1):81-90.
145. Ose J, Fortner RT, Schock H, Peeters PH, Onland-Moret NC, Bueno-de-Mesquita HB, et al. Insulin-like growth factor I and risk of epithelial invasive ovarian cancer by tumour characteristics: results from the EPIC cohort. Br J Cancer. 2014.
146. Tworoger SS, Lee IM, Buring JE, Pollak MN, Hankinson SE. Insulin-like growth factors and ovarian cancer risk: a nested case-control study in three cohorts. Cancer Epidemiology Biomarkers & Prevention. 2007;16(8):1691-5.
147. MacLaughlin DT, Donahoe PK. Mullerian inhibiting substance/anti-Mullerian hormone: a potential therapeutic agent for human ovarian and other cancers. FutureOncol. 2010;6(3):391-405.

76
148. Kelsey TW, Wright P, Nelson SM, Anderson RA, Wallace WH. A validated model of serum anti-mullerian hormone from conception to menopause. PLoSOne. 2011;6(7):e22024.
149. Weenen C, Laven JS, Von Bergh AR, Cranfield M, Groome NP, Visser JA, et al. Anti-Mullerian hormone expression pattern in the human ovary: potential implications for initial and cyclic follicle recruitment. MolHumReprod. 2004;10(2):77-83.
150. Lie Fong S, Visser JA, Welt CK, de Rijke YB, Eijkemans MJ, Broekmans FJ, et al. Serum anti-mullerian hormone levels in healthy females: a nomogram ranging from infancy to adulthood. JClinEndocrinolMetab. 2012;97(12):4650-5.
151. Nelson SM, Stewart F, Fleming R, Freeman DJ. Longitudinal assessment of antimullerian hormone during pregnancy-relationship with maternal adiposity, insulin, and adiponectin. FertilSteril. 2010;93(4):1356-8.
152. Lutterodt M, Byskov AG, Skouby SO, Tabor A, Yding AC. Anti-Mullerian hormone in pregnant women in relation to other hormones, fetal sex and in circulation of second trimester fetuses. ReprodBiomedOnline. 2009;18(5):694-9.
153. Dewailly D, Andersen CY, Balen A, Broekmans F, Dilaver N, Fanchin R, et al. The physiology and clinical utility of anti-Mullerian hormone in women. Hum Reprod Update. 2014;20(3):370-85.
154. Grynnerup AG, Lindhard A, Sorensen S. The role of anti-Mullerian hormone in female fertility and infertility - an overview. Acta ObstetGynecolScand. 2012;91(11):1252-60.
155. Teixeira J, Maheswaran S, Donahoe PK. Mullerian inhibiting substance: an instructive developmental hormone with diagnostic and possible therapeutic applications. EndocrRev. 2001;22(5):657-74.
156. Meirelles K, Benedict LA, Dombkowski D, Pepin D, Preffer FI, Teixeira J, et al. Human ovarian cancer stem/progenitor cells are stimulated by doxorubicin but inhibited by Mullerian inhibiting substance. ProcNatlAcadSciUSA. 2012;109(7):2358-63.
157. Chang HL, Pieretti-Vanmarcke R, Nicolaou F, Li X, Wei X, MacLaughlin DT, et al. Mullerian inhibiting substance inhibits invasion and migration of epithelial cancer cell lines. GynecolOncol. 2011;120(1):128-34.
158. Barker DJP. Mothers, Babies, and Health in Later Life: Churchill Livingstone; 1998.
159. Catov JM, Newman AB, Sutton-Tyrrell K, Harris TB, Tylavsky F, Visser M, et al. Parity and cardiovascular disease risk among older women: how do pregnancy complications mediate the association? Ann Epidemiol. 2008;18(12):873-9.
160. Anderson KN, Schwab RB, Martinez ME. Reproductive risk factors and breast cancer subtypes: a review of the literature. Breast Cancer Res Treat. 2014;144(1):1-10.
161. Dossus L, Allen N, Kaaks R, Bakken K, Lund E, Tjonneland A, et al. Reproductive risk factors and endometrial cancer: the European Prospective Investigation into Cancer and Nutrition. International Journal of Cancer. 2010;127(2):442-51.
162. Lukanova A, Surcel HM, Lundin E, Kaasila M, Lakso HA, Schock H, et al. Circulating estrogens and progesterone during primiparous pregnancies and risk of maternal breast cancer. Int J Cancer. 2012;130(4):910-20.
163. Whitaker-Azmitia PM, Lobel M, Moyer A. Low maternal progesterone may contribute to both obstetrical complications and autism. Medical hypotheses. 2014;82(3):313-8.
164. Grotmol T, Weiderpass E, Tretli S. Conditions in utero and cancer risk. Eur J Epidemiol. 2006;21(8):561-70.
165. Holl K, Lundin E, Surcel HM, Grankvist K, Koskela P, Dillner J, et al. Endogenous steroid hormone levels in early pregnancy and risk of testicular cancer in the offspring: a nested case-referent study. International Journal of Cancer. 2009;124(12):2923-8.
166. Beral V, Bull D, Doll R, Peto R, Reeves G. Breast cancer and abortion: collaborative reanalysis of data from 53 epidemiological studies, including 83 000 women with breast cancer from 16 countries. Lancet. 2004;363(9414):1007-16.
77
167. Pukkala E. Nordic Biological Specimen Bank Cohorts as Basis for Studies of Cancer Causes and Control: Quality Control Tools for Study Cohorts with More than Two Million Sample Donors and 130,000 Prospective Cancers. In: Dillner J, editor. Methods in Biobanking. Methods in Molecular Biology. 675: Humana Press; 2011. p. 61-112.
168. van Eijsden M, Vrijkotte TG, Gemke RJ, van der Wal MF. Cohort profile: the Amsterdam Born Children and their Development (ABCD) study. Int J Epidemiol. 2011;40(5):1176-86.
169. van Gelder MM, Bretveld RW, Roukema J, Steenhoek M, van Drongelen J, Spaanderman ME, et al. Rationale and design of the PRegnancy and Infant DEvelopment (PRIDE) Study. Paediatr Perinat Epidemiol. 2013;27(1):34-43.
170. Moraes TJ, Lefebvre DL, Chooniedass R, Becker AB, Brook JR, Denburg J, et al. The Canadian healthy infant longitudinal development birth cohort study: biological samples and biobanking. Paediatr Perinat Epidemiol. 2015;29(1):84-92.
171. Veyhe AS, Hansen S, Sandanger TM, Nieboer E, Odland J. The Northern Norway mother-and-child contaminant cohort study: implementation, population characteristics and summary of dietary findings. Int J Circumpolar Health. 2012;71:18644.
172. Kishi R, Sasaki S, Yoshioka E, Yuasa M, Sata F, Saijo Y, et al. Cohort profile: the Hokkaido study on environment and children's health in Japan. Int J Epidemiol. 2011;40(3):611-8.
173. Wright J, Small N, Raynor P, Tuffnell D, Bhopal R, Cameron N, et al. Cohort Profile: the Born in Bradford multi-ethnic family cohort study. Int J Epidemiol. 2013;42(4):978-91.
174. Soh SE, Tint MT, Gluckman PD, Godfrey KM, Rifkin-Graboi A, Chan YH, et al. Cohort profile: Growing Up in Singapore Towards healthy Outcomes (GUSTO) birth cohort study. Int J Epidemiol. 2014;43(5):1401-9.
175. Guxens M, Ballester F, Espada M, Fernández MF, Grimalt JO, Ibarluzea J, et al. Cohort Profile: the INMA--INfancia y Medio Ambiente--(Environment and Childhood) Project. Int J Epidemiol. 2012;41(4):930-40.
176. Jaddoe VW, van Duijn CM, Franco OH, van der Heijden AJ, van Iizendoorn MH, de Jongste JC, et al. The Generation R Study: design and cohort update 2012. Eur J Epidemiol. 2012;27(9):739-56.
177. Andersen AM, Olsen J. The Danish National Birth Cohort: selected scientific contributions within perinatal epidemiology and future perspectives. Scand J Public Health. 2011;39(7 Suppl):115-20.
178. Tao FB, Hao JH, Huang K, Su PY, Cheng DJ, Xing XY, et al. Cohort Profile: the China-Anhui Birth Cohort Study. Int J Epidemiol. 2013;42(3):709-21.
179. Lappalainen M, Koskela P, Hedman K, Teramo K, Ammala P, Hiilesmaa V, et al. Incidence of primary toxoplasma infections during pregnancy in southern Finland: a prospective cohort study. ScandJInfectDis. 1992;24(1):97-104.
180. Bernstein L, Lipworth L, Ross RK, Trichopoulos D. Correlation of estrogen levels between successive pregnancies. American Journal of Epidemiology. 1995;142(6):625-8.
181. The Northern Sweden Maternity Cohort - Umeå University, Sweden 2014 [accessed 24.02.2015]. Available from: http://www.biobank.umu.se/biobank/biobank---for-researchers/biobank-research---withdrawal/biobank-research---maternity/.
182. Finnish Maternity Cohort (FMC) serum bank - THL 2014 [accessed 24.02.2015]. Available from: http://www.thl.fi/fi/web/thlfi-en/research-and-expertwork/projects-and-programmes/finnish-maternity-cohort-fmc-serum-bank.
183. Lukanova A, Andersson R, Wulff M, Zeleniuch-Jacquotte A, Grankvist K, Dossus L, et al. Human chorionic gonadotropin and alpha-fetoprotein concentrations in pregnancy and maternal risk of breast cancer: a nested case-control study. American Journal of Epidemiology. 2008;168(11):1284-91.

78
184. Teppo L, Pukkala E, Lehtonen M. Data quality and quality control of a population-based cancer registry. Experience in Finland. Acta Oncol. 1994;33(4):365-9.
185. Barlow L, Westergren K, Holmberg L, Talback M. The completeness of the Swedish Cancer Register: a sample survey for year 1998. Acta Oncol. 2009;48(1):27-33.
186. Lee KR, Tavassoli FA, Prat J, Dietel M, Gersell DJ, Karseladze AI, et al. Tumors of the ovary and peritoneum. In: Tavassoli FA, Devilee P, editors. Pathology and Genetics Tumours of the Breast and Female Genital Organs. World Health Organization Classification of Tumours. 1. Lyon: IARC Press; 2003. p. 113-202.
187. Källén B, Källén K. The Swedish Medical Birth Register - A Summary of Content and Quality 2003 [accessed 25.02.2015]. Available from: http://www.socialstyrelsen.se/publikationer2003/2003-112-3.
188. Whitehead A, Whitehead J. A general parametric approach to the meta-analysis of randomized clinical trials. StatMed. 1991;10(11):1665-77.
189. Lehmann EL. Nonparametrics: Statistical methods based on ranks. New York: Springer; 1998.
190. Vittinghoff E, Glidden DV, Shiboski SC, McCulloch CE. Linear Regression. Regression Methods in Biostatistics. Statistics for Biology and Health. 1st ed: Springer Science+Business Media, Inc.; 2005. p. 69-131.
191. Lukanova A, Toniolo P, Akhmedkhanov A, Hunt K, Rinaldi S, Zeleniuch-Jacquotte A, et al. A cross-sectional study of IGF-I determinants in women. Eur J Cancer Prev. 2001;10(5):443-52.
192. Blackmore KM, Wong J, Knight JA. A cross-sectional study of different patterns of oral contraceptive use among premenopausal women and circulating IGF-1: implications for disease risk. BMC Womens Health. 2011;11:15.
193. Leung KC, Johannsson G, Leong GM, Ho KK. Estrogen regulation of growth hormone action. Endocr Rev. 2004;25(5):693-721.
194. Dolleman M, Verschuren WM, Eijkemans MJ, Dolle ME, Jansen EH, Broekmans FJ, et al. Reproductive and lifestyle determinants of anti-Mullerian hormone in a large population-based study. JClinEndocrinolMetab. 2013;98(5):2106-15.
195. Mall-Haefeli M, Werner-Zodrow I, Huber PR, Darragh A, Lambe R. Effects of various combined oral contraceptives on sex steroids, gonadotropins and SHBG. IrMedJ. 1983;76(6):266-72.
196. van den Berg MH, van Dulmen-den Broeder E, Overbeek A, Twisk JW, Schats R, van Leeuwen FE, et al. Comparison of ovarian function markers in users of hormonal contraceptives during the hormone-free interval and subsequent natural early follicular phases. Hum Reprod. 2010;25(6):1520-7.
197. Holl K, Lundin E, Kaasila M, Grankvist K, Afanasyeva Y, Hallmans G, et al. Effect of long-term storage on hormone measurements in samples from pregnant women: The experience of the Finnish Maternity Cohort. Acta Oncol. 2008;47(3):406-12.
198. van Rooij IA, Broekmans FJ, Scheffer GJ, Looman CW, Habbema JD, de Jong FH, et al. Serum antimullerian hormone levels best reflect the reproductive decline with age in normal women with proven fertility: a longitudinal study. FertilSteril. 2005;83(4):979-87.
199. Fanchin R, Taieb J, Lozano DH, Ducot B, Frydman R, Bouyer J. High reproducibility of serum anti-Mullerian hormone measurements suggests a multi-staged follicular secretion and strengthens its role in the assessment of ovarian follicular status. Human Reproduction. 2005;20(4):923-7.
200. Dorgan JF, Spittle CS, Egleston BL, Shaw CM, Kahle LL, Brinton LA. Assay reproducibility and within-person variation of Mullerian inhibiting substance. FertilSteril. 2010;94(1):301-4.
79
201. Missmer SA, Spiegelman D, Bertone-Johnson ER, Barbieri RL, Pollak MN, Hankinson SE. Reproducibility of plasma steroid hormones, prolactin, and insulin-like growth factor levels among premenopausal women over a 2- to 3-year period. Cancer EpidemiolBiomarkers Prev. 2006;15(5):972-8.
202. Cleveland WS, Loader C. Smoothing by Local Regression: Principles and Methods. In: H„rdle W, Schimek MG, editors. Statistical Theory and Computational Aspects of Smoothing. Heidelberg: Physica-Verlag; 1996. p. 10-49.
203. Roza SJ, Verhulst FC, Jaddoe VW, Steegers EA, Mackenbach JP, Hofman A, et al. Maternal smoking during pregnancy and child behaviour problems: the Generation R Study. Int J Epidemiol. 2009;38(3):680-9.
204. De Wilde KS, Trommelmans LC, Laevens HH, Maes LR, Temmerman M, Boudrez HL. Smoking patterns, depression, and sociodemographic variables among Flemish women during pregnancy and the postpartum period. Nursing research. 2013;62(6):394-404.
205. Chen VW, Ruiz B, Killeen JL, Cote TR, Wu XC, Correa CN. Pathology and classification of ovarian tumors. Cancer. 2003;97(10 Suppl):2631-42.
206. Kurman RJ, Shih I. Molecular pathogenesis and extraovarian origin of epithelial ovarian cancer--shifting the paradigm. HumPathol. 2011;42(7):918-31.
207. Lim D, Oliva E. Precursors and pathogenesis of ovarian carcinoma. Pathology. 2013;45(3):229-42.
208. Merritt MA, Cramer DW. Molecular pathogenesis of endometrial and ovarian cancer. Cancer biomarkers : section A of Disease markers. 2010;9(1-6):287-305.
209. Perry JK, Emerald BS, Mertani HC, Lobie PE. The oncogenic potential of growth hormone. Growth Horm IGF Res. 2006;16(5-6):277-89.
210. Jenkins PJ. Acromegaly and cancer. HormRes. 2004;62 Suppl 1:108-15.
211. Guevara-Aguirre J, Balasubramanian P, Guevara-Aguirre M, Wei M, Madia F, Cheng CW, et al. Growth hormone receptor deficiency is associated with a major reduction in pro-aging signaling, cancer, and diabetes in humans. Science translational medicine. 2011;3(70):70ra13.
212. Papadia A, Schally AV, Halmos G, Varga JL, Seitz S, Buchholz S, et al. Growth hormone-releasing hormone antagonists inhibit growth of human ovarian cancer. Horm Metab Res. 2011;43(11):816-20.
213. Klukovits A, Schally AV, Szalontay L, Vidaurre I, Papadia A, Zarandi M, et al. Novel antagonists of growth hormone-releasing hormone inhibit growth and vascularization of human experimental ovarian cancers. Cancer. 2012;118(3):670-80.
214. Khandwala HM, McCutcheon IE, Flyvbjerg A, Friend KE. The effects of insulin-like growth factors on tumorigenesis and neoplastic growth. EndocrRev. 2000;21(3):215-44.
215. Brokaw J, Katsaros D, Wiley A, Lu L, Su D, Sochirca O, et al. IGF-I in epithelial ovarian cancer and its role in disease progression. Growth factors. 2007;25(5):346-54.
216. Smith ER, Xu XX. Ovarian ageing, follicle depletion, and cancer: a hypothesis for the aetiology of epithelial ovarian cancer involving follicle depletion. Lancet Oncol. 2008;9(11):1108-11.
217. Durlinger AL, Visser JA, Themmen AP. Regulation of ovarian function: the role of anti-Mullerian hormone. Reproduction. 2002;124(5):601-9.
218. Visser JA, Durlinger AL, Peters IJ, van den Heuvel ER, Rose UM, Kramer P, et al. Increased oocyte degeneration and follicular atresia during the estrous cycle in anti-Mullerian hormone null mice. Endocrinology. 2007;148(5):2301-8.
219. Mendez C, Morales-Vasquez F, Perez-Montiel D, Gomora MJ, Espinola-Zetina C, Hernandez-Martinez A, et al. Estrogen and androgen receptor expression in surface epithelium and inclusion cyst in the ovary of premenopausal and postmenopausal women. J Ovarian Res. 2013;6(1):85.
80
220. Nodin B, Zendehrokh N, Brandstedt J, Nilsson E, Manjer J, Brennan DJ, et al. Increased androgen receptor expression in serous carcinoma of the ovary is associated with an improved survival. JOvarianRes. 2010;3:14. doi: 10.1186/1757-2215-3-14.:14-3.
221. Lee P, Rosen DG, Zhu C, Silva EG, Liu J. Expression of progesterone receptor is a favorable prognostic marker in ovarian cancer. GynecolOncol. 2005;96(3):671-7.
222. Hogdall EV, Christensen L, Hogdall CK, Blaakaer J, Gayther S, Jacobs IJ, et al. Prognostic value of estrogen receptor and progesterone receptor tumor expression in Danish ovarian cancer patients: from the 'MALOVA' ovarian cancer study. OncolRep. 2007;18(5):1051-9.
223. Bakkum-Gamez JN, Aletti G, Lewis KA, Keeney GL, Thomas BM, Navarro-Teulon I, et al. Mullerian inhibiting substance type II receptor (MISIIR): a novel, tissue-specific target expressed by gynecologic cancers. GynecolOncol. 2008;108(1):141-8.
224. Song JY, Chen KY, Kim SY, Kim MR, Ryu KS, Cha JH, et al. The expression of Mullerian inhibiting substance/anti-Mullerian hormone type II receptor protein and mRNA in benign, borderline and malignant ovarian neoplasia. IntJOncol. 2009;34(6):1583-91.
225. An Y, Cai L, Wang Y, Zhu D, Guan Y, Zheng J. Local expression of insulin-like growth factor-I, insulin-like growth factor-I receptor, and estrogen receptor alpha in ovarian cancer. Onkologie. 2009;32(11):638-44.
226. Hecht JL, Kotsopoulos J, Hankinson SE, Tworoger SS. Relationship between epidemiologic risk factors and hormone receptor expression in ovarian cancer: results from the Nurses' Health Study. Cancer EpidemiolBiomarkers Prev. 2009;18(5):1624-30.
227. Sieh W, Kobel M, Longacre TA, Bowtell DD, deFazio A, Goodman MT, et al. Hormone-receptor expression and ovarian cancer survival: an Ovarian Tumor Tissue Analysis consortium study. Lancet Oncol. 2013;14(9):853-62.
228. Drummond AE, Fuller PJ. The importance of ERbeta signalling in the ovary. J Endocrinol. 2010;205(1):15-23.
229. Chan KK, Wei N, Liu SS, Xiao-Yun L, Cheung AN, Ngan HY. Estrogen receptor subtypes in ovarian cancer: a clinical correlation. Obstet Gynecol. 2008;111(1):144-51.
230. Hu Z, Zhu L, Tan M, Cai M, Deng L, Yu G, et al. The expression and correlation between the transcription factor FOXP1 and estrogen receptors in epithelial ovarian cancer. Biochimie. 2015;109:42-8.
231. Li AJ, Baldwin RL, Karlan BY. Estrogen and progesterone receptor subtype expression in normal and malignant ovarian epithelial cell cultures. Am J Obstet Gynecol. 2003;189(1):22-7.
232. Lau KM, Mok SC, Ho SM. Expression of human estrogen receptor-alpha and -beta, progesterone receptor, and androgen receptor mRNA in normal and malignant ovarian epithelial cells. Proc Natl Acad Sci U S A. 1999;96(10):5722-7.
233. Aust S, Horak P, Pils D, Pils S, Grimm C, Horvat R, et al. The prognostic value of estrogen receptor beta and proline-, glutamic acid- and leucine-rich protein 1 (PELP1) expression in ovarian cancer. BMC cancer. 2013;13:115.
234. Weigang B, Nap M, Bittl A, Jaeger W. Immunohistochemical localization of insulin-like growth factor 1 receptors in benign and malignant tissues of the female genital tract. Tumour biology : the journal of the International Society for Oncodevelopmental Biology and Medicine. 1994;15(4):236-46.
235. Gest C, Mirshahi P, Li H, Pritchard LL, Joimel U, Blot E, et al. Ovarian cancer: Stat3, RhoA and IGF-IR as therapeutic targets. Cancer Lett. 2012;317(2):207-17.
236. Chan KK, Leung TH, Chan DW, Wei N, Lau GT, Liu SS, et al. Targeting estrogen receptor subtypes (ERα and ERβ) with selective ER modulators in ovarian cancer. J Endocrinol. 2014;221(2):325-36.
237. Masiakos PT, MacLaughlin DT, Maheswaran S, Teixeira J, Fuller AF, Jr., Shah PC, et al. Human ovarian cancer, cell lines, and primary ascites cells express the human Mullerian
81
inhibiting substance (MIS) type II receptor, bind, and are responsive to MIS. Clin Cancer Res. 1999;5(11):3488-99.
238. Bossard C, Busson M, Vindrieux D, Gaudin F, Machelon V, Brigitte M, et al. Potential role of estrogen receptor beta as a tumor suppressor of epithelial ovarian cancer. PloS one. 2012;7(9):e44787.
239. Kerlan V, Nahoul K, Le Martelot MT, Bercovici JP. Longitudinal study of maternal plasma bioavailable testosterone and androstanediol glucuronide levels during pregnancy. ClinEndocrinol(Oxf). 1994;40(2):263-7.
240. Arslan AA, Zeleniuch-Jacquotte A, Lukanova A, Afanasyeva Y, Katz J, Levitz M, et al. Effects of parity on pregnancy hormonal profiles across ethnic groups with a diverse incidence of breast cancer. Cancer EpidemiolBiomarkers Prev. 2006;15(11):2123-30.
241. Wuu J, Hellerstein S, Lipworth L, Wide L, Xu B, Yu GP, et al. Correlates of pregnancy oestrogen, progesterone and sex hormone-binding globulin in the USA and China. Eur J Cancer Prev. 2002;11(3):283-93.
242. Toriola AT, Vaarasmaki M, Lehtinen M, Zeleniuch-Jacquotte A, Lundin E, Rodgers KG, et al. Determinants of Maternal Sex Steroids During the First Half of Pregnancy. ObstetGynecol. 2011;118(5):1029-36.
243. Järvelä IY, Záčková T, Laitinen P, Ryynänen M, Tekay A. Effect of parity and fetal sex on placental and luteal hormones during early first trimester. Prenat Diagn. 2012;32(2):160-7.
244. Troisi R, Hoover RN, Thadhani R, Hsieh CC, Sluss P, Ballard-Barbash R, et al. Maternal, prenatal and perinatal characteristics and first trimester maternal serum hormone concentrations. Br J Cancer. 2008;99(7):1161-4.
245. Bernstein L, Depue RH, Ross RK, Judd HL, Pike MC, Henderson BE. Higher maternal levels of free estradiol in first compared to second pregnancy: early gestational differences. J Natl Cancer Inst. 1986;76(6):1035-9.
246. Musey VC, Collins DC, Brogan DR, Santos VR, Musey PI, Martino-Saltzman D, et al. Long term effects of a first pregnancy on the hormonal environment: estrogens and androgens. The Journal of clinical endocrinology and metabolism. 1987;64(1):111-8.
247. Soldin OP, Makambi KH, Soldin SJ, O'Mara DM. Steroid hormone levels associated with passive and active smoking. Steroids. 2011;76(7):653-9.
248. Duskova M, Simunkova K, Hill M, Velikova M, Kubatova J, Kancheva L, et al. Chronic cigarette smoking alters circulating sex hormones and neuroactive steroids in premenopausal women. Physiological research / Academia Scientiarum Bohemoslovaca. 2012;61(1):97-111.
249. Whitcomb BW, Bodach SD, Mumford SL, Perkins NJ, Trevisan M, Wactawski-Wende J, et al. Ovarian function and cigarette smoking. Paediatr Perinat Epidemiol. 2010;24(5):433-40.
250. Kuijper EA, Ket JC, Caanen MR, Lambalk CB. Reproductive hormone concentrations in pregnancy and neonates: a systematic review. Reprod Biomed Online. 2013;27(1):33-63.
251. Enninga EA, Nevala WK, Creedon DJ, Markovic SN, Holtan SG. Fetal sex-based differences in maternal hormones, angiogenic factors, and immune mediators during pregnancy and the postpartum period. American journal of reproductive immunology. 2015;73(3):251-62.
252. De Abreu FB, Schwartz GN, Wells WA, Tsongalis GJ. Personalized therapy for breast cancer. Clin Genet. 2014;86(1):62-7.
253. Pfeiffer RM, Park Y, Kreimer AR, Lacey JV, Pee D, Greenlee RT, et al. Risk prediction for breast, endometrial, and ovarian cancer in white women aged 50 y or older: derivation and validation from population-based cohort studies. PLoS Med. 2013;10(7):e1001492.

82
254. Li K, Husing A, Fortner RT, Tjonneland A, Hansen L, Dossus L, et al. An epidemiologic risk prediction model for ovarian cancer in Europe: the EPIC study. Br J Cancer. 2015.