hood tech blade vibration monitoring capabilities … of blade vibration monitoring * capabilities...
TRANSCRIPT

3100 Cascade Avenue T: 541.387.2288 WWW.HOODTECH.COM Hood River, OR 97031 F: 541.387.2266 Page 1/21
Overview of Blade Vibration Monitoring*
Capabilities
24 June 2011
Hood Technology Corporation
3100 Cascade Avenue
Hood River, OR USA
541.386.7660 (voice)
541.387.2266 (fax)
www.hoodtech.com
* Also referred to as Blade Tip Timing (BTT), Non-intrusive Stress Measurement System (NSMS)
21
3100 Cascade Avenue T: 541.387.2288 WWW.HOODTECH.COM Hood River, OR 97031 F: 541.387.2266 Page 2/21
1. General Blade Vibration Monitoring† refers to measurements made on rotating machinery using sensors that do not make contact with the rotor blades. A BVM system has a number of advantages over the traditional turbomachinery measurement method of strain gages: data is obtained and separated for every blade in the stage, and the instrumentation is non-contacting which means that it can be replaced, if necessary, without stopping the machine. Hood Technology has been designing and building blade tip timing systems since 1999 and has supported more than 200 tests from 5cm diameter turbochargers to 4m diameter steam turbines.
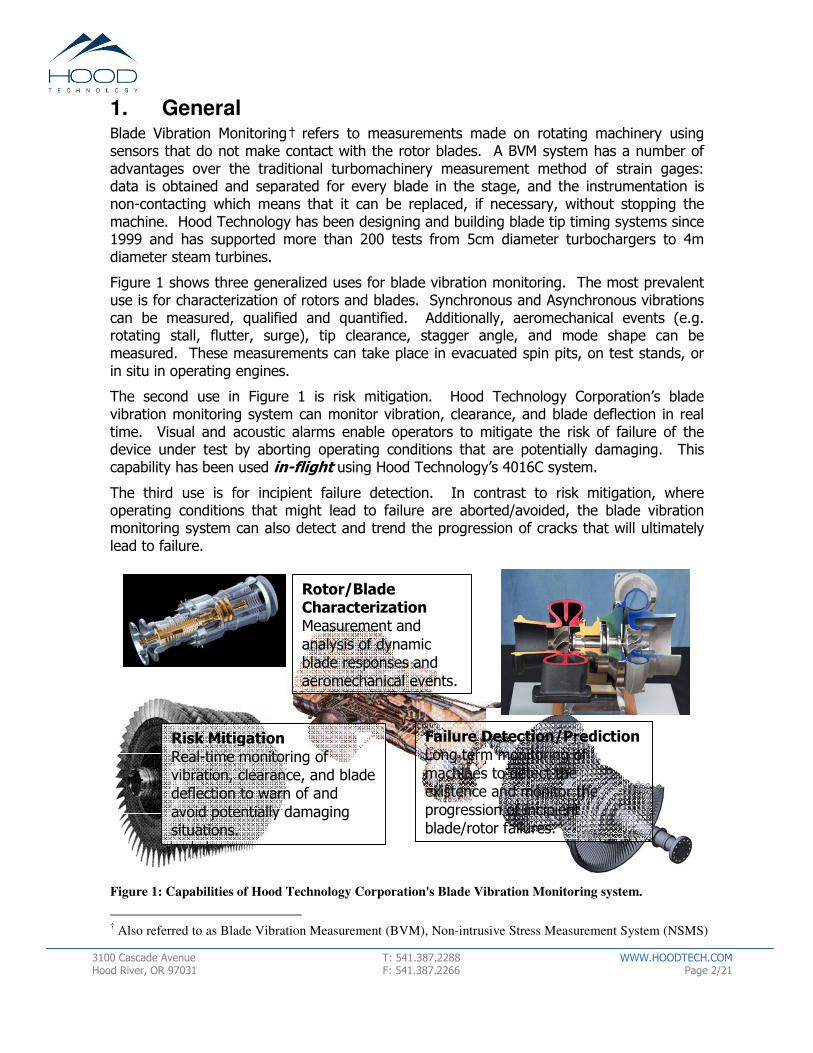
Figure 1 shows three generalized uses for blade vibration monitoring. The most prevalent use is for characterization of rotors and blades. Synchronous and Asynchronous vibrations can be measured, qualified and quantified. Additionally, aeromechanical events (e.g. rotating stall, flutter, surge), tip clearance, stagger angle, and mode shape can be measured. These measurements can take place in evacuated spin pits, on test stands, or in situ in operating engines.
The second use in Figure 1 is risk mitigation. Hood Technology Corporation’s blade vibration monitoring system can monitor vibration, clearance, and blade deflection in real time. Visual and acoustic alarms enable operators to mitigate the risk of failure of the device under test by aborting operating conditions that are potentially damaging. This capability has been used in-flight using Hood Technology’s 4016C system.
The third use is for incipient failure detection. In contrast to risk mitigation, where operating conditions that might lead to failure are aborted/avoided, the blade vibration monitoring system can also detect and trend the progression of cracks that will ultimately lead to failure.
Rotor/Blade Characterization Measurement and
analysis of dynamic blade responses and aeromechanical events.
Risk Mitigation
Real-time monitoring of vibration, clearance, and blade deflection to warn of and
avoid potentially damaging situations.
Failure Detection/Prediction Long term monitoring of
machines to detect the existence and monitor the progression of incipient blade/rotor failures.
Figure 1: Capabilities of Hood Technology Corporation's Blade Vibration Monitoring system.
† Also referred to as Blade Vibration Measurement (BVM), Non-intrusive Stress Measurement System (NSMS)

21
3100 Cascade Avenue T: 541.387.2288 WWW.HOODTECH.COM Hood River, OR 97031 F: 541.387.2266 Page 3/21
1.1. Range of Experience
Hood-Tech has executed over 200 tests covering the following range of operational parameters:
Gas Temp: -40 to 1050C
Rotor Speed: up to 200,000 rpm
Rim Speed: up to 800 m/sec
Diameter: 5 cm to 4 m
Deflections: 3 µm to 5cm
Blade count: up to 1.5 million blades/sec aggregate‡
Multi-spool: yes
Channel count: up to 30 channels per data system
These tests have been executed in vacuum spin chambers, gas turbines, steam turbines, turbochargers, and axial gas compressors.
2. Overview of System Components The components of Hood Technology’s blade vibration monitoring system are shown in Figure 2. Sensors generate analog pulses each time a blade passes in front of them. A remotely-powered preamplifier is located near the rotor under test and connects to the sensors. For optical sensors, a laser and photodiode are contained in the preamplifier. The preamplifier receives power and sends buffered signals through a long cable to Hood Technology’s Blade Vibration Sensor Interface (BVSI) unit. In addition to providing the preamplifier with power, the BVSI also triggers on each blade pulse, creating a digital signal, which is precisely timed.
The data console operates Hood Technology Corporation’s Acquire Blade Data software. This software allows the user to easily configure the conditioning and triggering parameters of each sensor signal, configure the software to view blade vibration, clearance, and blade stagger and set visual and acoustic alarms.
For more detailed off-line analysis and report generation, Analyze Blade Vibration software can be used. It is also possible to monitor tests remotely via the internet.
‡ Number of channels multiplied by number of blades multiplied by rotor speed.

21
3100 Cascade Avenue T: 541.387.2288 WWW.HOODTECH.COM Hood River, OR 97031 F: 541.387.2266 Page 4/21
Data System
Proprietary Software:
• Acquire Blade Data
• Analyze Blade Vibration
• Monitor
Optional Remote Connection
Sensor Cabling (Typically 3 to 10meters)
Preamplifier to Data System DB-9 Cabling
(Typically 35-150 meters)
Preamplifier
Rotor
Sensor
Blade Vibration Monitoring System Components (BVM 8030)
Figure 2: Blade Vibration Monitoring System Components. Pictured is the system for 30 channels of
data, all contained in a housing measuring 650mmX900mmX1100mm.
2.1. Sensors
Blade monitoring begins with sensors. Sensors for blade tip timing can be built upon various principles of operation. Hood Technology Corporation principally recommends two types: passive eddy current§ and optical. Selection of sensor type, number and location is determined by environmental and physical constraints as well as test goals. Standard-sized sensors can be integrated by the customer into their test setup. Alternatively, Hood Technology Corporation’s engineers often work with the customer to customize the sensor housing to accommodate specific installation needs.
2.1.1 Fiber-Optic Sensors; Unlensed
Hood Tech builds optical sensors in a range of sizes and temperature capabilities. The most common sensor size of this type built by Hood Technology Corporation is shown in Figure 3. It is designed to connect to Hood Technology’s optical sensor pre-amp (BV-OP). Laser light is emitted from the center fiber, reflects off each passing blade, and the reflected light travels back to a photodiode through the outer six fibers. Reliable signal can be achieved with sensor standoff distances up to 10mm.
§ Also called Variable Reluctance Probe or Magnetic Probe.

21
3100 Cascade Avenue T: 541.387.2288 WWW.HOODTECH.COM Hood River, OR 97031 F: 541.387.2266 Page 5/21
Temperature limitations of the sensors are dictated by the optic fibers. Using high-temperature fibers, temperatures of up to 650C can be tolerated. With a small cooling manifold, air-cooled optical sensors have been used to 1100C.
Figure 3: Standard 7-fiber optical probe. Can be used uncooled with gas temperatures up to 650C.
With air-cooling of the sensor housing, these sensors have been used to 1100C.
Another type of unlensed optical sensor is the Skewed Dual Light Probe (SDLP), shown in Figure 4. This sensor consists of two seven-fiber probes mounted in the same housing at a skew angle with respect to one another. This creates a sensor pair, whose time-of-flight is a linear function of the distance between the sensor and the passing blade. In other words, this sensors measures the clearance of each blade as well as the time-of-arrival. SDLP’s have the same temperature limitations (up to 650C uncooled).

21
3100 Cascade Avenue T: 541.387.2288 WWW.HOODTECH.COM Hood River, OR 97031 F: 541.387.2266 Page 6/21
Figure 4: Skewed Dual Light Probe (SDLP) measures clearance as well as blade time-of-arrival. Can be
used with gas temperatures up to 650C. With air-cooling of the sensor housing, this upper temperature
limit can be increased to 1100C.
21
3100 Cascade Avenue T: 541.387.2288 WWW.HOODTECH.COM Hood River, OR 97031 F: 541.387.2266 Page 7/21
2.1.2 Fiber-Optic Sensors; Lensed
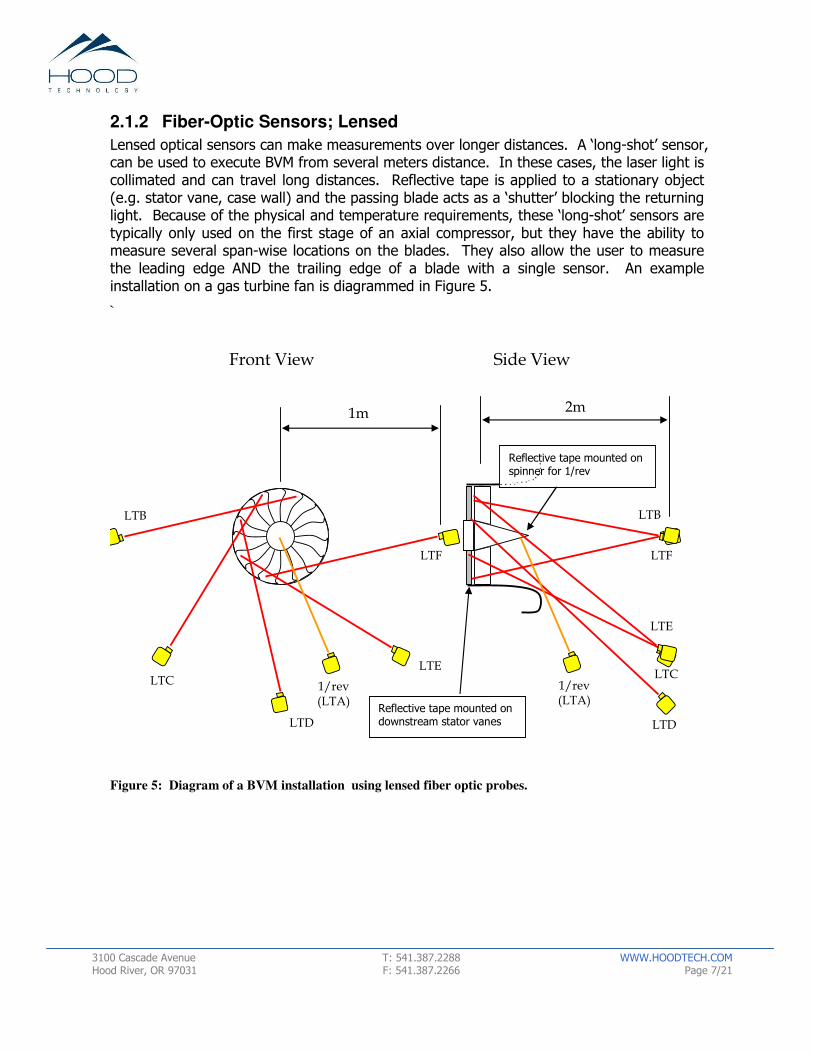
Lensed optical sensors can make measurements over longer distances. A ‘long-shot’ sensor, can be used to execute BVM from several meters distance. In these cases, the laser light is collimated and can travel long distances. Reflective tape is applied to a stationary object (e.g. stator vane, case wall) and the passing blade acts as a ‘shutter’ blocking the returning light. Because of the physical and temperature requirements, these ‘long-shot’ sensors are typically only used on the first stage of an axial compressor, but they have the ability to measure several span-wise locations on the blades. They also allow the user to measure the leading edge AND the trailing edge of a blade with a single sensor. An example installation on a gas turbine fan is diagrammed in Figure 5.
`
2m 1m
Front View Side View
1/rev (LTA)
LTB
LTC
LTD
LTE
LTF
LTD
LTE
LTC
LTB
LTF
Reflective tape mounted on downstream stator vanes
Reflective tape mounted on spinner for 1/rev
1/rev (LTA)
Figure 5: Diagram of a BVM installation using lensed fiber optic probes.

21
3100 Cascade Avenue T: 541.387.2288 WWW.HOODTECH.COM Hood River, OR 97031 F: 541.387.2266 Page 8/21
An alternative “shutter” implementation of optical sensors has been employed on interior stages in gas turbine engines, where the sensor is split into an optical “sender” and an optical “receiver,” arranged so that the blade passes between them. The passing blade again acts as a shutter, interrupting the optical beam. Again, both arriving edge and departing edge of the blade can be measured (see Figure 6)
Figure 6: An example of an implementation of a hot shutter sensor.
21
3100 Cascade Avenue T: 541.387.2288 WWW.HOODTECH.COM Hood River, OR 97031 F: 541.387.2266 Page 9/21
2.1.3 Eddy Current Sensors, Uncooled
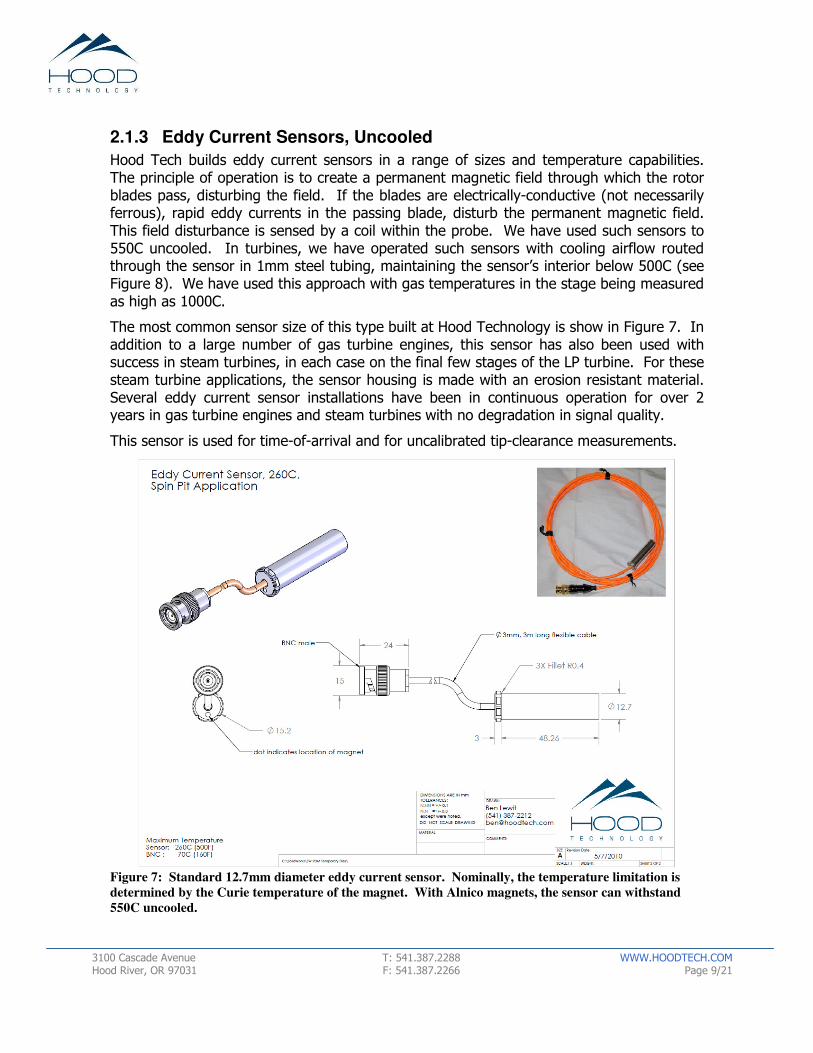
Hood Tech builds eddy current sensors in a range of sizes and temperature capabilities. The principle of operation is to create a permanent magnetic field through which the rotor blades pass, disturbing the field. If the blades are electrically-conductive (not necessarily ferrous), rapid eddy currents in the passing blade, disturb the permanent magnetic field. This field disturbance is sensed by a coil within the probe. We have used such sensors to 550C uncooled. In turbines, we have operated such sensors with cooling airflow routed through the sensor in 1mm steel tubing, maintaining the sensor’s interior below 500C (see Figure 8). We have used this approach with gas temperatures in the stage being measured as high as 1000C.
The most common sensor size of this type built at Hood Technology is show in Figure 7. In addition to a large number of gas turbine engines, this sensor has also been used with success in steam turbines, in each case on the final few stages of the LP turbine. For these steam turbine applications, the sensor housing is made with an erosion resistant material. Several eddy current sensor installations have been in continuous operation for over 2 years in gas turbine engines and steam turbines with no degradation in signal quality.
This sensor is used for time-of-arrival and for uncalibrated tip-clearance measurements.
Figure 7: Standard 12.7mm diameter eddy current sensor. Nominally, the temperature limitation is
determined by the Curie temperature of the magnet. With Alnico magnets, the sensor can withstand
550C uncooled.

21
3100 Cascade Avenue T: 541.387.2288 WWW.HOODTECH.COM Hood River, OR 97031 F: 541.387.2266 Page 10/21
2.1.4 Eddy Current Sensors, Cooled
In turbines, we have operated such sensors with cooling airflow routed through the sensor in 1mm steel tubing, maintaining the sensor’s interior below 500C (see Figure 8). We have used this approach with gas temperatures as high as 1000C.
Figure 8: By adding cooling air to the sensor housing the eddy current sensor can be made to withstand
gas temperatures up to 1000C. With these high temperature sensors, a thermocouple is integrated into
the sensor housing.
2.1.5 Third Party Sensors
Hood Tech has used third-party sensors on many occasions:
• GDAIS eddy current sensors: Hood Tech has built custom interface amplifiers for the differential signals and connectors specific to GDAIS’ sensor interface unit (The SIU.) These interface amplifiers were embedded into the four 12-channel data consoles delivered to P&W in 2007.
• Qinetiq eddy current sensors
• Capacitec capacitive sensors

21
3100 Cascade Avenue T: 541.387.2288 WWW.HOODTECH.COM Hood River, OR 97031 F: 541.387.2266 Page 11/21
• BICC/Thermoheat capacitive sensors
• Thermocoax capacitive sensors with Fogale preamps.
• Aerodyne capacitive sensors
• Hamilton Sundstrand microwave sensors
• Polish Air Force Institute of Technology microwave sensors
• RadaTec/Vibrometer microwave sensors
• P&W optical sensors
• GE optical sensors
Hood Tech’s data console has the front-end flexibility to accommodate any of these sensors as well as others not enumerated here.
2.2. Preamplification
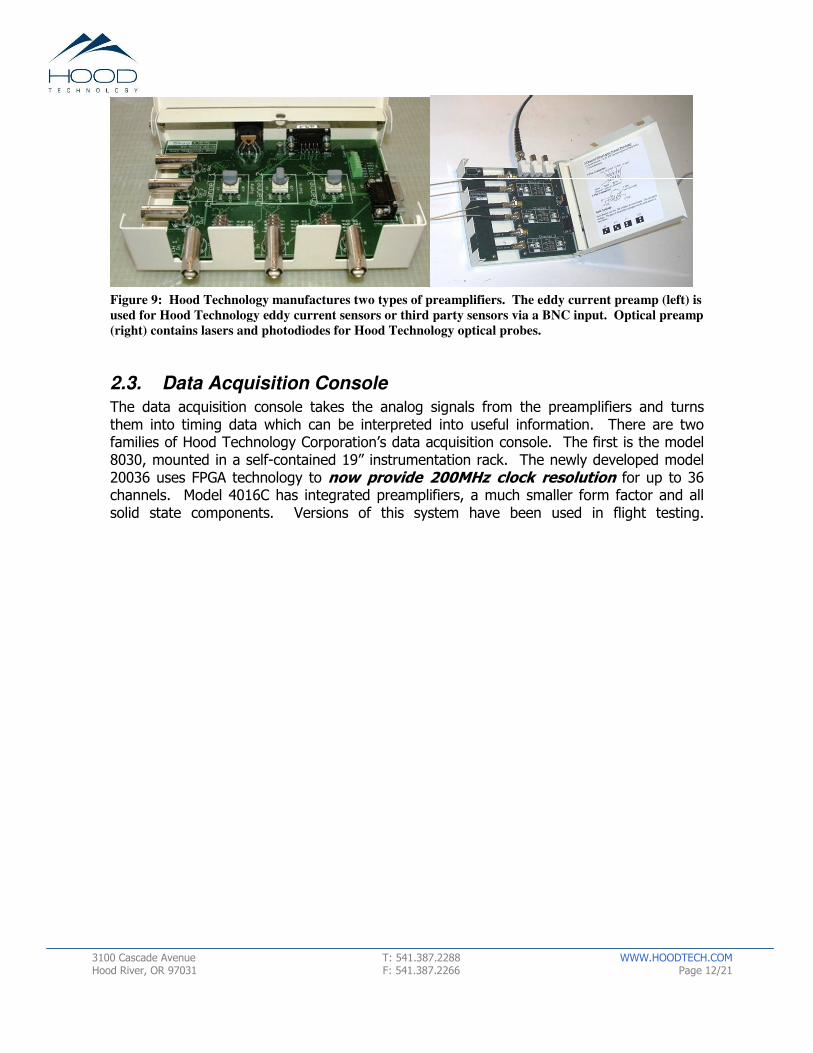
Hood Tech manufactures preamps of two types; optical (BV-OP) and eddy current (BV-IND), both shown in Figure 9. Each preamp supports three sensors. Each preamp is about the size of a paper-back book and is powered by its own data cable (no power is required near the device under test.). It should be noted that the preamplifiers are only required when using model 8030 data acquisition console. The preamplifiers are integrated into model 4016C. This is described in more detail in Section 2.3.
2.2.1 Eddy Current Preamp (BV-IND)
The Hood Technology Corp. 3-channel eddy current preamplifier has three identical channels, each of which implements preamplification for any Hood Tech eddy current sensor. The preamp is powered by the data console through a 9-pin sub-D cable. Each channel has an easily adjustable gain up to 100X and an optional attenuator for occasions when the input signal is too large. The buffered output can drive cables(at least 150m) without signal degradation. It can also act as a signal repeater for longer spans of cabling to the data console.
2.2.2 Optical Preamp (BV-OP)
The Hood Technology Corp. 3-channel optical preamplifier has three identical channels, each of which has a 40 mW, 658nm class IIIb laser source and a photodetector. It is used with light probes built by Hood Technology Corporation using ST optical connectors. The preamp is powered by the data console through a 9-pin sub-D cable. The detector electronics have user selectable gains and filter settings. The buffered output can drive long cables (at least 80m) to the data console. The physical shape of the preamplifier mitigates the possibility of accidental laser exposure.
21
3100 Cascade Avenue T: 541.387.2288 WWW.HOODTECH.COM Hood River, OR 97031 F: 541.387.2266 Page 12/21
Figure 9: Hood Technology manufactures two types of preamplifiers. The eddy current preamp (left) is
used for Hood Technology eddy current sensors or third party sensors via a BNC input. Optical preamp
(right) contains lasers and photodiodes for Hood Technology optical probes.
2.3. Data Acquisition Console
The data acquisition console takes the analog signals from the preamplifiers and turns them into timing data which can be interpreted into useful information. There are two families of Hood Technology Corporation’s data acquisition console. The first is the model 8030, mounted in a self-contained 19” instrumentation rack. The newly developed model 20036 uses FPGA technology to now provide 200MHz clock resolution for up to 36 channels. Model 4016C has integrated preamplifiers, a much smaller form factor and all solid state components. Versions of this system have been used in flight testing.

13
3100 Cascade Avenue T: 541.387.2288 WWW.HOODTECH.COM Hood River, OR 97031 F: 541.387.2266 Page 13/21
Table 1 highlights the major differences among the three models.

14
3100 Cascade Avenue T: 541.387.2288 WWW.HOODTECH.COM Hood River, OR 97031 F: 541.387.2266 Page 14/21
Table 1: Comparison of data console models 8030. 20036 and 4016C.
Model 8030 Model 20036 Model 4016C**
Timing Resolution 80MHz, 12.5ns ~ 4µm at 340m/s rim speed
200MHz, 5ns ~ 1.6µm at 340m/s rim speed
40MHz, 25ns†† ~8µm at 340m/s rim speed
Data Streaming ~1.5Mblades/sec ~1.5Mblades/sec ~0.25Mblades/sec
Maximum Channel Count 30 36 16
Outer Dimensions 650mmX900mmX1100mm 650mmX900mmX1100mm 222mmX465mmX199mm
Weight ~130kg ~130kg ~10kg
Virtual Oscilloscope Yes, up to 1.2Msamp/sec
Fast refresh rate
Yes, up to 1.2Msamp/sec
Fast refresh rate
Yes, up to 0.5Msamp/sec
~ 1 second refresh rate
Preamplifiers Separate Separate Integrated
Power Consumption 185 to 550W 185 to 550W 60 to 120W
Power Requirement 110-240VAC 110-240VAC 24-35VDC
Thermoelectric cooling of laser diodes
No No Yes
**
The model 4016C requires an additional computer, which could be a laptop, to run Acquire Blade Data software, but this laptop is not included in the power
consumption or physical specifications. ††
The model 4016C can actually support 200MHz resolution timing. However, at the moment, this comes with reduced integrated oscilloscope functionality.

15
3100 Cascade Avenue T: 541.387.2288 WWW.HOODTECH.COM Hood River, OR 97031 F: 541.387.2266 Page 15/21
2.3.1 BVM Model 8030
A photograph of a 30 channel version of BVM model 8030 is shown in Figure 10. This system hosts 1 to 10 BVSI modules, each supporting a Hood Tech preamp and 3 channels of sensor data.
Figure 10: Model 8030 data acquisition console. Standard 19 inch rack is soft-mounted. Console is on
casters and has removable front and back lids for shipping and safe storage.
The Blade Vibration Sensor Interface (BVSI) unit, shown in Figure 11 and developed by Hood Technology Corporation, conditions analog blade passage signals and converts them to a digital signal which is precisely timed. The BVSI performs the following functions:
• It provides power to Hood Technology's sensors, filters, repeaters and conditioning electronics.
• It allows one to determine blade passage on a repeatable feature of the analog pulses generated by the sensors.
• It provides a logic pulse indicating Time-Of-Arrival and an additional pulse indicative of pulse magnitude (i.e. tip clearance) which are timed by the National Instruments Timer Card.
• It communicates with Hood Technology’s Acquire Blade Data software, allowing the user to change BVSI settings (see in Table 2) via a graphical user interface.
Single BVSI unit capable of 3 channels of acquisition. This system is shown configured with 30 channels.
PXI chassis populated with timer cards and virtual oscilloscopes.
Integrated monitor/keyboard. Signals available for external oscilloscopes and tape recorders.

16
3100 Cascade Avenue T: 541.387.2288 WWW.HOODTECH.COM Hood River, OR 97031 F: 541.387.2266 Page 16/21
Figure 11: Blade Vibration Sensor Interface (BVSI) conditions analog blade passage signals and
converts them into a digital signal which is precisely timed.
Table 2: BVSI Parameters and their associated ranges or possible values.
Parameter Min Value Max Value
Gain -25 25
High Pass Filter Cutoff 0 Hz 3397 Hz
Low Pass Filter Cutoff 23 kHz 1496 kHz
Offset -7 V +7 V
Arm level 0.055 V 4.995 V
Trigger Edge Rising/Falling N/A
Trigger Level 0 % 90 % of max value attained
Hold Off 0.2 µs 4984 µs
Decay Rate Slow/fast N/A
2.3.2 BVM Model 20036
Blade vibration monitor model 20036 was developed in 2010. The primary goal of this model was to improve the clock resolution to 200MHz. The architecture is similar to model 8030, using the exact same BVSI, however timing is done with FPGA technology rather than dedicated counter/timer hardware.
2.3.3 BVM Model 4016C
Blade vibration monitor model 4016C was developed in 2008/2009. The cabling diagram, shown in Figure 12, is somewhat different than model 8030. The 4016C has all the features of the BVSI, BV-IND, and BV-OP integrated in a single box. In use, it would be located near the sensors. Rather than run cables with power and signal to the acquisition console, only an Ethernet cable is required to transmit data to a ‘ground station’, which could simply be a laptop computer running Acquire Blade Data. The figure also shows a flight-test implementation with a telemetry link. The first use of this system was in flight test of a military aircraft.

17
3100 Cascade Avenue T: 541.387.2288 WWW.HOODTECH.COM Hood River, OR 97031 F: 541.387.2266 Page 17/21
NI cRIO
Hood Tech cBVSI (4x)
NSMS
Sensors
Hood Tech cBVM System
Data output
via Ethernet (UDP)
Onboard telemetry
unit
Telemetry
Ground Station
Data output via
Ethernet
(TCP/IP)
Hood Tech Ground Station Acquire Blade Data
Telemetry
Without telemetry the data is
streamed directly to the Hood Tech Ground Station via Ethernet (TCP/IP)
Not provided by Hood Tech
Figure 12: The cabling diagram of the BVM model 4016C is somewhat different, because the BVSI and
preamplifier are integrated into one box that is located near the sensors. Data is streamed to disk, via
UDP or TCP/IP. The ‘ground station’ can simply be a laptop connected with an Ethernet cable to the
BVM model 4016C.
Figure 13: External dimensions of model 4016C.

18
3100 Cascade Avenue T: 541.387.2288 WWW.HOODTECH.COM Hood River, OR 97031 F: 541.387.2266 Page 18/21
2.4. Software
The software is not specific to the BVM model.
2.4.4 Acquire Blade Data (ver 9.x)
• Acquire Blade Data is used to acquire non-contacting blade tip timing sensor data. Some features include:
• Communicates with Hood Technology’s BVSI 5.x in BVM model 8030 and BVM model 4016C, allowing user to view and change conditioning and triggering parameters for each sensor (gain, lowpass, highpass, arm, trigger, etc.).
• Virtual Oscilloscope allows the user to view analog sensor signals and time of arrival while simultaneously adjusting conditioning and triggering.
• Time of arrival and encoded blade pulse amplitude can be continuously streamed to disk (up to 1.5Mpulses/sec ~=6MB/sec for BVM8030 and 0.25Mpulses/sec ~=1MB/sec for BVM4016C).
• Up to 30 channels are supported (for BVM8030, 16 channels for BVM4016C, 36 channels for BVM20036).
• Multiple rotors are supported.
• Real-time displays include:
o RPM
o Sensor Status (correct number of pulses, arrival variability).
o Generalized synchronous and non-synchronous amplitudes including blade by blade and historical.
o Circumferential Fourier fit (multi-sensor order tracking) with assumed response order.
o Synchronous Campbell diagram based on order scheduling.
o Blade tip clearance from blade pulse amplitudes or Skewed Dual Light Probes (SDLP) including blade by blade and historical.
o Blade Stagger when two chordwise positions are available.
o All-blades FFT for non-synchronous events (flutter, rotating stall, etc.)
o Single blade non-synchronous amplitudes using scheduled nodal diameters.
o Interblade spacing monitoring as a potential indication of rotor cracks.
• Test monitoring and data management features include:
o Select manual data acquisition, RPM dependent acquisition.
o Circular buffer streams all data so that data can be recovered if it is tagged to be saved by other events (e.g. high non-synchronous vibration, pretrigger).
o Automatic folder creation for long term testing.
o Data can periodically saved for long term tests (months and years).

19
3100 Cascade Avenue T: 541.387.2288 WWW.HOODTECH.COM Hood River, OR 97031 F: 541.387.2266 Page 19/21
o Creates an ASCII information file (*.inf) containing all pertinent information.
o Notes are automatically appended to *.inf.
o Supports the use of visual and audible alarms for excessive synchronous and non-synchronous vibration, tip clearance, and blade stagger angle.
Figure 14: Multiple screen captures from Acquire Blade Data software.
2.4.5 Analyze Blade Vibration (ver 6.x)
Analyze Blade Vibration is used to analyze data gathered with non-contacting blade tip sensors. Some features include:
• Sensor Location Determination
o Using user configuration, interblade spacing, or a combination of the two.
• Supports multiple rotors and chordwise sensor positions.
• Quick view of run RPM history.
• Quick view (aggregate) of synchronous / non-synchronous vibration with synchronous order determination.
20
3100 Cascade Avenue T: 541.387.2288 WWW.HOODTECH.COM Hood River, OR 97031 F: 541.387.2266 Page 20/21
• Synchronous Analysis
o Circumferential Fourier fit (i.e. Order Tracking) using 3 or more sensors.
o Single Degree of Freedom fit for each sensor or combinations of times-of-flight.
o Blade by blade viewing or stack plots.
o Results can be exported to Campbell Diagram and Excel and Word formats.
o User configurable data smoothing and processing features.
• Non-synchronous Analysis
o Waterfall display.
o Nodal diameter and true frequency determination of non-synchronous events.
o Non-integral Circumferential Fit performed for single blade amplitudes.
o Results can be exported to Campbell Diagram and Excel and Word formats.
o Blade Stagger Angle Analysis
• Blade Tip Clearance Analysis
o Supports two types of sensors, skewed dual light probes (aka V-probes, SDLP) and sensors whose blade pulse voltage is a function of clearance.
o Calibration can also include tip speed.
o Calibration utility allows for qualitative means of producing meaningful results when no calibration exists.
o Results can be exported to Excel and Word formats.

21
3100 Cascade Avenue T: 541.387.2288 WWW.HOODTECH.COM Hood River, OR 97031 F: 541.387.2266 Page 21/21
Figure 15: Multiple screen captures from Analyze Blade Vibration software.
2.4.6 Monitor
Monitor is a piece of software without a generic user interface. Monitor works in conjunction with Acquire Blade Data to perform long term trending on synchronous resonance, asynchronous phenomena, and blade lean, which can indicate the presence of a crack. In order to maximize the efficacy of Monitor, knowledge of expected cracks and models of the blade lean behavior are used to further distill the data. Monitor has the capability to automatically generate reports and publish them to a website and/or email them to addressees. Monitor requires a small amount of customization for each application.
3. Services Hood Technology Corporation provides services to accompany our systems.
3.1. Operator Training
Hood Tech has trained about 150 test console operators. We have used several techniques:
3.1.7 Short-Course
We have developed a 3-day short course on the topic turbomachinery blade-tip measurements. This class covers a thick stack viewgraphs. To drive home the knowledge, in-class demonstrations are given, using the Hood Technology data system and a table-top spinning bladed rotor exhibiting several synchronous blade resonances. The students in

22
3100 Cascade Avenue T: 541.387.2288 WWW.HOODTECH.COM Hood River, OR 97031 F: 541.387.2266 Page 22/21
the class are encouraged to use the data system to investigate the blade resonances exhibited by the table-top rig.
This class has been delivered about 15 times since 2003.
3.1.8 Demonstration and Hands-on Training During a First Test
Hood Tech typically trains its NSMS customers on site, sending a Hood Tech specialist to the test location. Following training and continued support from Hood Tech, subsequent tests are then executed by customer staff.
3.1.9 Teach-Yourself from the Hood Tech Manuals
Several customers have taught themselves from our operator’s manuals. In some circumstances, this is entirely possible with Hood Tech support. We will ship the data system, and work with the customer to achieve full and adequate results.
3.2. Consulting and Design of the Test and the Sensing System
The customer may have only an approximate idea of the cause of a rotor or blading problem. Hood Tech will design a test and the associated blade-tip sensing system to meet the testing goals. The deliverable from this type of effort is a report outlining testing goals, defining the proposed test, and customization of the interface between the sensor and device under test.
3.3. Test Services
The customer may not wish to own the sensing equipment, rather buying a test service. In this situation, Hood Tech will develop blade-tip sensors customized to fit into the customer’s machine, will bring personnel and data systems to the customer’s site and will acquire and analyze the data during a test. The deliverable from this type of effort is a test report.
3.4. Equipment Leasing
Hood Tech has leased data systems to various customers. Standard monthly lease fee is 17% of purchase price.
3.5. Software Maintenance
Hood Technology engineers are continually responding to customer requests and improving software. The software maintenance package is a yearly subscription and entitles the user to all available software updates.