hong kong monthly - knight frankcontent.knightfrank.com/research/676/documents/en/hk...research...
TRANSCRIPT

RESEARCH
JANUARY 2017
HONG KONG MONTHLY REVIEW AND COMMENTARY ON HONG KONG'S PROPERTY MARKET
Residential Government reaffirms determination to raise supply
Retail New normal approaching with market bottoming in March
Office Abundant supply expected in 2017, mainly in Kowloon

2
MARKET HIGHLIGHTS Grade-A office leasing was slow in December, both on Hong
Kong Island because of limited availablity and in Kowloon
owing to seasonal factors towards the year end.
The rise in the stamp duty rate in November dragged down home sales volume in December, but prices remained stable. Prices could be under pressure, with The Policy Address 2017 reaffirming the government’s intention to increase housing
supply.
Improved retail sales and visitor figures towards the year end reconfirmed our forecast that the local retail market should reach the bottom in the first half of 2017.
Prime Office Hong Kong Island
Grade-A office rents on Hong Kong Island continued to go up in December. With the lack of space in Central, some companies were forced to opt for offices outside the CBD, resulting in demand spilling over to nearby areas, such as Sheung Wan and Causeway Bay.
Looking ahead, we expect the uptrend
for office rents on Hong Kong Island to
continue in 2017 and Central will
outperform the market because of
extremely tight availability. Over the
year, we expect Central office rents to
increase 3-5%, while rents in other Hong
Kong Island areas could increase 0-2%.
Kowloon
There were not many major transactions in December, as many companies delayed their leasing decisions until after the new year. Landlords continued to increase incentives to attract tenants. With abundant supply in the pipeline, some companies have started to look into relocation or consolidation even though their leases are still far from expiry. In 2017, we expect the Kowloon leasing market to be very active, with abundant supply providing plenty of options for tenants. Kowloon office rents will face further downward pressure, falling by 3-5% in 2017.
TABLE 1
Economic indicators
Economic indicator Period Latest reading 2013 2014 2015
GDP growth Q3 2016 +1.9%# +2.9% +2.3% +2.4%
Inflation rate Nov 2016 +1.2% +4.3% +4.4% +3.0%
Unemployment Oct-Dec 2016 3.3%# 3.3% 3.2% 3.3%
Prime lending rate Current 5–5.25% 5%* 5%* 5%*
Source: EIU CountryData / Census & Statistics Department / Knight Frank Research
# Provisional * HSBC prime lending rate
FIGURE 1
Grade-A office prices and rents
Jan 2007 = 100
50
100
150
200
250
300
2007 2008 2009 2010 2011 2012 2013 2014 2015 2016
PRICE INDEX
RENTAL INDEX
Source: Knight Frank Research

3
RESEARCH HONG KONG MONTHLY
.
Residential
The market started to feel the impact of
the stamp duty rate rise in early
November. Combined with the low
season effect in the holiday season,
residential sales plunged 47.3% month
on month in December, with sales in all
price ranges dropping. Thanks to the
robust primary market, residential sales
in full-year 2016 dropped only 2.3% year
on year.
Primary sales were quiet in December,
with a limited number of new launches,
because of the stamp duty rise.
Secondary sales were also sluggish, as
primary developers offered preferential
terms to offset the effect of the heavy
tax, making secondary units even less
attractive. However, the super-luxury
sector remained resilient, with a number
of major transactions recorded.
The Policy Address announced in January reaffirmed the government’s determination to increase housing supply. The average annual supply is expected to reach 94,000 units in the coming 3-4 years, hitting a historic high. Abundant supply, combined with economic and policy uncertainty, may drag down mass residential prices by about 5% this year.
Retail
The market saw strong signs of recovery
in inbound tourism in December.
According to the Immigration
Department, visitor arrivals rose 13.8%
year on year during the Christmas
holiday, compared with a 5.4% decline in
the first 11 months of 2016.
The retail property capital market was
also buoyant last month. Fourteen major
retail property sales transactions worth
over HK$100 million were reported,
involving five local malls sold by The Link
REIT and nine street shops. The majority
of buyers were local investors seeking
high-yield properties, as the US central
bank triggered a rate rise and signalled
further hikes in 2017.
Knight Frank data show that the prices of
prime street shops saw a quarter-on-
quarter rebound after six quarters of
declines, up a moderate 0.6% in the final
quarter of 2016.
Active retail property sales indicate
increased investor confidence in the
long-term outlook. With the retail market
bottoming in March, we expect demand
for retail space from new brands to
increase in the second half of the year.
50
70
90
110
130
150
170
190
2007 2008 2009 2010 2011 2012 2013 2014 2015 2016
FIGURE 2
Luxury residential prices and rents
Jan 2007 = 100
PRICE INDEX
RENTAL INDEX
Source: Knight Frank Research
Source: Rating and Valuation Department / Knight Frank Research Note: Provisional figures from Jun to Nov 2016
FIGURE 3
Retail property prices and rents
Jan 2007 = 100
50
100
150
200
250
300
350
400 PRICE INDEX
RENTAL INDEX
4
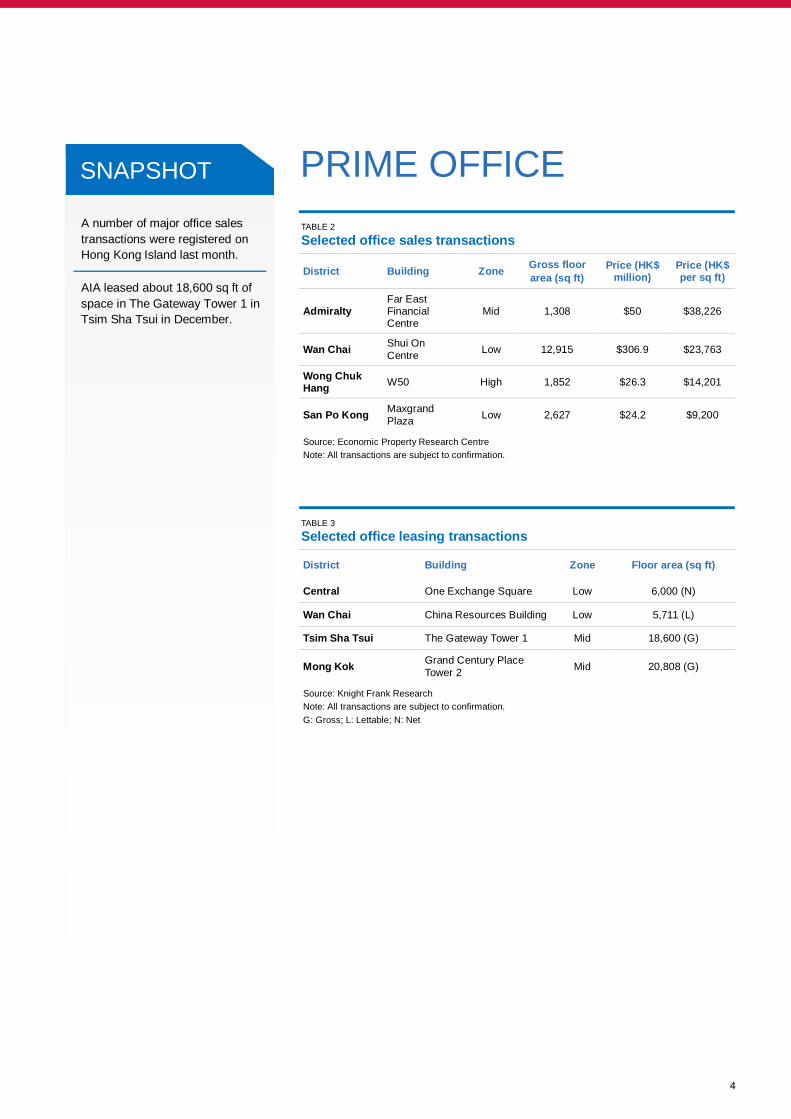
PRIME OFFICE
SNAPSHOT
A number of major office sales
transactions were registered on
Hong Kong Island last month.
AIA leased about 18,600 sq ft of
space in The Gateway Tower 1 in
Tsim Sha Tsui in December.
TABLE 2
Selected office sales transactions
District Building Zone Gross floor
area (sq ft)
Price (HK$ million)
Price (HK$ per sq ft)
Admiralty Far East Financial Centre
Mid 1,308 $50 $38,226
Wan Chai Shui On
Centre Low 12,915 $306.9 $23,763
Wong Chuk Hang
W50 High 1,852 $26.3 $14,201
San Po Kong Maxgrand
Plaza Low 2,627 $24.2 $9,200
Source: Economic Property Research Centre
Note: All transactions are subject to confirmation.
TABLE 3
Selected office leasing transactions
District Building Zone Floor area (sq ft)
Central One Exchange Square Low 6,000 (N)
Wan Chai China Resources Building Low 5,711 (L)
Tsim Sha Tsui The Gateway Tower 1 Mid 18,600 (G)
Mong Kok Grand Century Place
Tower 2 Mid 20,808 (G)
Source: Knight Frank Research
Note: All transactions are subject to confirmation.
G: Gross; L: Lettable; N: Net
5
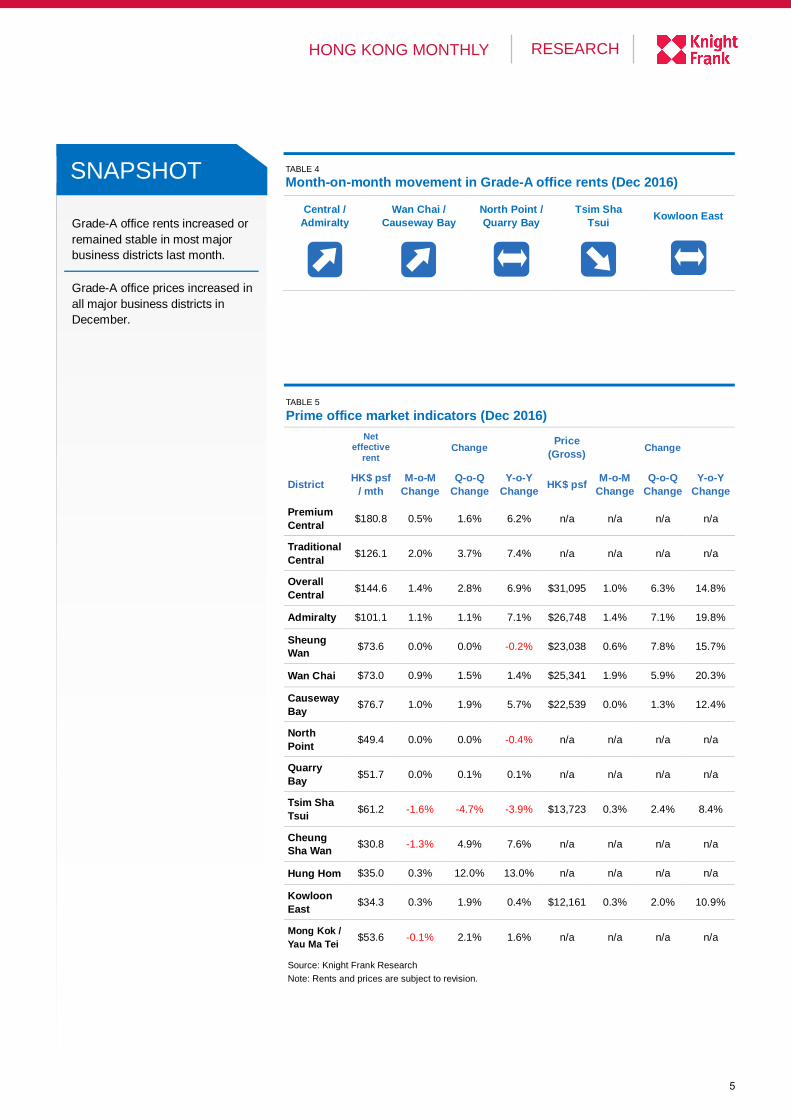
RESEARCH HONG KONG MONTHLY
TABLE 4 Month-on-month movement in Grade-A office rents (Dec 2016)
Central /
Admiralty Wan Chai /
Causeway Bay
North Point /
Quarry Bay
Tsim Sha
Tsui Kowloon East
TABLE 5
Prime office market indicators (Dec 2016)
Net
effective rent
Change Price
(Gross) Change
District HK$ psf
/ mth
M-o-M
Change
Q-o-Q
Change
Y-o-Y
Change HK$ psf
M-o-M
Change
Q-o-Q
Change
Y-o-Y
Change
Premium
Central $180.8 0.5% 1.6% 6.2% n/a n/a n/a n/a
Traditional
Central $126.1 2.0% 3.7% 7.4% n/a n/a n/a n/a
Overall
Central $144.6 1.4% 2.8% 6.9% $31,095 1.0% 6.3% 14.8%
Admiralty $101.1 1.1% 1.1% 7.1% $26,748 1.4% 7.1% 19.8%
Sheung
Wan $73.6 0.0% 0.0% -0.2% $23,038 0.6% 7.8% 15.7%
Wan Chai $73.0 0.9% 1.5% 1.4% $25,341 1.9% 5.9% 20.3%
Causeway
Bay $76.7 1.0% 1.9% 5.7% $22,539 0.0% 1.3% 12.4%
North
Point $49.4 0.0% 0.0% -0.4% n/a n/a n/a n/a
Quarry
Bay $51.7 0.0% 0.1% 0.1% n/a n/a n/a n/a
Tsim Sha
Tsui $61.2 -1.6% -4.7% -3.9% $13,723 0.3% 2.4% 8.4%
Cheung
Sha Wan $30.8 -1.3% 4.9% 7.6% n/a n/a n/a n/a
Hung Hom $35.0 0.3% 12.0% 13.0% n/a n/a n/a n/a
Kowloon
East $34.3 0.3% 1.9% 0.4% $12,161 0.3% 2.0% 10.9%
Mong Kok /
Yau Ma Tei $53.6 -0.1% 2.1% 1.6% n/a n/a n/a n/a
Source: Knight Frank Research
Note: Rents and prices are subject to revision.
SNAPSHOT
Grade-A office rents increased or
remained stable in most major
business districts last month.
Grade-A office prices increased in
all major business districts in
December.

6
RESIDENTIAL
SNAPSHOT
A number of major residential
sales transactions were recorded
in Mid-Levels last month.
A number of large units were
leased in Island South in
December.
TABLE 7
Selected residential leasing transactions
District Building Tower / floor /
unit
Saleable
area
(sq ft)
Monthly
rent (HK$)
Monthly rent
(HK$ per
sq ft)
Mid-Levels
West Arezzo
Low floor / unit
B 970 $57,000
$58.8
Wan Chai Convention Plaza Apartment
High floor / unit 11
744 $35,000 $47.0
Island South South Bay
Towers
High floor / unit
C 2,143 $95,000
$44.3
Island South Regalia Bay Type B house 2,787 $120,000 $43.1
Mid-Levels Central
Garden Terrace Tower 2 / low floor / unit A
2,580 $90,000 $34.9
Source: Knight Frank Research
Note: All transactions are subject to confirmation.
TABLE 6
Selected residential sales transactions
District Building Tower / floor /
unit
Saleable
area
(sq ft)
Price (HK$
million)
Price
(HK$ per
sq ft)
Peak Bayview House 2 3,350 (G) $263 $78,507
Kowloon
Tong Village Gardens
Block 4 / 5th
floor / unit B 1,587 $35 $22,054
Mid-Levels Central
Glory Mansion 7th floor / unit 106
1,880 $36.5 $19,415
Mid-Levels
West Park View Court
Tower A / 16th
floor / unit 1 2,837 (G) $38 $13,394
Source: Economic Property Research Centre
Note: All transactions are subject to confirmation.
G: Gross floor area

7
RESEARCH HONG KONG MONTHLY
SNAPSHOT
In December, rents remained
stable in all major luxury
residential districts.
Overall luxury home prices
remained stable last month.
TABLE 8 Month-on-month changes in luxury residential rents (Dec 2016)
The
Peak Island South Mid-Levels
Jardine’s
Lookout /
Happy Valley
Pokfulam
TABLE 9
Luxury residential market indicators (Dec 2016)
Rent Change Price Change
District HK$ psf
/ mth
M-o-M
change
Q-o-Q
change
Y-o-Y
change HK$ psf
M-o-M
change
Q-o-Q
change
Y-o-Y
change
The
Peak $60.5 -0.2% 0.2% -5.3%
$40,091 0.0% 0.0% 0.0%
Island
South $49.3 -0.1% -0.8% -3.3% $30,970 0.0% 4.7% 8.8%
Mid-
Levels $52.0 0.3% 0.2% -7.7% $27,196 0.2% 2.7% 4.6%
Jardine
’s
Looko
ut /
Happy
Valley
$48.0 -0.5% -0.6% -4.3% $25,772 0.6% 2.3% -1.6%
Pokful
am $36.7 0.1% -0.3% -3.9% $22,995 0.1% 1.0% -4.6%
Source: Knight Frank Research
Note: Rents and prices are based on saleable area and are subject to revision.

8
RETAIL
R
SNAPSHOT
A number of big-ticket retail
property sales transactions were
recorded in December.
A number of street shops were
leased in prime shopping areas
last month.
TABLE 10
Selected retail sales transactions
District Building Floor / unit
Saleable
floor area
(sq ft)
Price
(HK$
million)
Price
(HK$ per
sq ft)
Causeway Bay
Sun On Mansion Ground floor / units 20, 20A-
B and 22
1,643 $215 $130,858
Tsing Yi Cheung Hong
Estate En bloc* 133,200 (G) $1,150 $8,634
Yuen Long 8 Tin Sau Road 1st floor / units 1003 and 1005-1009
3,769 $151.6 $40,223
Mong Kok 71 Argyle Street Ground floor N/A $215 N/A
Source: Economic Property Research Centre
Note: All transactions are subject to confirmation.
G: Gross
*with 709 car-parking spaces
TABLE 11
Selected retail leasing transactions
District Building Floor / unit
Saleable
floor area
(sq ft)
Monthly
rent (HK$)
Monthly rent
(HK$ per
sq ft)
Wan Chai Fortune Building
Ground floor / unit 3
804 $218,800 $272.1
Tsim Sha Tusi Kuntsford Commercial Building
Ground floor / unit 2
1,746 $370,000 $211.9
Central Wellington
Place
Ground floor /
units 1-2 N/A $980,000 N/A
Central Hing Yip Commercial
Centre
Ground floor / unit F
N/A $238,000 N/A
Source: Economic Property Research Centre
Note: All transactions are subject to confirmation.

9
RESEARCH HONG KONG MONTHLY
SNAPSHOT
Prime street shop rents fell in all
major retail districts in December.
Total retail sales value decreased
5.5% year on year to HK$36.0
billion in .
TABLE 12 Month-on-month movement in prime street shop rents (Dec 2016)
Central Causeway Bay Tsim Sha
Tsui Mong Kok
TABLE 13
Retail sales by outlet type (Nov 2016)
Value
(HK$ billion)
Share of
total %
M-o-M
change
Q-o-Q
change
Y-o-Y
change Outlet
Jewellery, watches
and clocks, and
valuable gifts
$5.7 15.8% -7.3% -1.6% -14.4%
Clothing, footwear
and allied products $4.7 13.1% 9.9% 12.4% 3.7%
Department stores $5.1 14.1% 34.0% 43.8% 1.7%
Fuel $0.8 2.1% 0.3% -0.3% 2.4%
Food, alcoholic drinks
and tobacco
(excluding
supermarkets)
$3.4 9.4% -1.9% -2.2% 0.9%
Consumer durable
goods $5.9 16.5% -9.7% 23.6% -18.0%
Supermarkets $4.1 11.5% -7.5% -7.5% -1.1%
Others $6.3 17.6% -5.2% -9.0% -1.2%
All retail outlets $36.0 100.0% -0.3% 6.1% -5.5%
Source: Census and Statistics Department / Knight Frank Research

10
RESEARCH & CONSULTANCY
David Ji
Director
Head of Research & Consultancy
Greater China
+852 2846 9552
Pamela Tsui
Senior Manager Research & Consultancy
Greater China +852 2846 4843 [email protected]
CONTACTS
Alan Child
Chairman +852 2846 9522 [email protected]
Piers Brunner Chief Executive Officer
Greater China +852 2846 4848 [email protected]
Paul Hart
Executive Director Greater China +852 2846 9537
Alnwick Chan
Executive Director +852 2846 9551 [email protected]
CHINA VALUATION
Clement Leung Executive Director +852 2846 9593
COMMERCIAL AGENCY
Ross Criddle Senior Director +852 2846 9527
RESIDENTIAL AGENCY
Maggie Lee Senior Director Head of Residential Agency
+852 2846 9550 [email protected]
RETAIL SERVICES
Helen Mak Senior Director
Head of Retail Services +852 2846 9543 [email protected]
© Knight Frank 萊坊 2017
Knight Frank Petty Limited Knight Frank Hong Kong Limited Disclaimer This document and the material contained in it is general information only and is subject to change without notice. All images are for illustration only. No representations or warranties of any nature whatsoever are given, intended or implied. Knight Frank will not be liable for negligence, or for any direct or indirect consequential losses or damages arising from the use of this information. You should satisfy yourself about the completeness or accuracy of any information or materials. Copyright This document and the material contained in it is the property of Knight Frank and is given to you on the understanding that such material and the ideas, concepts and proposals expressed in it are the intellectual property of Knight Frank and protected by copyright. It is understood that you may not use this material or any part of it for any reason other than the evaluation of the document unless we have entered into a further agreement for its use. This document is provided to you in confidence on the understanding it is not disclosed to anyone other than to your employees who need to evaluate it.
Knight Frank Research provides strategic advice, consultancy services and forecasting to a wide
range of clients worldwide, including developers, investors, funding organisations, corporate
institutions and the public sector. All our clients recognise the need for expert independent advice
customised to their specific needs.
RECENT MARKET-LEADING RESEARCH PUBLICATIONS
Global Residential
Cities Index Q3 2016 Global Cities 2016 The Wealth Report Chinese Outbound
report
Knight Frank Research Reports are available at KnightFrank.com/Research