homogenization of regional river dynamics by dams …€¦ · homogenization of regional river...
TRANSCRIPT

Homogenization of regional river dynamics by damsand global biodiversity implicationsN. LeRoy Poff*†, Julian D. Olden‡, David M. Merritt§¶, and David M. Pepin*
*Department of Biology and Graduate Degree Program in Ecology, and ¶Natural Resources Ecology Laboratory, Colorado State University, Fort Collins, CO80523; ‡School of Aquatic and Fishery Sciences, University of Washington, Seattle, WA 98195; and §National Watershed, Fish, and Wildlife Program, UnitedStates Forest Service, Fort Collins, CO 80526
Edited by Harold A. Mooney, Stanford University, Stanford, CA, and approved January 29, 2007 (received for review November 5, 2006)
Global biodiversity in river and riparian ecosystems is generatedand maintained by geographic variation in stream processes andfluvial disturbance regimes, which largely reflect regional differ-ences in climate and geology. Extensive construction of dams byhumans has greatly dampened the seasonal and interannualstreamflow variability of rivers, thereby altering natural dynamicsin ecologically important flows on continental to global scales. Thecumulative effects of modification to regional-scale environmentaltemplates caused by dams is largely unexplored but of criticalconservation importance. Here, we use 186 long-term streamflowrecords on intermediate-sized rivers across the continental UnitedStates to show that dams have homogenized the flow regimes onthird- through seventh-order rivers in 16 historically distinctivehydrologic regions over the course of the 20th century. Thisregional homogenization occurs chiefly through modification ofthe magnitude and timing of ecologically critical high and lowflows. For 317 undammed reference rivers, no evidence for ho-mogenization was found, despite documented changes in regionalprecipitation over this period. With an estimated average densityof one dam every 48 km of third- through seventh-order riverchannel in the United States, dams arguably have a continentalscale effect of homogenizing regionally distinct environmentaltemplates, thereby creating conditions that favor the spread ofcosmopolitan, nonindigenous species at the expense of locallyadapted native biota. Quantitative analyses such as ours providethe basis for conservation and management actions aimed atrestoring and maintaining native biodiversity and ecosystem func-tion and resilience for regionally distinct ecosystems at continentalto global scales.
disturbance � natural flow regime � ecosystem sustainability �environmental template
Regional-scale variation in climate is a key driver of globalbiodiversity (1, 2), in large part through its effects on
dynamic natural disturbance regimes that shape evolutionaryand ecological processes in aquatic and terrestrial ecosystems. Inrecent times, however, human transformation of the biosphere isnot only threatening the biodiversity of ecosystems worldwide (1,3), but may also be overriding important regional-scale differ-ences in natural climatic variation that shape the bounds ofecosystem resilience. Humans have certainly simplified naturallandscapes through extensive ecosystem modification and dom-ination (4), but a fundamental question remains as to whetherhumans are diminishing, or homogenizing, the regional distinc-tiveness in natural disturbance dynamics, as some have specu-lated based on documented large-scale patterns of biotic ho-mogenization (5, 6). If so, an immediate concern would beidentifying possible conservation strategies to maintain or re-store ecologically important regional differences to supportecosystem resilience and biodiversity at continental to globalscales.
The construction and operation of �45,000 large (�15 mhigh) dams worldwide during the 20th century (7) has severelyaltered the global f lux of water and sediment from continents to
oceans through the world’s river basins (8, 9). From an ecologicalperspective, the fragmentation of river corridors by dams (10)and the associated modification of fluvial processes and stream-flow dynamics pose significant threats to native river biodiversityon a global scale (11–14). The numerous negative effects ofindividual dams on individual river ecosystems are well docu-mented (15–17); however, an important, unresolved question iswhether the cumulative effects of dams are inducing continentalto global scale convergence of historically distinctive regionalenvironmental templates, thereby diminishing regional-scalevariation that helps maintain broader patterns of native biodi-versity (18). This question can be addressed quantitatively for theUnited States because long-term, spatially extensive, and high-quality daily streamflow records exist that allow natural distur-bance regimes to be characterized in an ecologically meaningfulmanner.
A broad consensus has emerged over the last 10 years amongecologists that the function of riverine ecosystems, and theevolutionary adaptations of resident biota, are often dictated bythe dynamic nature of a river’s natural disturbance regime, whichlargely reflects time-varying streamflow conditions (12, 13, 19,20) that vary from region to region (21, 22). By stronglymodifying natural f low regimes, dams have the potential toreduce these natural regional differences and thus imposeenvironmental homogeneity across broad geographic scales.Many techniques have been developed to characterize thestatistical properties of a river’s f low regime for ecological study(23, 24), and the occurrence of long-term, daily hydrographicrecords allows regional-scale analysis of ecologically relevantstreamflow modification by dams on the nation’s rivers. Like-wise, ongoing monitoring of free-flowing rivers allows the effectsof river regulation on regional disturbance regimes to be distin-guished from the natural range of variation associated withclimate-driven changes in regional precipitation and river runoffthat have occurred over the 20th century (25, 26).
Here, we quantitatively test the hypothesis that dams havehomogenized regionally distinct river flow regimes across the
Author contributions: N.L.P., J.D.O., and D.M.M. designed research; N.L.P., J.D.O., D.M.M.,and D.M.P. performed research; N.L.P., J.D.O., and D.M.P. analyzed data; and N.L.P., J.D.O.,and D.M.M. wrote the paper.
The authors declare no conflict of interest.
This article is a PNAS Direct Submission.
Abbreviations: ANOSIM, analysis of similarity; EOF, Eastern Broadleaf Forest–Oceanic; ECF,Eastern Broadleaf Forest–Continental; SMF, Southeastern Mixed Forest; CDS, California DrySteppe; CMF, Cascade Mixed Forest-Coniferous Forest-Alpine Meadow; MRM, MiddleRocky Mountain Steppe-Coniferous Forest-Alpine Meadow; GSS, Great Plains Steppe andShrub; ISD, Intermountain Semidesert; CCR, California Coastal Range Open Woodland-Shrub-Coniferous Forest-Meadow; OCP, Outer Coastal Plain Mixed Forest; ISD, Intermoun-tain Semidesert; NMF, Adirondack-New England Mixed Forest-Coniferous Forest-AlpineMeadow; CSD, Colorado Plateau Semidesert; GPS, Great Plains Steppe; NUM, Nevada-UtahMountains-SemiDesert-Coniferous Forest-Alpine Meadow; PPT, Prairie Parkland–Temper-ate; SRM, Southern Rocky Mountain Steppe-Open Woodland-Coniferous Forest-AlpineMeadow.
See Commentary on page 5711.
†To whom correspondence should be addressed. E-mail: [email protected].
© 2007 by The National Academy of Sciences of the USA
5732–5737 � PNAS � April 3, 2007 � vol. 104 � no. 14 www.pnas.org�cgi�doi�10.1073�pnas.0609812104
continental United States, independently of climatic variation.Over the course of the 20th century, �75,000 structures exceed-ing 2 m in height were constructed on stream and river channelsin the United States (ref. 27; http://crunch.tec.army.mil/nid/webpages/nid.cfm). These ubiquitous dams occur on averageabout every 70 km on the �5.2 million km of river channelsranging from first-order small streams to 10th-order great rivers(28). The effects of these dams extend both upstream byinundating �10% of the total stream and river channel length(29) and downstream by modifying flow regimes and otherenvironmental factors for tens to hundreds of km (15, 30).Indeed, unregulated, free-flowing rivers are now rare in theUnited States, with only 42 rivers �200 km being free from theinfluence of dams (31).
In this article, we focus on third- through seventh-order rivers,which comprise over a quarter of the total stream channelkilometers in the U.S (28). Using river disturbance theory (12,32), we define flow regimes in terms of magnitude, frequency,duration, and timing of ecologically relevant flows, expressedboth as long-term averages and interannual variation. For 16 apriori defined ‘‘hydroregions’’ across the continental U.S., we usea total of 186 long-term, daily streamflow gauges to calculateeach region’s predam, unregulated flow regime and postdam,regulated flow regime (Fig. 1). In these same regions, we use 317undammed reference gauges that allow quantitative comparisonof the magnitude of changes in regional f low regimes caused bydams versus climatic variation over the same time period.
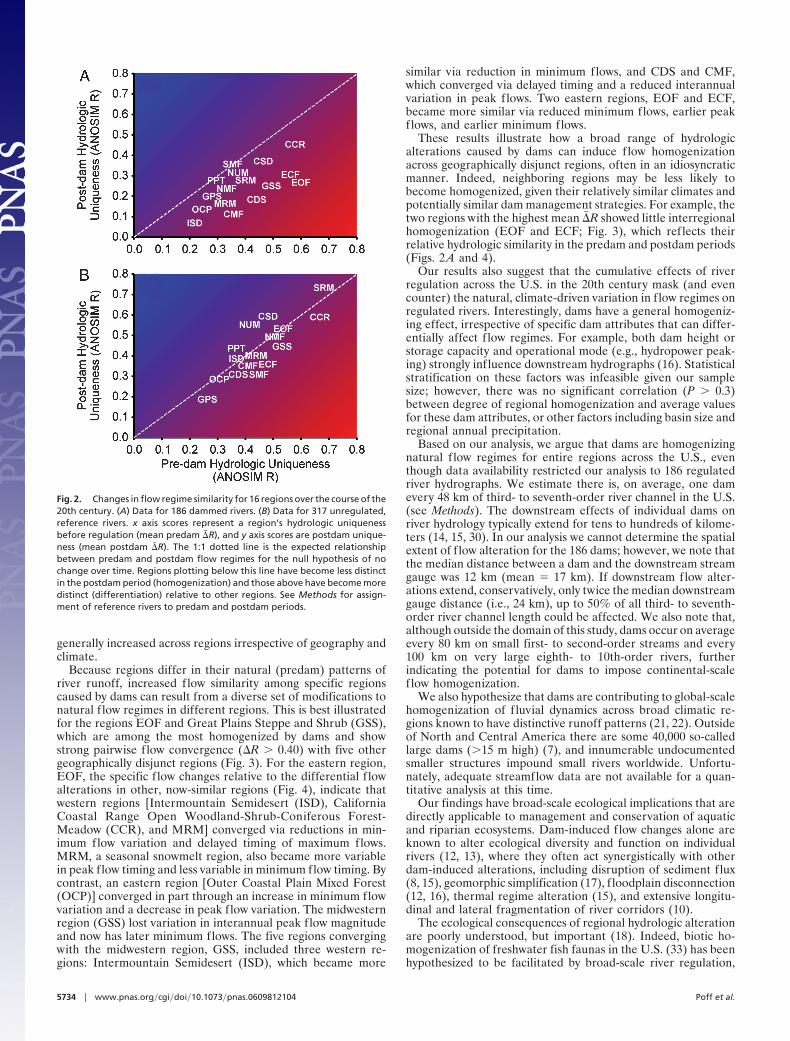
Results and DiscussionRegional-scale differences in natural f low regimes that existed inthe first half of the 20th century in the United States have beensignificantly reduced in regulated rivers, but not in free-flowingrivers. Across the 16 regions, postdam homogenization is sta-tistically significant [analysis of similarity (ANOSIM) global�� R � 0.13, range �0.02 to 0.31; one-sided t test: t15 � 5.40, P �0.0001; Fig. 2A]. In contrast, undammed reference rivers showno evidence for flow homogenization over the same period(ANOSIM global �� R � �0.003, range �0.17 to 0.08; t15 ��0.17, P � 0.44; Fig. 2B). Because regulated and reference rivers
within regions have presumably experienced similar climateconditions and trends, we conclude that this homogenization iscaused by the effects of dams and not by changes in regionalclimate over this period (25, 26). Evidence for dam-induced flowhomogenization is further supported by the significant differ-ence between regulated and unregulated rivers for each region(paired t test: t15 � 5.34; P � 0.0001).
Overall, 15 of the 16 regions show evidence of flow homog-enization (Fig. 1). Those regions showing the greatest averageincrease in similarity (�� R values) also show the highest frequencyof pairwise interregional homogenization (�R values in Fig. 3)before and after damming. Overall, for regulated rivers, a totalof 88 (73%) of the 120 pairwise comparisons among the 16regions exhibited flow homogenization (i.e., positive �R values),which was significantly more than the 60 (50%) for referencerivers (sign test: P � 0.001).
Different characteristics of the flow regime (depicted by the16 flow metrics) have been affected by dams, and thus differ-entially contribute to observed levels of f low homogenizationamong regions (Fig. 4). Broadly speaking, operations of the damsexamined tend to homogenize regional f low variability by mod-ifying the magnitude and timing components of high and lowflows, with lesser contributions from changes in flow durationand frequency. Across almost all regions, average maximum flowconsistently declined, as did interannual variation in daily max-ima. Minimum flow magnitudes generally increased, whereasinterannual variation in minimum flows generally declined.Timing of maximum flows exhibited a geographic pattern, withmore eastern, rainfall-dominated regions showing earlier timingof peak flows [e.g., Eastern Broadleaf Forest–Oceanic (EOF),Eastern Broadleaf Forest–Continental (ECF), and SoutheasternMixed Forest (SMF)] compared with delayed peak flows in moresnowmelt-dominated western regions [e.g., California DrySteppe (CDS), Cascade Mixed Forest-Coniferous Forest-AlpineMeadow (CMF), and Middle Rocky Mountain Steppe-Coniferous Forest-Alpine Meadow (MRM)]. Trends in thetiming of minimum flows were more variable. The interannualvariation in timing for both maximum and minimum flows
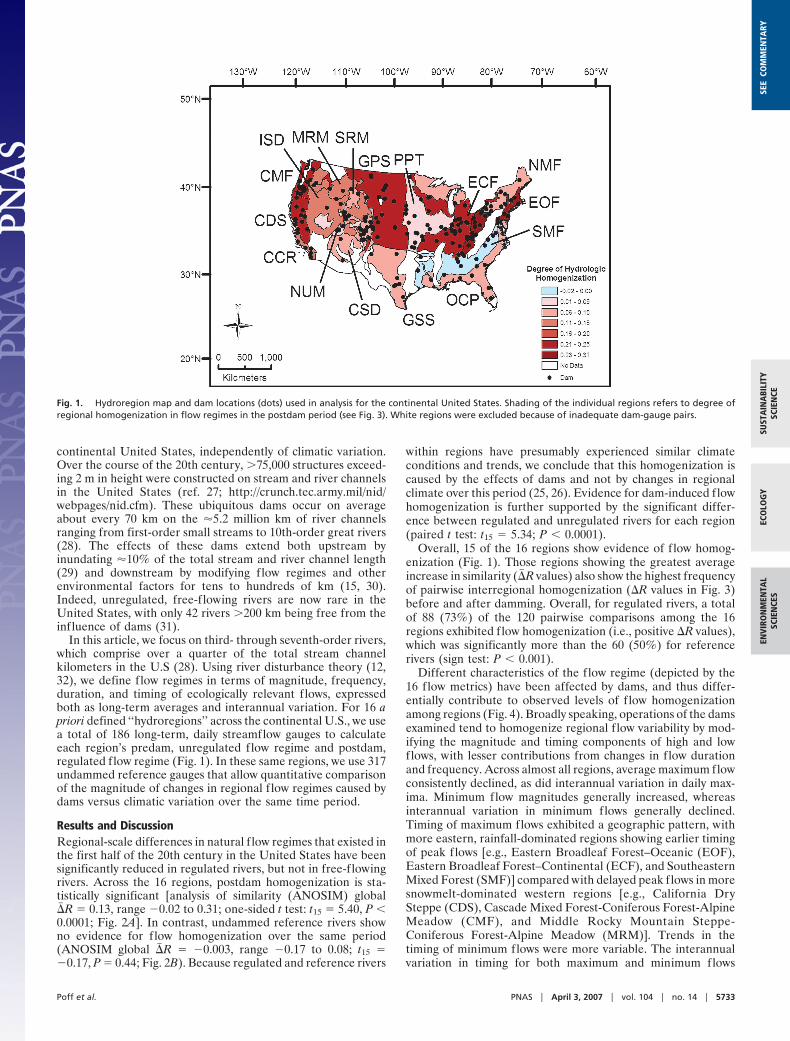
Fig. 1. Hydroregion map and dam locations (dots) used in analysis for the continental United States. Shading of the individual regions refers to degree ofregional homogenization in flow regimes in the postdam period (see Fig. 3). White regions were excluded because of inadequate dam-gauge pairs.
Poff et al. PNAS � April 3, 2007 � vol. 104 � no. 14 � 5733
SUST
AIN
ABI
LITY
SCIE
NCE
ECO
LOG
YEN
VIR
ON
MEN
TAL
SCIE
NCE
SSE
ECO
MM
ENTA
RY
generally increased across regions irrespective of geography andclimate.
Because regions differ in their natural (predam) patterns ofriver runoff, increased flow similarity among specific regionscaused by dams can result from a diverse set of modifications tonatural f low regimes in different regions. This is best illustratedfor the regions EOF and Great Plains Steppe and Shrub (GSS),which are among the most homogenized by dams and showstrong pairwise flow convergence (�R � 0.40) with five othergeographically disjunct regions (Fig. 3). For the eastern region,EOF, the specific f low changes relative to the differential f lowalterations in other, now-similar regions (Fig. 4), indicate thatwestern regions [Intermountain Semidesert (ISD), CaliforniaCoastal Range Open Woodland-Shrub-Coniferous Forest-Meadow (CCR), and MRM] converged via reductions in min-imum flow variation and delayed timing of maximum flows.MRM, a seasonal snowmelt region, also became more variablein peak flow timing and less variable in minimum flow timing. Bycontrast, an eastern region [Outer Coastal Plain Mixed Forest(OCP)] converged in part through an increase in minimum flowvariation and a decrease in peak flow variation. The midwesternregion (GSS) lost variation in interannual peak flow magnitudeand now has later minimum flows. The five regions convergingwith the midwestern region, GSS, included three western re-gions: Intermountain Semidesert (ISD), which became more
similar via reduction in minimum flows, and CDS and CMF,which converged via delayed timing and a reduced interannualvariation in peak flows. Two eastern regions, EOF and ECF,became more similar via reduced minimum flows, earlier peakflows, and earlier minimum flows.
These results illustrate how a broad range of hydrologicalterations caused by dams can induce flow homogenizationacross geographically disjunct regions, often in an idiosyncraticmanner. Indeed, neighboring regions may be less likely tobecome homogenized, given their relatively similar climates andpotentially similar dam management strategies. For example, thetwo regions with the highest mean �� R showed little interregionalhomogenization (EOF and ECF; Fig. 3), which reflects theirrelative hydrologic similarity in the predam and postdam periods(Figs. 2A and 4).
Our results also suggest that the cumulative effects of riverregulation across the U.S. in the 20th century mask (and evencounter) the natural, climate-driven variation in flow regimes onregulated rivers. Interestingly, dams have a general homogeniz-ing effect, irrespective of specific dam attributes that can differ-entially affect f low regimes. For example, both dam height orstorage capacity and operational mode (e.g., hydropower peak-ing) strongly influence downstream hydrographs (16). Statisticalstratification on these factors was infeasible given our samplesize; however, there was no significant correlation (P � 0.3)between degree of regional homogenization and average valuesfor these dam attributes, or other factors including basin size andregional annual precipitation.
Based on our analysis, we argue that dams are homogenizingnatural f low regimes for entire regions across the U.S., eventhough data availability restricted our analysis to 186 regulatedriver hydrographs. We estimate there is, on average, one damevery 48 km of third- to seventh-order river channel in the U.S.(see Methods). The downstream effects of individual dams onriver hydrology typically extend for tens to hundreds of kilome-ters (14, 15, 30). In our analysis we cannot determine the spatialextent of flow alteration for the 186 dams; however, we note thatthe median distance between a dam and the downstream streamgauge was 12 km (mean � 17 km). If downstream flow alter-ations extend, conservatively, only twice the median downstreamgauge distance (i.e., 24 km), up to 50% of all third- to seventh-order river channel length could be affected. We also note that,although outside the domain of this study, dams occur on averageevery 80 km on small first- to second-order streams and every100 km on very large eighth- to 10th-order rivers, furtherindicating the potential for dams to impose continental-scaleflow homogenization.
We also hypothesize that dams are contributing to global-scalehomogenization of fluvial dynamics across broad climatic re-gions known to have distinctive runoff patterns (21, 22). Outsideof North and Central America there are some 40,000 so-calledlarge dams (�15 m high) (7), and innumerable undocumentedsmaller structures impound small rivers worldwide. Unfortu-nately, adequate streamflow data are not available for a quan-titative analysis at this time.
Our findings have broad-scale ecological implications that aredirectly applicable to management and conservation of aquaticand riparian ecosystems. Dam-induced flow changes alone areknown to alter ecological diversity and function on individualrivers (12, 13), where they often act synergistically with otherdam-induced alterations, including disruption of sediment flux(8, 15), geomorphic simplification (17), f loodplain disconnection(12, 16), thermal regime alteration (15), and extensive longitu-dinal and lateral fragmentation of river corridors (10).
The ecological consequences of regional hydrologic alterationare poorly understood, but important (18). Indeed, biotic ho-mogenization of freshwater fish faunas in the U.S. (33) has beenhypothesized to be facilitated by broad-scale river regulation,
Fig. 2. Changes in flow regime similarity for 16 regions over the course of the20th century. (A) Data for 186 dammed rivers. (B) Data for 317 unregulated,reference rivers. x axis scores represent a region’s hydrologic uniquenessbefore regulation (mean predam �� R), and y axis scores are postdam unique-ness (mean postdam �� R). The 1:1 dotted line is the expected relationshipbetween predam and postdam flow regimes for the null hypothesis of nochange over time. Regions plotting below this line have become less distinctin the postdam period (homogenization) and those above have become moredistinct (differentiation) relative to other regions. See Methods for assign-ment of reference rivers to predam and postdam periods.
5734 � www.pnas.org�cgi�doi�10.1073�pnas.0609812104 Poff et al.
which presumably simplifies regionally unique disturbancedynamics and allows establishment of nonnative and otherwisepoorly adapted species (34, 35). As humans continue to face thedilemma of attaining ecosystem sustainability in the face ofglobal change (1, 36), there is growing need for preservationof remaining intact systems and deliberate and strategic designof resilient ecosystems (37). Therefore, for rivers, and otherecosystems, maintaining dynamic elements of regional distinc-tiveness in key environmental drivers of ecosystem function andnative biodiversity should be a conservation priority, as this willcontribute landscape-scale ecosystem resilience in the face ofglobal change (1, 4, 38). Opportunities such as dam re-regulationto provide formative flows having some semblance to thehistorical regime should be exploited (39–41), as should theconservation potential of relatively free-flowing rivers that canserve as cornerstones of ‘‘dynamic reserves’’ (42, 43) in anincreasingly homogenized world.
MethodsDelineation of Hydrologic Regions. We developed our a priorihydroregions by modifying an existing ecoregional classification(44) comprised of 19 divisions and 35 provinces, which ade-quately partition the climatic and geologic variability of thecontinental U.S. at the national scale. We split some divisionsthat spanned wide latitude or elevation gradients along provinceboundaries and by clumping some divisions with provincesbelonging to other divisions. This pseudodivision scheme parti-tions the hydrologic variability of the continental U.S. in amanner we deemed to be more ecologically meaningful than that
afforded by other mapping schemes based on hydroclimatology(45), climate and vegetation (46), or point distribution of stream-flow ‘‘types’’ (47).
We selected final regions based on criteria of adequate streamgauge density (see below). The 16 regions we used (Fig. 1) were:Adirondack-New England Mixed Forest-Coniferous Forest-Alpine Meadow (NMF), CCR, CDS, CMF, Colorado PlateauSemidesert (CSD), ECF, EOF, GSS, Great Plains Steppe (GPS),ISD, MRM, Nevada-Utah Mountains-SemiDesert-ConiferousForest-Alpine Meadow (NUM), OCP, Prairie Parkland–Temperate (PPT), SMF, and Southern Rocky Mountain Steppe-Open Woodland-Coniferous Forest-Alpine Meadow (SRM).
Selection of Long-Term Streamflow Gauges. In identifying suitabledam-gauge pairs to assess hydrologic alteration by dams, we firstidentified all 26,000 streamflow gauges contained in the Envi-ronmental Protection Agency BASINS V 3.0 database (48),including those no longer active. These were geo-referenced(latitude-longitude) in a Geographic Information System on ariver reach coverage (RF1) at a scale of 1:250,000, whichcaptures �1.12 million km of river channels and open waters inthe continental U.S. Based on stream length to stream orderrelations, the minimum scale of this coverage is about a third-order river (28). We extracted information from the U.S. Na-tional Inventory of Dams (NID; ref. 27; http://crunch.tec.army.mil/nid/webpages/nid.cfm), which contains �75,000 structures�2 m in height. Next, we identified those dams on RF1 segments(using a 0.8-km buffer to remove off-channel reservoirs). Werestricted our analysis to those dams that had a designated
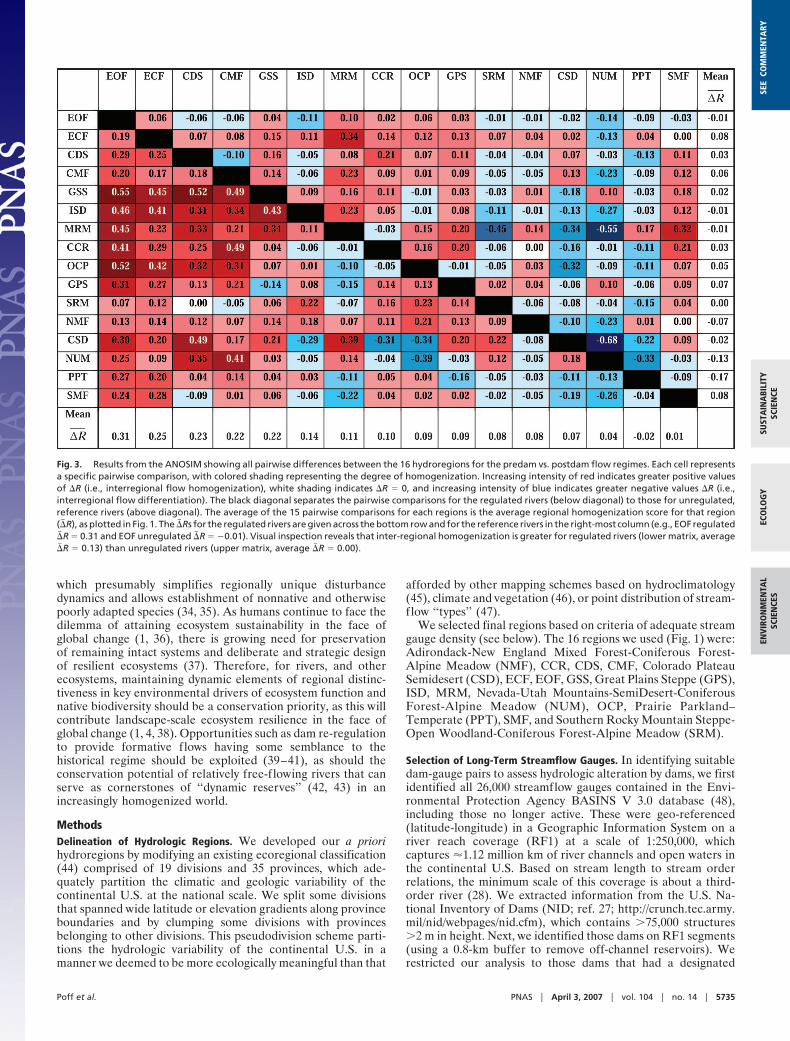
Fig. 3. Results from the ANOSIM showing all pairwise differences between the 16 hydroregions for the predam vs. postdam flow regimes. Each cell representsa specific pairwise comparison, with colored shading representing the degree of homogenization. Increasing intensity of red indicates greater positive valuesof �R (i.e., interregional flow homogenization), white shading indicates �R � 0, and increasing intensity of blue indicates greater negative values �R (i.e.,interregional flow differentiation). The black diagonal separates the pairwise comparisons for the regulated rivers (below diagonal) to those for unregulated,reference rivers (above diagonal). The average of the 15 pairwise comparisons for each regions is the average regional homogenization score for that region(�� R), as plotted in Fig. 1. The �� Rs for the regulated rivers are given across the bottom row and for the reference rivers in the right-most column (e.g., EOF regulated�� R � 0.31 and EOF unregulated �� R � �0.01). Visual inspection reveals that inter-regional homogenization is greater for regulated rivers (lower matrix, average�� R � 0.13) than unregulated rivers (upper matrix, average �� R � 0.00).
Poff et al. PNAS � April 3, 2007 � vol. 104 � no. 14 � 5735
SUST
AIN
ABI
LITY
SCIE
NCE
ECO
LOG
YEN
VIR
ON
MEN
TAL
SCIE
NCE
SSE
ECO
MM
ENTA
RY

primary operational purpose of irrigation, hydropower, f loodcontrol, navigation, water supply, or recreation, but these NIDcategories are not mutually exclusive in terms of potentialdownstream hydrologic impacts and are qualitative.
Of the �17,000 dams in our reduced candidate set, we used thefollowing strict criteria to ensure accurate recording of the effectof a single dam on the flow history of the river gauge: nopreexisting upstream mainstem dam, at least 15 years of dailystreamflow data both before and after the dam completion date,no more than two tributary inputs between the upstream damand the gauge, and no dams on tributaries with an estimateddrainage area larger than the mainstem river of the candidatedam. Flow gauges on dammed rivers were located 0.1–74 kmdownstream of dams (mean � 17 km, median � 12 km). Onlyregions with at least two gauges were included, for a total of 186gauges on currently regulated rivers in 16 regions (Fig. 1). Forthese gauges there were, on average, 32 years of predam dailyf low data and 33 years of postdam data. All streamflow datawere obtained from the U.S. Geological Survey National WaterInformation System (ref. 49; http://waterdata.usgs.gov/nwis).
For the same regions, 317 reference (undammed) rivers wereselected from the U.S. Geological Survey’s sentinel gauge net-work. These gauges, which include most of the HydroclimaticData Network gauges (50), are relatively unaffected by flowregulation and characterize major ecoregions and river basins(ref. 51; http://water.usgs.gov/nsip/federalgoals.html); therefore,discharge records from these gauges can be used to describehydrologic changes caused by factors other than flow regulation,e.g., climate change.
Drainage area ranged from 57 to 723,902 km2 (median � 1,202km2) for dammed rivers and from 19 to 16,757 km2 (median �627 km2) for reference rivers. For the 186 dammed river, 3% ofbasins ranged from 27 to 131 km2 (about third order; ref. 28),29% from 132 to 620 km2 (about fourth order), 37% from 621to 2,946 km2 (about fifth order), 18% from 2,947 to 13,993 km2
(about sixth order), and 13% from 13,994 to 66,552 km2 (aboutseventh order, with six of these from arid lands having drainageareas estimated in the eighth-order range). For these sameranges of drainage areas for the 317 reference rivers, thepercentages were 7%, 42%, 42%, 9%, and 1%, respectively.
To compare changes in flow regimes for reference versusregulated rivers over comparable time periods, we divided theflow records for each of the reference rivers into two time seriesthat corresponded to the free-flowing and regulated periods forthe dammed rivers. Specifically, for each reference river in eachregion, we calculated a predam and postdam flow record basedon the dam construction dates for each of the regulated rivers inthat region. Thus, each reference river had as many replicatepredam vs. postdam simulations as there were dammed rivers inthe region (median � 9). We then averaged the replicatedpredam and postdam hydrologic variables for each river togenerate that river’s predam and postdam flow regime. Onaverage, the reference gauges had 32 years of predam and 31years of postdam daily streamflow data.
There are �8.4 � 106 km of stream and river channels in thecontinental U.S. (28). Of this total, small streams (first–secondorder) comprise 73% of total distance, intermediate rivers(third–seventh order) 26.5%, and large to very large rivers(eighth–10th order) 0.5%. In the National Inventory of Damsonly 39% of dams report drainage areas, and of these 37% arein the range associated with third- to seventh-order rivers.Applying this fraction to all dams in the database, we estimate�28,500 dams occur on these third- to seventh-order riverchannels nationwide, for an average of one dam every 48 km. Inour analysis, we excluded small streams because suitable stream-flow records are relatively sparse and streams of this size couldnot be resolved with our river reach Geographic InformationSystem coverage. We also removed large to very large riversbecause they are typically influenced by multiple upstream damsand thus lack adequate predam flow records.
Definition of Flow Regimes. We defined the natural f low regime ofa river in terms of the magnitude, frequency, duration, andtiming of extreme high flows and low flows. These four flowcomponents comprise a regime of hydrologic disturbance, andtogether they generate much of the temporal variation thatmaintains ecological and evolutionary distinctiveness within andamong rivers (12, 13, 20). Specifically, we defined 16 hydrologicmetrics to characterize the variable flow regime for each river:two flow classes (high and low) � four components � two timescales (long-term mean and interannual variation), which werecalculated separately for the predam and postdam periods. Highflows were defined as the average maximum annual 24-h dis-charge (magnitude), the number of times per year that the 24-hdaily f low exceeds the average 1-day predam (natural) maximum(frequency), the number of days per year the mean averagemaximum predam flow is exceeded (duration), and the averageJulian date of the annual maximum flow (timing). For each ofthese four variables the interannual coefficient of variation wasalso calculated. The same procedures were used to develop thelow flow metrics, except that the threshold quantity was based onthe average annual 7-day low flow.
Statistical Analysis. We used an ANOSIM based on the Bray-Curtis dissimilarity coefficient (52) to test the null hypothesis ofno difference in flow regimes (according to the 16 flow metrics)among all 16 regions using PRIMER version 5.2.9 software (53).By comparing the regional-scale differences in flow regimes inthe period before versus after damming, it is possible to assessthe degree to which dams have diminished, or homogenized,regional-scale differences in flow regimes over the course of the20th century.
ANOSIM tests for differences in rank dissimilarity between a
Fig. 4. Relative contributions of 16 hydrologic metrics to flow homogeni-zation for dammed rivers in 16 hydroregions. Metrics include magnitude,duration, frequency, and timing for average high flows and low flows andtheir interannual coefficient of variation (CV). For each region, the size of thecircle represents the percent change in the relative importance of the metricfor describing interregional flow difference from predam to postdam periods.Filled symbols indicate an increase in the magnitude of the metric frompredam to postdam period for each region, and unfilled symbols indicate adecrease. Regions are ordered from left to right according to the increasingdegree of homogenization (i.e., based on the mean �� R).
5736 � www.pnas.org�cgi�doi�10.1073�pnas.0609812104 Poff et al.
priori-defined groups (here, rivers in hydroregions) comparedwith randomly assigned groups. The ANOSIM statistic R, whichis based on the difference in the mean ranks between hydrore-gions and within hydroregions, is scaled from �1 to �1 anddescribes the hydrologic uniqueness for each region. A value of1 indicates that all rivers within a region are more similar to oneanother than to any rivers from different regions; a value of 0indicates that there is no difference among rivers across regions;and, a value of �1 indicates that all rivers within regions are lesssimilar to one another than any rivers from different regions(54). ANOSIM is particularly suited for this analysis as it canexplicitly test for differences in flow regime characteristicsbetween hydroregions based on an interpretable statistic thatmeasures how dissimilar regions are. Further, because ANOSIMcompares rank to random comparisons, it is robust againstinflated probability of significance given multiple comparisons(Fig. 3) and to differences in sample size (i.e., between dammedand reference rivers) (54).
A value of R was calculated for each region for the predam andpostdam periods. This was done separately for the 186 regulatedrivers and the 317 free-flowing rivers. The difference in Rbetween any two regions before dams and after dams, �R, is ameasure of how dams have changed the similarity of flowregimes for those specific regions. A positive �R indicatesincreased flow similarity among the two regions (i.e., homoge-nization), whereas a negative �R indicates decreased flowsimilarity among the two regions. For our data set there are 120
such pairwise comparisons of regional changes in flow regimesassociated with damming. Likewise, there are 120 pairwisecomparisons for the predam and postdam periods for thereference gauges.
To test the hypothesis of continental–scale homogenization offlow regimes, we first calculated the average of the 15 pairwise�R values for each region (designated as �� R). Second, we useda one-tailed Student’s t test to evaluate whether the global �� R(i.e., average across all 16 regional �� Rs) was both positive (i.e.,�0 indicating continental-scale homogenization) and greaterthan that measured for the reference, unregulated rivers.
To quantify the relative contributions of the 16 hydrologicmetrics to observed patterns of flow homogenization amongregions, we used the SIMPER procedure in PRIMER. For boththe predam and postdam periods, we calculated the relativecontributions of the individual metrics for explaining the ob-served difference between each hydroregion and all other re-gions. Percent change in the relative contributions from predamto postdam years was calculated. Values �0 indicate thosemetrics whose importance in distinguishing a particular regionfrom all others in the postdam years declined relative to itsimportance in the predam years, i.e. they contribute the most toflow homogenization.
This work was partially supported by Environmental Protection AgencyGrant R831367 (to N.L.P.), National Science Foundation Grant 0437961(to N.L.P.), and David H. Smith Postdoctoral Fellowships (to J.D.O. andD.M.M.).
1. Millennium Ecosystem Assessment (2005) Ecosystems and Human Well-being:Biodiversity Synthesis (World Resour Inst, Washington, DC).
2. Landres PB, Morgan P, Swanson FJ (1999) Ecol Appl 9:1179–1188.3. Sala OE, Chapin FS, Armesto JJ, Berlow E, Bloomfield J, Dirzo R, Huber-
Sanwald E, Huennake LF, Jackson RB, Kinzig A, et al. (2000) Science287:1770–1774.
4. Western D (1998) Proc Natl Acad Sci USA 98:5458–5465.5. Olden JD, Poff NL, Douglas MR, Douglas ME, Fausch KD (2004) Trends Ecol
Evol 19:18–24.6. Rahel FJ (2002) Annu Rev Ecol Syst 33:291–315.7. World Commission on Dams (2000) Dams and Development: A New Framework
for Decision-Making (Earthscan Publications, London).8. Syvitski JPM, Vorosmarty CJ, Kettner AJ, Green P (2005) Science 308:376–
380.9. Vorosmarty CJ, Lettenmaier D, Leveque C, Meybeck M, Pahl-Wostl, C,
Alcano J, Cosgrove W, Grassl H, Hoff H, Kabat P, et al. (2004) EOS Trans AmGeophys Union 85:509–513.
10. Nilsson C, Reidy CA, Dynesius M, Revenga C (2005) Science 308:405–408.11. Power ME, Dietrich WE, Finlay JC (1996) Environ Manage 20:887–895.12. Poff NL, Allan JD, Bain MB, Karr JR, Prestegaard KL, Richter B, Sparks R,
Stromberg J (1997) BioScience 47:769–784.13. Bunn SE, Arthington AH (2002) Environ Manage 30:492–507.14. Postel S, Richter B (2003) Rivers for Life: Managing Water for People and Nature
(Island, Washington, DC).15. Collier M, Webb RH, Schmidt JC (1996) Dams and Rivers: A Primer on the
Downstream Effects of Dams (US Geol Surv, Reston, VA), Circular 1126.16. Magilligan FJ, Nislow KH (2005) Geomorphology 71:61–78.17. Graf WL (2006) Geomorphology 79:336–360.18. Pringle CM, Freeman MC, Freeman BJ (2000) BioScience 50:807–823.19. Naiman RJ, Decamps H, McClain HE (2005) Riparia: Ecology, Conservation,
and Management of Streamside Communities (Elsevier, New York).20. Lytle DA, Poff NL (2004) Trends Ecol Evol 19:97–100.21. Haines AT, Finlayson BL, McMahon TA (1988) Appl Geogr 8:255–272.22. Puckridge JT, Sheldon F, Walker KF, Boulton AJ (1998) Marine Freshw Res
49:55–72.23. Richter BD, Baumgartner JV, Powell J, Braun DP (1996) Conserv Biol
10:1163–1174.24. Olden JD, Poff NL (2003) River Res Appl 19:101–121.25. Lins HF, Slack JR (1999) Geophys Res Lett 25:227–230.26. McCabe GJ, Wolock DM (2002) Geophys Res Lett 29:2185.27. US Army Corps of Engineers (2000) National Inventory of Dams (Fed Emerg
Manage Agency, Washington, DC).28. Leopold LB, Wolman MG, Miller JP (1964) Fluvial Processes in Geomorphol-
ogy (Freeman, San Francisco).
29. Echeverria JD, Barrow P, Roos-Collins R (1989) Rivers at Risk: The ConcernedCitizen’s Guide to Hydropower (Island, Washington, DC).
30. Richter BR, Baumgartner JV, Braun DP, Powell J (1998) Regul River ResManage 14:329–340.
31. Benke AC (1990) J N Am Benthol Soc 9:77–88.32. Resh VH, Brown AV, Covich AP, Gurtz ME, Li HW, Minshall GW, Reice SR,
Sheldon AL, Wallace JB, Wissmar R (1988) J N Am Benthol Soc 7:433–455.33. Rahel FJ (2000) Science 288:854–856.34. Marchetti MP, Light T, Feliciano J, Armstrong T, Hogan J, Viers, Moyle PB
(2001) in Biotic Homogenization, eds Lockwood JL, McKinney ML (Kluwer,New York), pp 259–278.
35. Olden JD, Poff NL, Bestgen KR (2006) Ecol Monogr 76:25–40.36. Mooney H, Cropper A, Reid W (2005) Nature 434:561–562.37. Palmer MA, Bernhardt E, Chornesky E, Collins S, Dobson A, Duke C, Gold
B, Jacobson R, Kingsland S, Kranz R, et al. (2004) Science 304:1251–1252.38. Myers N, Knoll AH (2001) Proc Natl Acad Sci USA 98:5389–5392.39. Stanford JA, Ward JV, Liss WJ, Frissell CA, Williams RN, Lichatowich JA,
Coutant CC (1996) Regul Rivers 12:391–413.40. Poff NL, Allan JD, Palmer MA, Hart DD, Richter BD, Arthington AH, Meyer
JL, Stanford JA, Rogers KH (2003) Front Ecol Environ 1:298–306.41. Richter BD, Mathews R, Harrison DL, Wigington R (2003) Ecol Appl
13:206–224.42. Bengtsson J, Angelstram P, Elmqvist T, Emanuelsson U, Folke C, Ihse M,
Moberg F, Nystrom M (2003) Ambio 32:389–396.43. Saunders DL, Meeuwig JJ, Vincent AC (2002) Conserv Biol 16:30–41.44. US Forest Service (2005) Description of the Ecoregions of the United States (US
For Serv, Washington, DC), 2nd Ed.45. Lins HF (1997) Water Res Res 33:1655–1667.46. Geiger R, Pohl W (1954) Erdkunde 8:58–61.47. Poff NL (1996) Freshw Biol 36:71–91.48. US Environmental Protection Agency (2001) Better Assessment Science Inte-
grating Point and Nonpoint Sources (BASINS) (US Environ Protect Agency,Washington, DC), Publication EPA823B01001, Version 3.0.
49. US Geological Survey (2005) NWISWeb Data for the Nation (US Geol Surv,Reston, VA).
50. Slack JR, Landwehr JM (1992) Hydro-Climatic Data Network: A U.S. GeologicalSurvey Streamflow Data Set for the United States for the Study of ClimateVariations, 1874–1988 (US Geol Surv, Reston, VA), Open File Report 92-129.
51. US Geological Survey (2005) National Streamflow Information Program (USGeol Surv, Reston, VA).
52. Bray JR, Curtis JT (1957) Ecol Monogr 27:326–349.53. Clarke KR, Gorley RN (2001) Primer v5: User Manual/Tutorial (Primer-E Ltd,
Plymouth, MA).54. Clarke KR (1993) Austr J Ecol 18:117–143.
Poff et al. PNAS � April 3, 2007 � vol. 104 � no. 14 � 5737
SUST
AIN
ABI
LITY
SCIE
NCE
ECO
LOG
YEN
VIR
ON
MEN
TAL
SCIE
NCE
SSE
ECO
MM
ENTA
RY