homicide in california 2010 - attorney general of...
TRANSCRIPT

Homicide in California�
2010�Kamala D. Harris, attorney General • California Department of JustiCe
California Homicide Statistics for 2010
Homicide in California, 2010, contains information about the crime of homicide and its victims, and demographic data on persons arrested for homicide. Information about the number of persons sentenced to death, the number of peace officers killed in the line of duty, and justifiable homicide is also included. This report includes data for 2010 and prior years.
Homicide Crimes
From 2009 to 2010, the rate of homicide crimes per 100,000 population decreased 7.8 percent (5.1 to 4.7). This marks the fifth consecutive year of decline. Comparing 2001 to 2010, the homicide crime rate decreased 25.4 percent (6.3 to 4.7).
Over the last decade, the homicide rate ranged from a high of 6.8 in 2002 and 2005 to this year’s low of 4.7, the lowest homicide crime rate since 1966.
The homicide clearance rate, the percentage of crimes reported that have been cleared, has increased for the fifth consecutive year. Over the last decade, the homicide clearance rate ranged from a low of 49.6 percent in 2001 to this year’s high of 63.8 percent.
In 2010:
zz 80.3 percent of homicide victims were male, 19.7 percent were female.
percent were white and 7.4 percent were categorized as “other.”
zz Over half (52.9 percent) of white victims were aged “40 and over,” while the largest proportion of Hispanic and black victims were aged 18-29 (49.3 and 48.7 percent, respectively).
zz Females were more likely to be killed in their residence, while males were more likely to be killed on streets or sidewalks.
zz When the victim-offender relationship was identified, the largest proportion of victims (44.4 percent) were killed by friends or acquaintances. However, a greater percentage of black victims were killed by strangers than were white or Hispanic (47.7 vs. 25.4 and 35.4, respectively).
zz Of the homicides where the weapon was identified, the majority (71.2 percent) involved a firearm.
zz 44.5 percent of homicide victims were Hispanic, 29.6 percent were black, 18.2

zz Among California’s 35 most populous
counties, Monterey County and Merced County experienced the highest homicide rate (10.0 each); Placer County experienced the lowest (0.6).
zz Of the homicides where the contributing circumstance was known, 36.1 percent were gang-related and 35.4 percent were the result of an argument.
Arrests
From 2009 to 2010, the homicide arrest rate decreased 10.0 percent (6.0 to 5.4 per 100,000 population at risk).
Comparing 2001 to 2010, the homicide arrest rate decreased 18.2 percent (6.6 to 5.4).
From 2001 to 2010, the overwhelming majority of homicide arrestees and victims were male.
From 2001 to 2010, the largest percentage of homicide arrestees and victims were Hispanic.
From 2001 to 2010, the largest percentage of homicide arrestees and victims were aged 18-29.
In 2010:
zz 87.8 percent of homicide arrestees were male, 12.2 percent were female.
zz 48.7 percent of homicide arrestees were Hispanic, 25.3 percent were black, 17.9
percent were white, and 8.2 percent were categorized as “other.”
zz A greater percentage of white arrestees were female than were Hispanic or black (20.8 vs. 8.7 and 13.3).
zz The largest proportion (39.9 percent) of white arrestees were aged 40 and over, while the largest proportion of Hispanic and black arrestees were aged 18-29 (62.7 and 56.5 percent, respectively).
Death Penalty Sentences
By the end of 2010, there were 709 persons under sentence of death in California. Of these, 34 were sentenced in 2010, ten of which were in Los Angeles County.
Peace Officers Killed in the Line of Duty
Four California peace officers were feloniously killed in the line of duty in 2010. Between 2001 and 2010, 45 peace officers were killed in the line of duty.
Justifiable Homicides
In 2010, justifiable homicides by a peace officer were most often the result of a felon attacking a peace officer (50.6 percent).
2

List of Data Tables Crimes
Table 1 Violent Crimes, 2001–2010 ......................................................................................................................................6
Table 2 Homicide Crimes, 2001–2010 By Gender of Victim...........................................................................................................................................................7
Table 3 Homicide Crimes, 2001–2010 By Race/Ethnic Group of Victim................................................................................................................................8
Table 4 Homicide Crimes, 2001–2010 By Age of Victim...................................................................................................................................................................9
Table 5 Homicide Crimes, 2001–2010 By Gender of Victim........................................................................................................................................................10
Table 6 Homicide Crimes, 2001–2010 By Race/Ethnic Group of Victim.............................................................................................................................10
Table 7 Homicide Crimes, 2001–2010 By Age of Victim................................................................................................................................................................11
Table 8 Homicide Crimes, 2010 Race/Ethnic Group of Victim by Gender of Victim...................................................................................11
Table 9 Homicide Crimes, 2010 Race/Ethnic Group of Victim by Age of Victim............................................................................................12
Table 10 Homicide Crimes, 2010 Race/Ethnic Group of Victim by Gender and Age of Victim..............................................................13
Table 11 Homicide Crimes, 2001–2010 By Relationship of Victim to Offender...............................................................................................................14
Table 12 Homicide Crimes, 2010 Gender and Race/Ethnic Group of Victim by Relationship of Victim to Offender.............15
Table 13 Homicide Crimes, 2010 Age of Victim by Relationship of Victim to Offender..............................................................................16
Table 14 Homicide Crimes, 2001–2010 By County..............................................................................................................................................................................17
Table 15 Homicide Crimes, 2001–2010 By Season and Month of Incident........................................................................................................................21
Table 16 Homicide Crimes, 2010 Gender and Race/Ethnic Group of Victim by Day of Incident..........................................................22
Table 17 Homicide Crimes, 2010 Age of Victim by Day of Incident..........................................................................................................................23
3
Table 18 Homicide Crimes, 2001–2010 By Location of Homicide.............................................................................................................................................24�
Table 19 Homicide Crimes, 2010�Gender and Race/Ethnic Group of Victim by Location of Homicide...........................................25�
Table 20 Homicide Crimes, 2010�Age of Victim by Location of Homicide............................................................................................................26�
Table 21 Homicide Crimes, 2001–2010 By Type of Weapon Used............................................................................................................................................27�
Table 22 Homicide Crimes, 2010�Gender and Race/Ethnic Group of Victim by Type of Weapon Used..........................................28�
Table 23 Homicide Crimes, 2010�Age of Victim by Type of Weapon Used...........................................................................................................29�
Table 24 Homicide Crimes, 2001–2010 By Contributing Circumstance...............................................................................................................................30�
Table 25 Homicide Crimes, 2010�Gender and Race/Ethnic Group of Victim by Contributing Circumstance.............................31�
Table 26 Homicide Crimes, 2010�Age of Victim by Contributing Circumstance..............................................................................................32�
Table 27 Homicide Crimes, 2010�Contributing Circumstance by Relationship of Victim to Offender.............................................33�
Table 28 Homicide Crimes Cleared, 2001–2010 Number Reported, Number Cleared, and Clearance Rate..................................................................34�
Arrests
Table 29 Felony Arrests for Selected Violent Offenses, 2001–2010.............................................................35�
Table 30 Homicide Arrests, 2001–2010 By Gender of Arrestee...................................................................................................................................................36�
Table 31 Homicide Arrests, 2001–2010 By Race/Ethnic Group of Arrestee........................................................................................................................36�
Table 32 Homicide Arrests, 2001–2010 By Age of Arrestee...........................................................................................................................................................37�
Table 33 Homicide Arrests, 2010�Race/Ethnic Group of Arrestee by Gender and Age of Arrestee....................................................37�
Table 34 Homicide Arrests, 2010�Race/Ethnic Group of Arrestee by Gender and Age of Arrestee....................................................38�
4

Death Penalty Sentences
Table 35 Persons Under California Sentence of Death, 1978–2010.............................................................39
Table 36 Persons Sentenced to Death, 2010 Sentencing County by Gender, Race/Ethnic Group, and Age..........................................................40
Peace Officers Killed in the Line of Duty
Table 37 Homicide Crimes and Peace Officers Killed in the Line of Duty, 2001–2010..................41�
Table 38 Peace Officers Killed in the Line of Duty, 2010 Gender and Race/Ethnic Group of Deceased by Location and Weapon..................................42�
Justifiable Homicides
Table 39 Justifiable Homicides by Peace Officers or Private Citizens, 2010 By Gender, Race/Ethnic Group, and Age of Deceased..........................................................................43�
Table 40 Justifiable Homicides by Peace Officers or Private Citizens, 2010 By Location of Justifiable Homicide...................................................................................................................44�
Table 41 Justifiable Homicides by Peace Officers or Private Citizens, 2010 By Contributing Circumstance...............................................................................................................................45�
Table 42 Justifiable Homicides by Peace Officers or Private Citizens, 2010 By Type of Weapon Used............................................................................................................................................45�
Population
Table 43 Population Estimates, 1960–2010....................................................................................................................46�
5

Table 1 VIOLENT CRIMES, 20012010
Number, Rate per 100,000 Population, and Percent Change
Year(s) Total Homicide Forcible
rape Robbery
Aggravated assault
Number
2007................... 2006...................
2003................... 2002................... 2001...................
2010................. 2009................. 2008.................
2005................... 2004...................
163,957 174,579 185,233 191,493 194,128
189,593 197,432 204,591 207,988 210,510
1,809 1,970 2,143 2,258 2,483
2,503 2,394 2,402 2,392 2,201
8,325 8,698 8,906 9,047 9,213
9,345 9,598 9,918
10,176 9,882
58,100 64,006 69,391 70,702 70,961
63,424 61,573 63,597 64,805 63,299
95,723 99,905
104,793 109,486 111,471
114,321 123,867 128,674 130,615 135,128
Percent change in number
20072008......... 20062007......... 20052006.........
20022003......... 20012002.........
20092010......... 20082009.........
20042005......... 20032004.........
20012010.........
6.1 5.8 3.3 1.4 2.4
4.0 3.5 1.6 1.2
22.1
8.2 8.1 5.1 9.1 0.8
4.6 0.3 0.4 8.7
17.8
4.3 2.3 1.6 1.8 1.4
2.6 3.2 2.5 3.0
15.8
9.2 7.8 1.9 0.4 11.9
3.0 3.2 1.9 2.4
8.2
4.2 4.7 4.3 1.8 2.5
7.7 3.7 1.5 3.3
29.2
Rate per 100,000 population1
2008................... 2007................... 2006...................
2003................... 2002................... 2001...................
2009...................
2005................... 2004...................
2010................... 422.3 453.6 485.6 507.0 518.4
512.3 539.6 569.4 589.2 605.6
4.7 5.1 5.6 6.0 6.6
6.8 6.5 6.7 6.8 6.3
21.4 22.6 23.3 24.0 24.6
25.3 26.2 27.6 28.8 28.4
149.6 166.3 181.9 187.2 189.5
171.4 168.3 177.0 183.6 182.1
246.5 259.6 274.7 289.9 297.7
308.9 338.5 358.1 370.0 388.8
Percent change in rate
20072008......... 20062007......... 20052006.........
20022003......... 20012002.........
20012010.........
20042005......... 20032004.........
20082009......... 20092010......... 6.9
6.6 4.2 2.2 1.2
5.1 5.2 3.4 2.7
30.3
7.8 8.9 6.7 9.1 2.9
4.6 3.0 1.5 7.9
25.4
5.3 3.0 2.9 2.4 2.8
3.4 5.1 4.2 1.4
24.6
10.0 8.6 2.8 1.2 10.6
1.8 4.9 3.6 0.8
17.8
5.0 5.5 5.2 2.6 3.6
8.7 5.5 3.2 4.8
36.6 Note: Rates may not add to total because of rounding. 1 Rates are based on annual population estimates provided by the Demographic Research
Unit, California Department of Finance.
6

7
Tab
le 2
HO
MIC
IDE
CR
IME
S, 2
001
2010
By
Gen
der
ofV
ictim
N
umbe
r,P
erce
nt, a
ndR
ate
per
100,
000
Pop
ulat
ion
Gen
der
of v
ictim
20
01
2002
20
03
2004
20
05
2006
20
07
2008
20
09
2010
P
erce
nt c
hang
e20
01
2010
20
09
2010
T
otal
Mal
e2
Fem
ale
Rat
e..…
....…
...…
......
.....
Per
cent
of p
opul
atio
n....
...R
ate.
......
....…
.…...
......
.....
Num
ber
of v
ictim
s....
.....
Per
cent
of t
otal
vic
tims.
.P
opul
atio
n1 ......
...…
......
....
Per
cent
of p
opul
atio
n….
Rat
e....
.....…
.…...
......
....
Num
ber
of v
ictim
s....
.....
Per
cent
of t
otal
vic
tims.
.P
opul
atio
n1 ......
...…
......
....
Per
cent
of p
opul
atio
n….
Pop
ulat
ion1 ...
......
…...
......
.
Num
ber
of v
ictim
s....
......
..P
erce
nt o
f vic
tims.
......
......
2,
201
100.
0%
34,7
58,0
00
100.
0%
6.3
1,75
6 79
.8%
17
,694
,411
50
.2%
9.
9
445
20.2
%
17,5
38,9
24
49.8
%
2.5
2,39
2 10
0.0%
35
,301
,000
10
0.0%
6.
8
1,93
8 81
.0%
17
,984
,195
50
.2%
10
.8
454
19.0
%
17,8
18,0
43
49.8
%
2.5
2,40
2 10
0.0%
35
,934
,000
10
0.0%
6.
7
1,97
2 82
.1%
18
,270
,127
50
.2%
10
.8
430
17.9
%
18,0
93,3
75
49.8
%
2.4
2,39
4 10
0.0%
36
,590
,814
10
0.0%
6.
5
1,99
2 83
.2%
18
,161
,654
49
.9%
11
.0
402
16.8
%
18,2
14,7
57
50.1
%
2.2
2,50
3 10
0.0%
37
,004
,661
10
0.0%
6.
8
2,10
1 83
.9%
18
,403
,806
49
.9%
11
.4
402
16.1
%
18,4
50,4
18
50.1
%
2.2
2,48
3 10
0.0%
37
,444
,385
10
0.0%
6.
6
2,07
0 83
.4%
18
,645
,304
49
.9%
11
.1
413
16.6
%
18,6
89,6
64
50.1
%
2.2
2,25
8 10
0.0%
37
,771
,431
10
0.0%
6.
0
1,86
5 82
.6%
18
,870
,986
49
.9%
9.
9
393
17.4
%
18,9
39,5
96
50.1
%
2.1
2,14
3 10
0.0%
38
,148
,493
10
0.0%
5.
6
1,76
6 82
.4%
19
,087
,058
49
.9%
9.
3
377
17.6
%
19,1
59,5
40
50.1
%
2.0
1,97
0 10
0.0%
38
,487
,889
10
0.0%
5.
1
1,61
9 82
.2%
19
,305
,709
49
.9%
8.
4
351
17.8
%
19,3
82,5
84
50.1
%
1.8
1,80
9 10
0.0%
38
,826
,898
10
0.0%
4.
7
1,45
2 80
.3%
19
,526
,883
49
.9%
7.
4
357
19.7
%
19,6
08,7
93
50.1
%
1.8
17.
8 8
.2
11.7
0.
9
25.
4 7
.8
17.
3 1
0.3
10.4
1.
1
25.
3 1
1.9
19.
8 1.
7
11.8
1.
2
28.
0 0.
0 N
otes
: R
ates
are
base
d on
ann
ualp
opul
atio
n es
timat
es p
rovi
ded
by th
e D
emog
raph
ic R
esea
rch
Uni
t,C
alifo
rnia
Dep
artm
ento
fFin
ance
.R
ates
are
calc
ulat
ed u
sing
the
popu
latio
n fo
rea
ch s
ubgr
oup
show
n; th
eref
ore,
they
will
nota
dd to
the
rate
cal
cula
ted
for
the
tota
lpop
ulat
ion.
Pop
ulat
ion
brea
kdow
ns b
yge
nder
will
nota
dd to
tota
lbec
ause
ofv
aria
tions
in p
opul
atio
n so
urce
dat
a.
The
"per
cent
ofpo
pula
tion"
cate
gory
for
mal
e an
dfe
mal
e w
as c
alcu
late
dus
ing
the
sum
oft
he m
ale
and
fem
ale
popu
latio
ns.
1B
egin
ning
in20
04,p
opul
atio
n es
timat
es a
re b
ased
on
the
2000
Cen
sus.
Pre
viou
s po
pula
tion
estim
ates
are
bas
ed o
n re
visi
ons
ofth
e 19
90C
ensu
s.R
eade
rs a
re a
dvis
edto
exe
rcis
e ca
re
in in
terp
retin
gch
ange
s in
per
cent
and
rate
bet
wee
n de
cenn
ialc
ensu
s sa
mpl
es.
2T
he"m
ale"
cate
gory
incl
udes
hom
icid
e vi
ctim
s w
hose
gen
der
coul
d no
tbe
dete
rmin
ed:
2001
and
2002
incl
ude
one
each
.

8
Tab
le 3
HO
MIC
IDE
CR
IME
S, 2
001
2010
By
Rac
e/E
thni
c G
roup
of V
ictim
N
umbe
r,P
erce
nt, a
ndR
ate
per
100,
000
Pop
ulat
ion
Rac
e/et
hnic
gro
upof
vic
tim
2001
20
02
2003
20
04
2005
20
06
2007
20
08
2009
20
10
Per
cent
chan
ge
2001
20
10
2009
20
10
Tot
alN
umbe
r of
vic
tims.
......
......
P
erce
nt o
f vic
tims.
.…...
.....
Pop
ulat
ion1 ...
......
…...
......
.. P
erce
nt o
f pop
ulat
ion.
......
. R
ate.
..…...
.…...
......
......
.....
Whi
teN
umbe
r of
vic
tims.
…...
.. P
erce
nt o
f tot
al v
ictim
s..
Pop
ulat
ion1 ...
......
…...
......
.. P
erce
nt o
f pop
ulat
ion.
...
Rat
e....
.…...
....…
......
.....
His
pani
cN
umbe
r of
vic
tims…
......
P
erce
nt o
f tot
al v
ictim
s..
Pop
ulat
ion1 ...
......
…...
......
.. P
erce
nt o
f pop
ulat
ion.
...
Rat
e....
.…...
..…...
......
....
Bla
ck Num
ber
of v
ictim
s…...
...
Per
cent
of t
otal
vic
tims.
. P
opul
atio
n1 ......
...…
......
.....
Per
cent
of p
opul
atio
n....
R
ate.
......
…..…
......
......
..
Oth
er2
Num
ber
of v
ictim
s…...
...
Per
cent
of t
otal
vic
tims.
. P
opul
atio
n1 ......
...…
......
.....
Per
cent
of p
opul
atio
n....
. R
ate…
....…
..……
......
.....
Unk
now
nN
umbe
r of
vic
tims.
.…...
. P
erce
nt o
f tot
al v
ictim
s..
Pop
ulat
ion1 ...
......
…...
......
.. P
erce
nt o
f pop
ulat
ion…
. R
ate.
......
.…...
.….…
......
.
2,20
1 10
0.0%
34
,758
,000
10
0.0%
6.
3
442
20.1
%
17,5
03,2
25
49.7
%
2.5
985
44.8
%
11,0
20,7
10
31.3
%
8.9
622
28.3
%
2,35
5,81
2 6.
7%
26.4
145
6.6%
4,
353,
588
12.4
%
3.3 7
0.3%
2,39
2 10
0.0%
35
,301
,000
10
0.0%
6.
8
417
17.4
%
17,5
73,8
50
49.1
%
2.4
1,06
6 44
.6%
11
,352
,852
31
.7%
9.
4
734
30.7
%
2,37
3,39
9 6.
6%
30.9
166
6.9%
4,
502,
137
12.6
%
3.7 9
0.4%
2,40
2 10
0.0%
35
,934
,000
10
0.0%
6.
7
444
18.5
%
17,6
35,2
96
48.5
%
2.5
1,05
3 43
.8%
11
,685
,915
32
.1%
9.
0
713
29.7
%
2,39
0,41
1 6.
6%
29.8
185
7.7%
4,
651,
880
12.8
%
4.0 7
0.3%
2,39
4 10
0.0%
36
,590
,814
10
0.0%
6.
5
422
17.6
%
15,9
67,7
75
43.9
%
2.6
1,03
4 43
.2%
12
,816
,038
35
.2%
8.
1
766
32.0
%
2,42
5,06
6 6.
7%
31.6
167
7.0%
5,
167,
532
14.2
%
3.2 5
0.2%
2,50
3 10
0.0%
37
,004
,661
10
0.0%
6.
8
419
16.7
%
15,8
52,9
37
43.0
%
2.6
1,13
9 45
.5%
13
,220
,223
35
.9%
8.
6
758
30.3
%
2,45
6,78
3 6.
7%
30.9
182
7.3%
5,
324,
281
14.4
%
3.4 5
0.2%
2,48
3 10
0.0%
37
,444
,385
10
0.0%
6.
6
432
17.4
%
15,7
66,7
36
42.2
%
2.7
1,12
9 45
.5%
13
,603
,759
36
.4%
8.
3
736
29.6
%
2,49
1,24
7 6.
7%
29.5
178
7.2%
5,
473,
226
14.7
%
3.3 8
0.3%
2,25
8 10
0.0%
37
,771
,431
10
0.0%
6.
0
372
16.5
%
16,4
23,5
30
43.4
%
2.3
1,05
5 46
.7%
13
,539
,990
35
.8%
7.
8
665
29.5
%
2,26
3,69
0 6.
0%
29.4
156
6.9%
5,
583,
372
14.8
%
2.8 10
0.
4%
2,14
3 10
0.0%
38
,148
,493
10
0.0%
5.
6
389
18.2
%
16,4
28,2
38
43.0
%
2.4
1,00
3 46
.8%
13
,858
,454
36
.3%
7.
2
577
26.9
%
2,27
1,25
8 6.
0%
25.4
159
7.4%
5,
688,
648
14.9
%
2.8 15
0.
7%
1,97
0 10
0.0%
38
,487
,889
10
0.0%
5.
1
392
19.9
%
16,4
33,3
17
42.5
%
2.4
913
46.3
%
14,1
82,6
66
36.8
%
6.4
534
27.1
%
2,27
9,11
8 5.
9%
23.4
120
6.1%
5,
793,
192
15.1
%
2.1 11
0.
6%
1,80
9 10
0.0%
38
,826
,898
10
0.0%
4.
7
329
18.2
%
16,4
38,7
84
42.0
%
2.0
805
44.5
%
14,5
12,8
17
37.4
%
5.5
536
29.6
%
2,28
7,19
0 5.
8%
23.4
133
7.4%
5,
896,
885
15.2
%
2.3 6
0.3%
17.
8 8
.2
11.7
0.
9
25.
4 7
.8
25.
6 1
6.1
6.1
0.
0
20.
0 1
6.7
18.
3 1
1.8
31.7
2.
3
38.
2 1
4.1
13.
8 0.
4
2.9
0.
4
11.
4 0.
0
8.3
10
.8
35.4
1.
8
30.
3 9.
5
Not
es:
Per
cent
ages
may
nota
ddto
100
.0be
caus
e of
roun
ding
.R
ates
are
base
don
ann
ualp
opul
atio
n es
timat
espr
ovid
edby
the
Dem
ogra
phic
Res
earc
hU
nit,
Cal
iforn
iaD
epar
tmen
tofF
inan
ce.
Rat
esar
eca
lcul
ated
usin
gth
e po
pula
tion
for
each
sub
grou
p sh
own;
ther
efor
e,th
ey w
illno
tadd
toth
e ra
te c
alcu
late
dfo
r th
e to
talp
opul
atio
n.P
opul
atio
n br
eakd
owns
byra
ce/e
thni
cgr
oup
will
nota
ddto
tota
lbec
ause
ofv
aria
tions
in p
opul
atio
n so
urce
dat
a.
Das
h in
dica
tes
that
the
perc
ento
fpop
ulat
ion
and
rate
for
the
"unk
now
n"ca
tego
ryca
nnot
be c
alcu
late
dbe
caus
e th
ere
are
no u
nkno
wn
race
/eth
nic
grou
ppo
pula
tion
data
. D
ash
may
also
indi
cate
that
a pe
rcen
tcha
nge
isno
tcal
cula
ted
whe
nth
e ba
se n
umbe
r is
less
than
50.
T
he"p
erce
ntof
popu
latio
n"ca
tego
ry fo
r ra
ce/e
thni
cgr
oup
was
calc
ulat
edus
ing
the
sum
of t
he r
ace/
ethn
icgr
oup
popu
latio
ns.
1B
egin
ning
in20
04,p
opul
atio
n es
timat
esar
eba
sed
on th
e 20
00C
ensu
s. P
revi
ous
popu
latio
n es
timat
esar
eba
sed
on r
evis
ions
ofth
e 19
90C
ensu
s. R
eade
rsar
ead
vise
dto
exer
cise
car
e in
inte
rpre
ting
chan
ges
in
perc
ent a
nd r
ate
betw
een
dece
nnia
l cen
sus
sam
ples
.2
Beg
inni
ng in
2004
,the
"ot
her"
cate
gory
incl
udes
the
new
rac
e/et
hnic
grou
p of
"mul
tira
cial
." T
he e
xten
tto
whi
chth
isne
wra
ce/e
thni
cgr
oup
effe
cts
othe
r po
pula
tion
estim
ates
isno
tkno
wn.

9
Tab
le4
HO
MIC
IDE
CR
IME
S, 2
001
2010
By
Age
ofV
ictim
N
umbe
r,P
erce
nt, a
ndR
ate
per
100,
000
Pop
ulat
ion
Age
of v
ictim
20
01
2002
20
03
2004
20
05
2006
20
07
2008
20
09
2010
Per
cent
chan
ge
2001
20
10
2009
20
10
Tot
alN
umbe
r of
vic
tims.
......
…
Per
cent
of v
ictim
s....
......
. P
opul
atio
n1 ......
..…...
......
. P
erce
nt o
f pop
ulat
ion.
.…
Rat
e....
......
......
...…
.…...
.
Und
er 1
8N
umbe
r of
vic
tims.
......
. P
erce
nt o
f tot
al v
ictim
s.
Pop
ulat
ion1 ...
.....…
......
.....
Per
cent
of p
opul
atio
n...
Rat
e....
....…
.....…
......
...
182
9N
umbe
r of
vic
tims.
......
. P
erce
nt o
f tot
al v
ictim
s.
Pop
ulat
ion1 ...
.....…
......
.....
Per
cent
of p
opul
atio
n...
Rat
e....
....…
.....…
......
...
303
9N
umbe
r of
vic
tims.
......
. P
erce
nt o
f tot
al v
ictim
s.
Pop
ulat
ion1 ...
.....…
......
.....
Per
cent
of p
opul
atio
n...
Rat
e....
....…
.....…
......
...
40 a
nd o
ver
Num
ber
of v
ictim
s....
....
Per
cent
of t
otal
vic
tims.
P
opul
atio
n1 ......
..…...
......
.. P
erce
nt o
f pop
ulat
ion.
.. R
ate.
......
.…...
..…...
......
Unk
now
nN
umbe
r of
vic
tims.
......
. P
erce
nt o
f tot
al v
ictim
s.
Pop
ulat
ion1 ...
.....…
......
.....
Per
cent
of p
opul
atio
n...
Rat
e....
....…
.....…
......
...
2,20
1 10
0.0%
34
,758
,000
10
0.0%
6.
3
252
11.4
%
9,93
2,91
3 28
.2%
2.
5
992
45.1
%
5,55
5,92
6 15
.8%
17
.9
426
19.4
%
5,53
5,62
0 15
.7%
7.
7
519
23.6
%
14,2
08,8
76
40.3
%
3.7 12
0.
5%
2,39
2 10
0.0%
35
,301
,000
10
0.0%
6.
8
247
10.3
%
10,0
95,9
03
28.2
%
2.4
1,09
8 45
.9%
6,
123,
037
17.1
%
17.9
449
18.8
%
4,99
4,72
0 14
.0%
9.
0
579
24.2
%
14,5
88,5
78
40.7
%
4.0 19
0.
8%
2,40
2 10
0.0%
35
,934
,000
10
0.0%
6.
7
240
10.0
%
10,2
48,2
37
28.2
%
2.3
1,10
0 45
.8%
5,
740,
606
15.8
%
19.2
486
20.2
%
5,38
4,17
0 14
.8%
9.
0
560
23.3
%
14,9
90,4
89
41.2
%
3.7 16
0.
7%
2,39
4 10
0.0%
36
,590
,814
10
0.0%
6.
5
269
11.2
%
9,57
5,52
0 26
.3%
2.
8
1,11
0 46
.4%
6,
160,
386
16.9
%
18.0
446
18.6
%
5,53
4,22
0 15
.2%
8.
1
569
23.8
%
15,1
06,2
85
41.5
%
3.8 0
0.0%
2,50
3 10
0.0%
37
,004
,661
10
0.0%
6.
8
285
11.4
%
9,62
0,51
1 26
.1%
3.
0
1,15
1 46
.0%
6,
260,
103
17.0
%
18.4
473
18.9
%
5,51
6,75
1 15
.0%
8.
6
579
23.1
%
15,4
56,8
59
41.9
%
3.7 15
0.
6%
2,48
3 10
0.0%
37
,444
,385
10
0.0%
6.
6
316
12.7
%
9,66
4,74
7 25
.9%
3.
3
1,14
7 46
.2%
6,
369,
559
17.1
%
18.0
418
16.8
%
5,51
6,60
9 14
.8%
7.
6
586
23.6
%
15,7
84,0
53
42.3
%
3.7 16
0.
6%
2,25
8 10
0.0%
37
,771
,431
10
0.0%
6.
0
270
12.0
%
10,0
07,5
01
26.5
%
2.7
998
44.2
%
6,32
1,49
2 16
.7%
15
.8
432
19.1
%
5,33
5,89
7 14
.1%
8.
1
552
24.4
%
16,1
45,6
92
42.7
%
3.4 6
0.3%
2,14
3 10
0.0%
38
,148
,493
10
0.0%
5.
6
273
12.7
%
10,0
03,8
96
26.2
%
2.7
906
42.3
%
6,50
0,28
8 17
.0%
13
.9
381
17.8
%
5,27
8,09
7 13
.8%
7.
2
569
26.6
%
16,4
64,3
17
43.0
%
3.5 14
0.
7%
1,97
0 10
0.0%
38
,487
,889
10
0.0%
5.
1
242
12.3
%
9,99
2,33
3 25
.8%
2.
4
838
42.5
%
6,68
6,54
3 17
.3%
12
.5
353
17.9
%
5,21
4,48
0 13
.5%
6.
8
528
26.8
%
16,7
94,9
37
43.4
%
3.1 9
0.5%
1,80
9 10
0.0%
38
,826
,898
10
0.0%
4.
7
216
11.9
%
9,98
9,39
7 25
.5%
2.
2
769
42.5
%
6,84
9,76
5 17
.5%
11
.2
351
19.4
%
5,14
5,89
0 13
.1%
6.
8
469
25.9
%
17,1
50,6
24
43.8
%
2.7 4
0.2%
17.
8 8
.2
11.7
0.
9
25.
4 7
.8
14.
3 1
0.7
0.6
0.0
12.
0 8
.3
22.
5 8
.2
23.3
2.
4
37.
4 1
0.4
17.
6 0
.6
7.0
1
.3
11.
7 0.
0
9.6
1
1.2
20.7
2.
1
27.
0 1
2.9
Not
es:
Per
cent
ages
may
nota
ddto
100.
0be
caus
e of
roun
ding
.R
ates
are
base
d on
annu
alpo
pula
tion
estim
ates
pro
vide
dby
the
Dem
ogra
phic
Res
earc
hU
nit,
Cal
iforn
iaD
epar
tmen
tofF
inan
ce.
Rat
es a
reca
lcul
ated
usi
ngth
e po
pula
tion
for
each
sub
grou
psh
own;
ther
efor
e,th
eyw
illno
tadd
to th
e ra
te c
alcu
late
d fo
rth
e to
talp
opul
atio
n.P
opul
atio
nbr
eakd
owns
by
age
will
nota
dd to
tota
lbec
ause
ofva
riatio
ns in
pop
ulat
ion
sour
ce d
ata.
D
ash
indi
cate
s th
atth
epe
rcen
tofp
opul
atio
nan
d ra
te fo
rth
e "u
nkno
wn"
cate
gory
cann
otbe
cal
cula
ted
beca
use
ther
e ar
e no
unk
now
nag
e po
pula
tion
data
.D
ash
may
also
indi
cate
that
a pe
rcen
tcha
nge
is n
otca
lcul
ated
whe
nth
e ba
se n
umbe
ris
less
than
50.
T
he "
perc
ento
fpop
ulat
ion"
cate
gory
for
age
grou
p w
as c
alcu
late
dus
ing
the
sum
of t
he a
ge p
opul
atio
ns.
1B
egin
ning
in20
04,p
opul
atio
nes
timat
es a
re b
ased
on
the
2000
Cen
sus.
Pre
viou
s po
pula
tion
estim
ates
are
bas
ed o
nre
visi
ons
ofth
e 19
90C
ensu
s.R
eade
rs a
re a
dvis
edto
exe
rcis
e ca
re i
nin
terp
retin
gch
ange
s in
per
cent
and
rate
bet
wee
n de
cenn
ialc
ensu
s sa
mpl
es.

Tab
le 5
HO
MIC
IDE
CR
IME
S, 2
001
2010
By
Gen
der
ofV
ictim
10
Yea
r(s)
T
otal
M
ale1
Fem
ale
Num
ber
Per
cent
N
umbe
r P
erce
nt
Num
ber
Per
cent
2008
......
......
...
2007
......
......
...
2006
......
......
...
2003
......
......
...
2002
......
......
...
2001
......
......
...
2004
......
......
...
2010
......
......
...20
09...
......
......
2005
......
......
...
1,80
9 10
0.0
1,97
0 10
0.0
2,14
3 10
0.0
2,25
8 10
0.0
2,48
3 10
0.0
2,50
3 10
0.0
2,39
4 10
0.0
2,40
2 10
0.0
2,39
2 10
0.0
2,20
1 10
0.0
1,45
2 80
.3
1,61
9 82
.2
1,76
6 82
.4
1,86
5 82
.6
2,07
0 83
.4
2,10
1 83
.9
1,99
2 83
.2
1,97
2 82
.1
1,93
8 81
.0
1,75
6 79
.8
357
19.7
35
1 17
.8
377
17.6
39
3 17
.4
413
16.6
402
16.1
40
2 16
.8
430
17.9
45
4 19
.0
445
20.2
1
The
"m
ale"
cate
gory
incl
udes
hom
icid
e vi
ctim
s w
hose
gen
der
coul
d no
tbe
dete
rmin
ed:
2001
and
200
2 in
clud
e on
e ea
ch.
Tab
le6
HO
MIC
IDE
CR
IME
S, 2
001
2010
By
Rac
e/E
thni
cG
roup
ofV
ictim
Yea
r(s)
T
otal
incl
udin
gun
know
n U
nkno
wn
Kno
wn
race
/eth
nic
grou
p of
vic
tim
Tot
al
Whi
te
His
pani
c B
lack
O
ther
N
umbe
r P
erce
nt
Num
ber
Per
cent
N
umbe
r P
erce
nt
Per
cent
N
umbe
r N
umbe
r P
erce
nt
2008
......
.....
2007
......
.....
2006
......
.....
2003
......
.....
2002
......
.....
2001
......
.....
2005
......
.....
2004
......
.....
2010
......
.....
2009
......
.....
2,25
82,
483
2,50
3
2,20
1
2,39
42,
402
2,39
2
1,80
9 1,
970
2,14
3
6 11
15
10 8 5 5 7 9 7
1,80
3 10
0.0
1,95
9 10
0.0
2,12
8 10
0.0
2,24
8 10
0.0
2,47
5 10
0.0
2,49
8 10
0.0
2,38
9 10
0.0
2,39
5 10
0.0
2,38
3 10
0.0
2,19
4 10
0.0
329
18.2
39
2 20
.0
389
18.3
37
2 16
.5
432
17.5
419
16.8
42
2 17
.7
444
18.5
41
7 17
.5
442
20.1
805
44.6
91
3 46
.6
1,00
3 47
.1
1,05
5 46
.9
1,12
9 45
.6
1,13
9 45
.6
1,03
4 43
.3
1,05
3 44
.0
1,06
6 44
.7
985
44.9
536
29.7
53
4 27
.3
577
27.1
66
5 29
.6
736
29.7
758
30.3
76
6 32
.1
713
29.8
73
4 30
.8
622
28.4
133
7.4
120
6.1
159
7.5
156
6.9
178
7.2
182
7.3
167
7.0
185
7.7
166
7.0
145
6.6
Not
e:P
erce
ntag
es m
ayno
tadd
to10
0.0
beca
use
ofro
undi
ng.

Tab
le 7
HO
MIC
IDE
CR
IME
S, 2
001
2010
By
Age
ofV
ictim
11
Yea
r(s)
T
otal
incl
udin
gun
know
n U
nkno
wn
Kno
wn
age
of v
ictim
T
otal
U
nder
18
182
9 30
39
40 a
nd o
ver
Per
cent
N
umbe
r N
umbe
r P
erce
nt
Per
cent
N
umbe
r N
umbe
rP
erce
nt
Per
cent
N
umbe
r
1,80
9 4
1,97
0 9
2008
......
......
.. 2,
143
14
2007
......
......
.. 2,
258
6 20
06...
......
.....
2,48
3 16
2,50
3 15
2,
394
0 20
03...
......
.....
2,40
2 16
20
02...
......
.....
2,39
2 19
20
01...
......
.....
2,20
1 12
2005
......
......
..20
04...
......
.....
2010
......
......
..20
09...
......
.....
1,80
5 10
0.0
1,96
1 10
0.0
2,12
9 10
0.0
2,25
2 10
0.0
2,46
7 10
0.0
2,48
8 10
0.0
2,39
4 10
0.0
2,38
6 10
0.0
2,37
3 10
0.0
2,18
9 10
0.0
216
12.0
24
2 12
.3
273
12.8
27
0 12
.0
316
12.8
285
11.5
26
9 11
.2
240
10.1
24
7 10
.4
252
11.5
769
42.6
83
8 42
.7
906
42.6
99
8 44
.3
1,14
7 46
.5
1,15
1 46
.3
1,11
0 46
.4
1,10
0 46
.1
1,09
8 46
.3
992
45.3
351
19.4
35
3 18
.0
381
17.9
43
2 19
.2
418
16.9
473
19.0
44
6 18
.6
486
20.4
44
9 18
.9
426
19.5
469
26.0
52
8 26
.9
569
26.7
55
2 24
.5
586
23.8
579
23.3
56
9 23
.8
560
23.5
57
9 24
.4
519
23.7
N
ote:
Per
cent
ages
may
nota
dd to
100.
0be
caus
e of
roun
ding
.
Tab
le 8
HO
MIC
IDE
CR
IME
S, 2
010
Rac
e/E
thni
cG
roup
ofV
ictim
by
Gen
der
ofV
ictim
Gen
der
of v
ictim
Tot
al
Whi
te
His
pani
c B
lack
O
ther
U
nkno
wn
Num
ber
Per
cent
N
umbe
r P
erce
nt
Num
ber
Per
cent
N
umbe
r P
erce
nt
Num
ber
Per
cent
N
umbe
r P
erce
nt
Tot
al...
......
......
.
Mal
e....
......
...F
emal
e....
.....
1,80
9 10
0.0
1,45
2 80
.3
357
19.7
329
100.
0
210
63.8
11
9 36
.2
805
100.
0
690
85.7
11
5 14
.3
536
100.
0
458
85.4
78
14
.6
133
100.
0
90
67.7
43
32
.3
6 10
0.0
4
2
Not
e:D
ash
indi
cate
sth
atpe
rcen
tdis
trib
utio
nsar
eno
tcal
cula
ted
whe
nth
e ba
se n
umbe
ris
less
than
50.

12
Tab
le 9
HO
MIC
IDE
CR
IME
S, 2
010
Rac
e/E
thni
cG
roup
ofV
ictim
by
Age
ofV
ictim
Age
of v
ictim
Tot
al
Whi
te
His
pani
c B
lack
O
ther
Unk
now
n
Num
ber
Per
cent
N
umbe
r P
erce
nt
Num
ber
Per
cent
N
umbe
r P
erce
nt
Num
ber
Per
cent
N
umbe
r P
erce
nt
182
9.…
...…
......
.....…
..30
39.
…...
…...
......
..…..
40 a
nd o
ver.
..…...
......
..
Tot
al in
clud
ing
unkn
own.
..…U
nkno
wn.
.…...
…...
......
..…
Tot
al k
now
n...…
......
.....…
Und
er 1
8....
…...
......
..…
1,80
9 4
1,80
5 10
0.0
216
12.0
76
9 42
.6
351
19.4
46
9 26
.0
329 0
329
100.
0 32
9.
7 69
21
.0
54
16.4
17
4 52
.9
805 0
805
100.
0 11
1 13
.8
397
49.3
16
4 20
.4
133
16.5
536 0
536
100.
0 60
11
.2
261
48.7
10
6 19
.8
109
20.3
133 0
133
100.
0 13
9.
8 41
30
.8
27
20.3
52
39
.1
6 4
2 10
0.0
0
1
0
1
Not
es:
Per
cent
ages
may
nota
dd to
100.
0be
caus
e of
roun
ding
.D
ash
indi
cate
s th
atpe
rcen
tdis
trib
utio
nsar
eno
tcal
cula
ted
whe
nth
e ba
se n
umbe
r is
less
than
50.

Tab
le 1
0H
OM
ICID
E C
RIM
ES
,201
0R
ace/
Eth
nic
Gro
upof
Vic
tim b
yG
ende
r an
dA
ge o
f Vic
tim
13
Gen
der
and
age
of v
ictim
Tot
al
Whi
te
His
pani
c B
lack
O
ther
U
nkno
wn
Num
ber
Per
cent
N
umbe
r P
erce
nt
Per
cent
N
umbe
r N
umbe
r P
erce
nt
Num
ber
Per
cent
N
umbe
rP
erce
nt
Tot
al.…
......
......
...
Und
er 1
8....
.....
181
9...…
......
.. 20
24.
.…...
......
25
29.
.…...
......
30
34.
.…...
......
353
9..…
......
...
404
4...…
......
.. 45
49.
...…
......
. 50
54.
....…
......
55
and
ove
r....
.
Unk
now
n…...
...
Mal
e....
..…...
....
Und
er 1
8....
.. 18
19.
..…...
.. 20
24.
..…...
.. 25
29.
..…...
.. 30
34.
..…...
..
353
9...…
.....
404
4...…
.....
454
9...…
.....
505
4...…
.....
55 a
nd o
ver.
.
Unk
now
n....
..
Fem
ale…
......
.. U
nder
18.
.....
181
9...…
.....
202
4...…
.....
252
9...…
.....
303
4...…
.....
353
9...…
.....
404
4...…
.....
454
9...…
.....
505
4...…
.....
55 a
nd o
ver.
.
Unk
now
n…...
1,80
9 10
0.0
216
11.9
17
2 9.
5 33
2 18
.4
265
14.6
21
2 11
.7
139
7.7
109
6.0
104
5.7
82
4.5
174
9.6
4 0.
2
1,45
2 10
0.0
153
10.5
15
9 11
.0
290
20.0
22
9 15
.8
180
12.4
114
7.9
87
6.0
72
5.0
64
4.4
101
7.0
3 0.
2
357
100.
0 63
17
.6
13
3.6
42
11.8
36
10
.1
32
9.0
25
7.0
22
6.2
32
9.0
18
5.0
73
20.4
1 0.
3
329
100.
0 32
9.
7 13
4.
0 24
7.
3 32
9.
7 25
7.
6
29
8.8
32
9.7
35
10.6
28
8.
5 79
24
.0
0 0.
0
210
100.
0 14
6.
7 11
5.
2 16
7.
6 24
11
.4
18
8.6
20
9.5
27
12.9
20
9.
5 20
9.
5 40
19
.0
0 0.
0
119
100.
0 18
15
.1
2 1.
7 8
6.7
8 6.
7 7
5.9
9 7.
6 5
4.2
15
12.6
8
6.7
39
32.8
0 0.
0
805
100.
0 11
1 13
.8
100
12.4
16
0 19
.9
137
17.0
10
8 13
.4
56
7.0
36
4.5
33
4.1
32
4.0
32
4.0
0 0.
0
690
100.
0 87
12
.6
93
13.5
14
2 20
.6
121
17.5
94
13
.6
49
7.1
26
3.8
26
3.8
26
3.8
26
3.8
0 0.
0
115
100.
0 24
20
.9
7 6.
1 18
15
.7
16
13.9
14
12
.2
7 6.
1 10
8.
7 7
6.1
6 5.
2 6
5.2
0 0.
0
536
100.
0 60
11
.2
51
9.5
129
24.1
81
15
.1
68
12.7
38
7.1
33
6.2
30
5.6
16
3.0
30
5.6
0 0.
0
458
100.
0 44
9.
6 47
10
.3
117
25.5
73
15
.9
62
13.5
35
7.6
28
6.1
21
4.6
13
2.8
18
3.9
0 0.
0
78
100.
0 16
20
.5
4 5.
1 12
15
.4
8 10
.3
6 7.
7
3 3.
8 5
6.4
9 11
.5
3 3.
8 12
15
.4
0 0.
0
133
100.
0 13
9.
8 8
6.0
19
14.3
14
10
.5
11
8.3
16
12.0
8
6.0
6 4.
5 6
4.5
32
24.1
0 0.
0
90
100.
0 8
8.9
8 8.
9 15
16
.7
11
12.2
6
6.7
10
11.1
6
6.7
5 5.
6 5
5.6
16
17.8
0 0.
0
43
100.
0 5
0
4
3
5
6
2
1
1
16
0
6 10
0.0
0
0
0
1
0
0
0
0
0
1
4
4 10
0.0
0
0
0
0
0
0
0
0
0
1
3
2 10
0.0
0
0
0
1
0
0
0
0
0
0
1
Not
es:
Per
cent
ages
may
nota
dd to
100
.0be
caus
e of
roun
ding
.D
ash
indi
cate
s th
atpe
rcen
tdis
trib
utio
ns a
reno
tcal
cula
ted
whe
nth
e ba
se n
umbe
r is
less
than
50.

14
Tab
le11
HO
MIC
IDE
CR
IME
S, 2
001
2010
By
Rel
atio
nshi
pof
Vic
tim to
Offe
nder
Rel
atio
nshi
pof
vic
tim to
offe
nder
2001
20
02
2003
20
04
2005
Per
cent
N
umbe
r N
umbe
r P
erce
nt
Num
ber
Per
cent
P
erce
nt
Num
ber
Num
ber
Per
cent
Frie
nd, a
cqua
inta
nce1 …
...S
pous
e, p
aren
t, ch
ild…
....
Spo
use2 ...
......
..…...
......
..P
aren
t, ch
ild3 .…
......
......
.A
ll ot
her
rela
tives
......
......
..S
tran
ger.
...…
......
......
......
..
Tot
al k
now
n..…
......
......
......
..
Tot
al in
clud
ing
unkn
own…
.....
Unk
now
n....
...…
......
......
......
. 2,
201
900
1,30
1 10
0.0
596
45.8
18
3 14
.1
87
6.7
96
7.4
49
3.8
473
36.4
2,39
2 96
9
1,42
3 10
0.0
663
46.6
20
4 14
.3
97
6.8
107
7.5
42
3.0
514
36.1
2,40
2 1,
109
1,29
3 10
0.0
601
46.5
19
8 15
.3
93
7.2
105
8.1
52
4.0
442
34.2
2,39
4 1,
018
1,37
6 10
0.0
667
48.5
17
4 12
.6
84
6.1
90
6.5
46
3.3
489
35.5
2,50
3 1,
082
1,42
1 10
0.0
548
38.6
17
4 12
.2
77
5.4
97
6.8
61
4.3
638
44.9
Rel
atio
nshi
pof
vic
tim to
offe
nder
(co
nt.)
2006
20
07
2008
20
09
2010
Per
cent
cha
nge
Num
ber
Per
cent
N
umbe
r P
erce
nt
Num
ber
Per
cent
N
umbe
r P
erce
nt
Num
ber
Per
cent
20
01
2010
20
09
2010
Spo
use,
par
ent,
child
…...
.S
pous
e2 ......
.....…
......
.....
Par
ent,
child
3 .…...
......
....
All
othe
r re
lativ
es...
......
.....
Str
ange
r....
…...
......
......
.....
Tot
al in
clud
ing
unkn
own…
.....
Unk
now
n....
...…
......
......
......
.
Tot
al k
now
n..…
......
......
......
..F
riend
, acq
uain
tanc
e1 …...
2,48
3 1,
109
1,37
4 10
0.0
593
43.2
18
0 13
.1
86
6.3
94
6.8
43
3.1
558
40.6
2,25
8 1,
131
1,12
7 10
0.0
475
42.1
15
5 13
.8
76
6.7
79
7.0
40
3.5
457
40.6
2,14
3 1,
030
1,11
3 10
0.0
540
48.5
16
9 15
.2
71
6.4
98
8.8
68
6.1
336
30.2
1,97
0 87
8
1,09
2 10
0.0
572
52.4
16
0 14
.7
64
5.9
96
8.8
34
3.1
326
29.9
1,80
9 80
4
1,00
5 10
0.0
446
44.4
16
7 16
.6
84
8.4
83
8.3
37
3.7
355
35.3
22.
8 8
.0
25.
2 2
2.0
8.7
4.
4 3
.4
31.3
1
3.5
13.
5
8.8
24.
9 8.
9
Not
es:
Per
cent
ages
may
nota
dd to
subt
otal
sor
100.
0be
caus
e of
roun
ding
. D
ash
indi
cate
s th
ata
perc
entc
hang
e is
notc
alcu
late
d w
hen
the
base
num
ber
is le
ss th
an 5
0.
1 In
clud
esex
hus
band
,ex
wife
,em
ploy
er,e
mpl
oyee
,gan
g m
embe
r,et
c.2
Incl
udes
"co
mm
onla
w"
mar
riage
par
tner
. 3
Incl
udes
ste
pmot
her,
ste
pfat
her,
ste
pdau
ghte
r, a
nd s
teps
on.

15
Tab
le 1
2 H
OM
ICID
EC
RIM
ES
, 201
0 G
ende
ran
dR
ace/
Eth
nic
Gro
upof
Vic
tim b
yR
elat
ions
hip
ofV
ictim
to O
ffend
er
Rel
atio
nshi
pof
vic
tim to
offe
nder
T
otal
G
ende
r R
ace/
ethn
ic g
roup
Mal
e F
emal
e H
ispa
nic
Bla
ck
Oth
er
Unk
now
n W
hite
Num
ber
Str
ange
r....
...…
..…...
......
.
Spo
use2 ...
.....…
......
......
Par
ent,
child
3 .…...
......
..A
ll ot
her
rela
tives
..……
....
Tot
al in
clud
ing
unkn
own.
......
.U
nkno
wn.
.....…
...…
......
......
Tot
al k
now
n...…
......
......
.....
Frie
nd, a
cqua
inta
nce1 ...
..S
pous
e, p
aren
t, ch
ild…
...
1,80
9 80
4
1,00
5 44
6 16
7 84
83
37
355
1,45
2 35
7 73
4 70
718
287
329
117
51
116
10
74
41
42
23
14
315
40
329
805
536
133
6 73
39
0 29
3 43
5
256
415
243
90
1 11
9 19
2 96
39
0
63
56
24
23
1 36
26
10
12
0
27
30
14
11
1 9
20
7 1
0 65
14
7 11
6 27
0
Per
cent
bas
edon
tota
l kno
wn
Str
ange
r....
...…
..…...
......
.
Tot
al k
now
n...…
......
......
.....
Spo
use,
par
ent,
child
…...
Spo
use2 ...
.....…
......
......
Par
ent,
child
3 …...
......
...A
ll ot
her
rela
tives
..……
....
Frie
nd, a
cqua
inta
nce1 ...
.. 10
0.0
44.4
16
.6
8.4
8.3
3.7
35.3
100.
0 10
0.0
45.8
40
.8
7.1
40.4
1.
4 25
.8
5.7
14.6
3.
2 4.
9 43
.9
13.9
100.
0 10
0.0
100.
0 10
0.0
100.
0 46
.5
46.3
39
.5
43.3
24.6
13
.5
9.9
25.6
14.1
6.
3 4.
1 13
.3
10
.5
7.2
5.8
12.2
3.5
4.8
2.9
1.1
25
.4
35.4
47
.7
30.0
Not
es:
Per
cent
ages
may
nota
dd to
100.
0be
caus
e of
roun
ding
. D
ash
indi
cate
sth
atpe
rcen
tdis
trib
utio
nsar
eno
tcal
cula
ted
whe
nth
e ba
se n
umbe
ris
less
than
50.
1
Incl
udes
exh
usba
nd,e
xw
ife,e
mpl
oyer
,em
ploy
ee,g
ang
mem
ber,
etc.
2 In
clud
es "
com
mon
law
"m
arria
ge p
artn
er.
3 In
clud
es s
tepm
othe
r, s
tepf
athe
r, s
tepd
augh
ter,
and
ste
pson
.

16
Tab
le 1
3 H
OM
ICID
EC
RIM
ES
, 201
0 A
geof
Vic
tim b
yR
elat
ions
hip
ofV
ictim
to O
ffend
er
Rel
atio
nshi
pof
vic
tim to
offe
nder
T
otal
U
nder
18
18
29
303
9 40
an
d ov
er
Unk
now
n N
umbe
r
Tot
al in
clud
ing
unkn
own.
......
. U
nkno
wn.
......
......
......
......
.. T
otal
kno
wn.
......
......
......
....
Frie
nd, a
cqua
inta
nce1 …
.S
pous
e, p
aren
t, ch
ild…
.. S
pous
e2 ......
......
......
.....
Par
ent,
child
3 ......
…...
.. A
ll ot
her
rela
tives
…...
.....
Str
ange
r....
......
......
......
....
1,80
9 80
4 1,
005
446
167 84
83
37
35
5
216 84
13
2 42
53 1 52 8 29
769
397
372
179 20
13
7 11
162
351
170
181 84
22
20
2 8 67
469
149
320
141 72
50
22
10
97
4 4 0 0 0 0 0 0 0 P
erce
nt b
ased
on to
tal k
now
n
Tot
al k
now
n....
......
......
......
. F
riend
, acq
uain
tanc
e1 ….
Spo
use,
par
ent,
child
…..
Spo
use2 ...
......
......
......
.. P
aren
t, ch
ild3 ...
...…
.....
All
othe
r re
lativ
es…
......
.. S
tran
ger.
......
......
......
......
.
100.
0 44
.4
16.6
8.
4 8.
3 3.
7 35
.3
100.
0 31
.8
40.2
0.
8 39
.4
6.1
22.0
100.
0 48
.1
5.4
3.5
1.9
3.0
43.5
100.
0 46
.4
12.2
11
.0
1.1
4.4
37.0
100.
0 44
.1
22.5
15
.6
6.9
3.1
30.3
100.
0
Not
es:
Per
cent
ages
may
nota
dd to
subt
otal
sor
100.
0be
caus
e of
roun
ding
. D
ash
indi
cate
s th
atpe
rcen
tdis
trib
utio
nsar
eno
tcal
cula
ted
whe
nth
e ba
se n
umbe
r is
less
than
50.
1
Incl
udes
exh
usba
nd,e
xw
ife,e
mpl
oyer
,em
ploy
ee,g
ang
mem
ber,
etc.
2 In
clud
es "
com
mon
law
"m
arria
ge p
artn
er.
3 In
clud
es s
tepm
othe
r, s
tepf
athe
r, s
tepd
augh
ter,
and
ste
pson
.

17
Tab
le 1
4H
OM
ICID
EC
RIM
ES
, 200
120
10B
yC
ount
yN
umbe
r an
dR
ate
per
100,
000
Pop
ulat
ion
Cou
nty
2001
20
02
2003
20
04
2005
20
06
2007
20
08
2009
20
10
Num
ber
Sta
tew
ide
tota
l.…...
Ala
med
a....
…...
...
Alp
ine.
......
.…...
...
Am
ador
......
......
...
But
te..…
......
......
. C
alav
eras
...…
....
Col
usa.
......
......
...
Con
tra
Cos
ta.…
.. D
el N
orte
......
......
E
l Dor
ado.
.…...
...
Fre
sno.
......
......
...
Gle
nn...
......
......
...
Hum
bold
t.....
......
. Im
peria
l.....
......
....
Inyo
......
...…
…...
.. K
ern.
.....…
......
....
Kin
gs...
..…...
......
. La
ke...
...…
......
....
Lass
en...
......
......
. Lo
s A
ngel
es…
....
Mad
era.
…...
......
..
Mar
in...
.…...
......
.. M
arip
osa.
......
......
M
endo
cino
......
....
Mer
ced.
…...
......
.. M
odoc
..…...
......
..
Mon
o....
…...
......
.. M
onte
rey.
......
......
N
apa.
...…
......
......
N
evad
a..…
......
....
Ora
nge.
…...
......
..
2,20
1
108 0 0 11
2 0 49 1 5 61 0 7 5 0 39 1 1 0
1,07
0 15 3 0 4 5 1 0 26 1 6 63
2,39
2
144 0 0 5 2 0 48
2 4 62
0 12 3 0 51 4 4 0
1,16
2 6 4 0 4 18 0 0 28 2 3 77
2,40
2
139 0 0 9 2 0 74
0 2 59
2 8 12 2 46 5 1 0
1,05
3 7 0 0 9 16 0 1 27 2 2 64
2,39
4
117 0 2 6 3 0 76
1 2 69
0 5 4 0 51 6 1 0
1,03
8 7 3 1 6 16 0 0 33 3 1 81
2,50
3
126 0 0 10
2 0 80 1 5 77
0 3 0 1 69 4 1 3
1,06
8 10 3 0 4 22 0 0 14 1 2 77
2,48
3
172 0 2 11
1 0 93 0 4 74
1 5 3 0 65 4 7 1
1,01
2 2 3 1 6 22 0 0 15 2 2 79
2,25
8
152 1 0 9 0 1 98
2 4 73
2 3 4 0 50 7 5 0
863 5 1 0 6 17 1 0 29 6 2 77
2,14
3
147 1 0 7 2 1 76
0 8 65
2 3 8 0 57 7 5 1
806 10
5 1 7 21 0 0 36 1 1 72
1,97
0
138 0 1 10
1 1 89 1 3 69
0 8 3 2 75 4 4 1
699 3 4 0 5 26 0 0 51 1 1 69
1,80
9
132 0 1 7 1 0 65
3 3 63
1 6 3 0 74 3 4 1
617 10
4 0 4 26 0 0 44 2 1 67
(con
tinue
d)
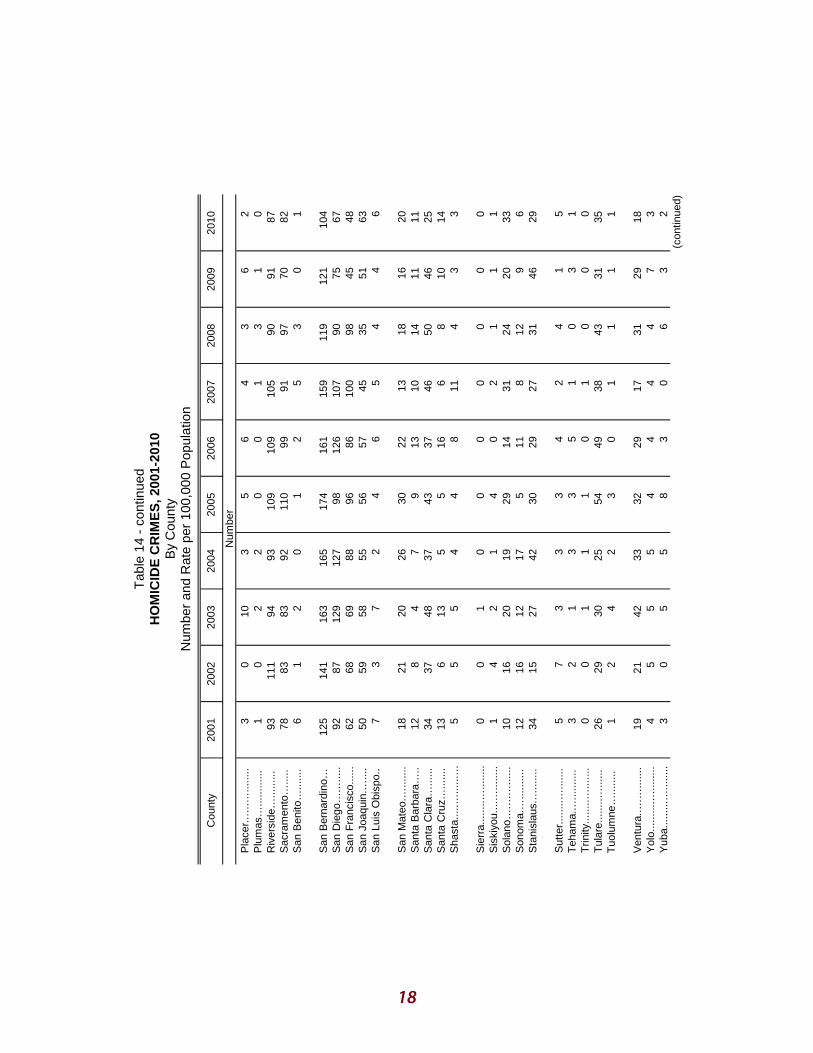
18
Tab
le 1
4
cont
inue
dH
OM
ICID
EC
RIM
ES
, 200
120
10B
yC
ount
yN
umbe
r an
dR
ate
per
100,
000
Pop
ulat
ion
Cou
nty
2001
20
02
2003
20
04
2005
20
06
2007
20
08
2009
20
10
Num
ber
Pla
cer.
.….…
......
.. P
lum
as…
......
......
R
iver
side
…...
......
S
acra
men
to…
.....
San
Ben
ito…
......
.
San
Ber
nard
ino…
S
anD
iego
….…
....
San
Fra
ncis
co...
...
San
Joaq
uin.
…...
. S
anLu
is O
bisp
o..
San
Mat
eo.…
......
. S
anta
Bar
bara
…..
San
taC
lara
…...
...
San
taC
ruz…
......
. S
hast
a....
.…...
...…
Sie
rra.
......
.…...
.....
Sis
kiyo
u....
…...
.....
Sol
ano…
.….…
.....
Son
oma.
…...
......
. S
tani
slau
s.…
......
.
Sut
ter.
......
.…...
....
Teh
ama.
.…...
......
T
rinity
......
..…...
....
Tul
are.
......
.…...
...
Tuo
lum
ne…
......
..
Ven
tura
..……
......
. Y
olo.
......
...…
......
.. Y
uba.
......
..…...
.....
3 1 93
78 6
125 92
62
50
7 18
12
34
13 5 0 1 10
12
34 5 3 0 26 1 19 4 3
0 011
1 83 1
141 87
68
59
3 21 8 37 6 5 0 4 16
16
15 7 2 0 29 2 21 5 0
10 2 94
83 2
163
129 69
58
7 20 4 48
13 5 1 2 20
12
27 3 1 1 30 4 42 5 5
3 2 93
92 0
165
127 88
55
2 26 7 37 5 4 0 1 19
17
42 3 3 1 25 2 33 5 5
5 010
9 11
0 1
174 98
96
56
4 30 9 43 5 4 0 4 29 5 30 3 3 1 54 3 32 4 8
6 010
9 99 2
161
126 86
57
6 22
13
37
16 8 0 0 14
11
29 4 5 0 49 0 29 4 3
4 110
5 91 5
159
107
100 45
5 13
10
46 6 11 0 2 31 8 27 2 1 1 38 1 17 4 0
3 3 90
97 3
119 90
98
35
4 18
14
50 8 4 0 1 24
12
31 4 0 0 43 1 31 4 6
6 1 91
70 0
121 75
45
51
4 16
11
46
10 3 0 1 20 9 46 1 3 0 31 1 29 7 3
2 0 87
82 1
104 67
48
63
6 20
11
25
14 3 0 1 33 6 29 5 1 0 35 1 18 3 2
(con
tinue
d)

19
Tab
le 1
4
cont
inue
dH
OM
ICID
EC
RIM
ES
, 200
120
10B
yC
ount
yN
umbe
r an
dR
ate
per
100,
000
Pop
ulat
ion
Cou
nty
2001
20
02
2003
20
04
2005
20
06
2007
20
08
2009
20
10
Rat
epe
r 10
0,00
0 po
pula
tion
Sta
tew
ide
tota
l.…...
Ala
med
a....
…...
...
Alp
ine.
......
.…...
...
Am
ador
......
......
...
But
te..…
......
......
. C
alav
eras
...…
....
Col
usa.
......
......
...
Con
tra
Cos
ta.…
.. D
el N
orte
......
......
E
l Dor
ado.
.…...
...
Fre
sno.
......
......
...
Gle
nn...
......
......
...
Hum
bold
t.....
......
. Im
peria
l.....
......
....
Inyo
......
...…
…...
.. K
ern.
.....…
......
....
Kin
gs...
..…...
......
. La
ke...
...…
......
....
Lass
en...
......
......
. Lo
s A
ngel
es…
....
Mad
era.
…...
......
..
Mar
in...
.…...
......
.. M
arip
osa.
......
......
M
endo
cino
......
....
Mer
ced.
…...
......
.. M
odoc
..…...
......
..
Mon
o....
…...
......
.. M
onte
rey.
......
......
N
apa.
...…
......
......
N
evad
a..…
......
....
Ora
nge.
…...
......
..
6.3
7.3
5.3
5.0
3.1
7.4
5.5
3.3
5.7
0.8
11.0
11
.5
1.2
2.3
6.4
0.8
2.2
6.8
9.7
2.4
4.9
2.4
7.4
9.4
2.0
7.3
3.0
11.7
4.
6
1.6
8.1
6.8
1.6
2.6
6.7
9.3
4.2
7.4
1.2
6.9
6.2
7.8
6.4
3.6
10.5
5.
2
0.0
6.9
6.4
1.5
2.1
6.5
7.8
2.8
7.5
1.2
7.9
3.8
2.5
6.9
4.2
10.2
5.
0
1.2
6.7
7.8
2.3
2.7
6.8
8.4
4.6
7.8
2.8
8.6
2.3
8.9
2.7
10.4
7.
0
1.2
9.0
3.3
0.7
2.0
2.5
6.6
11.4
5.
1 9.
0 2.
2 8.
1 3.
8 1.
8 8.
2
2.7
9.8
1.4
1.2
8.8
3.5
1.5
2.6
6.0
9.9
4.1
9.4
2.2
7.9
2.3
2.3
6.2
4.6
8.4
3.3
0.4
6.7
6.8
4.4
2.5
5.6
9.5
3.2
7.2
4.4
6.9
2.3
4.5
6.9
4.5
7.8
6.6
1.9
8.2
8.4
0.7
2.3
5.1
8.8
4.5
8.3
1.7
7.3
6.0
1.7
9.0
2.6
6.7
2.0
1.5
10.1
11
.8
0.7
2.2
4.7
8.3
3.1
6.0
1.6
6.6
4.5
1.6
8.8
1.9
5.9
6.5
1.5
10.0
10
.0
1.4
2.1
(con
tinue
d)

20
Tab
le 1
4
cont
inue
d H
OM
ICID
EC
RIM
ES
, 200
120
10B
yC
ount
yN
umbe
r an
dR
ate
per
100,
000
Pop
ulat
ion
Cou
nty
2001
20
02
2003
20
04
2005
20
06
2007
20
08
2009
20
10
Rat
epe
r 10
0,00
0 po
pula
tion
Pla
cer.
.….…
......
.. P
lum
as…
......
......
R
iver
side
…...
......
S
acra
men
to…
.....
San
Ben
ito…
......
.
San
Ber
nard
ino…
S
anD
iego
….…
....
San
Fra
ncis
co...
...
San
Joaq
uin.
…...
. S
anLu
is O
bisp
o..
San
Mat
eo.…
......
. S
anta
Bar
bara
…..
San
taC
lara
…...
...
San
taC
ruz…
......
. S
hast
a....
.…...
...…
Sie
rra.
......
.…...
.....
Sis
kiyo
u....
…...
.....
Sol
ano…
.….…
.....
Son
oma.
…...
......
. S
tani
slau
s.…
......
.
Sut
ter.
......
.…...
....
Teh
ama.
.…...
......
T
rinity
......
..…...
....
Tul
are.
......
.…...
...
Tuo
lum
ne…
......
..
Ven
tura
..……
......
. Y
olo.
......
...…
......
.. Y
uba.
......
..…...
.....
1.1
5.7
6.2
7.1
3.2
7.9
8.5
2.8
2.5
3.0
2.0
5.0
3.0
2.5
2.6
7.3
6.9
2.5
2.3
0.0
6.6
6.4
7.8
3.0
8.6
9.7
1.2
2.9
2.0
2.2
2.3
2.9
3.9
3.4
3.1
7.6
2.7
2.8
3.5
5.3
6.2
8.7
4.3
8.8
9.3
2.7
2.8
1.0
2.8
5.0
2.8
4.8
2.5
5.5
7.6
5.3
2.7
1.0
5.0
6.8
8.5
4.2
11.1
8.
5 0.
8
3.6
1.7
2.1
1.9
2.3
4.5
3.6
8.4
6.2
4.1
2.7
1.6
5.6
8.0
8.8
3.2
12.1
8.
4 1.
5
4.2
2.1
2.4
1.9
2.2
6.9
1.0
5.9
12.9
3.9
2.1
1.9
5.4
7.1
8.0
4.1
10.7
8.
5 2.
3
3.0
3.1
2.1
6.1
4.4
3.3
2.3
5.6
11.5
3.5
2.1
1.2
5.1
6.4
7.8
3.4
12.2
6.
6 1.
9
1.8
2.3
2.5
2.3
6.1
7.3
1.7
5.2
8.8
2.1
2.0
0.9
4.3
6.8
5.8
2.8
11.6
5.
1 1.
5
2.4
3.3
2.7
3.0
2.2
5.6
2.5
5.9
9.8
3.7
2.0
1.7
4.3
4.9
5.9
2.3
5.3
7.4
1.5
2.1
2.5
2.5
3.7
1.6
4.7
1.8
8.7
7.0
3.4
3.5
0.6
4.0
5.6
5.0
2.1
5.6
9.0
2.2
2.6
2.5
1.3
5.1
1.6
7.7
1.2
5.5
7.8
2.1
1.5
Not
es:D
ash
indi
cate
s th
ata
rate
isno
tcom
pute
d w
hen
aco
unty
'spo
pula
tion
is le
ss th
an10
0,00
0 in
agi
ven
year
.R
ates
are
base
don
ann
ualp
opul
atio
n es
timat
espr
ovid
edby
the
Dem
ogra
phic
Res
earc
hU
nit,
Cal
iforn
iaD
epar
tmen
tofF
inan
ce.
Rat
esar
eca
lcul
ated
usin
g th
e po
pula
tion
for
each
cou
nty
show
n; th
eref
ore,
they
will
nota
dd to
the
rate
calc
ulat
ed fo
r th
est
ate.

Tab
le 1
5H
OM
ICID
E C
RIM
ES
, 200
120
10B
yS
easo
n an
d M
onth
of I
ncid
ent
21
Sea
son
and
mon
thof
inci
dent
20
01
2002
20
03
2004
20
05
2006
20
07
2008
20
09
2010
Num
ber
Oct
ober
......
......
......
..N
ovem
ber.
......
......
...W
inte
r....
......
......
......
...D
ecem
ber…
......
......
.Ja
nuar
y....
......
......
....
Feb
ruar
y....
......
......
..
Sep
tem
ber.
......
......
..
Unk
now
n....
......
......
......
..
Tot
al k
now
n....
......
......
...S
prin
g....
......
....…
......
..M
arch
......
..…...
......
..A
pril.
......
...…
......
.....
May
......
....…
......
......
Sum
mer
......
.....…
......
..Ju
ne...
......
…...
......
...Ju
ly...
......
…...
......
....
Aug
ust..
..…...
......
.....
Fal
l.....
......
…...
......
......
Tot
al in
clud
ing
unkn
own.
.. 2,
201 0
2,20
1 52
8 15
9 17
6 19
3 58
1 16
5 20
8 20
8 61
3 22
1 21
3 17
9 47
9 16
8 17
1 14
0
2,39
2 0
2,39
2 58
2 18
9 18
8 20
5 62
3 18
3 23
0 21
0 63
8 25
3 18
1 20
4 54
9 17
5 21
4 16
0
2,40
2 0
2,40
2 56
6 19
1 15
4 22
1 65
2 19
7 23
3 22
2 60
1 20
9 21
3 17
9 58
3 21
0 18
9 18
4
2,39
4 0
2,39
4 61
6 20
4 19
9 21
3 64
8 19
0 22
8 23
0 58
0 21
1 18
7 18
2 55
0 19
3 19
7 16
0
2,50
3 0
2,50
3 58
0 19
5 19
1 19
4 68
9 19
9 25
3 23
7 62
9 18
3 23
3 21
3 60
5 21
0 21
7 17
8
2,48
3 0
2,48
3 60
9 18
0 22
0 20
9 68
3 22
0 24
0 22
3 61
2 20
4 20
9 19
9 57
9 20
0 20
4 17
5
2,25
8 0
2,25
8 52
8 17
1 17
2 18
5 65
6 20
6 22
8 22
2 52
8 17
2 18
9 16
7 54
6 18
6 21
0 15
0
2,14
3 0
2,14
3 55
8 20
3 16
6 18
9 53
3 18
9 15
0 19
4 53
2 20
0 17
0 16
2 52
0 16
0 17
6 18
4
1,97
0 0
1,97
0 51
3 17
7 16
4 17
2 54
0 15
2 21
0 17
8 45
2 14
7 15
2 15
3 46
5 16
5 17
3 12
7
1,80
9 0
1,80
9 52
2 17
4 16
3 18
5 44
4 13
4 13
7 17
3 41
1 12
8 14
2 14
1 43
2 15
0 15
4 12
8 P
erce
nt b
ased
on to
tal k
now
n
Feb
ruar
y....
......
......
..
Sum
mer
......
.....…
......
..Ju
ne...
......
…...
......
...Ju
ly...
......
…...
......
....
Aug
ust..
..…...
......
.....
Fal
l.....
......
…...
......
......
Sep
tem
ber.
......
......
..O
ctob
er...
......
......
.....
Nov
embe
r....
......
......
Win
ter.
......
......
......
......
Dec
embe
r…...
......
....
Janu
ary.
......
......
......
.
May
......
....…
......
......
Tot
al k
now
n....
......
......
...S
prin
g....
......
....…
......
..M
arch
......
..…...
......
..A
pril.
......
...…
......
.....
100.
0 24
.0
7.2
8.0
8.8
26.4
7.
5 9.
5 9.
5 27
.9
10.0
9.
7 8.
1 21
.8
7.6
7.8
6.4
100.
0 24
.3
7.9
7.9
8.6
26.0
7.
7 9.
6 8.
8 26
.7
10.6
7.
6 8.
5 23
.0
7.3
8.9
6.7
100.
0 23
.6
8.0
6.4
9.2
27.1
8.
2 9.
7 9.
2 25
.0
8.7
8.9
7.5
24.3
8.
7 7.
9 7.
7
100.
0 25
.7
8.5
8.3
8.9
27.1
7.
9 9.
5 9.
6 24
.2
8.8
7.8
7.6
23.0
8.
1 8.
2 6.
7
100.
0 23
.2
7.8
7.6
7.8
27.5
8.
0 10
.1
9.5
25.1
7.
3 9.
3 8.
5 24
.2
8.4
8.7
7.1
100.
0 24
.5
7.2
8.9
8.4
27.5
8.
9 9.
7 9.
0 24
.6
8.2
8.4
8.0
23.3
8.
1 8.
2 7.
0
100.
0 23
.4
7.6
7.6
8.2
29.1
9.
1 10
.1
9.8
23.4
7.
6 8.
4 7.
4 24
.2
8.2
9.3
6.6
100.
0 26
.0
9.5
7.7
8.8
24.9
8.
8 7.
0 9.
1 24
.8
9.3
7.9
7.6
24.3
7.
5 8.
2 8.
6
100.
0 26
.0
9.0
8.3
8.7
27.4
7.
7 10
.7
9.0
22.9
7.
5 7.
7 7.
8 23
.6
8.4
8.8
6.4
100.
0 28
.9
9.6
9.0
10.2
24
.5
7.4
7.6
9.6
22.7
7.
1 7.
8 7.
8 23
.9
8.3
8.5
7.1
Not
e:P
erce
ntag
es m
ayno
tadd
tosu
btot
als
or10
0.0
beca
use
ofro
undi
ng.

Tab
le 1
6 H
OM
ICID
EC
RIM
ES
, 201
0 G
ende
ran
dR
ace/
Eth
nic
Gro
upof
Vic
tim b
yD
ayof
Inci
dent
22
Day
of in
cide
nt
Tot
al
Gen
der
Rac
e/et
hnic
gro
up
Mal
e F
emal
e H
ispa
nic
Bla
ck
Oth
er
Unk
now
n W
hite
Num
ber
Mon
day.
....…
......
......
......
Tue
sday
....…
......
......
......
Thu
rsda
y...…
......
......
......
Frid
ay...
..…...
......
......
......
Wee
kend
..…...
......
......
......
.S
atur
day.
....…
......
......
.....
Sun
day.
......
…...
......
......
..
Wed
nesd
ay…
......
......
.....
Unk
now
n....
......
......
......
......
...
Tot
al k
now
n....
......
......
......
....
Wee
kday
.....…
......
......
......
.
Tot
al in
clud
ing
unkn
own…
......
1,
809 0
1,80
9 1,
155
238
232
222
214
249
654
322
332
1,45
2 35
7 0
0
1,45
2 35
7 90
9 24
6 19
5 43
17
2 60
17
1 51
17
2 42
19
9 50
543
111
272
50
271
61
329
805
536
133
6 0
0 0
0 0
329
805
536
133
6 20
8 49
5 35
7 89
6
51
99
72
16
0 44
94
63
27
4
31
93
81
16
1 42
88
76
8
0 40
12
1 65
22
1
121
310
179
44
0 50
16
0 85
27
0
71
150
94
17
0 P
erce
ntba
sed
on to
talk
now
n
Frid
ay...
..…...
......
......
......
Wee
kend
..…...
......
......
......
.S
atur
day.
....…
......
......
.....
Sun
day.
......
…...
......
......
..
Thu
rsda
y...…
......
......
......
Tot
al k
now
n....
......
......
......
....
Wee
kday
.....…
......
......
......
.M
onda
y....
.…...
......
......
...T
uesd
ay...
.…...
......
......
...W
edne
sday
…...
......
......
..
100.
0 63
.8
13.2
12
.8
12.3
11
.8
13.8
36.2
17
.8
18.4
100.
0 10
0.0
62.6
68
.9
13.4
12
.0
11.8
16
.8
11.8
14
.3
11.8
11
.8
13.7
14
.0
37.4
31
.1
18.7
14
.0
18.7
17
.1
100.
0 10
0.0
100.
0 10
0.0
100.
0 63
.2
61.5
66
.6
66.9
15.5
12
.3
13.4
12
.0
13
.4
11.7
11
.8
20.3
9.4
11.6
15
.1
12.0
12.8
10
.9
14.2
6.
0
12.2
15
.0
12.1
16
.5
36.8
38
.5
33.4
33
.1
15
.2
19.9
15
.9
20.3
21.6
18
.6
17.5
12
.8
Ave
rage
daily
num
ber
of in
cide
nts1
Wee
kend
......
…...
......
......
...
Wee
kday
......
…...
......
......
...
4.4
6.2
3.5
0.9
5.2
1.1
0.8
1.9
1.4
0.3
0.0
1.2
3.0
1.7
0.4
0.0
Not
es:
Per
cent
ages
may
nota
dd to
subt
otal
sor
100.
0be
caus
e of
roun
ding
.D
ash
indi
cate
s th
atpe
rcen
tdis
trib
utio
nsar
eno
tcal
cula
ted
whe
nth
e ba
se n
umbe
r is
less
than
50.
A
vera
geda
ilynu
mbe
rof
inci
dent
sm
ayno
tadd
to to
tals
beca
use
ofro
undi
ng.
1T
here
wer
e36
5da
ys in
201
0;26
1 w
eekd
ays
and
104
wee
kend
days
. T
he a
vera
ge d
aily
num
ber
ofin
cide
nts
for
wee
kday
sw
asca
lcul
ated
bydi
vidi
ng w
eekd
ayto
tals
by26
1. T
he a
vera
ge d
aily
num
ber
of in
cide
nts
for
wee
kend
sw
asca
lcul
ated
bydi
vidi
ngw
eeke
nd to
tals
by10
4.
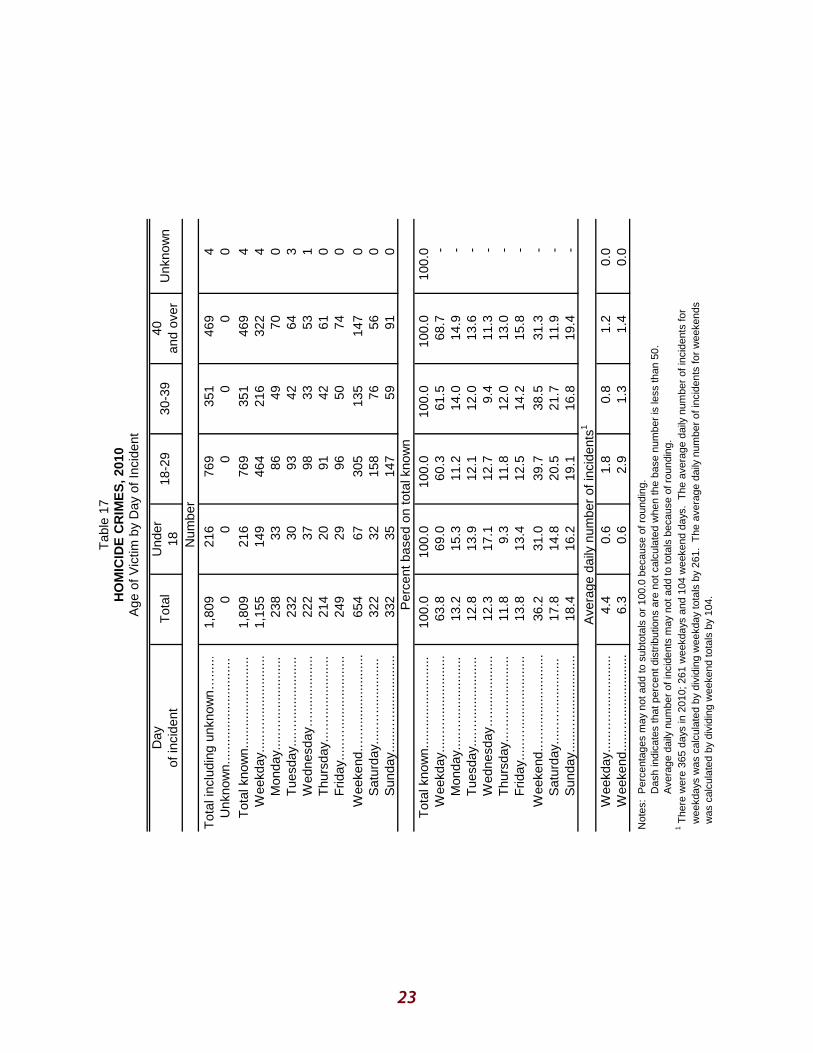
Tab
le 1
7H
OM
ICID
E C
RIM
ES
, 201
0 A
ge o
fVic
timby
Day
of In
cide
nt
23
Day
of in
cide
nt
Tot
al
Und
er
18
182
9 30
39
40an
d ov
er
Unk
now
n
Num
ber
Mon
day.
....…
......
......
.....
Tue
sday
....…
......
......
.....
Wed
nesd
ay…
......
......
....
Thu
rsda
y...…
......
......
.....
Frid
ay...
..…...
......
......
.....
Wee
kend
..…...
......
......
......
Sat
urda
y....
.…...
......
......
.S
unda
y....
...…
......
......
....
Wee
kday
.....…
......
......
......
Tot
al in
clud
ing
unkn
own…
......
Unk
now
n....
......
......
......
......
..T
otal
kno
wn.
......
......
......
......
1,80
9 01,
809
1,15
5 23
8 23
2 22
2 21
4 24
9 65
4 32
2 33
2
216 0
216
149 33
30
37
20
29
67
32
35
769 0
769
464 86 93 98 91 96 305
158
147
351 0
351
216 49 42 33 42 50 135 76 59
469 0
469
322 70 64 53 61 74 147 56 91
4 0 4 4 0 3 1 0 0 0 0 0 P
erce
nt b
ased
on
tota
l kno
wn
Sun
day.
......
…...
......
......
.
Tue
sday
....…
......
......
.....
Wed
nesd
ay…
......
......
....
Thu
rsda
y...…
......
......
.....
Frid
ay...
..…...
......
......
.....
Wee
kend
..…...
......
......
......
Sat
urda
y....
.…...
......
......
.
Mon
day.
....…
......
......
.....
Tot
al k
now
n....
......
......
......
...W
eekd
ay...
..…...
......
......
...
100.
0 63
.8
13.2
12
.8
12.3
11
.8
13.8
36
.2
17.8
18
.4
100.
0 69
.0
15.3
13
.9
17.1
9.
3 13
.4
31.0
14
.8
16.2
100.
0 60
.3
11.2
12
.1
12.7
11
.8
12.5
39
.7
20.5
19
.1
100.
0 61
.5
14.0
12
.0
9.4
12.0
14
.2
38.5
21
.7
16.8
100.
0 68
.7
14.9
13
.6
11.3
13
.0
15.8
31
.3
11.9
19
.4
100.
0 A
vera
ge d
aily
num
ber
of in
cide
nts1
Wee
kday
......
…...
......
......
..W
eeke
nd...
...…
......
......
.....
4.4
6.3
0.6
0.6
1.8
2.9
0.8
1.3
1.2
1.4
0.0
0.0
Not
es:
Per
cent
ages
may
nota
dd to
subt
otal
sor
100.
0be
caus
e of
roun
ding
.D
ash
indi
cate
s th
atpe
rcen
tdis
trib
utio
nsar
eno
tcal
cula
ted
whe
nth
e ba
se n
umbe
r is
less
than
50.
A
vera
geda
ilynu
mbe
rof
inci
dent
sm
ayno
tadd
to to
tals
beca
use
ofro
undi
ng.
1T
here
wer
e36
5da
ys in
201
0;26
1 w
eekd
ays
and
104
wee
kend
days
. T
he a
vera
ge d
aily
num
ber
ofin
cide
nts
for
wee
kday
sw
asca
lcul
ated
bydi
vidi
ngw
eekd
ayto
tals
by26
1. T
he a
vera
ge d
aily
num
ber
of in
cide
nts
for
wee
kend
sw
asca
lcul
ated
bydi
vidi
ngw
eeke
nd to
tals
by10
4.

Tab
le 1
8H
OM
ICID
EC
RIM
ES
, 200
120
10B
yLo
catio
nof
Hom
icid
e
24
Loca
tion
of h
omic
ide
2001
20
02
2003
20
04
2005
Num
ber
Per
cent
P
erce
nt
Num
ber
Num
ber
Per
cent
N
umbe
r P
erce
nt
Num
ber
Per
cent
All
othe
r....
......
.…...
......
.....…
..
Oth
er r
esid
ence
......
......
..…..
Liqu
or s
tore
......
......
.…...
......
Bar
..…...
..…...
.…...
......
......
..O
ther
bus
ines
s.…
.…...
......
..
Par
king
lot..
......
......
......
…...
.V
ehic
le...
......
......
.....…
......
...F
ield
, par
k.…
....…
......
......
....
Sch
ool .
....…
.....…
......
......
...O
ther
......
..…...
…...
......
......
..
Hot
el, m
otel
..…...
......
......
....…
Str
eet,
side
wal
k…...
......
......
....
Sha
red
resi
denc
e....
......
....…
Vic
tim's
, sha
red
resi
denc
e....
..V
ictim
's r
esid
ence
......
......
..…
Tot
al k
now
n..…
......
......
......
......
..
Tot
al in
clud
ing
unkn
own.
......
......
.…U
nkno
wn.
.....…
......
.....…
......
......
2,
201 0
2,20
1 10
0.0
573
26.0
41
7 18
.9
156
7.1
845
38.4
783
35.6
28
1.
3 17
3 7.
9 7
0.3
44
2.0
61
2.8
75
3.4
196
8.9
167
7.6
3 0.
1 29
1.
3
2,39
2 2
2,39
0 10
0.0
655
27.4
46
5 19
.5
190
7.9
970
40.6
765
32.0
26
1.
1 14
7 6.
2 4
0.2
40
1.7
61
2.6
87
3.6
228
9.5
134
5.6
1 0.
0 37
1.
5
2,40
2 0
2,40
2 10
0.0
623
25.9
42
5 17
.7
198
8.2
909
37.8
870
36.2
26
1.
1 17
3 7.
2 6
0.2
38
1.6
75
3.1
98
4.1
274
11.4
14
7 6.
1 3
0.1
30
1.2
2,39
4 13
2,38
1 10
0.0
630
26.5
47
9 20
.1
151
6.3
1,04
6 43
.9
705
29.6
20
0.
8 14
6 6.
1 9
0.4
35
1.5
47
2.0
74
3.1
240
10.1
10
2 4.
3 4
0.2
28
1.2
2,50
3 25
2,47
8 10
0.0
567
22.9
41
4 16
.7
153
6.2
1,11
6 45
.0
795
32.1
23
0.
9 13
8 5.
6 6
0.2
34
1.4
70
2.8
97
3.9
282
11.4
94
3.
8 4
0.2
47
1.9
Loca
tion
of h
omic
ide
(con
t.)
2006
20
07
2008
20
09
2010
P
erce
nt c
hang
e
Num
ber
Per
cent
N
umbe
r P
erce
nt
Num
ber
Per
cent
N
umbe
r P
erce
nt
Num
ber
Per
cent
2001
20
10
2009
20
10
Oth
er...
.....…
...…
......
......
.....
Str
eet,
side
wal
k…...
......
......
....
All
othe
r....
......
.…...
......
.....…
..H
otel
, mot
el..…
......
......
......
.…O
ther
res
iden
ce...
......
.....…
..Li
quor
sto
re...
......
....…
......
...B
ar..…
.....…
....…
......
......
.....
Oth
er b
usin
ess.
….…
......
.....
Par
king
lot..
......
......
......
…...
.V
ehic
le...
......
......
.....…
......
...F
ield
, par
k.…
....…
......
......
....
Sch
ool .
....…
.....…
......
......
...
Sha
red
resi
denc
e....
......
....…
Tot
al in
clud
ing
unkn
own.
......
......
.…U
nkno
wn.
.....…
......
.....…
......
......
Tot
al k
now
n..…
......
......
......
......
..V
ictim
's, s
hare
dre
side
nce.
.....
Vic
tim's
res
iden
ce...
......
.....…
2,48
3 19
2,46
4 10
0.0
548
22.2
39
7 16
.1
151
6.1
1,09
7 44
.5
819
33.2
22
0.
9 16
7 6.
8 5
0.2
41
1.7
61
2.5
104
4.2
296
12.0
92
3.
7 3
0.1
28
1.1
2,25
8 58
2,20
0 10
0.0
485
22.0
42
4 19
.3
61
2.8
980
44.5
735
33.4
15
0.
7 16
5 7.
5 8
0.4
36
1.6
48
2.2
108
4.9
176
8.0
125
5.7
2 0.
1 52
2.
4
2,14
3 69
2,07
4 10
0.0
517
24.9
43
7 21
.1
80
3.9
764
36.8
793
38.2
16
0.
8 24
7 11
.9
10
0.5
26
1.3
43
2.1
121
5.8
184
8.9
102
4.9
3 0.
1 41
2.
0
1,97
0 91
1,87
9 10
0.0
475
25.3
40
8 21
.7
67
3.6
665
35.4
739
39.3
26
1.
4 22
8 12
.1
11
0.6
35
1.9
49
2.6
123
6.5
135
7.2
101
5.4
2 0.
1 29
1.
5
1,80
9 52
1,75
7 10
0.0
454
25.8
37
3 21
.2
81
4.6
640
36.4
663
37.7
27
1.
5 24
2 13
.8
7 0.
4 19
1.
1 43
2.
4
90
5.1
115
6.5
79
4.5
5 0.
3 36
2.
0
20.
2 6
.5
20.
8 4
.4
10.
6 8
.6
48.
1 20
.9
24.
3 3
.8
15.
3 1
0.3
39.9
6.
1
2
9.5
20.0
2
6.8
41.
3 1
4.8
52.
7 2
1.8
Not
es:
Per
cent
ages
may
nota
dd to
sub
tota
lsor
100
.0be
caus
eof
roun
ding
.D
ash
indi
cate
s th
ata
perc
entc
hang
e is
notc
alcu
late
dw
hen
the
base
num
ber
is le
ss th
an50
.

Tab
le 1
9 H
OM
ICID
EC
RIM
ES
, 201
0 G
ende
ran
dR
ace/
Eth
nic
Gro
upof
Vic
tim b
yLo
catio
n of
Hom
icid
e
25
Loca
tion
of h
omic
ide
Tot
al
Gen
der
Rac
e/et
hnic
gro
up
Mal
e F
emal
e W
hite
H
ispa
nic
Bla
ck
Oth
er
Unk
now
n
Num
ber
Oth
er...
.....…
...…
......
......
......
Vic
tim's
, sha
red
resi
denc
e....
...
Sch
ool .
....…
.....…
......
......
....
Sha
red
resi
denc
e....
......
....…
Str
eet,
side
wal
k…...
......
......
.....
All
othe
r....
......
.…...
......
.....…
...H
otel
, mot
el..…
......
......
......
.…O
ther
res
iden
ce...
......
.....…
..Li
quor
sto
re...
......
....…
......
....
Bar
..…...
..…...
.…...
......
......
...O
ther
bus
ines
s.…
.…...
......
...P
arki
ng lo
t.....
......
......
...…
.....
Veh
icle
......
......
......
..…...
......
.F
ield
, par
k.…
....…
......
......
.....
Vic
tim's
res
iden
ce...
......
.....…
Tot
al in
clud
ing
unkn
own.
......
......
.…U
nkno
wn.
.....…
......
.....…
......
......
Tot
al k
now
n..…
......
......
......
......
...
1,80
9 52
1,75
7 45
4 37
3 81
640
663 27
242 7 19
43
90
115 79 5 36
1,45
2 35
7 41
11
1,
411
346
278
176
241
132
37
44
586
54
547
116
18
9 19
0 52
7
0 19
0
35
8 79
11
10
4 11
60
19
4
1 31
5
329
805
536
133
6 7
26
11
8 0
322
779
525
125
6 14
0 19
2 82
40
0
107
168
71
27
0 33
24
11
13
0
47
300
257
32
4 13
5 28
7 18
6 53
2
7 10
8
2 0
52
112
56
22
0 0
5 2
0 0
6 2
8 3
0 12
15
7
8 1
17
31
37
5 0
14
60
38
3 0
16
34
24
4 1
0 3
0 2
0 11
15
6
4 0
Per
cent
bas
edon
tota
l kno
wn
Par
king
lot..
......
......
......
…...
..V
ehic
le...
......
......
.....…
......
....
Fie
ld, p
ark.
…...
.…...
......
......
..S
choo
l ....
.…...
..…...
......
......
.O
ther
......
..…...
…...
......
......
...
Oth
er b
usin
ess.
….…
......
......
Tot
al k
now
n..…
......
......
......
......
...V
ictim
's, s
hare
dre
side
nce.
......
Vic
tim's
res
iden
ce...
......
.....…
Sha
red
resi
denc
e....
......
....…
Str
eet,
side
wal
k…...
......
......
.....
All
othe
r....
......
.…...
......
.....…
...H
otel
, mot
el..…
......
......
......
.…O
ther
res
iden
ce...
......
.....…
..Li
quor
sto
re...
......
....…
......
....
Bar
..…...
..…...
.…...
......
......
...
100.
0 25
.8
21.2
4.
6 36
.4
37.7
1.
5 13
.8
0.4
1.1
2.4
5.1
6.5
4.5
0.3
2.0
100.
0 10
0.0
19.7
50
.9
17.1
38
.2
2.6
12.7
41
.5
15.6
38
.8
33.5
1.
3 2.
6 13
.5
15.0
0.
5 0.
0 1.
3 0.
0 2.
5 2.
3 5.
6 3.
2 7.
4 3.
2 4.
3 5.
5 0.
3 0.
3 2.
2 1.
4
100.
0 10
0.0
100.
0 10
0.0
100.
0 43
.5
24.6
15
.6
32.0
33.2
21
.6
13.5
21
.6
10
.2
3.1
2.1
10.4
14.6
38
.5
49.0
25
.6
41
.9
36.8
35
.4
42.4
2.2
1.3
1.5
1.6
16
.1
14.4
10
.7
17.6
0.0
0.6
0.4
0.0
1.
9 0.
3 1.
5 2.
4
3.7
1.9
1.3
6.4
5.
3 4.
0 7.
0 4.
0
4.3
7.7
7.2
2.4
5.
0 4.
4 4.
6 3.
2
0.0
0.4
0.0
1.6
3.
4 1.
9 1.
1 3.
2
Not
es:
Per
cent
ages
may
nota
dd to
subt
otal
s or
100.
0be
caus
e of
roun
ding
. D
ash
indi
cate
s th
atpe
rcen
tdis
trib
utio
ns a
reno
tcal
cula
ted
whe
nth
e ba
se n
umbe
r is
less
than
50.

Tab
le 2
0 H
OM
ICID
EC
RIM
ES
, 201
0 A
geof
Vic
tim b
yLo
catio
n of
Hom
icid
e
26
Loca
tion
of h
omic
ide
Tot
al
Und
er18
18
29
303
9 40
and
over
U
nkno
wn
Num
ber
Oth
er...
.....…
...…
......
......
......
Sch
ool .
....…
.....…
......
......
....
Sha
red
resi
denc
e....
......
....…
Str
eet,
side
wal
k…...
......
......
....
All
othe
r....
......
.…...
......
.....…
...H
otel
, mot
el..…
......
......
......
.…O
ther
res
iden
ce...
......
.....…
..Li
quor
sto
re...
......
....…
......
...B
ar..…
.....…
....…
......
......
......
Oth
er b
usin
ess.
….…
......
......
Par
king
lot..
......
......
......
…...
.V
ehic
le...
......
......
.....…
......
....
Fie
ld, p
ark.
…...
.…...
......
......
.
Vic
tim's
res
iden
ce...
......
.....…
Tot
al in
clud
ing
unkn
own.
......
......
.…U
nkno
wn.
.....…
......
.....…
......
......
Tot
al k
now
n..…
......
......
......
......
..V
ictim
's, s
hare
dre
side
nce.
.....
1,80
9 52
1,75
7 45
4 37
3 81
640
663 27
242 7 19
43
90
115 79 5 36
216 5
211 73
55
18
76
62 2 31 0 0 2 7 5 11 2 2
769 19
750
109 95
14
32
6
315 8
107 5 9 15
42
75
39 3 12
351 17
334 77
66
11
13
4
123 6 43 0 7 8 23
16
13 0 7
469 11
458
195
157 38
101
162 11
61 2 3 18
18
19
15 0 15
4 0 4 0 0 0 3 1 0 0 0 0 0 0 0 1 0 0 P
erce
nt b
ased
on to
tal k
now
n
Par
king
lot..
......
......
......
…...
.V
ehic
le...
......
......
.....…
......
....
Fie
ld, p
ark.
…...
.…...
......
......
.S
choo
l ....
.…...
..…...
......
......
.O
ther
......
..…...
…...
......
......
...
Oth
er b
usin
ess.
….…
......
......
Tot
al k
now
n..…
......
......
......
......
..V
ictim
's, s
hare
dre
side
nce.
.....
Vic
tim's
res
iden
ce...
......
.....…
Sha
red
resi
denc
e....
......
....…
Str
eet,
side
wal
k…...
......
......
....
All
othe
r....
......
.…...
......
.....…
...H
otel
, mot
el..…
......
......
......
.…O
ther
res
iden
ce...
......
.....…
..Li
quor
sto
re...
......
....…
......
...B
ar..…
.....…
....…
......
......
......
100.
0 25
.8
21.2
4.
6 36
.4
37.7
1.
5 13
.8
0.4
1.1
2.4
5.1
6.5
4.5
0.3
2.0
100.
0 34
.6
26.1
8.
5 36
.0
29.4
0.
9 14
.7
0.0
0.0
0.9
3.3
2.4
5.2
0.9
0.9
100.
0 14
.5
12.7
1.
9 43
.5
42.0
1.
1 14
.3
0.7
1.2
2.0
5.6
10.0
5.
2 0.
4 1.
6
100.
0 23
.1
19.8
3.
3 40
.1
36.8
1.
8 12
.9
0.0
2.1
2.4
6.9
4.8
3.9
0.0
2.1
100.
0 42
.6
34.3
8.
3 22
.1
35.4
2.
4 13
.3
0.4
0.7
3.9
3.9
4.1
3.3
0.0
3.3
100.
0
Not
es:
Per
cent
ages
may
nota
dd to
sub
tota
lsor
100.
0be
caus
e of
roun
ding
.D
ash
indi
cate
sth
atpe
rcen
tdis
trib
utio
nsar
eno
tcal
cula
ted
whe
nth
e ba
se n
umbe
r is
less
than
50.

Tab
le21
HO
MIC
IDE
CR
IME
S,2
001
2010
By
Typ
eof
Wea
pon
Use
d
27
Typ
eof
wea
pon
used
2001
20
02
2003
20
04
2005
Num
ber
Per
cent
N
umbe
r P
erce
nt
Num
ber
Per
cent
N
umbe
r P
erce
nt
Num
ber
Per
cent
All
othe
r fir
earm
s….…
......
......
.
Tot
al in
clud
ing
unkn
own.
….…
......
...U
nkno
wn.
......
..…...
…...
......
......
.....
Tot
al k
now
n....
….…
......
......
......
.....
Fire
arm
......
..….…
......
......
......
.....
Han
dgun
...…
.…...
......
......
......
..
Oth
er5 ...
......
....…
......
......
......
.
Rifl
e....
......
.…..…
......
......
......
Sho
tgun
......
…..…
......
......
.....
Oth
er fi
rear
m…
..…..…
…...
...F
irear
m
unkn
own
type
......
.N
onfir
earm
......
......
.....…
......
......
.K
nife
1 ......
......
.…...
......
......
......
..B
lunt
obj
ect2 ...
..…...
......
......
.....
Per
sona
l wea
pon3 ...
.…...
......
...A
ll ot
her.
......
.....…
..…...
......
.....
Rop
e4 ......
......
…...
......
......
.....
Dru
gs...
......
....…
..…...
......
.....
2,20
1 28
2,17
3 10
0.0
1,56
8 72
.2
1,34
1 61
.7
227
10.4
67
3.
1 68
3.
1 2
0.1
90
4.1
605
27.8
29
8 13
.7
95
4.4
103
4.7
109
5.0
37
1.7
4 0.
2 68
3.
1
2,39
2 28
2,36
4 10
0.0
1,73
5 73
.4
1,55
5 65
.8
180
7.6
80
3.4
60
2.5
2 0.
1 38
1.
6 62
9 26
.6
274
11.6
11
6 4.
9 11
8 5.
0 12
1 5.
1 41
1.
7 5
0.2
75
3.2
2,40
2 23
2,37
9 10
0.0
1,73
3 72
.8
1,56
6 65
.8
167
7.0
62
2.6
53
2.2
3 0.
1 49
2.
1 64
6 27
.2
258
10.8
11
6 4.
9 13
8 5.
8 13
4 5.
6 58
2.
4 2
0.1
74
3.1
2,39
4 12
2,38
2 10
0.0
1,73
0 72
.6
1,46
2 61
.4
268
11.3
73
3.
1 69
2.
9 3
0.1
123
5.2
652
27.4
28
2 11
.8
104
4.4
148
6.2
118
5.0
49
2.1
5 0.
2 64
2.
7
2,50
3 22
2,48
1 10
0.0
1,84
5 74
.4
1,54
7 62
.4
298
12.0
87
3.
5 75
3.
0 0
0.0
136
5.5
636
25.6
29
1 11
.7
78
3.1
138
5.6
129
5.2
30
1.2
2 0.
1 97
3.
9
Typ
eof
wea
pon
used
(co
nt.)
2006
20
07
2008
20
09
2010
Per
cent
cha
nge
Num
ber
Per
cent
N
umbe
r P
erce
nt
Num
ber
Per
cent
P
erce
nt
Num
ber
Num
ber
Per
cent
2001
20
10
2009
20
10
Fire
arm
un
know
n ty
pe...
....
Tot
al in
clud
ing
unkn
own.
….…
......
...U
nkno
wn.
......
..…...
…...
......
......
.....
Tot
al k
now
n....
….…
......
......
......
.....
Fire
arm
......
..….…
......
......
......
.....
Han
dgun
...…
.…...
......
......
......
..A
ll ot
her
firea
rms…
.…...
......
....
Rifl
e....
......
.…..…
......
......
......
Sho
tgun
......
…..…
......
......
.....
Oth
er fi
rear
m…
..…..…
…...
...
Dru
gs...
......
....…
..…...
......
.....
Oth
er5 ...
......
....…
......
......
......
.
Non
firea
rm...
......
......
..…...
......
....
Kni
fe1 ...
......
....…
......
......
......
.....
Blu
nt o
bjec
t2 .....…
......
......
......
..P
erso
nal w
eapo
n3 ....…
......
......
All
othe
r....
......
..…..…
......
......
..R
ope4 ...
......
...…
......
......
......
..
2,48
3 25
2,45
8 10
0.0
1,82
1 74
.1
1,61
9 65
.9
202
8.2
74
3.0
70
2.8
0 0.
0 58
2.
4 63
7 25
.9
314
12.8
77
3.
1 13
0 5.
3 11
6 4.
7 33
1.
3 5
0.2
78
3.2
2,25
8 34
2,22
4 10
0.0
1,61
0 72
.4
1,37
3 61
.7
237
10.7
52
2.
3 73
3.
3 3
0.1
109
4.9
614
27.6
29
8 13
.4
94
4.2
118
5.3
104
4.7
29
1.3
1 0.
0 74
3.
3
2,14
3 33
2,11
0 10
0.0
1,48
7 70
.5
1,15
3 54
.6
334
15.8
48
2.
3 64
3.
0 8
0.4
214
10.1
62
3 29
.5
297
14.1
11
1 5.
3 12
0 5.
7 95
4.
5 21
1.
0 2
0.1
72
3.4
1,97
0 42
1,92
8 10
0.0
1,35
9 70
.5
1,01
8 52
.8
341
17.7
45
2.
3 49
2.
5 3
0.2
244
12.7
56
9 29
.5
291
15.1
10
2 5.
3 10
7 5.
5 69
3.
6 23
1.
2 1
0.1
45
2.3
1,80
9 46
1,76
3 10
0.0
1,25
5 71
.2
952
54.0
30
3 17
.2
58
3.3
43
2.4
2 0.
1 20
0 11
.3
508
28.8
25
0 14
.2
82
4.7
103
5.8
73
4.1
27
1.5
2 0.
1 44
2.
5
18.
9 8
.6
20.
0 7
.7
29.
0 6
.5
33.5
1
1.1
13.
4 28
.9
36.
8 1
2.2
122.
2 1
8.0
16.
0 1
0.7
16.
1 1
4.1
13.
7 1
9.6
0.0
3.7
3
3.0
5.8
35.
3 2
.2
Not
es:
Per
cent
ages
may
nota
dd to
subt
otal
sor
100.
0be
caus
e of
rou
ndin
g.
Das
hin
dica
tes
that
ape
rcen
tcha
nge
isno
tcal
cula
ted
whe
nth
eba
se n
umbe
r is
less
than
50.
1
Any
inst
rum
ent u
sed
tocu
t or
stab
.2
Clu
b, e
tc.
3H
ands
, fee
t, et
c.4
Any
inst
rum
entu
sed
toha
ng o
rst
rang
le.
5P
oiso
n, a
rson
, pel
let g
un, d
row
ning
, etc
.
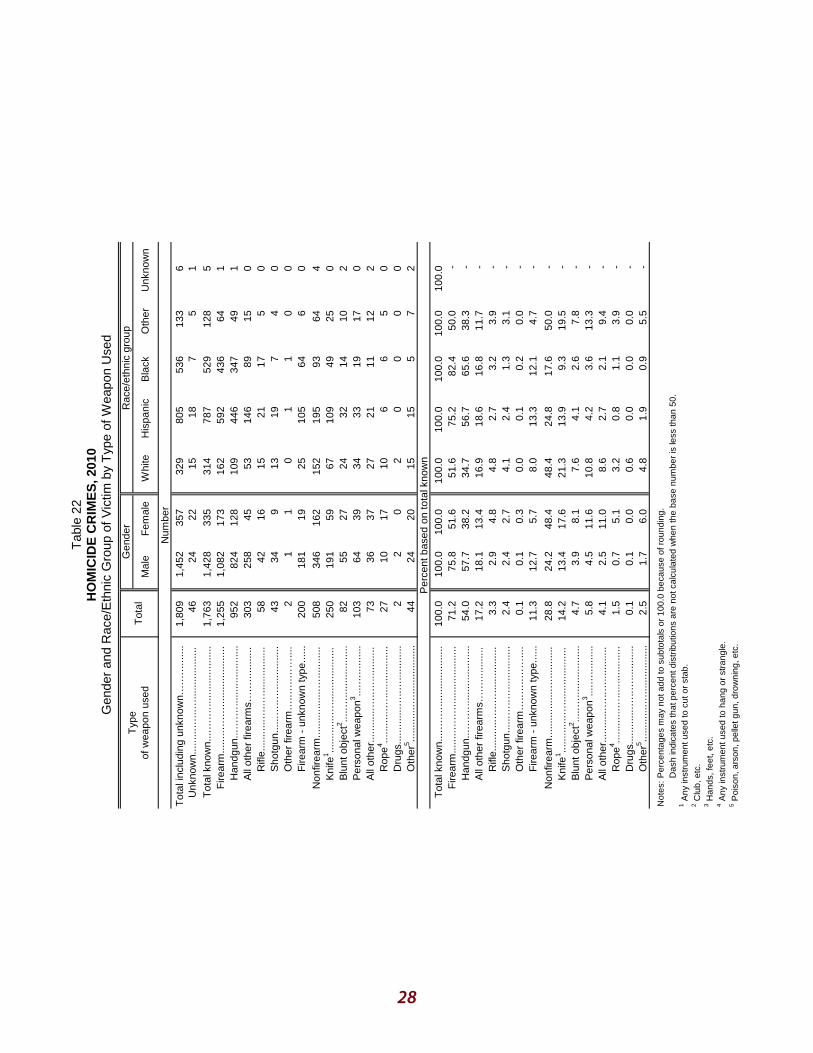
Tab
le 2
2H
OM
ICID
EC
RIM
ES
,201
0G
ende
r an
dR
ace/
Eth
nic
Gro
upof
Vic
tim b
yT
ype
ofW
eapo
n U
sed
28
Typ
eof
wea
pon
used
T
otal
G
ende
r R
ace/
ethn
ic g
roup
Mal
e F
emal
e W
hite
H
ispa
nic
Bla
ck
Oth
er
Unk
now
n
Num
ber
Fire
arm
......
..….…
......
......
......
...
Tot
al in
clud
ing
unkn
own.
….…
......
..U
nkno
wn.
......
..…...
…...
......
......
...T
otal
kno
wn.
...…
.…...
......
......
......
Rop
e4 ......
......
…...
......
......
...
Han
dgun
...…
.…...
......
......
......
All
othe
r fir
earm
s….…
......
.....
Rifl
e....
......
.…..…
......
......
....
Sho
tgun
......
…..…
......
......
...O
ther
fire
arm
…..…
..……
....
Fire
arm
un
know
n ty
pe...
...N
onfir
earm
......
......
.....…
......
.....
Kni
fe1 ...
......
....…
......
......
......
..B
lunt
obj
ect2 ...
..…...
......
......
...P
erso
nal w
eapo
n3 ....…
......
....
All
othe
r....
......
..…..…
......
......
Dru
gs...
......
....…
..…...
......
...O
ther
5 ......
......
.…...
......
......
..
1,80
9 46
1,76
3 1,
255
952
303 58
43
220
0 50
8 25
0 82
103 73
27
2 44
1,45
2 35
7 24
22
1,
428
335
1,08
2 17
3 82
4 12
8 25
8 45
42
16
34
9
1 1
181
19
346
162
191
59
55
27
64
39
36
37
10
17
2 0
24
20
329
805
536
133
6 15
18
7
5 1
314
787
529
128
5 16
2 59
2 43
6 64
1
109
446
347
49
1 53
14
6 89
15
0
15
21
17
5 0
13
19
7 4
0 0
1 1
0 0
25
105
64
6 0
152
195
93
64
4 67
10
9 49
25
0
24
32
14
10
2 34
33
19
17
0
27
21
11
12
2 10
6
6 5
0 2
0 0
0 0
15
15
5 7
2 P
erce
nt b
ased
on to
tal k
now
n
Non
firea
rm...
......
......
..…...
......
..
Tot
al k
now
n....
….…
......
......
......
...F
irear
m...
.....…
.…...
......
......
......
Han
dgun
...…
.…...
......
......
......
All
othe
r fir
earm
s….…
......
.....
Rifl
e....
......
.…..…
......
......
....
Sho
tgun
......
…..…
......
......
...O
ther
fire
arm
…..…
..……
....
Fire
arm
un
know
n ty
pe...
...
Oth
er5 ...
......
....…
......
......
.....
Kni
fe1 ...
......
....…
......
......
......
..B
lunt
obj
ect2 ...
..…...
......
......
...P
erso
nal w
eapo
n3 ....…
......
....
All
othe
r....
......
..…..…
......
......
Rop
e4 ......
......
…...
......
......
...D
rugs
......
......
.…..…
......
......
100.
0 71
.2
54.0
17
.2
3.3
2.4
0.1
11.3
28.8
14
.2
4.7
5.8
4.1
1.5
0.1
2.5
100.
0 10
0.0
75.8
51
.6
57.7
38
.2
18.1
13
.4
2.9
4.8
2.4
2.7
0.1
0.3
12.7
5.
7
24.2
48
.4
13.4
17
.6
3.9
8.1
4.5
11.6
2.
5 11
.0
0.7
5.1
0.1
0.0
1.7
6.0
100.
0 10
0.0
100.
0 10
0.0
100.
0 51
.6
75.2
82
.4
50.0
34.7
56
.7
65.6
38
.3
16
.9
18.6
16
.8
11.7
4.8
2.7
3.2
3.9
4.
1 2.
4 1.
3 3.
1
0.0
0.1
0.2
0.0
8.
0 13
.3
12.1
4.
7
48.4
24
.8
17.6
50
.0
21
.3
13.9
9.
3 19
.5
7.
6 4.
1 2.
6 7.
8
10.8
4.
2 3.
6 13
.3
8.
6 2.
7 2.
1 9.
4
3.2
0.8
1.1
3.9
0.
6 0.
0 0.
0 0.
0
4.8
1.9
0.9
5.5
Not
es:P
erce
ntag
esm
ayno
tadd
to s
ubto
tals
or10
0.0
beca
use
ofro
undi
ng.
Das
h in
dica
tes
that
perc
entd
istr
ibut
ions
are
notc
alcu
late
d w
hen
the
base
num
ber
is le
ssth
an 5
0.
1A
ny in
stru
men
tuse
d to
cuto
rst
ab.
2C
lub,
etc.
3H
ands
, fee
t,et
c.4
Any
inst
rum
entu
sed
toha
ng o
rst
rang
le.
5P
oiso
n,ar
son,
pel
letg
un,d
row
ning
, etc
.
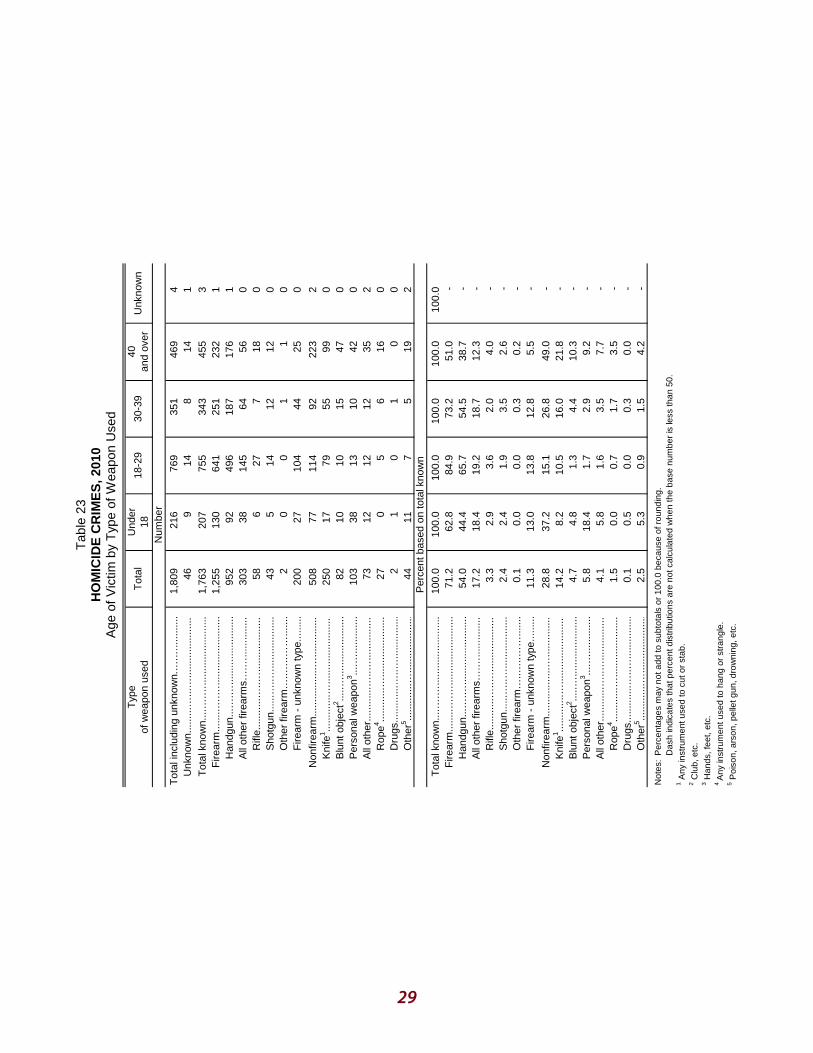
Tab
le 2
3H
OM
ICID
E C
RIM
ES
, 201
0A
ge o
f Vic
tim b
yT
ype
ofW
eapo
n U
sed
Typ
eof
wea
pon
used
T
otal
U
nder
18
182
9 30
39
40an
d ov
er
Unk
now
n
29
Num
ber
Fire
arm
......
..….…
......
......
......
......
Tot
al in
clud
ing
unkn
own.
….…
......
.....
Unk
now
n....
.....…
...…
......
......
......
...T
otal
kno
wn.
...…
.…...
......
......
......
...
Rop
e4 ......
......
…...
......
......
......
Han
dgun
...…
.…...
......
......
......
...A
ll ot
her
firea
rms…
.…...
......
.....
Rifl
e....
......
.…..…
......
......
......
.S
hotg
un...
...…
..…...
......
......
...O
ther
fire
arm
…..…
..……
......
.F
irear
m
unkn
own
type
......
...
Non
firea
rm...
......
......
..…...
......
.....
Kni
fe1 ...
......
....…
......
......
......
......
Blu
nt o
bjec
t2 .....…
......
......
......
...P
erso
nal w
eapo
n3 ....…
......
......
.A
ll ot
her.
......
.....…
..…...
......
......
Dru
gs...
......
....…
..…...
......
......
Oth
er5 ...
......
....…
......
......
......
..
1,80
9 46
1,76
3 1,
255
952
303 58
43 2
200
508
250 82
10
3 73
27 2 44
216 9
207
130 92
38
6 5 0 27
77
17
10
38
12 0 1 11
769 14
75
5 64
1 49
6 14
5 27
14 0
104
114 79
10
13
12 5 0 7
351 8
343
251
187 64 7 12 1 44
92
55
15
10
12 6 1 5
469 14
455
232
176 56
18
12 1 25
223 99
47
42
35
16
0 19
4 1 3 1 1 0 0 0 0 0 2 0 0 0 2 0 0 2 P
erce
nt b
ased
on to
tal k
now
n
Non
firea
rm...
......
......
..…...
......
.....
Tot
al k
now
n....
….…
......
......
......
......
Fire
arm
......
..….…
......
......
......
......
Han
dgun
...…
.…...
......
......
......
...A
ll ot
her
firea
rms…
.…...
......
.....
Rifl
e....
......
.…..…
......
......
......
.S
hotg
un...
...…
..…...
......
......
...O
ther
fire
arm
…..…
..……
......
.F
irear
m
unkn
own
type
......
...
Oth
er5 ...
......
....…
......
......
......
..
Kni
fe1 ...
......
....…
......
......
......
......
Blu
nt o
bjec
t2 .....…
......
......
......
...P
erso
nal w
eapo
n3 ....…
......
......
.A
ll ot
her.
......
.....…
..…...
......
......
Rop
e4 ......
......
…...
......
......
......
Dru
gs...
......
....…
..…...
......
......
100.
0 71
.2
54.0
17
.2
3.3
2.4
0.1
11.3
28.8
14
.2
4.7
5.8
4.1
1.5
0.1
2.5
100.
0 62
.8
44.4
18
.4
2.9
2.4
0.0
13.0
37.2
8.
2 4.
8 18
.4
5.8
0.0
0.5
5.3
100.
0 84
.9
65.7
19
.2
3.6
1.9
0.0
13.8
15.1
10
.5
1.3
1.7
1.6
0.7
0.0
0.9
100.
0 73
.2
54.5
18
.7
2.0
3.5
0.3
12.8
26.8
16
.0
4.4
2.9
3.5
1.7
0.3
1.5
100.
0 51
.0
38.7
12
.3
4.0
2.6
0.2
5.5
49.0
21
.8
10.3
9.
2 7.
7 3.
5 0.
0 4.
2
100.
0
Not
es:
Per
cent
ages
may
nota
dd to
subt
otal
sor
100.
0be
caus
e of
roun
ding
.D
ash
indi
cate
sth
atpe
rcen
tdis
trib
utio
nsar
eno
tcal
cula
ted
whe
nth
e ba
se n
umbe
r is
less
than
50.
1
Any
inst
rum
entu
sed
tocu
tor
stab
.2
Clu
b, e
tc.
3H
ands
, fee
t, et
c.4
Any
inst
rum
entu
sed
toha
ng o
rst
rang
le.
5P
oiso
n, a
rson
, pel
letg
un,d
row
ning
,etc
.

Tab
le24
HO
MIC
IDE
CR
IME
S,2
001
2010
By
Con
trib
utin
gC
ircum
stan
ce
30
Con
trib
utin
gci
rcum
stan
ce
2001
20
02
2003
20
04
2005
Num
ber
Per
cent
N
umbe
r P
erce
nt
Num
ber
Per
cent
N
umbe
r P
erce
nt
Per
cent
N
umbe
r
Gan
gre
late
d....
......
......
..
Tot
al in
clud
ing
unkn
own…
......
Unk
now
n....
......
......
......
......
..T
otal
kno
wn.
......
......
......
......
.R
ape,
rob
bery
, bur
glar
y….
Rap
e....
......
.....…
......
......
Rob
bery
......
......
......
......
.B
urgl
ary…
......
......
......
....
Arg
umen
t.....
.…...
......
......
..D
omes
tic v
iole
nce.
......
..A
ll ot
her
argu
men
t.....
....
Gan
g, d
rug
rela
ted…
......
.
Dru
gre
late
d....
......
......
...A
ll ot
her.
......
......
…...
......
...
2,20
1 31
7 1,
884
100.
0 14
9 7.
9 12
0.
6 13
3 7.
1 4
0.2
793
42.1
17
6 9.
3 61
7 32
.7
726
38.5
64
7 34
.3
79
4.2
216
11.5
2,39
2 37
0 2,
022
100.
0 17
9 8.
9 8
0.4
163
8.1
8 0.
4 77
9 38
.5
181
9.0
598
29.6
81
6 40
.4
730
36.1
86
4.
3 24
8 12
.3
2,40
2 41
0 1,
992
100.
0 16
1 8.
1 7
0.4
137
6.9
17
0.9
836
42.0
18
7 9.
4 64
9 32
.6
772
38.8
66
9 33
.6
103
5.2
223
11.2
2,39
4 32
0 2,
074
100.
0 14
5 7.
0 6
0.3
128
6.2
11
0.5
886
42.7
16
3 7.
9 72
3 34
.9
786
37.9
69
8 33
.7
88
4.2
257
12.4
2,50
3 52
6 1,
977
100.
0 15
1 7.
6 7
0.4
135
6.8
9 0.
5 79
1 40
.0
160
8.1
631
31.9
75
6 38
.2
653
33.0
10
3 5.
2 27
9 14
.1
Con
trib
utin
gci
rcum
stan
ce (
cont
.)
2006
20
07
2008
20
09
2010
P
erce
nt c
hang
e
Num
ber
Per
cent
N
umbe
r P
erce
nt
Num
ber
Per
cent
N
umbe
r P
erce
nt
Num
ber
Per
cent
20
09
2010
20
01
2010
T
otal
incl
udin
g un
know
n…...
...
Bur
glar
y…...
......
......
......
.
Unk
now
n....
......
......
......
......
..T
otal
kno
wn.
......
......
......
......
.R
ape,
rob
bery
, bur
glar
y….
Rap
e....
......
.....…
......
......
Rob
bery
......
......
......
......
.
All
othe
r....
......
...…
......
......
Arg
umen
t.....
.…...
......
......
..D
omes
tic v
iole
nce.
......
..A
ll ot
her
argu
men
t.....
....
Gan
g, d
rug
rela
ted…
......
.G
ang
rela
ted.
......
......
.....
Dru
gre
late
d....
......
......
...
2,48
3 56
8 1,
915
100.
0 14
1 7.
4 6
0.3
132
6.9
3 0.
2 74
1 38
.7
141
7.4
600
31.3
74
8 39
.1
645
33.7
10
3 5.
4 28
5 14
.9
2,25
8 82
5 1,
433
100.
0 10
7 7.
5 3
0.2
94
6.6
10
0.7
599
41.8
11
9 8.
3 48
0 33
.5
510
35.6
46
9 32
.7
41
2.9
217
15.1
2,14
3 75
1 1,
392
100.
0 97
7.
0 0
0.0
92
6.6
5 0.
4 53
1 38
.1
113
8.1
418
30.0
51
1 36
.7
469
33.7
42
3.
0 25
3 18
.2
1,97
0 55
0 1,
420
100.
0 11
9 8.
4 1
0.1
110
7.7
8 0.
6 49
7 35
.0
130
9.2
367
25.8
59
0 41
.5
554
39.0
36
2.
5 21
4 15
.1
1,80
9 53
1 1,
278
100.
0 10
1 7.
9 2
0.2
91
7.1
8 0.
6 45
2 35
.4
157
12.3
29
5 23
.1
505
39.5
46
1 36
.1
44
3.4
220
17.2
32.
2 1
0.0
32.
2 1
5.1
31.
6 1
7.3
43.
0 9
.1
10.
8 20
.8
52.
2 1
9.6
30.
4 1
4.4
28.
7 1
6.8
44.
3
1.9
2.8
Not
es:
Per
cent
ages
may
nota
dd to
subt
otal
sor
100.
0be
caus
e of
roun
ding
.D
ash
indi
cate
s th
ata
perc
entc
hang
e is
notc
alcu
late
d w
hen
the
base
num
ber
is le
ss th
an 5
0.

Tab
le 2
5H
OM
ICID
EC
RIM
ES
, 201
0G
ende
r an
dR
ace/
Eth
nic
Gro
upof
Vic
tim b
yC
ontr
ibut
ing
Circ
umst
ance
31
Con
trib
utin
gci
rcum
stan
ce
Tot
al
Gen
der
Rac
e/et
hnic
gro
up
Mal
e F
emal
e W
hite
H
ispa
nic
Bla
ck
Oth
er
Unk
now
n
Num
ber
Rap
e....
...…
......
......
.....…
...
Tot
al in
clud
ing
unkn
own.
…...
......
Unk
now
n....
......
......
......
..…...
...
Tot
al k
now
n....
..…...
......
.....…
...R
ape,
rob
bery
, bur
glar
y....
.....
Rob
bery
, bur
glar
y....
......
.....
Rob
bery
.....…
......
......
....…
Bur
glar
y....
.…...
......
......
.…
Arg
umen
t.....
...…
......
......
....…
Dom
estic
vio
lenc
e....
......
...…
All
othe
r ar
gum
ent..
......
.....…
Gan
g, d
rug
rela
ted.
......
......
.…G
ang
rela
ted.
......
......
.…...
..D
rug
rela
ted.
......
......
......
....
All
othe
r…...
...…
......
......
......
…
1,80
9 53
1
1,27
8 10
1 2 99
91 8
452
157
295
505
461 44
22
0
1,45
2 35
7 45
1 80
1,00
1 27
7 84
17
0
2 84
15
81
10
3
5
295
157
27
130
268
27
479
26
436
25
43
1 14
3 77
329
805
536
133
6 79
21
8 18
8 40
6
250
587
348
93
0 34
37
19
11
0
2 0
0 0
0 32
37
19
11
0
26
35
19
11
0 6
2 0
0 0
146
172
91
43
0 62
55
21
19
0
84
117
70
24
0 16
29
0 17
9 20
0
12
269
164
16
0 4
21
15
4 0
54
88
59
19
0 P
erce
nt b
ased
on
tota
l kno
wn
Tot
al k
now
n....
..…...
......
......
..…
All
othe
r…...
...…
......
......
..…..
Rap
e, r
obbe
ry, b
urgl
ary.
......
..R
ape.
......
…...
......
......
......
…R
obbe
ry, b
urgl
ary.
......
......
.…R
obbe
ry...
..…...
......
......
.…B
urgl
ary.
....…
......
......
.…..
Arg
umen
t.....
...…
......
......
.…..
Dom
estic
vio
lenc
e ....
......
...…
All
othe
r ar
gum
ent..
......
.....…
Gan
g, d
rug
rela
ted.
......
......
…G
ang
rela
ted.
......
......
......
..…D
rug
rela
ted.
......
......
......
.…
100.
0 7.
9 0.
2 7.
7 7.
1 0.
6
35.4
12
.3
23.1
39
.5
36.1
3.
4 17
.2
100.
0 10
0.0
8.4
6.1
0.0
0.7
8.4
5.4
8.1
3.6
0.3
1.8
29.5
56
.7
2.7
46.9
26
.8
9.7
47.9
9.
4 43
.6
9.0
4.3
0.4
14.3
27
.8
100.
0 10
0.0
100.
0 10
0.0
100.
0 13
.6
6.3
5.5
11.8
0.8
0.0
0.0
0.0
12
.8
6.3
5.5
11.8
10.4
6.
0 5.
5 11
.8
2.
4 0.
3 0.
0 0.
0
58.4
29
.3
26.1
46
.2
24
.8
9.4
6.0
20.4
33.6
19
.9
20.1
25
.8
6.
4 49
.4
51.4
21
.5
4.
8 45
.8
47.1
17
.2
1.
6 3.
6 4.
3 4.
3
21.6
15
.0
17.0
20
.4
N
otes
: P
erce
ntag
esm
ayno
tadd
to s
ubto
tals
or 1
00.0
bec
ause
ofr
ound
ing.
D
ash
indi
cate
s th
atpe
rcen
tdis
trib
utio
nsar
eno
tcal
cula
ted
whe
n th
e ba
senu
mbe
r is
less
than
50.

Tab
le 2
6H
OM
ICID
EC
RIM
ES
, 201
0A
geof
Vic
tim b
yC
ontr
ibut
ing
Circ
umst
ance
32
Con
trib
utin
gci
rcum
stan
ce
Tot
al
Und
er 5
5
17
182
9 30
39
404
9 50
59
606
9 70
and
over
U
nkno
wn
Num
ber
Tot
al in
clud
ing
unkn
own…
......
..
Bur
glar
y....
......
......
......
.....
Unk
now
n.…
......
......
......
......
...
Tot
al k
now
n....
......
......
......
.....
Rap
e, r
obbe
ry, b
urgl
ary.
.....
Rap
e…...
......
…...
......
......
Rob
bery
......
......
......
......
...
Arg
umen
t..…
......
......
......
....
Dom
estic
vio
lenc
e…...
.....
All
othe
r ar
gum
ent..
......
...G
ang
, dru
gre
late
d..…
......
.G
ang
rela
ted.
......
......
......
Dru
gre
late
d....
......
......
....
Chi
ldab
use.
..…...
......
......
...A
ll ot
her…
......
......
.…...
......
.
1,80
9 53
1
1,27
8 10
1 2 91 8
452
157
295
505
461 44
70
150
63 2 61 0 0 0 0 0 0 0 0 0 0 56 5
153 35
118 1 0 1 0 12 6 6 73
73 0 14
18
769
236
533 26
0 25 1
151 42
10
9 29
4 27
3 21 0 62
351
100
251 27
1 24 2 97
35
62
97
83
14 0 30
213 66
147 15
1 14 0 89
34
55
31
23 8 0 12
142 44
98
18 0 17 1 61
21
40 7 6 1 0 12
69
24
45 6 0 5 1 30
12
18 2 2 0 0 7
45
20
25 8 0 5 3 12 7 5 1 1 0 0 4
4 4 0 0 0 0 0 0 0 0 0 0 0 0 0 P
erce
nt b
ased
on
tota
l kno
wn
Rob
bery
......
......
......
......
...
Tot
al k
now
n....
......
......
......
.....
Rap
e, r
obbe
ry, b
urgl
ary.
.....
Rap
e…...
......
…...
......
......
Dru
gre
late
d....
......
......
....
Chi
ldab
use.
..…...
......
......
...A
ll ot
her…
......
......
.…...
......
.
Bur
glar
y....
......
......
......
.....
Arg
umen
t..…
......
......
......
....
Dom
estic
vio
lenc
e…...
.....
All
othe
r ar
gum
ent..
......
...G
ang
, dru
gre
late
d..…
......
.G
ang
rela
ted.
......
......
......
100.
0 7.
9 0.
2 7.
1 0.
6
35.4
12
.3
23.1
39
.5
36.1
3.
4
5.5
11.7
100.
0 0.
0 0.
0 0.
0 0.
0
0.0
0.0
0.0
0.0
0.0
0.0
91.8
8.
2
100.
0 0.
8 0.
0 0.
8 0.
0
10.2
5.
1 5.
1 61
.9
61.9
0.
0
11.9
15
.3
100.
0 4.
9 0.
0 4.
7 0.
2
28.3
7.
9 20
.5
55.2
51
.2
3.9
0.0
11.6
100.
0 10
.8
0.4
9.6
0.8
38.6
13
.9
24.7
38
.6
33.1
5.
6
0.0
12.0
100.
0 10
.2
0.7
9.5
0.0
60.5
23
.1
37.4
21
.1
15.6
5.
4
0.0
8.2
100.
0 18
.4
0.0
17.3
1.
0
62.2
21
.4
40.8
7.
1 6.
1 1.
0
0.0
12.2
100.
0
100.
0
100.
0
Not
es:
Per
cent
ages
may
nota
dd to
subt
otal
s or
100.
0be
caus
e of
roun
ding
.D
ash
indi
cate
s th
atda
taar
e no
tapp
licab
le o
rth
atpe
rcen
tdis
trib
utio
ns a
re n
otca
lcul
ated
whe
nth
e ba
se n
umbe
r is
less
than
50.

33
Tab
le 2
7H
OM
ICID
EC
RIM
ES
,201
0C
ontr
ibut
ing
Circ
umst
ance
byR
elat
ions
hip
ofV
ictim
to O
ffend
er
Rel
atio
nshi
pof
vic
tim to
offe
nder
T
otal
R
ape
Rob
bery
,bu
rgla
ry
Arg
umen
t1 G
ang
,dr
ug
rela
ted
Chi
ldab
use
All
othe
r U
nkno
wn
Num
ber
Frie
nd, a
cqua
inta
nce2 …
..…
Spo
use3 ...
...…
......
......
.....…
Par
ent,
child
4 …...
……
.....…
Tot
al k
now
n.…
......
....…
......
…
Tot
al in
clud
ing
unkn
own…
.....…
Unk
now
n..…
......
......
..…...
...…
All
othe
r re
lativ
es…
.…...
..…S
tran
ger.
......
....…
......
......
…
1,80
9 80
4 1,
005
446 84
83
37
35
5
2 1 1 0 0 0 0 1
99
35
64
16 0 0 1 47
452 42
41
0 21
7 81
16
16
80
505
292
213
117 0 0 1 95
70 4 66
10 0 52 3 1
150 55
95
37
1 7 9 41
531
375
156 49
2 8 7 90
Per
cent
bas
edon
tota
l kno
wn
All
othe
r re
lativ
es…
.…...
..…S
tran
ger.
......
....…
......
......
…
Frie
nd, a
cqua
inta
nce2 …
..…
Spo
use3 ...
...…
......
......
.....…
Par
ent,
child
4 …...
….…
....…
Tot
al k
now
n.…
......
....…
......
…
100.
0 44
.4
8.4
8.3
3.7
35.3
100.
0
100.
0 25
.0
0.0
0.0
1.6
73.4
100.
0 52
.9
19.8
3.
9 3.
9 19
.5
100.
0 54
.9
0.0
0.0
0.5
44.6
100.
0 15
.2
0.0
78.8
4.
5 1.
5
100.
0 38
.9
1.1
7.4
9.5
43.2
100.
0 31
.4
1.3
5.1
4.5
57.7
Not
es:
Per
cent
ages
may
nota
dd to
100.
0be
caus
e of
roun
ding
. D
ash
indi
cate
s th
atpe
rcen
tdis
trib
utio
nsar
eno
tcal
cula
ted
whe
nth
e ba
se n
umbe
r is
less
than
50.
1
Incl
udes
dom
estic
vio
lenc
e.2
Incl
udes
exh
usba
nd,e
xw
ife,e
mpl
oyer
,em
ploy
ee,g
ang
mem
ber,
etc.
3 In
clud
es "
com
mon
law
"m
arria
ge p
artn
er.
4 In
clud
es s
tepm
othe
r, s
tepf
athe
r, s
tepd
augh
ter,
and
ste
pson
.
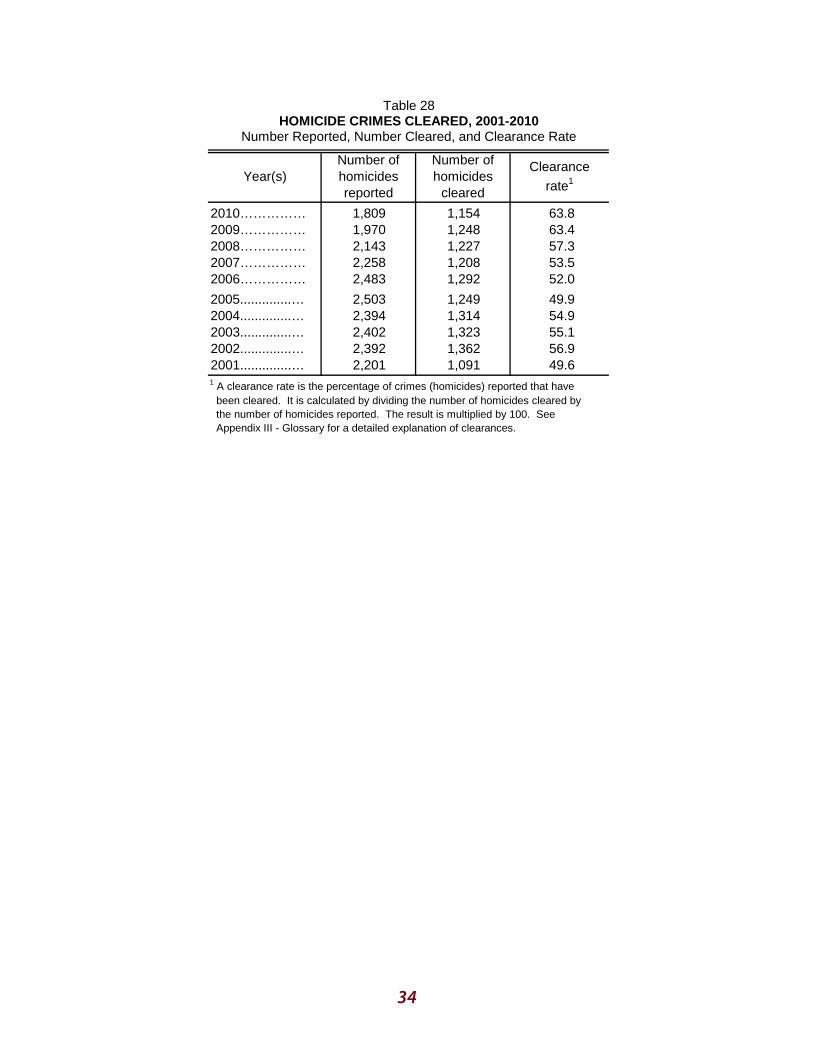
Table 28 HOMICIDE CRIMES CLEARED, 20012010
Number Reported, Number Cleared, and Clearance Rate
Year(s) Number of homicides reported
Number of homicides
cleared
Clearance rate1
2008…………… 2007…………… 2006……………
2003..............… 2002..............… 2001..............…
2010……………
2005..............… 2004..............…
2009…………… 1,809 1,970 2,143 2,258 2,483
2,503 2,394 2,402 2,392 2,201
1,154 1,248 1,227 1,208 1,292
1,249 1,314 1,323 1,362 1,091
63.8 63.4 57.3 53.5 52.0
49.9 54.9 55.1 56.9 49.6
1 A clearance rate is the percentage of crimes (homicides) reported that have been cleared. It is calculated by dividing the number of homicides cleared by the number of homicides reported. The result is multiplied by 100. See Appendix III Glossary for a detailed explanation of clearances.
34

Table 29 FELONY ARRESTS FOR
SELECTED VIOLENT OFFENSES, 20012010 Number, Rate per 100,000 Population at Risk, and Percent Change
Year(s) Total Homicide Forcible
rape Robbery Assault
Number 2010.................... 114,646 1,638 1,957 19,021 92,030 2009.................... 122,078 1,804 2,050 21,610 96,614 2008.................... 126,252 1,850 2,103 22,488 99,811 2007.................... 127,633 2,017 2,164 21,614 101,838 2006.................... 124,624 1,967 2,122 20,376 100,159
2005.................... 123,967 1,956 2,098 18,218 101,695 2004.................... 125,263 1,978 2,237 17,864 103,184 2003.................... 129,522 1,839 2,456 17,501 107,726 2002.................... 130,295 1,864 2,549 16,957 108,925 2001.................... 134,398 1,754 2,730 17,167 112,747
Percent change in number
2007 to 2008....... 2006 to 2007....... 2005 to 2006.......
2002 to 2003....... 2001 to 2002.......
2008 to 2009....... 2009 to 2010.......
2004 to 2005....... 2003 to 2004.......
2001 to 2010.......
6.1 3.3 1.1 2.4 0.5
1.0 3.3 0.6 3.1
14.7
9.2 2.5 8.3 2.5 0.6
1.1 7.6
1.3 6.3
6.6
4.5 2.5 2.8 2.0 1.1
6.2 8.9 3.6 6.6
28.3
12.0 3.9 4.0 6.1
11.8
2.0 2.1 3.2
1.2
10.8
4.7 3.2 2.0 1.7
1.5
1.4 4.2 1.1 3.4
18.4 Rate per 100,000 population at risk1
2008.................... 2007.................... 2006....................
2003.................... 2002.................... 2001....................
2010.................... 2009....................
2005.................... 2004....................
374.8 403.6 422.1 431.8 426.3
430.3 441.7 465.6 477.2 502.5
5.4 6.0 6.2 6.8 6.7
6.8 7.0 6.6 6.8 6.6
6.4 6.8 7.0 7.3 7.3
7.3 7.9 8.8 9.3
10.2
62.2 71.4 75.2 73.1 69.7
63.2 63.0 62.9 62.1 64.2
300.9 319.4 333.7 344.5 342.6
353.0 363.9 387.3 399.0 421.6
Percent change in rate
2007 to 2008....... 2006 to 2007....... 2005 to 2006.......
2002 to 2003....... 2001 to 2002.......
2003 to 2004.......
2001 to 2010.......
2004 to 2005.......
2009 to 2010....... 2008 to 2009.......
7.1 4.4 2.2 1.3
0.9
2.6 5.1 2.4 5.0
25.4
10.0 3.2 8.8 1.5
1.5
2.9 6.1
2.9 3.0
18.2
5.9 2.9 4.1 0.0 0.0
7.6 10.2
5.4 8.8
37.3
12.9 5.1 2.9 4.9
10.3
0.3 0.2 1.3
3.3
3.1
5.8 4.3 3.1 0.6
2.9
3.0 6.0 2.9 5.4
28.6
Notes: Rates may not add to total because of rounding. Rates are based on annual population estimates provided by the Demographic Research Unit, California Department of Finance.
1 Rates are based on the total population at risk (1069 years of age).
35
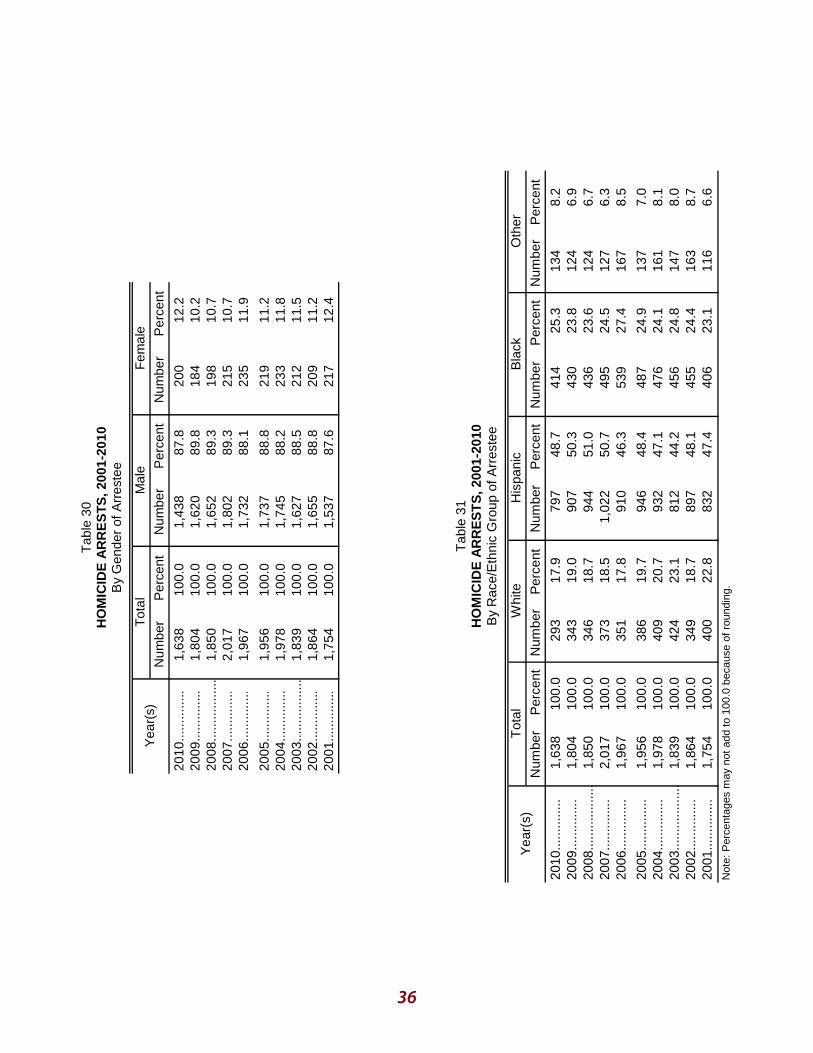
Tab
le 3
0H
OM
ICID
EA
RR
ES
TS
, 200
120
10B
yG
ende
r of
Arr
este
e
36
Yea
r(s)
T
otal
M
ale
Fem
ale
Num
ber
Per
cent
N
umbe
r P
erce
nt
Num
ber
Per
cent
2008
......
......
.....
2007
......
......
.. 20
06...
......
.....
2005
......
......
..
2003
......
......
.....
2002
......
......
.. 20
01...
......
.....
2010
......
......
..20
09...
......
.....
2004
......
......
..
1,63
8 10
0.0
1,80
4 10
0.0
1,85
0 10
0.0
2,01
7 10
0.0
1,96
7 10
0.0
1,95
6 10
0.0
1,97
8 10
0.0
1,83
9 10
0.0
1,86
4 10
0.0
1,75
4 10
0.0
1,43
8 87
.8
1,62
0 89
.8
1,65
2 89
.3
1,80
2 89
.3
1,73
2 88
.1
1,73
7 88
.8
1,74
5 88
.2
1,62
7 88
.5
1,65
5 88
.8
1,53
7 87
.6
200
12.2
18
4 10
.2
198
10.7
21
5 10
.7
235
11.9
219
11.2
23
3 11
.8
212
11.5
20
9 11
.2
217
12.4
Tab
le 3
1H
OM
ICID
EA
RR
ES
TS
,200
120
10B
yR
ace/
Eth
nic
Gro
upof
Arr
este
e
Yea
r(s)
T
otal
W
hite
H
ispa
nic
Bla
ck
Oth
er
Num
ber
Per
cent
N
umbe
r P
erce
nt
Per
cent
N
umbe
rN
umbe
r P
erce
nt
Num
ber
Per
cent
2008
......
......
......
20
07...
......
.....
2006
......
......
..
2005
......
......
..
2003
......
......
......
20
02...
......
.....
2001
......
......
..
2010
......
......
..20
09...
......
.....
2004
......
......
..
1,63
8 10
0.0
1,80
4 10
0.0
1,85
0 10
0.0
2,01
7 10
0.0
1,96
7 10
0.0
1,95
6 10
0.0
1,97
8 10
0.0
1,83
9 10
0.0
1,86
4 10
0.0
1,75
4 10
0.0
293
17.9
34
3 19
.0
346
18.7
37
3 18
.5
351
17.8
386
19.7
40
9 20
.7
424
23.1
34
9 18
.7
400
22.8
797
48.7
90
7 50
.3
944
51.0
1,
022
50.7
91
0 46
.3
946
48.4
93
2 47
.1
812
44.2
89
7 48
.1
832
47.4
414
25.3
43
0 23
.8
436
23.6
49
5 24
.5
539
27.4
487
24.9
47
6 24
.1
456
24.8
45
5 24
.4
406
23.1
134
8.2
124
6.9
124
6.7
127
6.3
167
8.5
137
7.0
161
8.1
147
8.0
163
8.7
116
6.6
Not
e:P
erce
ntag
esm
ayno
tadd
to10
0.0
beca
use
ofro
undi
ng.
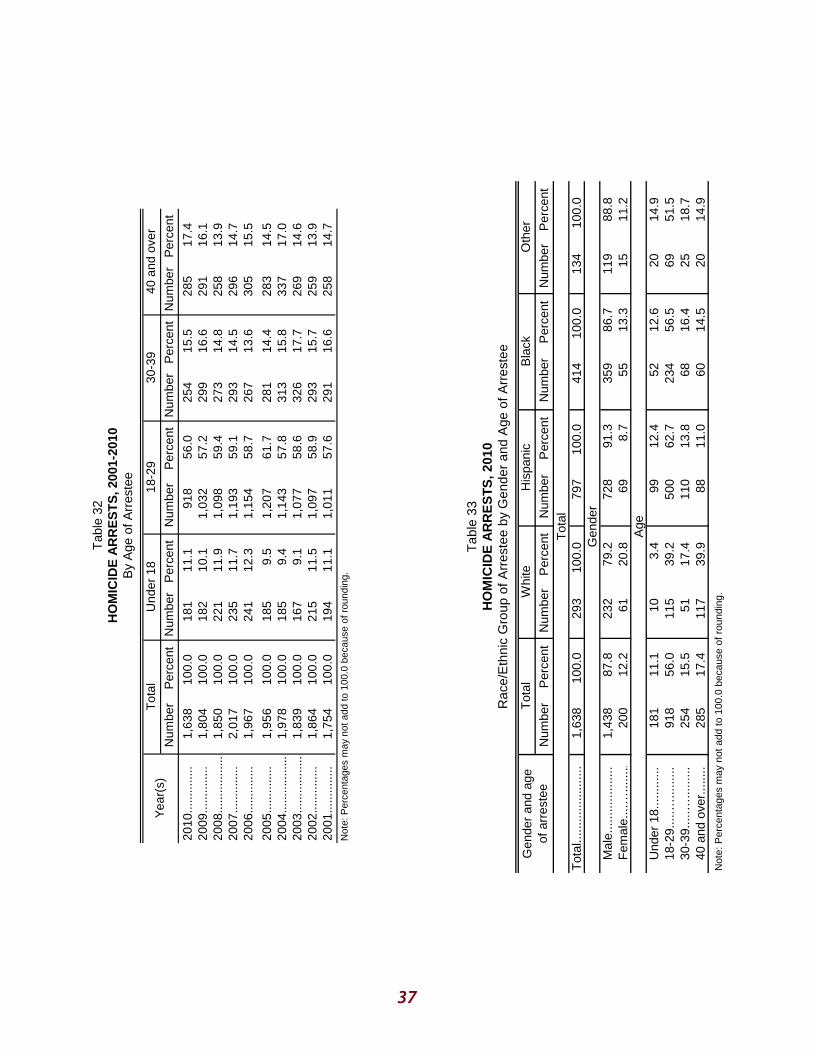
Tab
le32
HO
MIC
IDE
AR
RE
ST
S, 2
001
2010
By
Age
ofA
rres
tee
37
Yea
r(s)
T
otal
U
nder
18
182
9 30
39
40 a
nd o
ver
Num
ber
Per
cent
N
umbe
r P
erce
nt
Per
cent
N
umbe
rN
umbe
r P
erce
nt
Num
ber
Per
cent
2008
......
......
......
20
07...
......
.....
2006
......
......
..
2005
......
......
.. 20
04...
......
......
...
2003
......
......
......
20
02...
......
.....
2001
......
......
..
2010
......
......
..20
09...
......
.....
1,63
8 10
0.0
1,80
4 10
0.0
1,85
0 10
0.0
2,01
7 10
0.0
1,96
7 10
0.0
1,95
6 10
0.0
1,97
8 10
0.0
1,83
9 10
0.0
1,86
4 10
0.0
1,75
4 10
0.0
181
11.1
18
2 10
.1
221
11.9
23
5 11
.7
241
12.3
185
9.5
185
9.4
167
9.1
215
11.5
19
4 11
.1
918
56.0
1,
032
57.2
1,
098
59.4
1,
193
59.1
1,
154
58.7
1,20
7 61
.7
1,14
3 57
.8
1,07
7 58
.6
1,09
7 58
.9
1,01
1 57
.6
254
15.5
29
9 16
.6
273
14.8
29
3 14
.5
267
13.6
281
14.4
31
3 15
.8
326
17.7
29
3 15
.7
291
16.6
285
17.4
29
1 16
.1
258
13.9
29
6 14
.7
305
15.5
283
14.5
33
7 17
.0
269
14.6
25
9 13
.9
258
14.7
N
ote:
Per
cent
ages
may
nota
dd to
100.
0be
caus
e of
roun
ding
.
Tab
le 3
3H
OM
ICID
EA
RR
ES
TS
, 201
0R
ace/
Eth
nic
Gro
upof
Arr
este
e by
Gen
der
and
Age
ofA
rres
tee
Gen
der
and
age
of a
rres
tee
Tot
al
Whi
te
His
pani
c B
lack
O
ther
N
umbe
r P
erce
nt
Num
ber
Per
cent
N
umbe
r P
erce
nt
Num
ber
Per
cent
P
erce
nt
Num
ber
Tot
al
Tot
al...
......
......
......
.1,
638
100.
0 29
3 10
0.0
797
100.
0 41
4 10
0.0
134
100.
0 G
ende
r M
ale.
......
......
......
Fem
ale.
...…
......
..1,
438
87.8
20
0 12
.2
232
79.2
61
20
.8
728
91.3
69
8.
7 35
9 86
.7
55
13.3
11
9 88
.8
15
11.2
A
ge
40 a
nd o
ver.
......
.
Und
er 1
8....
......
..18
29.
....…
......
...30
39.
....…
......
...
181
11.1
91
8 56
.0
254
15.5
28
5 17
.4
10
3.4
115
39.2
51
17
.4
117
39.9
99
12.4
50
0 62
.7
110
13.8
88
11
.0
52
12.6
23
4 56
.5
68
16.4
60
14
.5
20
14.9
69
51
.5
25
18.7
20
14
.9
Not
e:P
erce
ntag
esm
ayno
tadd
to 1
00.0
bec
ause
ofro
undi
ng.

Table 34 HOMICIDE ARRESTS, 2010
Race/Ethnic Group of Arrestee by Gender and Age of Arrestee
Gender and age of arrestee
Total White Hispanic Black Other Number Percent Number Percent Number Percent Number Percent Percent Number
Total.......................... 1,638 100.0 293 100.0 797 100.0 414 100.0 134 100.0 Under 18..…........... 181 11.1 10 3.4 99 12.4 52 12.6 20 14.9 1819...................... 254 15.5 17 5.8 146 18.3 72 17.4 19 14.2 2024...................... 393 24.0 54 18.4 211 26.5 100 24.2 28 20.9 2529...................... 271 16.5 44 15.0 143 17.9 62 15.0 22 16.4 3034...................... 155 9.5 25 8.5 75 9.4 47 11.4 8 6.0
3539...................... 99 6.0 26 8.9 35 4.4 21 5.1 17 12.7 4044...................... 88 5.4 31 10.6 36 4.5 17 4.1 4 3.0 4549...................... 71 4.3 34 11.6 22 2.8 9 2.2 6 4.5 5054...................... 55 3.4 17 5.8 18 2.3 15 3.6 5 3.7 55 and over…........ 71 4.3 35 11.9 12 1.5 19 4.6 5 3.7
Male........…............ 1,438 100.0 232 100.0 728 100.0 359 100.0 119 100.0 Under 18..…........ 157 10.9 9 3.9 91 12.5 38 10.6 19 16.0 1819................... 241 16.8 15 6.5 140 19.2 69 19.2 17 14.3 2024................... 346 24.1 44 19.0 192 26.4 85 23.7 25 21.0 2529................... 229 15.9 34 14.7 127 17.4 49 13.6 19 16.0 3034................... 132 9.2 20 8.6 62 8.5 42 11.7 8 6.7
3539................... 85 5.9 18 7.8 32 4.4 19 5.3 16 13.4 4044................... 75 5.2 23 9.9 33 4.5 16 4.5 3 2.5 4549................... 58 4.0 25 10.8 21 2.9 8 2.2 4 3.4 5054................... 49 3.4 13 5.6 18 2.5 15 4.2 3 2.5 55 and over…..... 66 4.6 31 13.4 12 1.6 18 5.0 5 4.2
Female..….............. 200 100.0 61 100.0 69 100.0 55 100.0 15 100.0 Under 18............. 24 12.0 1 1.6 8 11.6 14 25.5 1 1819................... 13 6.5 2 3.3 6 8.7 3 5.5 2 2024................... 47 23.5 10 16.4 19 27.5 15 27.3 3 2529................... 42 21.0 10 16.4 16 23.2 13 23.6 3 3034................... 23 11.5 5 8.2 13 18.8 5 9.1 0
3539................... 14 7.0 8 13.1 3 4.3 2 3.6 1 4044................... 13 6.5 8 13.1 3 4.3 1 1.8 1 4549................... 13 6.5 9 14.8 1 1.4 1 1.8 2 5054................... 6 3.0 4 6.6 0 0.0 0 0.0 2 55 and over…..... 5 2.5 4 6.6 0 0.0 1 1.8 0
Notes: Percentages may not add to 100.0 because of rounding. Dash indicates that percent distributions are not calculated when the base number is less than 50.
38

Table 35 PERSONS UNDER CALIFORNIA
SENTENCE OF DEATH, 19782010
Year(s) Initial
sentences
Total persons under
sentence of death1, 2
2010.…….............. 34 709 2009.…….............. 29 681 2008.…….............. 21 665 2007.…….............. 17 659 2006.…….............. 17 649
2005.…….............. 22 641 2004.…….............. 12 632 2003.…….............. 22 626 2002.…….............. 17 610 2001..……............. 25 600
2000..……............. 33 583 1999..……............. 42 550 1998..……............. 32 513 1997...……............ 40 492 1996..……............. 40 460
1995...……............ 38 427 1994.…….............. 21 393 1993.…….............. 34 376 1992....……........... 40 348 1991.......……........ 26 308
1990...……............ 33 281 1989....……........... 33 249 1988……............... 34 225 1987……............... 25 203 1986……............... 21 179
1985.…….............. 16 160 1984.…….............. 27 161 1983.…….............. 35 143 1982.…….............. 39 113 1981.…….............. 39 80
1980……............... 23 42 1979……............... 20 25 1978……............... 7 7 Source: OffenderBased Transaction Statistics, California Department of
Justice (initial sentences) and California Appellate Project (total persons under sentence of death).
1 Total persons under sentence of death on December 31 of each year. Persons with multiple California death sentences are counted once.
2 The increase in the total number of persons under sentence of death from yeartoyear will not equal the number of initial sentences reported each year. This is because, in addition to initial sentences, persons may be resentenced to death, no longer under sentence of death because of execution or death by other causes, removed pending retrial, resentenced to a penalty less than death, or freed.
39
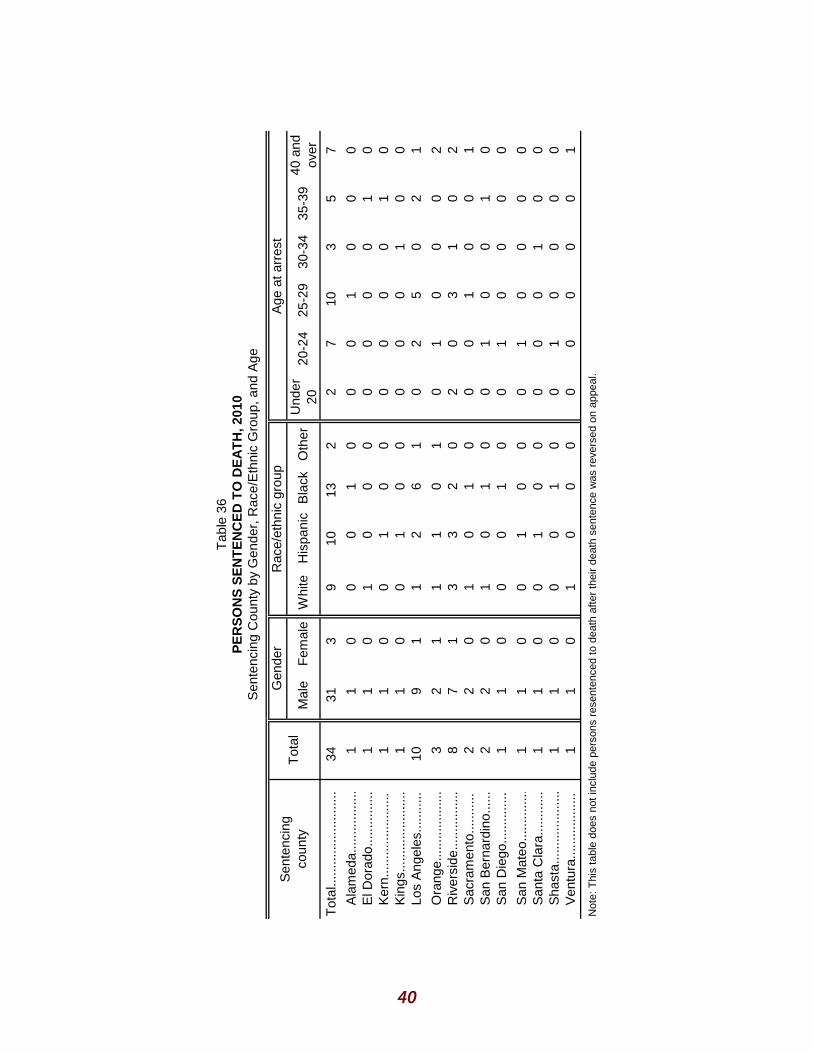
40
Tab
le 3
6P
ER
SO
NS
SE
NT
EN
CE
DT
OD
EA
TH
, 201
0S
ente
ncin
gC
ount
yby
Gen
der,
Rac
e/E
thni
cG
roup
, and
Age
Sen
tenc
ing
coun
ty
Tot
al
Gen
der
Rac
e/et
hnic
gro
up
Age
at a
rres
t
Mal
e F
emal
e O
ther
W
hite
H
ispa
nic
Bla
ck
40 a
ndov
er
Und
er20
20
24
252
9 30
34
353
9
San
taC
lara
......
......
Sha
sta.
......
......
......
.V
entu
ra...
......
......
...
Tot
al...
......
......
......
.....
El D
orad
o....
......
.....
Ora
nge.
......
......
......
Riv
ersi
de...
......
......
.S
acra
men
to...
......
..
San
Die
go...
......
.....
San
Mat
eo...
......
.....
Ala
med
a....
......
......
.
Ker
n....
......
......
......
.K
ings
......
......
......
....
Los
Ang
eles
......
.....
San
Ber
nard
ino.
.....
34 1 1 1 1 10 3 8 2 2 1 1 1 1 1
31
3
1 0
1 0
1 0
1 0
9 1
2 1
7 1
2 0
2 0
1 0
1 0
1 0
1 0
1 0
9 10
13
2
0 0
1 0
1 0
0 0
0 1
0 0
0 1
0 0
1 2
6 1
1 1
0 1
3 3
2 0
1 0
1 0
1 0
1 0
0 0
1 0
0 1
0 0
0 1
0 0
0 0
1 0
1 0
0 0
2 7
10
3 5
7
0 0
1 0
0 0
0 0
0 0
1 0
0 0
0 0
1 0
0 0
0 1
0 0
0 2
5 0
2 1
0 1
0 0
0 2
2 0
3 1
0 2
0 0
1 0
0 1
0 1
0 0
1 0
0 1
0 0
0 0
0 1
0 0
0 0
0 0
0 1
0 0
0 1
0 0
0 0
0 0
0 0
0 1
Not
e:T
his
tabl
edo
esno
t inc
lude
per
sons
rese
nten
ced
to d
eath
afte
rth
eir
deat
h se
nten
ce w
asre
vers
edon
app
eal.

41
Tab
le 3
7H
OM
ICID
EC
RIM
ES
AN
DP
EA
CE
OF
FIC
ER
SK
ILL
ED
INT
HE
LIN
EO
FD
UT
Y,2
001
2010
Num
ber
and
Rat
epe
r 10
0,00
0R
espe
ctiv
e P
opul
atio
n
Pea
ceof
ficer
s ki
lled
Sw
orn
law
Hom
icid
es
Cal
iforn
iain
the
line
ofdu
ty
enfo
rcem
ent
Yea
r(s)
po
pula
tion
pers
onne
l2 R
ate
Num
ber
Rat
e N
umbe
r1
2010
......
......
..
38,8
26,8
98
1,80
9 4.
7 79
,078
4
5.1
2009
......
......
..
38,4
87,8
89
1,97
0 5.
1 80
,429
4
5.0
2008
......
......
..
38,1
48,4
93
2,14
3 5.
6 81
,402
3
3.7
2007
......
......
..
37,7
71,4
31
2,25
8 6.
0 78
,724
4
5.1
2006
......
......
..
37,4
44,3
85
2,48
3 6.
6 75
,625
5
6.6
2005
......
......
..
37,0
04,6
61
2,50
3 6.
8 74
,445
5
6.7
2004
......
......
..
36,5
90,8
14
2,39
4 6.
5 73
,951
4
5.4
2003
......
......
..
35,9
34,0
00
2,40
2 6.
7 75
,336
6
8.0
2002
......
......
..
35,3
01,0
00
2,39
2 6.
8 75
,612
4
5.3
2001
......
......
..
34,7
58,0
00
2,20
1 6.
3 72
,119
6
8.3
Not
e: H
omic
ide
rate
sar
e ba
sed
on a
nnua
lpop
ulat
ion
estim
ates
prov
ided
by th
e D
emog
raph
icR
esea
rch
Uni
t,C
alifo
rnia
Dep
artm
ent o
fFin
ance
.1
Incl
udes
peac
e of
ficer
s fe
loni
ousl
yki
lled
in th
e lin
e of
duty
. 2
Per
sonn
el in
the
Dep
artm
ento
fJus
tice
and
othe
rst
ate
regu
lato
ryag
enci
esar
e no
t inc
lude
d.

42
Tab
le 3
8P
EA
CE
OF
FIC
ER
SK
ILL
ED
INT
HE
LIN
EO
FD
UT
Y,2
010
Gen
der
and
Rac
eE
thni
cG
roup
ofD
ecea
sed
byLo
catio
n an
dW
eapo
n
Loca
tion
and
Wea
pon
Tot
al
Gen
der
Rac
e/E
thni
c G
roup
Mal
e F
emal
e W
hite
H
ispa
nic
Bla
ck
Oth
er
Tot
al
Tot
al..…
......
......
......
.……
......
..….
4 4
0 3
1 0
0 Lo
catio
n
Res
iden
ce…
…...
......
......
......
....
Str
eet,
side
wal
k....
......
......
....…
Com
mer
cial
est
ablis
hmen
t1 .....
All
othe
r2 ......
......
......
..……
......
..
3 0 0 1
3 0 0 1
0 0 0 0
2 0 0 1
1 0 0 0
0 0 0 0
0 0 0 0 T
ype
ofW
eapo
n
Kni
fe3 ...
......
……
......
..…...
......
Blu
nt O
bjec
t4 ......
......
.....…
….
Per
sona
l wea
pon5 ...
......
……
. A
ll O
ther
6 ......
...…
…...
.....…
...
Han
dgun
......
......
......
……
......
Rifl
e....
...…
....…
......
...…
…...
..S
hotg
un...
......
......
..……
......
..…O
ther
fire
arm
......
...…
…...
.....…
Fire
arm
un
spec
ified
......
...…
Non
firea
rm..…
......
......
.……
......
Fire
arm
..…...
......
......
....…
…...
.. 4 2 2 0 0 0 0 0 0 0 0
4 2 2 0 0 0 0 0 0 0 0
0 0 0 0 0 0 0 0 0 0 0
3 2 1 0 0 0 0 0 0 0 0
1 0 1 0 0 0 0 0 0 0 0
0 0 0 0 0 0 0 0 0 0 0
0 0 0 0 0 0 0 0 0 0 0 1
Hot
el/M
otel
, Liq
uor
stor
e,B
ar,O
ther
bus
ines
s.
2P
arki
ng lo
t,V
ehic
le,F
ield
/Par
k,or
Oth
er.
3A
ny in
stru
men
t use
d to
cut o
r st
ab.
4C
lub,
etc
.5
Han
ds, f
eet,
etc.
6
Rop
e, d
rugs
, poi
son,
ars
on, p
elle
t gun
, dro
wni
ng, e
tc.

Table 39 JUSTIFIABLE HOMICIDES BY PEACE OFFICERS
OR PRIVATE CITIZENS, 2010 By Gender, Race/Ethnic Group, and Age of Deceased
Gender, race/ethnic group,
Total Peace officer
justifiable Private citizen
justifiable and
age of deceased Number Percent Number Percent Number Percent
Total Total........................ 116 100.0 83 100.0 33 100.0
Gender Male...................... 113 97.4 81 97.6 32 97.0 Female................. 3 2.6 2 2.4 1 3.0
Race/ethnic group White.................... 33 28.4 20 24.1 13 39.4 Hispanic................ 54 46.6 43 51.8 11 33.3 Black.................... 27 23.3 18 21.7 9 27.3 Other.................... 2 1.7 2 2.4 0 0.0 Unknown.............. 0 0.0 0 0.0 0 0.0
Age Under 18............... 4 3.4 2 2.4 2 6.1 1829.................... 53 45.7 38 45.8 15 45.5
1819................. 10 8.6 6 7.2 4 12.1 2024................. 27 23.3 19 22.9 8 24.2 2529................. 16 13.8 13 15.7 3 9.1
3039.................... 33 28.4 27 32.5 6 18.2 3034................. 15 12.9 14 16.9 1 3.0 3539................. 18 15.5 13 15.7 5 15.2
40 and over.......... 26 22.4 16 19.3 10 30.3 4044................. 11 9.5 8 9.6 3 9.1 4549................. 9 7.8 4 4.8 5 15.2 5054................. 0 0.0 0 0.0 0 0.0 55 and over....... 6 5.2 4 4.8 2 6.1
Unknown.............. 0 0.0 0 0.0 0 0.0 Note: Percentages may not add to 100.0 because of rounding.
43

Table 40 JUSTIFIABLE HOMICIDES BY PEACE OFFICERS
OR PRIVATE CITIZENS, 2010 By Location of Justifiable Homicide
Location Number Percent
of justifiable homicide
Total 116 Total....................……....................
Peace officer justifiable
Total.....….........…….................... 83 100.0 Felon's residence…….............. 13 15.7 Other residence....................… 14 16.9 Street, sidewalk....................… 38 45.8 Commercial establishment....... 4 4.8
Hotel, motel....................…… 1 1.2 Liquor store....................…… 0 0.0 Bar....................…….............. 1 1.2 Other business....................… 2 2.4
All other....................……......... 14 16.9 Parking lot....................…….. 2 2.4 Vehicle....................……........ 3 3.6 Field, park....................…….. 5 6.0 Other....................…….......... 4 4.8
Citizen justifiable
Total....................……................. 33 100.0 Citizen's, shared residence...... 12 36.4
Citizen's residence................ 12 36.4 Shared residence.................. 0 0.0
Other residence....................… 6 18.2 Felon's residence.................. 5 15.2 Other residence....................… 1 3.0
Street, sidewalk....................… 5 15.2 Commercial establishment....... 5 15.2
Hotel, motel....................…… 0 0.0 Liquor store....................…… 1 3.0 Bar....................…….............. 0 0.0 Other business....................… 4 12.1
All other....................……......... 5 15.2 Parking lot....................…….. 1 3.0 Vehicle....................……........ 2 6.1 Field, park....................…….. 1 3.0 Other....................…….......... 1 3.0
Note: Percentages may not add to subtotals or 100.0 because of rounding.
44

Table 41 JUSTIFIABLE HOMICIDES BY PEACE OFFICERS
OR PRIVATE CITIZENS, 2010 By Contributing Circumstance
Contributing circumstance Number Percent
Total Total.....................……….................................... 116
Peace officer justifiable
Total...................…………..........…...…........... 83 100.0 Felon attacked peace officer..…..…............. 42 50.6 Felon killed during commission of crime....... 27 32.5 Felon resisted arrest..................................... 2 2.4 All other........................................................ 12 14.5
Felon attacked another peace officer........ 5 6.0 Felon attacked citizen................................ 2 2.4 Felon attempted flight................................ 2 2.4 Details not provided................................... 3 3.6
Citizen justifiable
Total...........................…….......……................. 33 100.0 Felon attacked citizen................................... 15 45.5 Felon killed during commission of crime....... 15 45.5 Details not provided...................................... 3 9.1
Note: Percentages may not add to 100.0 because of rounding.
Table 42 JUSTIFIABLE HOMICIDES BY PEACE OFFICERS
OR PRIVATE CITIZENS, 2010 By Type of Weapon Used
Type of
weapon used
Total Peace officer
justifiable Citizen
justifiable
Number Percent Number Percent Number Percent
Total.........…….................……... 116 100.0 83 100.0 33 100.0 Firearm..…...................…….... 106 91.4 82 98.8 24 72.7
Handgun..................……...... 82 70.7 63 75.9 19 57.6 Rifle.......…....….........…….... 6 5.2 6 7.2 0 0.0 Shotgun.................……........ 4 3.4 3 3.6 1 3.0 Other firearm.........……........ 0 0.0 0 0.0 0 0.0 Firearm unknown type........ 14 12.1 10 12.0 4 12.1
Nonfirearm..….............……..... 10 8.6 1 1.2 9 27.3 Knife1 .........……........…........ 5 4.3 0 0.0 5 15.2 Personal weapon 2 .........…… 3 2.6 0 0.0 3 9.1 Other3 .........……........…....... 2 1.7 1 1.2 1 3.0
Note: Percentages may not add to subtotals or to 100.0 because of rounding. 1 Any instrument used to cut or stab. 2 Hands, feet, etc. 3 Poison, arson, pellet gun, drowning, etc.
45
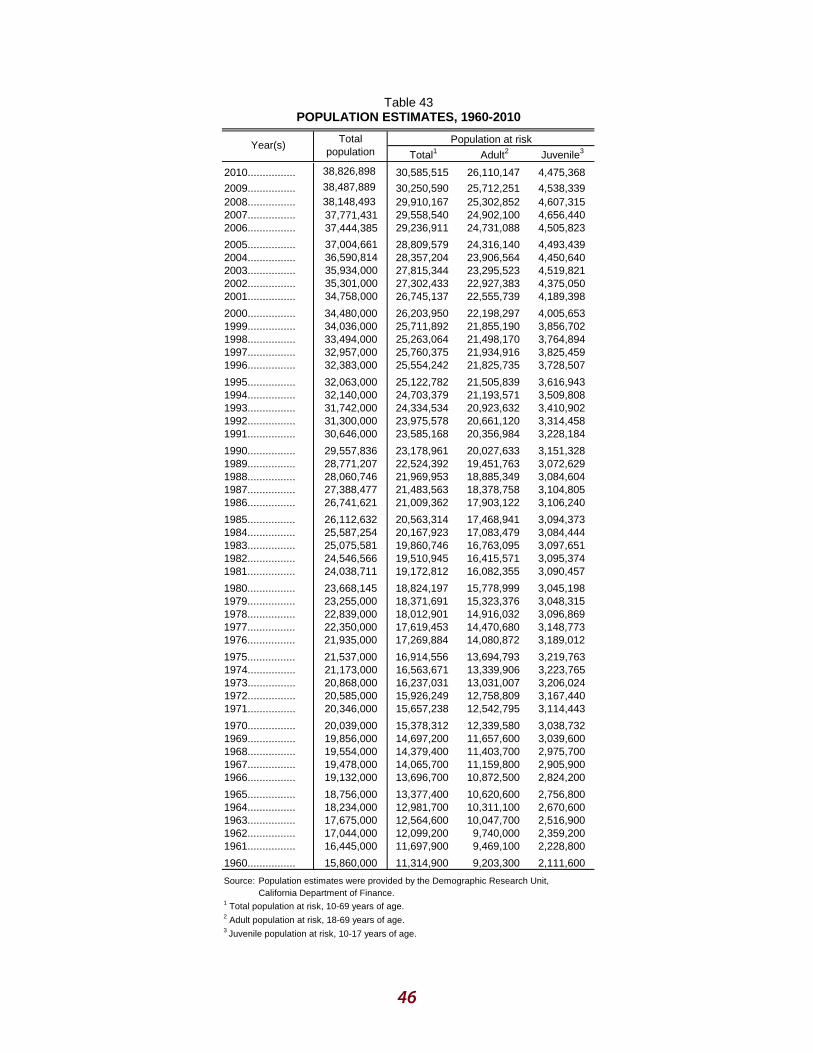
Table 43 POPULATION ESTIMATES, 19602010
Year(s) Total
population Population at risk
Total1 Adult2 Juvenile3
2010................ 38,826,898 30,585,515 26,110,147 4,475,368
2009................ 38,487,889 30,250,590 25,712,251 4,538,339 2008................ 38,148,493 29,910,167 25,302,852 4,607,315 2007................ 37,771,431 29,558,540 24,902,100 4,656,440 2006................ 37,444,385 29,236,911 24,731,088 4,505,823
2005................ 37,004,661 28,809,579 24,316,140 4,493,439 2004................ 36,590,814 28,357,204 23,906,564 4,450,640 2003................ 35,934,000 27,815,344 23,295,523 4,519,821 2002................ 35,301,000 27,302,433 22,927,383 4,375,050 2001................ 34,758,000 26,745,137 22,555,739 4,189,398
2000................ 34,480,000 26,203,950 22,198,297 4,005,653 1999................ 34,036,000 25,711,892 21,855,190 3,856,702 1998................ 33,494,000 25,263,064 21,498,170 3,764,894 1997................ 32,957,000 25,760,375 21,934,916 3,825,459 1996................ 32,383,000 25,554,242 21,825,735 3,728,507
1995................ 32,063,000 25,122,782 21,505,839 3,616,943 1994................ 32,140,000 24,703,379 21,193,571 3,509,808 1993................ 31,742,000 24,334,534 20,923,632 3,410,902 1992................ 31,300,000 23,975,578 20,661,120 3,314,458 1991................ 30,646,000 23,585,168 20,356,984 3,228,184
1990................ 29,557,836 23,178,961 20,027,633 3,151,328 1989................ 28,771,207 22,524,392 19,451,763 3,072,629 1988................ 28,060,746 21,969,953 18,885,349 3,084,604 1987................ 27,388,477 21,483,563 18,378,758 3,104,805 1986................ 26,741,621 21,009,362 17,903,122 3,106,240
1985................ 26,112,632 20,563,314 17,468,941 3,094,373 1984................ 25,587,254 20,167,923 17,083,479 3,084,444 1983................ 25,075,581 19,860,746 16,763,095 3,097,651 1982................ 24,546,566 19,510,945 16,415,571 3,095,374 1981................ 24,038,711 19,172,812 16,082,355 3,090,457
1980................ 23,668,145 18,824,197 15,778,999 3,045,198 1979................ 23,255,000 18,371,691 15,323,376 3,048,315 1978................ 22,839,000 18,012,901 14,916,032 3,096,869 1977................ 22,350,000 17,619,453 14,470,680 3,148,773 1976................ 21,935,000 17,269,884 14,080,872 3,189,012
1975................ 21,537,000 16,914,556 13,694,793 3,219,763 1974................ 21,173,000 16,563,671 13,339,906 3,223,765 1973................ 20,868,000 16,237,031 13,031,007 3,206,024 1972................ 20,585,000 15,926,249 12,758,809 3,167,440 1971................ 20,346,000 15,657,238 12,542,795 3,114,443
1970................ 20,039,000 15,378,312 12,339,580 3,038,732 1969................ 19,856,000 14,697,200 11,657,600 3,039,600 1968................ 19,554,000 14,379,400 11,403,700 2,975,700 1967................ 19,478,000 14,065,700 11,159,800 2,905,900 1966................ 19,132,000 13,696,700 10,872,500 2,824,200
1965................ 18,756,000 13,377,400 10,620,600 2,756,800 1964................ 18,234,000 12,981,700 10,311,100 2,670,600 1963................ 17,675,000 12,564,600 10,047,700 2,516,900 1962................ 17,044,000 12,099,200 9,740,000 2,359,200 1961................ 16,445,000 11,697,900 9,469,100 2,228,800
1960................ 15,860,000 11,314,900 9,203,300 2,111,600
Source: Population estimates were provided by the Demographic Research Unit, California Department of Finance.
1 Total population at risk, 1069 years of age. 2 Adult population at risk, 1869 years of age. 3 Juvenile population at risk, 1017 years of age.
46

Appendix 1�Data Characteristics and Known Limitations
HOMICIDE CRIMES
Homicide data are obtained from the Supplementary Homicide Report (SHR). The SHR is submitted monthly by California law enforcement agencies as part of the national Uniform Crime Reporting (UCR) system.
The number of reported homicide crimes represents known victims.
Per UCR definition, suicides, fetal deaths, traffic fatalities, accidental deaths, assaults to murder, and attempts to murder are not classified as criminal homicide and are not included in this report.
The findings of a court, coroner’s inquest, etc., do not affect classifying or scoring of the SHR homicide counts.
Detailed data regarding the criminal homicide category can only be as comprehensive as the information provided by contributing agencies.
Offender data (race/ethnicity, age, and gender) are based on law enforcement identification of the offender as a suspect.
Weapon – Reporting agencies report a complete description of the weapon and the ways in which the weapon was used. For example, if a bottle was used in the commission of a murder, the agency will state whether the person was killed by beating, cutting, or stabbing.
Relationship – The relationship reported is that of the victim to the offender. For example, if a wife is killed by her husband, the reported relationship is wife.
Circumstances – Statements of circumstances are based on information known to law enforcement, not decisions of a grand jury, coroner’s inquest, or other agency outside law enforcement. The reporting agency provides a brief statement as to the circumstances or precipitating events leading to the victim’s death. If the killing occurred in conjunction with the commission of another felony such as a robbery or rape, the agency identifies the specific offense involved.
ARRESTS�Monthly Arrest and Citation Register (MACR)�
Arrest data from the MACR reporting system are designed to collect the number of persons arrested, not the number of charges lodged.
If a person is arrested for multiple offenses, MACR selects only the most serious offense, based on the severity of possible punishment.
The subjectivity of the classification and labeling process must be considered in the analysis of race/ethnic group data.
47

Data Characteristics and Known Limitations (continued)
ADULT FELONY ARREST DISPOSITIONS Offender-Based Transaction Statistics (OBTS)
In 2001, Criminal Justice Statistics Center staff determined that a number of homicide arrests submitted to the Department of Justice’s (DOJ) Automated Criminal History System (from which adult felony arrest disposition data are extracted) between 2000 and 2001 should have been submitted as arrests for attempted homicide. As a result, more homicide arrests were counted during these years than occurred. This caused a lower percentage of homicide convictions and a higher percentage of assault convictions. (Both percentages were based on the number of adult felony arrests for homicide for which dispositions were received.) It should be noted that the DOJ has addressed this issue and that the exclusion of disposition data does not affect crime, arrest, death penalty, or other data included in this or past reports. When homicide disposition data are once again determined to be accurate, they will be included in this report.
POPULATION
Since 2004, the population estimates used to calculate rates have been based on revisions of the 2000 Census. Prior to 2003, these population estimates were based on revisions of the 1990 Census. Readers are advised to exercise care in interpreting changes in percent and rate between decennial census samples. In addition, the “other” population category now includes the Department of Finance’s race/ethnic group of “multi-racial.”
48
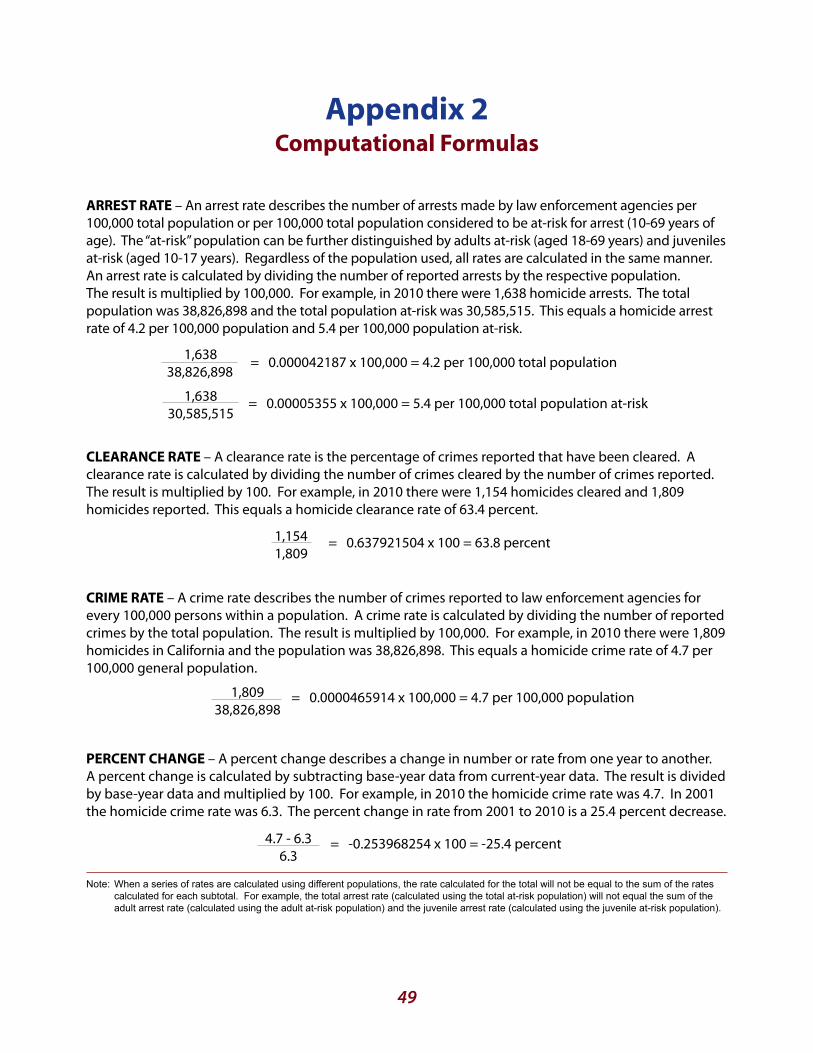
Appendix 2�Computational Formulas
ARREST RATE – An arrest rate describes the number of arrests made by law enforcement agencies per 100,000 total population or per 100,000 total population considered to be at-risk for arrest (10-69 years of age). The “at-risk” population can be further distinguished by adults at-risk (aged 18-69 years) and juveniles at-risk (aged 10-17 years). Regardless of the population used, all rates are calculated in the same manner. An arrest rate is calculated by dividing the number of reported arrests by the respective population. The result is multiplied by 100,000. For example, in 2010 there were 1,638 homicide arrests. The total population was 38,826,898 and the total population at-risk was 30,585,515. This equals a homicide arrest rate of 4.2 per 100,000 population and 5.4 per 100,000 population at-risk.
1,638 = 0.000042187 x 100,000 = 4.2 per 100,000 total population 38,826,898�
1,638� = 0.00005355 x 100,000 = 5.4 per 100,000 total population at-risk 30,585,515
CLEARANCE RATE – A clearance rate is the percentage of crimes reported that have been cleared. A clearance rate is calculated by dividing the number of crimes cleared by the number of crimes reported. The result is multiplied by 100. For example, in 2010 there were 1,154 homicides cleared and 1,809 homicides reported. This equals a homicide clearance rate of 63.4 percent.
1,154 = 0.637921504 x 100 = 63.8 percent 1,809
CRIME RATE – A crime rate describes the number of crimes reported to law enforcement agencies for every 100,000 persons within a population. A crime rate is calculated by dividing the number of reported crimes by the total population. The result is multiplied by 100,000. For example, in 2010 there were 1,809 homicides in California and the population was 38,826,898. This equals a homicide crime rate of 4.7 per 100,000 general population.
1,809 = 0.0000465914 x 100,000 = 4.7 per 100,000 population 38,826,898
PERCENT CHANGE – A percent change describes a change in number or rate from one year to another. A percent change is calculated by subtracting base-year data from current-year data. The result is divided by base-year data and multiplied by 100. For example, in 2010 the homicide crime rate was 4.7. In 2001 the homicide crime rate was 6.3. The percent change in rate from 2001 to 2010 is a 25.4 percent decrease.�
4.7 - 6.3 = -0.253968254 x 100 = -25.4 percent 6.3
Note: When a series of rates are calculated using different populations, the rate calculated for the total will not be equal to the sum of the rates calculated for each subtotal. For example, the total arrest rate (calculated using the total at-risk population) will not equal the sum of the adult arrest rate (calculated using the adult at-risk population) and the juvenile arrest rate (calculated using the juvenile at-risk population).
49

Appendix 3�Glossary
ADULT: a person 18 years of age or older.
AGGRAVATED ASSAULT: an unlawful attack or attempted attack by one person upon another for the purpose of inflicting severe or aggravated bodily injury. This type of assault usually is accompanied by the use of a weapon or by means likely to produce death or great bodily harm (UCR definition).
APPEAL: a petition initiated by a defendant for a rehearing in an appellate court regarding a previous sentence or motion.
ARREST: ". . . taking a person into custody, in a case and in the manner authorized by law. An arrest may be made by a peace officer or by a private person" (834 PC).
ARREST RATE: the number of arrests per 100,000 population or population at-risk. See Appendix II – Computational Formulas for further explanation.
CALIFORNIA DEPARTMENT OF CORRECTIONS AND REHABILITATION (CDCR): the state agency that operates California’s state adult prisons and juvenile facilities, oversees a variety of community correctional facilities and important correctional facility responsibilities, and supervises all adult and juvenile parolees during their reentry into society.
CLEARANCE: an offense is "cleared by arrest" or solved, for crime reporting purposes, when at least one person is arrested, charged with the commission of an offense, and turned over to a court for prosecution. Although no physical arrest is made, a clearance by arrest can be claimed when an offender is a person under 18 years of age and is cited
to appear in juvenile court or before other juvenile authorities. An offense can also be "cleared exceptionally" for crime reporting purposes when an investigation has definitely established the identity of an offender; there is enough information to support an arrest; and the exact location of an offender is known but, for some reason, law enforcement cannot take the offender into custody.
CLEARANCE RATE: the percentage of crimes reported that have been cleared.
CONVICTION: a judgment, based either on the verdict of a jury or a judicial officer or on the guilty plea of the defendant, that the defendant is guilty.
COURT: an agency of the judicial branch of government, authorized or established by statute or constitution, having one or more judicial officers on its staff. A court has the authority to decide upon controversies in law and disputed matters of fact brought before it. Because of court consolidation we no longer distinguish between lower court and superior court.
CRIME: ". . . an act committed or omitted in violation of a law forbidding or commanding it. . ." (15 PC).
CRIME RATE: the number of reported crimes per 100,000 general population. See Appendix II – Computational Formulas for further explanation.
FELON: one who has committed a felony.
FELONY: a crime that is punishable by death or by imprisonment in a state prison (17 & 18 PC).
50

Glossary (continued)
FORCIBLE RAPE: the carnal knowledge of a female forcibly and against her will. Assaults or attempts to commit rape by force or threat of force are included (UCR definition).
HOMICIDE: the willful (nonnegligent) killing of one human being by another. Murder and nonnegligent manslaughter are included (UCR definition).
JUVENILE: a person under the age of 18.
MISDEMEANOR: a crime punishable by imprisonment in a county jail for up to one year.
MONTHLY ARREST AND CITATION REGISTER (MACR): a reporting system used to collect information on adult and juvenile arrests and citations by police and sheriffs' departments. This register contains data on arrest offenses, arrestee characteristics (age, gender, and race/ethnic group), and law enforcement dispositions.
OFFENDER-BASED TRANSACTION STATISTICS (OBTS): a system designed to collect statistical information on the various processes within the criminal justice system that occur between the point of the felony arrest of an adult and the point of final disposition.
OFFENSE: the charged offense is the crime for which the defendant was arrested or filed on by the district attorney. The convicted offense is the offense the defendant was convicted of or pled guilty to in court.
PENAL CODE (PC): the California Penal Code contains statutes that define criminal offenses and specify corresponding punishments. Criminal justice system mandates and procedures are also included.
POPULATION AT RISK: that portion of the total population who, because of like characteristics to the specific study group, are considered "at risk." For example, if one were studying juvenile arrestees, all persons between 10 and 17 years of age would constitute the at-risk population.
RATE: a comparison of a number of events to a population.
ROBBERY: the taking or attempting to take anything of value from the care, custody, or control of a person or persons by force or threat of force or violence and/or by creating fear in the victim (UCR definition).
SENTENCE: the penalty imposed by a court upon a convicted person.
UNIFORM CRIME REPORTING (UCR): a federal reporting system that compiles crime data based on information submitted by law enforcement agencies throughout the nation. In California, the Department of Justice administers and forwards these law enforcement data to the federal program.
VIOLENT CRIMES: crimes committed against people. This category includes homicide, forcible rape, robbery, and aggravated assault.
51
Acknowledgments The California Department of Justice is mandated by statute to submit an annual
Homicide in California report to the Legislature. The department extends its appreciation to all the law enforcement agencies that provided complete and timely data. This report
would not have been possible without their cooperation.�
California Department of Justice�Division of California Justice Information Services • Bureau of Criminal Information and Analysis
Criminal Justice Statistics Center�P.O. Box 903427 • Sacramento, CA 94203-4270�
[email protected] • http://ag.ca.gov/cjsc/pubs.php�
52