homeownership, the great recession, and wealth: evidence...
TRANSCRIPT

Homeownership, the Great Recession, and Wealth: Evidence
from the Survey of Consumer Finance
Draft, January, 2013
Michal Grinstein-Weiss Washington University in St. Louis
Center for Social Development, One Brookings Drive, Campus Box 1196
St. Louis, MO 63130 USA
(314) 935-6691 / [email protected]
Clinton Key University of North Carolina at Chapel Hill
School of Social Work, 325 Pittsboro Street Campus Box 3550
Chapel Hill, NC 27599 USA
(919) 962-6412 / [email protected]

Homeownership, the Great Recession, and Wealth: Evidence from the Survey of
Consumer Finance
For generations, homeownership has been considered a fundamental piece of the
American Dream and home equity has represented a key component of the household
balance sheets as well as the type of asset in which most U.S. households held the
majority of their wealth (Bucks, Kennickell, Mach, & Moore, 2009; Dickerson, 2009:
Quercia, Freeman, & Ratcliffe, 2011). In addition, research has shown positive
associations between homeownership and many benefits at the individual, family,
neighborhood, and community levels. At the individual level, homeownership appears to
enhance overall life satisfaction and improve health outcomes. At the family level, the
benefits associated with homeownership include greater participation in the labor force
by parents and higher levels of education among children. The benefits of
homeownership found at the neighborhood and community levels include better upkeep
of housing, increased improvements to property, and greater stability of the local area.
(Coulson and Fisher 2002; Dietz and Haurin 2003; Herbert and Belsky 2006; Robert and
House 1996; Rossi and Weber 1996; Scanlon and Page-Adams 2001; Van Zandt and
Rohe 2006). Given the growing evidence of the positive benefits of homeownership,
homeownership has been often viewed as a tool for social and economic mobility.
Given these positive benefits of homeownership, considerable efforts have been
made over the last 20 years to increase opportunities for home purchase for all strata of
American families. At the same time, scholars and policy makers have brought increasing
attention to the multitude of barriers to homeownership for low-income and minority
families (Barakova et al. 2003; Collins, 2004; Di & Liu, 2004; Haurin & Morrow-Jones,
2006; Herbert & Tsen, 2005; Ratner, 1996; Santiago & Galster, 2004; Zhao, Ondrich, &
Yinger, 2006). These obstacles include financial obstructions; lack of information about
the home-buying process, and lack of experience with that process; severe shortage of
affordable housing, especially in desirable neighborhoods; and discriminatory practices
against minority families. The effect of these obstacles combined with other factors has
created a substantial income-based division in homeownership. This housing-wealth gap
is clearly reflected in data from 2004 that were used by Herbert et al. (2005) to compare
homeownership rates of very-low income households (i.e., income ≤ 50% of the area
median income [AMI]) and higher-income households (i.e., income ≥ 120% of the AMI).
Although 51% of very-low income households owned their home, this rate was
significantly lower than the 88% of higher-income households that owned their home
(Herbert et al., 2005).
The racial/ethnic gap in homeownership is equally troublesome. In contrast to the
7 of 10 White families who own their home, only 4 of 10 families among either African
Americans or Latinos are homeowners (Quercia, Freeman & Ratcliffe, 2011). The
implications of the homeownership gap are substantial and long-reaching because home
equity is the primary way that most U.S. households build wealth and improve their
balance sheet. Thus, the disparities in homeownership rates translate to a significant
wealth gap across various income and racial/ethnic groups.
To address the housing wealth gap, regulatory changes were implemented and
programs developed that aimed to improve rates of homeownership among low-income
and minority families by increasing their access to fair and affordable mortgage products.
The best of these efforts focused on safe-lending practices and programs that provided
support services for first-time homebuyers such as the Community Advantage Program
and Individual Development Accounts (IDAs). However, other efforts were exploitive
and involved predatory lending practices, including selling high-risk products and
improper lending processes. These bad products resulted in high rates of mortgage
default and the catastrophic housing crisis.
Nevertheless, even in the midst of the housing crisis and in the aftermath of the
economic downturn, home equity has continued to be a major part of the balance sheet
for American households. This paper uses panel data from the Survey of Consumer
Finances to examine homeownership as a component of the household balance sheet and
to explore the various trajectories of distinct segments of homeowners as related to
wealth loss and gain between 2007 and 2009.

Prevalence of Homeownership
Over last 20 years, the dynamic of the U.S. housing market created a picture of
homeownership never been seen before. First, the housing market experienced
unprecedented growth and expansion, reaching an all-time high with almost 70% of U.S.
households owning their homes. This expansion included households at all income
levels, with significant growth occurring among low- and moderate-income (LMI)
households. When this housing bubble burst in 2008, the sudden collapse created a
“perfect storm” of foreclosures and declining home values, which in turn, triggered the
nation’s economic downturn (Desilva & Elmelech, 2012). Even with these dramatic and
sudden changes in the housing market, homeownership remains at a record high when
compared with any point in the 20th century, with 67.1% of U.S. households owning
their homes (Desilva & Elmelech, 2012).
The continued high rate of homeownership is important because home equity is a
key mechanism for accumulating wealth. The wealth invested in owner-occupied homes
is the largest source of savings for most LMI households, and surpasses total investments
in other assets such as retirement or savings accounts. U.S. homeowners hold an average
of 48% of their total household wealth in their home equity (Di, Yang, & Liu, 2005).
However, this critically important means of building wealth is less accessible to
households in the lowest fifth of the income scale because just about half of these lower-
income households own their home (Carasso et al., 2005).
Although homeownership rates of low-income and minority households still lag
behind those of higher-income households, LMI homeownership has accounted for much
of the overall increase in homeownership that has occurred over the last half century. The
national rate of homeownership increased almost 5% during a 45-year period (1960 to
2005), resulting in a national rate of 66.9%. During this period, homeownership increased
at a faster rate among low-income and minority households than other segments of the
population. For example, in a 5-year period (1994 to 1999) the number of low-income
and minority homeowners increased by more than 800,000 households (Belsky & Duda,
2002). These increases clearly demonstrate that LMI households want to and will pursue
homeownership when they are able to overcome the disparities and barriers that have
historically hindered homeownership.
Homeownership – a safe financial investment?
Generations of American households and financial advisers have shared the long-
standing belief that homeownership was a safe, efficient way to build wealth (Rappaport,
2010). This belief was embodied in the perpetual quest for the American Dream of
homeownership, and demonstrated by the majority of U.S. households who were
homeowners
The recent crises in the housing and mortgage industries, however, wiped out
millions of dollars of home equity, creating a major risk for the financial security of these
households. This sudden shift from safe investment to precarious portfolio was
hypothesized to be especially true for low- to moderate-income (LMI) households. In the
wake of this exposure to financial vulnerability, many experts have called for a
reexamination of the goal of homeownership and have urged the nation to rethink the
American Dream (Dickerson, 2009).
A relatively recent literature review conducted by Herbert and Belsky (2008)
focused on the empirical evidence for the relationship between homeownership and
long-term wealth accumulation among low-income and minority U.S. households (for
example, see Boehm & Schlottman, 1999; Di, Belsky, & Liu, 2007; Di, Yang, & Liu,
2003). Herbert and Belsky concluded that, on average, homeownership had improved the
balance sheets of households over the long-term. In addition, the research team found
evidence suggesting the positive effect of homeownership on the relative gains of the
household balance sheet was stronger for low-income homeowners than their high-
income counterparts. Although high-income homeowners historically gain more in
absolute terms from homeownership, those gains are the result of correlations with other
factors such as the higher levels of income, education, and wealth that are “pre-existing
conditions” among this group. Nevertheless, one caveat that must be considered is that
most of the evidence included in Herbert and Belsky’s review came from studies
conducted before the onset of the housing crisis in 2006-2007.
Similar to the findings of the above study, Di, Belsky, and Liu (2007) examined
18 years of data from the Panel Study of Income Dynamics (PSID; collected 1984 thru
2001) to compare differences in wealth gains between homeowners and renters. This
longitudinal evaluation of tenure status showed that when homeowners were compared
with those who remained renters, homeowners had significantly higher wealth
accumulation. In addition, Di and colleagues (2007) found that longer periods of
homeownership were associated with greater accumulation of wealth. The association of
building wealth with homeownership was consistent with the findings of an earlier study
conducted by Di, Yang, and Liu (2003) that examined the same PSID data. The earlier
study found that low-income homeowners who had maintained homeownership
throughout the 18-year study period reported an average of 8 times the amount of wealth
as those who rented their home during the study period (Di et al, 2003). It is important to
note that the findings of the latter study are considered especially trustworthy because the
analysis controlled for household characteristics (e.g., initial levels of wealth, the
household’s prior savings behavior) that could confound the effects of homeownership on
a household’s ability to accumulate wealth.
Last, research has shown that similar to other investments, the determinants of
homeownership as an effective investment for building wealth include market conditions
(e.g., demand for owner-occupied housing) and the overall condition and health of the
economy at a specific time (Rappaport, 2010). The timing of investment in
homeownership is especially important for LMI households because they are likely to
have few liquid assets, and therefore, are less able to survive long periods of unfavorable
market conditions (Belsky & Duda, 2002).
A contrasting perspective on homeownership was provided by Rappaport’s
(2010) comparison of wealth between owners and renters over the course of 10-year
occupancies. Interestingly, Rappaport found that in some periods, homeowners
experienced greater wealth gains than renters, whereas in other periods, renters who
invested in stock and bonds had greater wealth gains than homeowners. Perhaps not
surprisingly given the recent declines in home prices, Rappaport concluded that for the
period 2000 thru 2009, the better option for building wealth was to rent a home and
invest money in areas other than housing. An important caveat that must be kept in mind
is that Rappaport’s study tracked and compared the wealth trajectories of hypothetical
renters and owners while holding constant household composition, income, and non-
housing spending.
Data & Measurement
This paper uses data from the 2007 triennial cross-section of the Survey of
Consumer Finances (SCF). The survey oversampled high-wealth households but with
weights is statistically representative of the United States population (Bricker, et al.
2011). The SCF is generally considered the gold-standard data for understanding the
wealth holdings of the American public.
The 2007 SCF sample is unique in that the Federal Reserve decided to reinterview
the panel in 2009 to track their wealth trajectories over the course of the Great Recession;
SCF cohorts are usually only interviewed once. The reinterview panel offers a unique
data source to track the wealth trajectories of households over time.
Using panel data poses several challenges in interpretation that should be noted.
First, because the original panel was reinterviewed, the 2009 interview data are not
representative of the 2009 population but of the 2007 population the sample was
weighted to represent. Second, the pattern of response to the follow-up survey may bias
findings on 2009 wealth levels and change from 2007 to 2009. Of those in the 2007
panel, about 90% were successfully reinterviewed in 2009. It is suspected that there may
be some survivorship bias in the data (Bricker et al 2012a). Those with better trajectories
from 2007 to 2009 may be more likely to respond in 2009 than those who had worse
outcomes. Even with these complications, the 2007-2009 reinterview panel is an
unparalleled resource for the examination of changes in household wealth during the
Great Recession.
Several characteristics of these data are broadly consistent with those in other
SCF cohorts and in data measuring wealth more generally. In the measure of wealth there
are frequent instances of item-missing data, stemming both from respondents not
knowing the requested values of specific holdings and from a reluctance to share
sensitive information with interviewers. While the typical number of missing cases on a
given item may be small, when these items are summed to aggregates like net worth or
total assets, the number of missing cases increases quickly. Because the overall fraction

of missing information is quite small, these data are almost always imputed. The SCF is
no exception and the public-use SCF data files used here are released as five complete-
information implicates.
The Measurement of Wealth
In this paper, wealth is operationalized as net worth. Net worth is the sum of the
value of all assets held by a household, less the debts owed by the household. The SCF
instrument asks about a comprehensive set of products and accounts that households use
to store value and owe money on. To facilitate presentation, we group these assets and
debts into the categories shown in Figure 1. All assets and debts measured in the SCF are
captured in these categories (Bricker, et al. 2012b). The miscellaneous assets category
captures a broad range of property that stores value and can total substantial amounts
(consider, for instance, the value of all the appliances, electronics, and furniture found in
an owned home).
[Fig. 1. Components of net worth about here]
For some analyses, we disaggregate housing equity (home value less home debt)
from non-housing net worth. The latter quantity is net worth as described above less
home equity. This measure captures the household’s wealth that is not tied up in housing.
All of the asset and debt values included in the analysis are self-reported by
respondents and are presented in constant 2009 dollars. Some respondents may
overestimate or underestimate the value of their holdings or debts. In particular, these
data use user-reported property values that other research has been found to
underestimate declines that obtained in housing markets during the recession.
It should be noted that at each wave, in 2007 and in 2009, respondents were asked
about the value of assets and debts at that point in time, not to estimate change between
the time points. The change measures presented here are the simple difference between
the two.
In the paper, we present data using both dollar change from 2007 to 2009 and
change from 2007 to 2009 as a percentage of 2007 value. Each measure offers valuable

insights into the dynamics observed and highlights facets of households’ experience that
are missed by focusing on one or the other. For cases where the 2007 value was less than
zero (e.g. 2007 net worth), the percentage change is given by sign(2007 to 2009 change)
*absolute value (2007 to 2009 change/2007 value). This gives an approximation of the
magnitude and maintains the directional quality of the change.
Selection of samples
Importantly, this paper focuses primarily on the economic fates of households that
owned their home in 2007. In 2007, the wealth and household balance sheets of the
population of owners and renters differed dramatically and make accurate comparison
deeply problematic. For reference, at the end of the paper we juxtapose some findings for
homeowners with those observed among renters.
To gain additional traction on the dynamics of wealth among homeowners, we
look at the overall population and at subsamples of the population defined by
characteristics in 2007. These subsamples were chosen because they associate with prior
findings of differential wealth trajectories. In this paper, we examine “typical”
homeowners, and then divide the sample by race and by wealth in 2007. The wealth
categories are constructed based on the quintile of the full-sample weighted wealth
distribution the household belonged to in 2007. The weighted wealth distribution of the
2007 SCF sample is thought to be consistent with the actual distribution of wealth in the
population.
Table 1 shows the approximate sample size of each of the sub-groups analyzed in
the paper. We say approximate because, owing to the weighting and imputation used in
the data, one respondent does not map directly to one case in the data.
[Table 1 about here]
First, it should be noted that the number of cases in some of the analyzed
subgroups, particularly in the Hispanic and Other categories of race and in the bottom 20
category of wealth are quite small. This increases the sensitivity of the estimates shown
for these groups to small numbers of idiosyncratic cases. These figures, while reflective

of the underlying reality observed in the data, must be understood to face substantial risk
of measurement error.
Methods
This paper employs a straightforward approach to describe the wealth holding and
wealth trajectories of homeowners before and through the Great Recession. Several
features of the method that account for challenging features of the data are noteworthy.
Importantly, each analysis is performed on each implicate and the results are combined
for presentation and discussion.
For the numerical presentation of the balance sheets of homeowners before,
during, and after the recession, we use waterfall accounting tables. These tables sum from
top to bottom. Because of the large leverage of outliers in wealth data, several
modifications are adopted to the standard approach of presenting means. First, because
we are interested in the trajectory of typical households, we select the households in the
presented group whose change in wealth between 2007 and 2009 in dollar amount is
between the 25th
and 75th
percentile of change in that group. Selecting based on 2007
value leads to heavily inflated estimates of change in wealth. Use of the median (as in
Table 2) yields tables that do not sum internally and make it hard to see how categories of
wealth (which are underestimated at the median) sum to large aggregates.
Proportions and distributions reported in the paper are produced using all
available cases for the group. All estimates are produced using weighting variables
packaged with the publically-distributed data.
Findings
The balance sheets of homeowners in the period from 2007 to 2009 are
characterized by their deep heterogeneity in composition and trajectory. American
homeowners hold their assets in a dizzying array of formal and informal accounts and
products and owe a broad range of debts. In a balance sheet, the choice of asset and debt
allocation is understood to be fungible. That is to say, a household can allocate a dollar to

liquid savings or to paying down debt and the snapshot of the balance sheet presented
here remains the same.
While most homeowners lost wealth during the recession from 2007 to 2009,
there were a diversity of trajectories observed among households. A small number of
households experienced monumental gains and losses in wealth, but most experienced
relatively small shifts. Interestingly, the part of the balance sheet that led to gains also
was unique across households.
Patterns of asset owning
Amid this heterogeneity, one constant emerges in the balance sheets of
homeowners. Among those who own homes, the value of an owned home tends to
dominate the asset side of the household balance sheet. Figure 2 shows the composition
of the asset holdings of homeowners, grouped by quintiles of wealth at 2007. For each
quintile, the colored sections of the bar represent the average proportion of a household’s
total assets in 2007 that are accounted for by a given type of asset.
[Figure 2 about here]
Among those whose net worth put them in the lowest quintile of the population,
we observe that the home accounts, on average, for 70% of the household’s assets and
housing and physical property together account for over 90%. While wealthier segments
of the population are not as home centric in their asset portfolio, only in the top quintile
does the home not account for the largest share of assets. Those in the second quintile
average almost 70% of assets in the home; those in the middle quintile about 60%; those
in the fourth quintile about 44%; and those in the top quintile about 28%.
It is notable that no quintile holds more than 5% of assets on average in
transaction accounts (which are often treated as liquid assets for the purpose of assessing
a household’s preparedness for emergencies). Likewise, the relatively low prevalence of
financial assets and retirement savings on the balance sheets of households in the bottom
three quintiles of the wealth distribution.
These distributions highlight two things of particular interest at the onset of the
2007 recession. First, by virtue of the concentration of assets in the owned home,
homeowners, and especially low-wealth homeowners, are deeply exposed to the broad
downturn in housing prices, owning relatively few non-housing assets. Second, high-
wealth homeowners are more exposed to shocks in financial markets through their
ownership of retirement savings and financial assets.
Typical households and trajectory
Table 2 shows two depictions of the balance sheet of a typical homeowner in
2007, of the change that typical household experienced between 2007 and 2009, and of
the household’s 2009 balance sheet. The left-side panel of the table is a waterfall
accounting of the balance sheet and sums top to bottom. To address outliers, the left-side
panel includes homeowners between the 25th
and 75th
percentiles of the distribution of
wealth change between 2007 and 2009.
The right panel provides a balance sheet that presents sample-weighted median
values for each quantity among all homeowners in the SCF sample. Each cell of the right
panel shows the median for that cell. For instance, the change in net worth cell is the
median change in net worth from 2007 to 2009 for all homeowners. It should be noted
that zero-values in this table indicate that fewer than half of households in the sample
hold the asset or debt under consideration. Figures in the right panel do not sum top to
bottom.
[Table 2 about here]
The typical homeowner’s balance sheet, as noted above, is heavily dominated by
the owned home in both 2007 and in 2009. This is true both in terms of assets and in
terms of debt using both indicators of central tendency. Unsurprisingly, the change
between 2007 and 2009 is also one dominated by change in housing.
The typical household lost between $30,000 and $40,000 in wealth in this two-
year period; this is about 10% of the household’s 2007 wealth. For the typical household,
declines in housing values were the driver for the change in wealth.
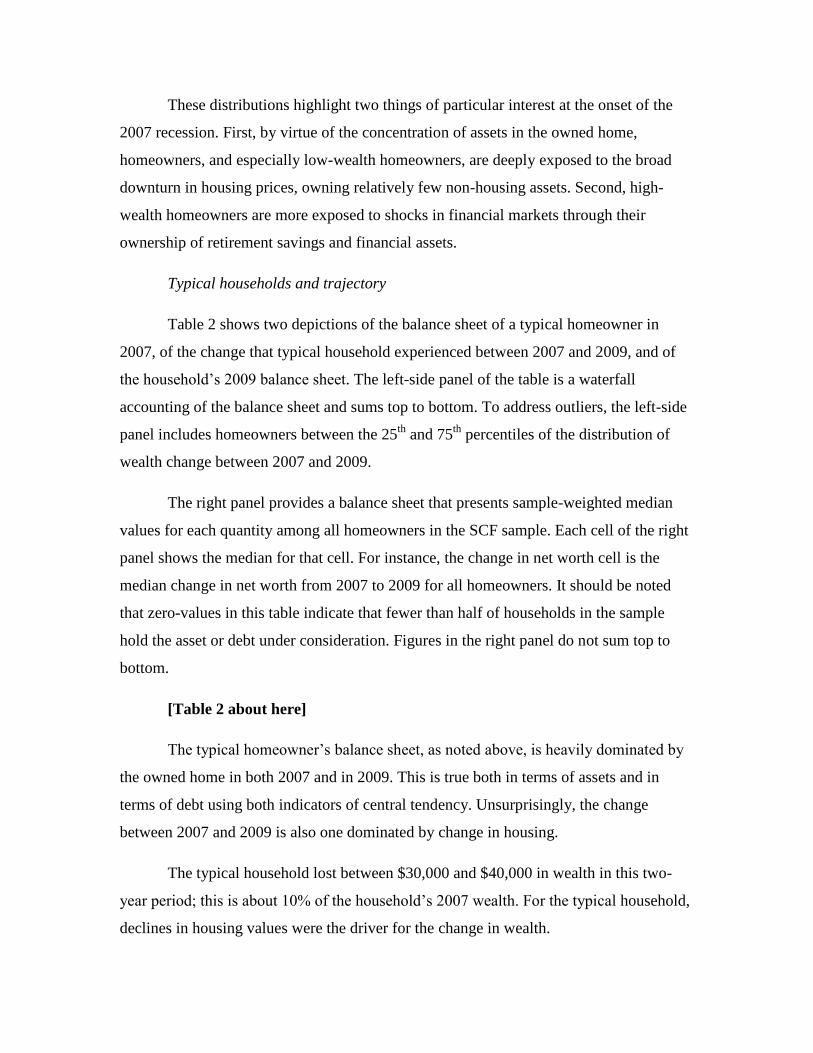
Figures 3 through 5 present, and then disaggregate, the distribution of change in
wealth between 2007 and 2009 graphically. These kernel density plots show the
probability distribution of the change, expressed as percent of 2007 value. The height of
the plot reflects the likelihood of a case being found at a given point.
As follows from the description of the trajectory of the typical household above,
the peak of the distribution for change in net worth is below zero, indicating that most
households lost wealth over this period. Nonetheless, a non-trivial proportion of cases
experienced positive change in wealth over the observed period.
Figures 4 and 5 disaggregate net worth into non-housing net worth and home
equity and show the probability distribution of these variables, again expressed as percent
change from 2007 to 2009. Interestingly, the peak of the equity distribution is tightly
centered on zero (though still negative) while the non-housing net worth distribution is
shifted further left. The low volumes of non-housing net worth held by most households
at 2007 may inflate the magnitude of percent change observed. Still, the two distributions
suggest that while household’s concentration of wealth in the home made that the driver
of changes in wealth between 2007 and 2009, substantial losses were also realized in
other areas of the balance sheet in the same period.
Race
As the general trends reveal, the balance sheet effects of the Great Recession on
homeowners were far from uniform. To further explore the affects of the Great Recession
on the wealth of homeowners, we now turn to a detailed look at subgroups of
homeowners during the recession, starting with race. In the foregoing, it should be
recalled that the Hispanic and Other categories contain relatively few cases and are more
sensitive to anomalous cases than larger groups.
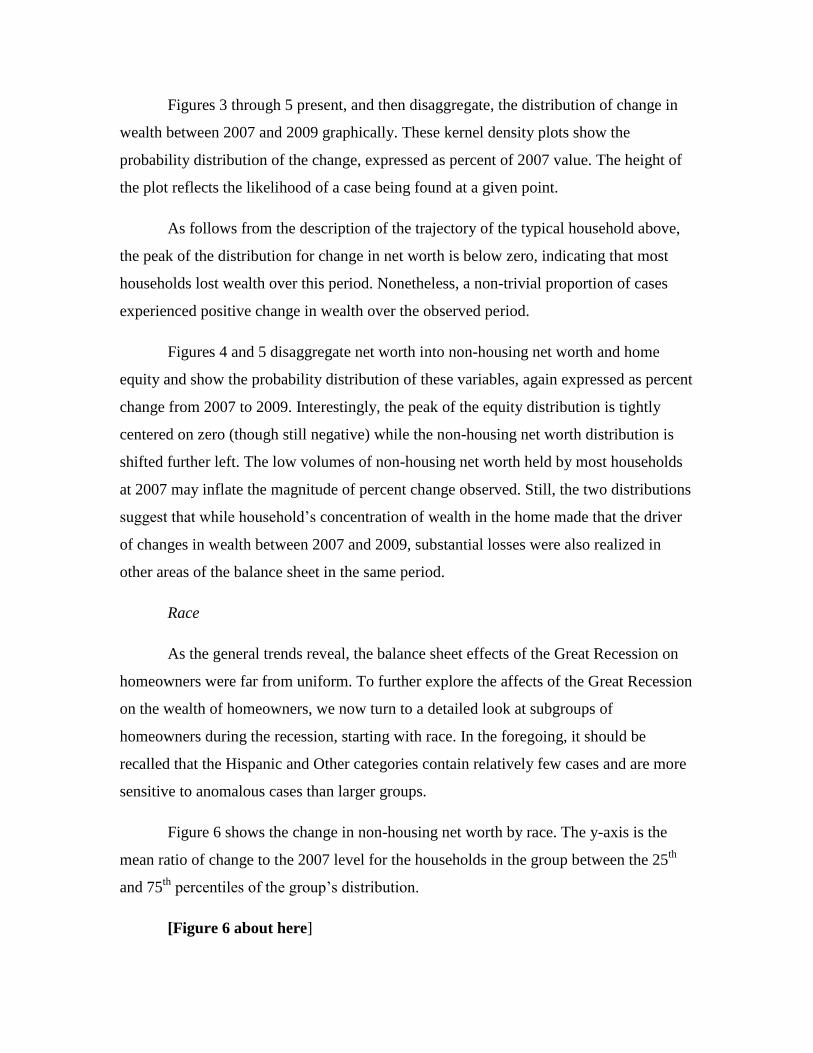
Figure 6 shows the change in non-housing net worth by race. The y-axis is the
mean ratio of change to the 2007 level for the households in the group between the 25th
and 75th
percentiles of the group’s distribution.
[Figure 6 about here]
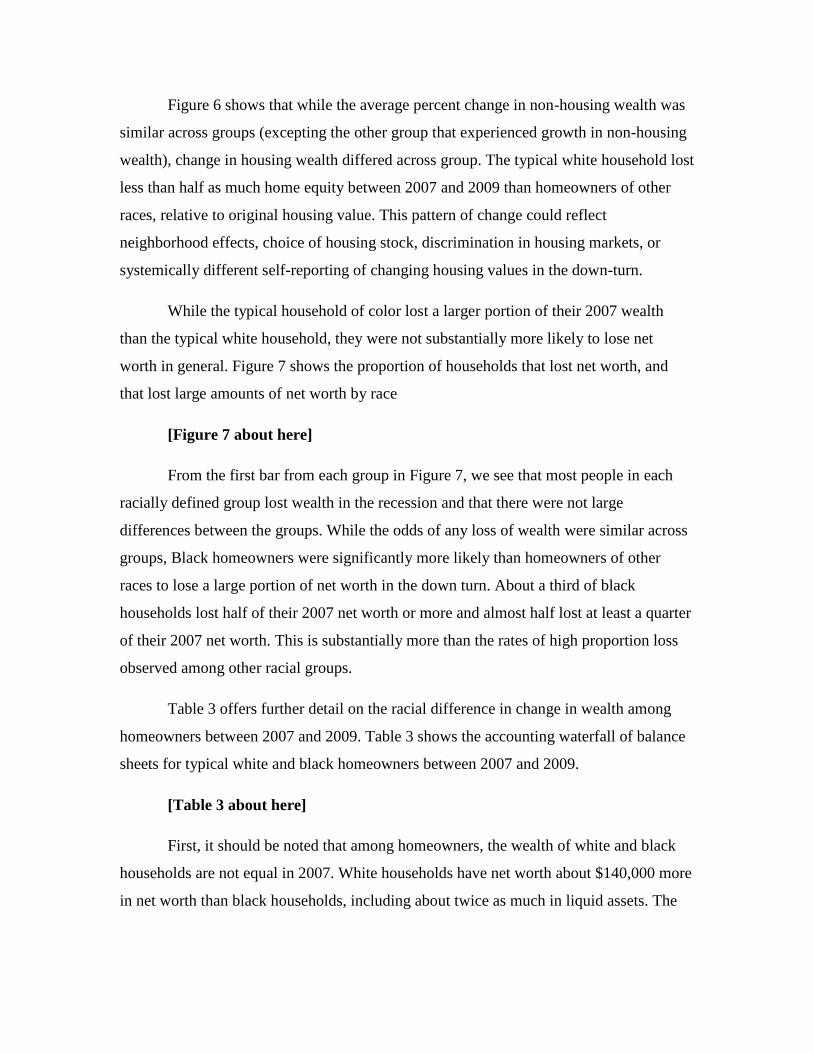
Figure 6 shows that while the average percent change in non-housing wealth was
similar across groups (excepting the other group that experienced growth in non-housing
wealth), change in housing wealth differed across group. The typical white household lost
less than half as much home equity between 2007 and 2009 than homeowners of other
races, relative to original housing value. This pattern of change could reflect
neighborhood effects, choice of housing stock, discrimination in housing markets, or
systemically different self-reporting of changing housing values in the down-turn.
While the typical household of color lost a larger portion of their 2007 wealth
than the typical white household, they were not substantially more likely to lose net
worth in general. Figure 7 shows the proportion of households that lost net worth, and
that lost large amounts of net worth by race
[Figure 7 about here]
From the first bar from each group in Figure 7, we see that most people in each
racially defined group lost wealth in the recession and that there were not large
differences between the groups. While the odds of any loss of wealth were similar across
groups, Black homeowners were significantly more likely than homeowners of other
races to lose a large portion of net worth in the down turn. About a third of black
households lost half of their 2007 net worth or more and almost half lost at least a quarter
of their 2007 net worth. This is substantially more than the rates of high proportion loss
observed among other racial groups.
Table 3 offers further detail on the racial difference in change in wealth among
homeowners between 2007 and 2009. Table 3 shows the accounting waterfall of balance
sheets for typical white and black homeowners between 2007 and 2009.
[Table 3 about here]
First, it should be noted that among homeowners, the wealth of white and black
households are not equal in 2007. White households have net worth about $140,000 more
in net worth than black households, including about twice as much in liquid assets. The
two groups owe similar amounts of housing debt, even though white households’ housing
assets are worth substantially more.
In dollar terms, the typical black homeowner experienced a slightly larger loss of
wealth than the typical white homeowner. The typical black household experienced a
much larger loss in wealth as a proportion of 2007 holdings than did the typical white
household. This expanded the racial wealth gap observed in 2007. The racial gap in
financial and retirement assets was also larger in 2009 than it was in 2007.
2007 NW
Next, we examine the changes in wealth among homeowners grouped by wealth
level in 2007. Figures 8 and 9 offer distinct views of wealth change in different quintiles
of the 2007 wealth distribution. Readers should recall that the quintiles presented are of
the wealth distribution for the full population (including renters) and that few
homeowners are in the bottom quintile of wealth.
[Figs 8 & 9 about here]
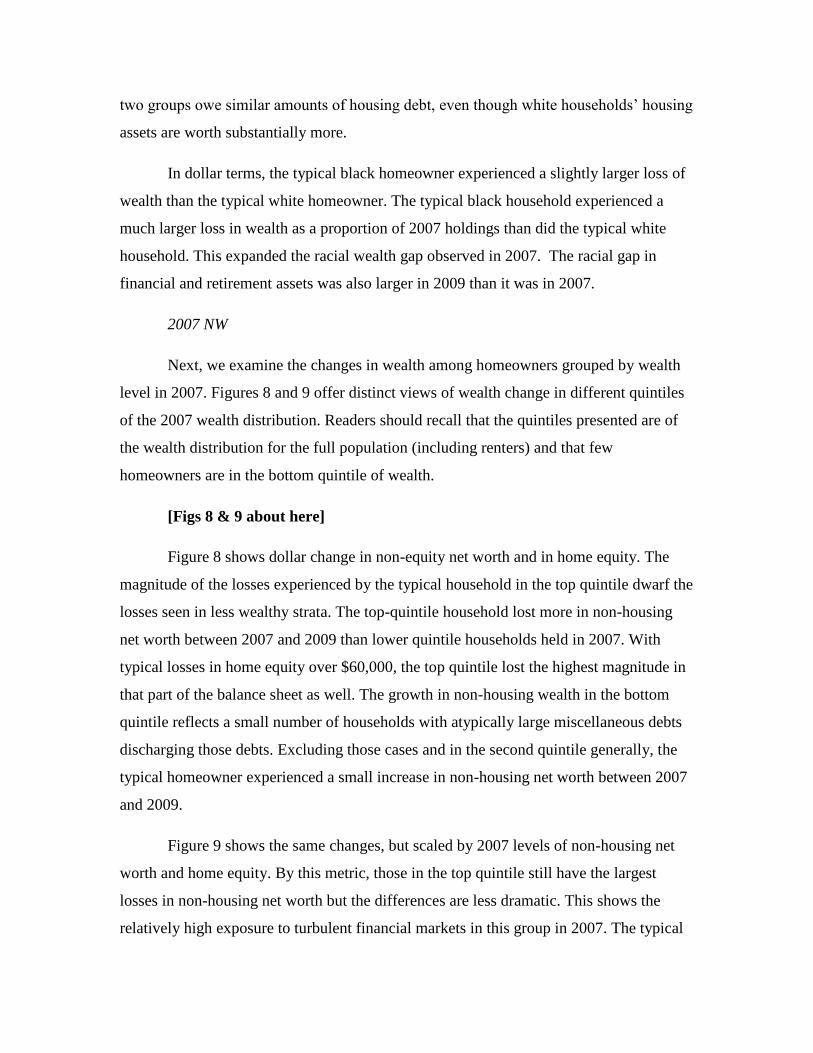
Figure 8 shows dollar change in non-equity net worth and in home equity. The
magnitude of the losses experienced by the typical household in the top quintile dwarf the
losses seen in less wealthy strata. The top-quintile household lost more in non-housing
net worth between 2007 and 2009 than lower quintile households held in 2007. With
typical losses in home equity over $60,000, the top quintile lost the highest magnitude in
that part of the balance sheet as well. The growth in non-housing wealth in the bottom
quintile reflects a small number of households with atypically large miscellaneous debts
discharging those debts. Excluding those cases and in the second quintile generally, the
typical homeowner experienced a small increase in non-housing net worth between 2007
and 2009.
Figure 9 shows the same changes, but scaled by 2007 levels of non-housing net
worth and home equity. By this metric, those in the top quintile still have the largest
losses in non-housing net worth but the differences are less dramatic. This shows the
relatively high exposure to turbulent financial markets in this group in 2007. The typical
household in all of the groups lost equity between 2007 and 2009. The few households in
the bottom quintile experienced the largest loss. The loss experienced as a proportion of
original value was similar in the top three 2007 wealth quintiles.
Table 4 further explores the dynamics of wealth change by detailing the balance
sheet of the typical household in the bottom quintile, the middle quintile, and the top
quintile of 2007 wealth.
[Table 4 about here]
In the first panel of Table 4, showing 2007 wealth, the imbalance in wealth across
quintiles is obvious. Those in top quintiles hold much more, particularly in financial and
retirement, and miscellaneous assets than those in the middle quintile, often an order of
magnitude more.
The second panel of the table, looking at 2007 to 2009 change, reflects the much
higher level of exposure to markets, and thus losses among high wealth households. The
middle quintile losses assets but also discharges debt during the recession. As noted
above, the wealth gain reflected among bottom quintile households results from the
discharge of large debts by anomalous cases, magnified by the small sample size of that
strata.
Overall, the home dominates both sides of the balance sheet of homeowners and
the trajectory of home equity is the trajectory of wealth for the vast majority of
households during the Great Recession. Excepting high-wealth households with
substantial holdings in financial assets, the fate of the home was the fate of the
household’s wealth. For groups that faced steeper, larger proportion, and more prevalent
losses like Black homeowners, this concentration and exposure to home value meant a
deeper impact of the recession on balance sheet.
Mobility
In this section, we examine mobility across wealth quintiles between 2007 and
2009. In this section, we bring in non-owning households to supplement insights on
mobility around homeowners. The findings are presented in mobility tables. Each table
compares 2007 wealth quintile (rows) and 2009 wealth quintile (column). Each cell is the
proportion of the sample in that cell. For instance, among all respondents, 15% of
respondents were in the lowest quintile of wealth in both 2007 and 2009. Cells on the
diagonal, where a person had no mobility, are shaded.
[Tables 5-7 about here]
Table 5 shows the wealth mobility for all SCF respondents, including renters and
owners. Table 6 shows the same for 2007 owners and Table 7 for 2007 renters. It should
be noted that very few owners were in the bottom quintile of wealth in 2007 and very few
renters were in the top quintiles. This reflects the dominant role of an owned home as an
investment vehicle in the American balance sheet.
Overall, almost three-fourths of respondents were in the same wealth quintile in
2007 as in 2009. Homeowners were more likely than renters to be in the same quintile
than renters (76% vs. 70%). A larger proportion of renters than owners had upward
wealth mobility between 2007 and 2009 than owners. As expected, very few large
upward or downward changes in wealth were observed. Overall, only 2% of respondents
moved more than one quintile up or down and no respondents moved more than two
quintiles. This suggests that the wealth distribution is fairly durable and that large
magnitude wealth shifts are rare in short time horizons.
Owning and renting, a juxtaposition
To conclude we juxtapose renters and owners. Ideally, having shown some effects
on the Great Recession on homeowners, we would want to compare them to renters and
tell a causal story about the role of an owned home on the balance sheet during the
recession. Table 8 compares owners and renters on a variety of measures.
[Table 8 about here]
The first row of table 8, comparing the 2007 median wealth and owners and
renters speaks to the difficulty of rigorously evaluating the differences between the
groups. Put simply, the differences between the groups are large enough to leave their
balance sheets largely incomparable.

Nonetheless, several cautious observations can be drawn from patterns of wealth
loss between the two groups. First, homeowners were definitionaly exposed to the
housing market in ways renters were not. This surely contributes to the larger nominal
and percentage loss in net worth experienced by owners and the higher proportion of
owners than renters who lost wealth from 2007 to 2009. Interestingly, though more likely
to lose wealth than renters, owners were less likely to lose a quarter or half of their net
worth. Surely part of this is the smaller denominator of renters (2007 wealth), but it also
could suggest that an owned home could be a buffer against large losses. This is a fruitful
line for future research with a more comparable cohort of renters and owners.
Discussion
This paper uses panel data from the 2007 to 2009 reinterview panel of the Survey
of Consumer Finances to examine homeownership as a component of the household
balance sheet and to explore the various trajectories of wealth among distinct segments of
homeowners. The results presented here indicated that even in the midst of the housing
crisis and over the course of the Great Recession, home equity has continued to be the
dominant component of the balance sheet for American homeowners. Home equity
represents the largest share of the balance sheets for low, moderate, and high wealth
households. For those in the bottom 40% of net worth, home equity accounts for 70% of
the total wealth. The story is different for households with high net worth, where home
equity still accounts for 30%.
We also find those homeowners are deeply heterogeneous in terms of losses and
gains during the recession. In absolute terms, wealthier homeowners lost more home
equity during the housing crisis, but homeowners with lower initial net worth lost more
as a proportion of their total wealth. Compared with losses in home equity, a larger
proportion of homeowners had non-housing net worth losses between 2007 and 2009.
Households with the highest net worth, who held substantially greater non-equity assets,
lost substantially more non-housing net worth in both absolute and relative terms
compared to households with lower net worth. Overall, most homeowners experienced a
reduction in their net worth during the recession; the typical homeowner lost about 10%
in net worth, or $40,000, between 2007 and 2009. A larger proportion of homeowners
lost net worth than renters did; however, renters were more likely to lose a large
proportion (>25%) of their net worth. Thus, homeownership appears to have increased
exposure to loss, but protected against severe loss.
Our results are consistent with previous findings suggesting that racial/ethnic
minorities were disproportionately affected by the economic downturn. During the
period between 2007 and 2009, Hispanics experienced a 32% drop in home equity, while
Blacks experienced a 31% drop and Whites experienced a 15% drop. Equity changes for
the other race/ethnic category are difficult to interpret because this group consisted of less
than 5% of the population. Blacks and Hispanics, lost significantly more in terms of
home equity than non-home equity net worth. In addition, while on average, blacks and
Hispanics lost similar proportions of their net worth, Blacks had the largest proportion of
households that lost at least 50% of their net worth. These results reinforce the notion that
African Americans and Hispanics were hit the hardest during the housing crisis. This is
could also result from an interaction of residential segregation and neighborhood effects
and the disportionate targeting of African Americans and Hispanics by predatory lenders
and expensive, risky mortgage products.
Among owners and among renters, there is relatively little wealth mobility
between 2007 and 2009. This accords with the findings above that suggest that changes
in wealth, both positive and negative, were generally modest over the course of the Great
Recession. While some households had very large losses or gains, they were very much
in the minority. Three fourths of all households found themselves in the same wealth
quintile in 2009 as in 2007. Transitions of two quintiles were very rare and of three
quintiles or more were nonexistent. The wealth distribution of the U.S., both among
renters and among owners, is markedly stable.
The owned home is the cornerstone of homeowners balance sheets and the
investment of choice for those households with stocks of assets. Because of the
concentration of assets in the home and the minimal exposure of most homeowners to
financial asset markets, the wealth of homeowners tracks the wealth of their home
closely. While this exposes them to risk in when home prices drop, the historic stability

of prices and the natural floor value of the home and its land my act as a cushion against
larger magnitude loss.
References
Barakova, I., Bostic, R., Calem, P., & Wachter, S. (2003). Does credit quality matter for
homeownership? Journal of Housing Economics, 12, 318–36.
Belsky, E. S. and Duda, M. (2002). Assets appreciation, timing of purchases and sales,
and returns to low-income homeownership. In N. P. Retsinas & E. S. Belsky
(Eds.), Low-income homeownership: Examining the unexamined goal.
Washington, DC: Brookings Institution Press.
Boehm, T. P., & Schlottmann, A.M. (1999). Does home ownership by parents have an
economic impact on their children? Journal of Housing Economics, 8(3), 217–32.
Bricker, J., Bucks, B., Kennickell, A., Mach, T., & Moore, K. (2012). The Financial
Crisis from the Family's Perspective: Evidence from the 2007-2009 SCF Panel *.
Journal of Consumer Affairs, 46(3), 537–555. doi:10.1111/j.1745-6606.2012.01243.x
Bricker, J., Kennickell, A., Moore, K., & Sabelhaus, J. (2012). Changes in US Family
Finances from 2007 to 2010: Evidence from thet Survey of Consumer Finances.
Federal Reserve Bulletin, 98(2), 1–80. Retrieved from
http://www.federalreserve.gov/pubs/bulletin/2012/PDF/scf12.pdf
Bucks, B. K., Kennickell, A. B., Mach, T.L., & Moore, K.B. (2009). Changes in U.S.
family finances from 2004 to 2007: Evidence from the Survey of Consumer
Finances. Federal Reserve Bulletin, 95. Retrieved from
http://www.federalreserve.gov/pubs/bulletin/2009/pdf/scf09.pdf
Carasso, A., Bell, E., Olsen, E., & Steuerle, C. (2005). Improving homeownership among
poor and moderate-income households. Washington, DC: Urban Institute.
Retrieved from
http://www.urban.org/UploadedPDF/311184_improving_homeownership.pdf
Collins, J. M. (2004). Expanding the American Dream: A homeownership guide for
grantmakers. Washington, DC: Neighborhood Funders Group.
Coulson, N. E., & Fisher, L. M. (2002). Tenure choice and labour market outcomes.
Housing Studies, 17(1), 35–49.
Desilva, S., & Elmelech, Y. (2012). Housing inequality in the United States: Explaining
the white-minority disparities in homeownership. Housing Studies, 27(1), 1-26.
Di, Z., Belsky, E., & Liu, X. (2007). Do homeowners achieve more household wealth in
the long run? Journal of Housing Economics, 16, 274-290.
Di, Z., & Liu, X. (2004). The importance of wealth and income in the transition to
homeownership. Cambridge, MA: Abt Associates Inc.
Di, Z., Yang, Y., and Liu, X. (2003). The importance of housing to the accumulation of
household net wealth. Working paper 03-5. Cambridge, MA: Joint Center for
Housing Studies, Harvard University.
Dickerson, A. (2009). The myth of home ownership and why home ownership is not
always a good thing. Indiana Law Journal, 84(1), 189-237.
Dietz, R. D., & Haurin, D. R. (2003). The social and private micro-level consequences of
homeownership. Journal of Urban Economics, 54(3), 401-450.
doi:http://dx.doi.org/10.1016/S0094-1190(03)00080-9
Haurin, D. R., & Morrow-Jones, H. A. (2006). The impact of real estate market
knowledge on tenure choice: A comparison of black and white households.
Housing Policy Debate, 17(4),625–53.
Herbert, C. E., & Tsen, W. (2005). The potential of downpayment assistance for
increasing homeownership among minority and low-income households.
Washington, DC: U.S. Department of Housing and Urban Development.
Herbert, C. E., & Belsky, E. S. (2008). Homeownership experience of low-income and
minority households: A review and synthesis of the literature. A Journal of Policy
Development And Research, 10(2), 5-59.
Quercia, R., Freeman, A., & Ratcliffe, J. (2011) Regaining the dream: How to renew the
promise of homeownership for America’s working families. Washington, DC: The
Brookings Institution.
Ratner, M. S. (1996). Many routes to homeownership: A four-site ethnographic study of
minority and immigrant experiences. Housing Policy Debate, 7(1), 103–45.
Robert, S., & House, S. J. (1996). SES differentials in health by age and alternative
indicators of SES. Journal of Aging and Health, 8, 359–88.
Rossi, P. H., & Weber, E. (1996). The social benefits of homeownership: Empirical
evidence from national surveys. Housing Policy Debate, 7(1), 1–35.
Santiago, A. M., & Galster, G.C. (2004). Moving from public housing to hom-
eownership: Perceived barriers to program participation and success. Journal of
Urban Affairs, 26(3), 297–324.
Scanlon, E., & Page-Adams, D. (2001). Effects of asset holding on neighborhoods,
families, and children: A review of research. In R. Boshara, (Ed.), Building assets
(pp. 25-45). Washington, DC: Corporation for Enterprise Development.
Van Zandt, S., & Rohe, W.M. (2006). Do first-time home buyers improve their
neighborhood quality? Journal of Urban Affairs, 28(5), 491–510.
Zhao, B., Ondrich, J., & Yinger, J. (2006). Why do real estate brokers continue to
discriminate? Evidence from the 2000 Housing Discrimination Study. Journal of
Urban Economics, 59(3), 394–419.

Figure 1. Components of Net worth
Assets Debts
Liquid Checking
Savings
Credit Credit cards
Other consumer debt
Housing House value Housing Mortgage(s)
Physical Other property
Business
Cars
Other vehicles
Other
physical
Debt to business
Car(s)
Other vehicles
Financial Mutual funds
CDs
Savings bonds
Other bonds
Stocks
Brokerage accts.
Annuities
Education Student debt
Retirement IRA
401(k)
Pension
Misc. Other lines of credit
Margin loans
Other
Misc. Life insurance
Personal debt owed
Business debt owed
Other (Cash,
valuables)
Net worth=total assets-total debts

Table 1. Sample Sizes
category approxsampleoverall 3728Owners 2384Renters 1344
AmongownersRacewhite 2125black 264
hispanic 165other 111
Wealthbottom20 55
20-40 420middle40 65860-80 747top20 784

Figure 2. Patterns of asset holding by wealth
0.000
0.100
0.200
0.300
0.400
0.500
0.600
0.700
0.800
0.900
1.000
bo om20% middle20% top20%
Proporonof2007Assts
Quin leof2007NetWorth
Miscellanious
Re rementSavings
FinancialAssets
PhysicalAssets
Homevalue
Transac onaccounts
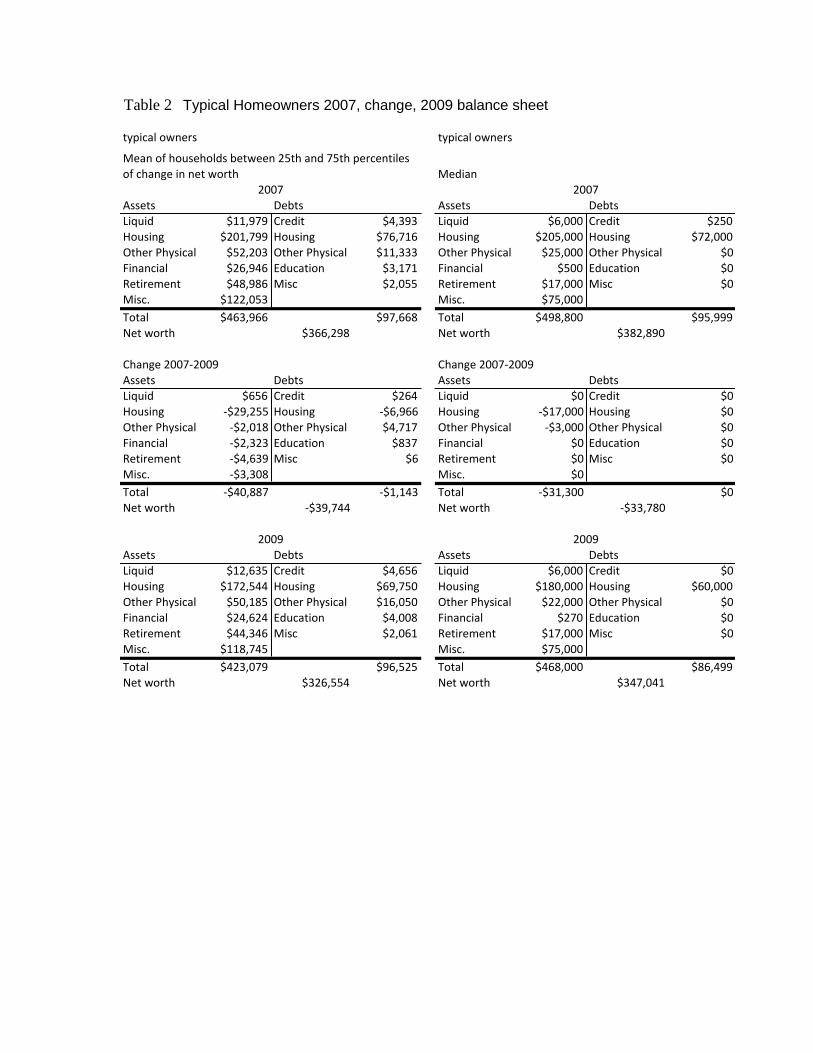
Table 2 Typical Homeowners 2007, change, 2009 balance sheet
typicalowners typicalowners
Liquid $11,979 Credit $4,393 Liquid $6,000 Credit $250
Housing $201,799 Housing $76,716 Housing $205,000 Housing $72,000
OtherPhysical $52,203 OtherPhysical $11,333 OtherPhysical $25,000 OtherPhysical $0
Financial $26,946 Education $3,171 Financial $500 Education $0
Retirement $48,986 Misc $2,055 Retirement $17,000 Misc $0
Misc. $122,053 Misc. $75,000
Total $463,966 $97,668 Total $498,800 $95,999
Networth $366,298 Networth $382,890
Liquid $656 Credit $264 Liquid $0 Credit $0
Housing -$29,255 Housing -$6,966 Housing -$17,000 Housing $0
OtherPhysical -$2,018 OtherPhysical $4,717 OtherPhysical -$3,000 OtherPhysical $0
Financial -$2,323 Education $837 Financial $0 Education $0Retirement -$4,639 Misc $6 Retirement $0 Misc $0
Misc. -$3,308 Misc. $0
Total -$40,887 -$1,143 Total -$31,300 $0
Networth -$39,744 Networth -$33,780
Liquid $12,635 Credit $4,656 Liquid $6,000 Credit $0Housing $172,544 Housing $69,750 Housing $180,000 Housing $60,000
OtherPhysical $50,185 OtherPhysical $16,050 OtherPhysical $22,000 OtherPhysical $0
Financial $24,624 Education $4,008 Financial $270 Education $0
Retirement $44,346 Misc $2,061 Retirement $17,000 Misc $0
Misc. $118,745 Misc. $75,000
Total $423,079 $96,525 Total $468,000 $86,499
Networth $326,554 Networth $347,041
Assets Debts
Meanofhouseholdsbetween25thand75thpercentiles
ofchangeinnetworth2007
Assets Debts
Change2007-2009
Assets Debts
Median2007
Assets Debts
Change2007-2009
2009
Assets Debts
2009
Assets Debts

Figures 3-5. Kernal density plots of percent change in net worth, home equity, and non-housing net worth
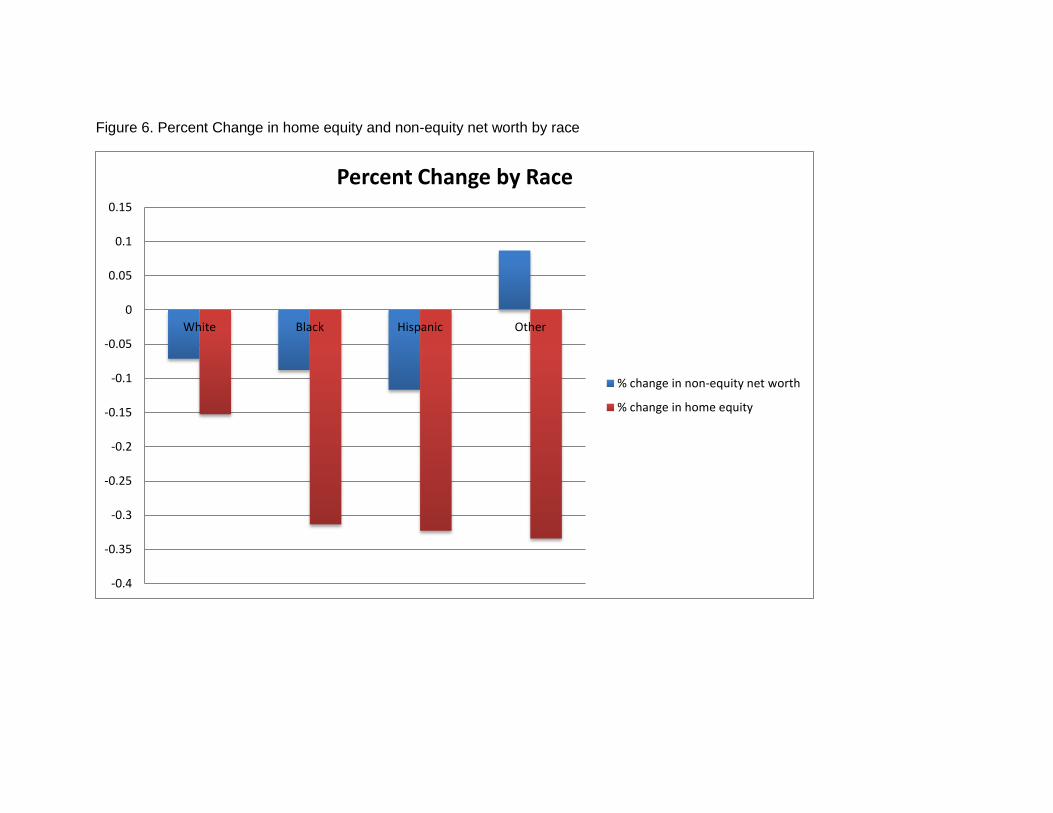
Figure 6. Percent Change in home equity and non-equity net worth by race
-0.4
-0.35
-0.3
-0.25
-0.2
-0.15
-0.1
-0.05
0
0.05
0.1
0.15
White Black Hispanic Other
Percent Change by Race
% change in non-equity net worth
% change in home equity

Figure 7. Proportion of households losing net worth, by race
0
0.1
0.2
0.3
0.4
0.5
0.6
0.7
White Black Hispanic Other
Race
Pro
po
rtio
n o
f gr
ou
p
Proportion losing net worth, by race
Lose net worth
Lose at least 10%
Lose at least 25%
Lose at least 50%

Table 3. Household Balance Sheets by Race
Liquid $13,400 Credit $4,515 Liquid $6,165 Credit $2,833
Housing $202,294 Housing $72,407 Housing $171,195 Housing $68,464
OtherPhysical $56,822 OtherPhysical $11,781 OtherPhysical $24,287 OtherPhysical $7,284
Financial $31,416 Education $3,239 Financial $3,347 Education $3,668Retirement $54,087 Misc $2,161 Retirement $20,680 Misc $142
Misc. $126,416 Misc. $106,638
Total $484,434 $94,103 Total $332,311 $82,392
Networth $390,331 Networth $249,920
Liquid $829 Credit $414 Liquid -$398 Credit -$322
Housing -$25,051 Housing -$5,240 Housing -$42,646 Housing -$10,428OtherPhysical -$2,900 OtherPhysical $3,573 OtherPhysical $4,586 OtherPhysical $11,969
Financial -$2,739 Education $833 Financial -$1,777 Education $1,018
Retirement -$4,993 Misc $87 Retirement -$3,092 Misc $601
Misc. -$3,872 Misc. $1,025
Total -$38,727 -$333 Total -$42,302 $2,838
Networth -$38,394 Networth -$45,140
Liquid $14,229 Credit $4,929 Liquid $5,767 Credit $2,511
Housing $177,243 Housing $67,167 Housing $128,549 Housing $58,036
OtherPhysical $53,922 OtherPhysical $15,354 OtherPhysical $28,873 OtherPhysical $19,253Financial $28,676 Education $4,072 Financial $1,569 Education $4,686
Retirement $49,094 Misc $2,247 Retirement $17,587 Misc $743
Misc. $122,544 Misc. $107,663
Total $445,707 $93,770 Total $290,010 $85,230
Networth $351,938 Networth $204,780
2009
Assets Debts
2009
Assets Debts
Assets Debts
White
2007
Assets Debts
Change2007-2009
Assets Debts
Black
2007
Assets Debts
Change2007-2009
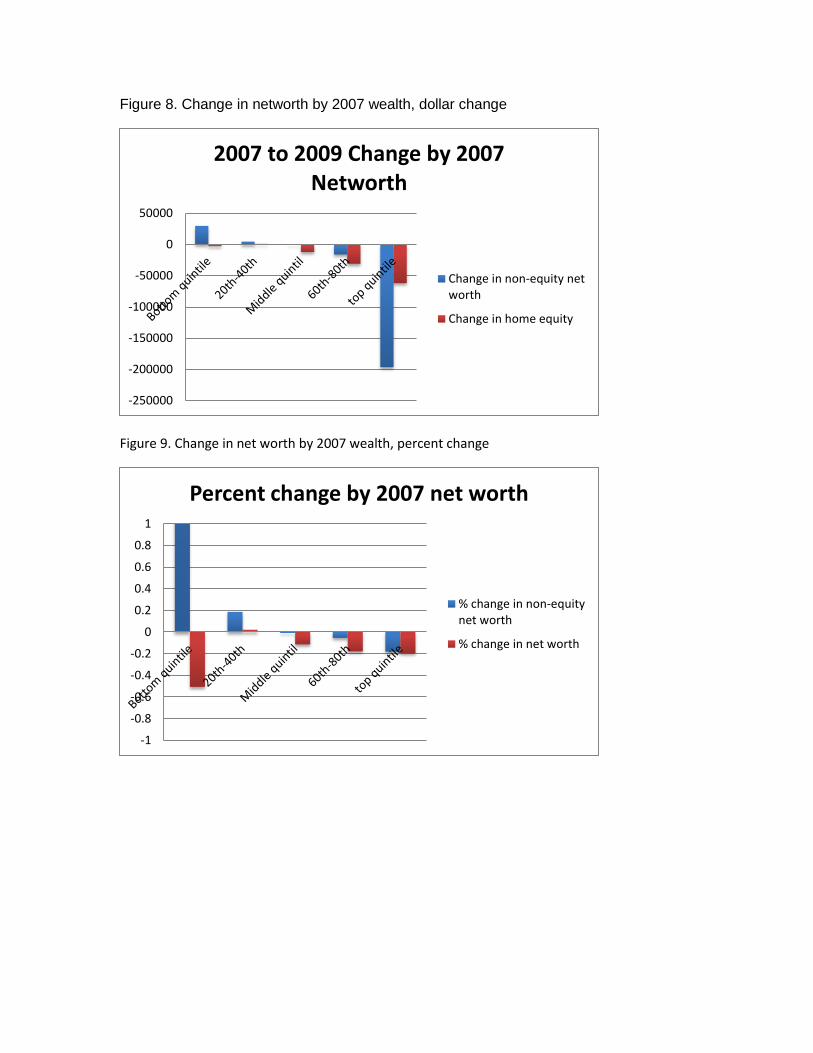
Figure 8. Change in networth by 2007 wealth, dollar change
Figure 9. Change in net worth by 2007 wealth, percent change
-250000
-200000
-150000
-100000
-50000
0
50000
2007 to 2009 Change by 2007 Networth
Change in non-equity networth
Change in home equity
-1
-0.8
-0.6
-0.4
-0.2
0
0.2
0.4
0.6
0.8
1
Percent change by 2007 net worth
% change in non-equitynet worth
% change in net worth

Table 4. Household balance sheets by 2007 wealth quintile
Liquid $1,205 Credit $12,493 Liquid $8,407 Credit $2,750 Liquid $43,162 Credit $3,578
Housing $98,118 Housing $92,570 Housing $158,711 Housing $51,887 Housing $442,576 Housing $124,517OtherPhysical $33,282 OtherPhysical $7,720 OtherPhysical $23,090 OtherPhysical $7,850 OtherPhysical $261,858 OtherPhysical $24,187
Financial $549 Education $9,341 Financial $8,644 Education $1,697 Financial $157,599 Education $3,587
Retirement $1,511 Misc $16,794 Retirement $16,289 Misc $525 Retirement $206,240 Misc $12,043
Misc. $5,378 Misc. $46,012 Misc. $458,805
Total $140,043 $138,918 Total $261,153 $64,710 Total $1,570,239 $167,911
Networth $1,125 Networth $196,443 Networth $1,402,328
Liquid $145 Credit -$7,986 Liquid -$122 Credit $528 Liquid -$3,271 Credit $865
Housing -$20,445 Housing -$17,635 Housing -$16,350 Housing -$4,175 Housing -$72,673 Housing -$10,818
OtherPhysical -$18,356 OtherPhysical -$1,230 OtherPhysical -$2,295 OtherPhysical $585 OtherPhysical -$42,957 OtherPhysical $11,853
Financial -$84 Education $230 Financial -$24 Education $583 Financial -$29,089 Education $1,020
Retirement $820 Misc -$16,794 Retirement $905 Misc $24 Retirement -$43,042 Misc -$1,671
Misc. $21,377 Misc. $2,447 Misc. -$65,955
Total -$16,544 -$43,414 Total -$15,440 -$2,455 Total -$256,988 $1,249
Networth $26,870 Networth -$12,984 Networth -$258,237
Debts
Bottom20% Middle20% Top20%
2007 2007 2007
Assets Debts Assets Debts Assets
Change2007-2009 Change2007-2009 Change2007-2009
Assets Debts Assets Debts Assets Debts

Tables 5-7. Mobility for All, Owners, and Renters
All
0-20 20-40 40-60 60-80 80-100 total
0-20 15.6 3.6 0.7 0.1 0.0 20.0
20-40 3.7 12.4 3.4 0.5 0.0 20.0
40-60 0.5 3.6 13.0 2.9 0.0 20.0
60-80 0.2 0.3 2.8 15.1 1.6 20.0
80-100 0.0 0.0 0.0 1.6 18.4 20.0
Total 20.1 19.9 20.0 20.0 20.0 100.0
Allowners
0-20 20-40 40-60 60-80 80-100 total
0-20 2.0 1.2 0.2 0.0 0.0 3.5
20-40 2.2 12.6 3.5 0.4 0.0 18.6
40-60 0.4 4.4 16.5 3.4 0.0 24.7
60-80 0.2 0.3 3.5 20.2 2.2 26.3
80-100 0.0 0.0 0.1 2.0 24.7 26.8
Total 4.8 18.6 23.8 25.9 26.9 100.0
Allrenters
0-20 20-40 40-60 60-80 80-100 total
0-20 49.70 9.70 1.70 0.20 0.00 61.40
20-40 7.50 11.80 3.40 0.70 0.00 23.40
40-60 0.90 1.50 4.20 1.50 0.00 8.10
60-80 0.10 0.40 1.20 2.30 0.20 4.10
80-100 0.00 0.00 0.00 0.50 2.50 3.00Total 58.20 23.40 10.50 5.10 2.70 100.00
2009WealthQuintile
2007
Wealth
Quintile
2009WealthQuintile
2007
WealthQuintile
2009WealthQuintile
2007
Wealth
Quintile
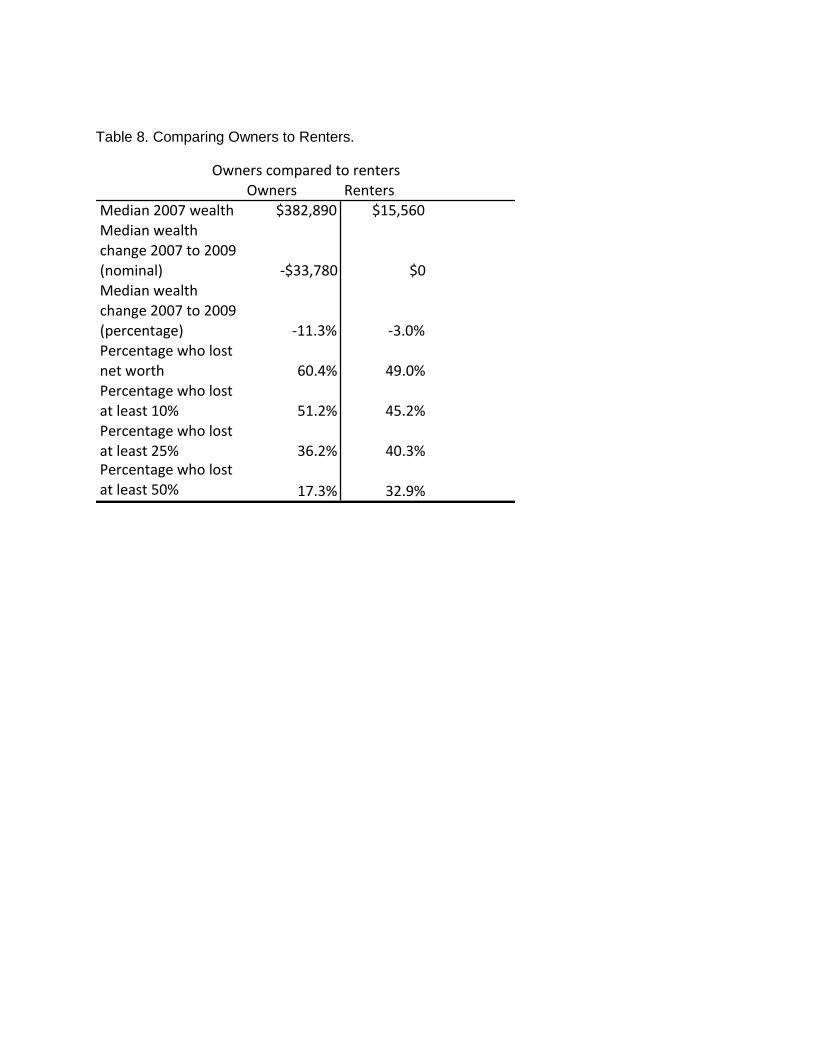
Table 8. Comparing Owners to Renters.
Owners RentersMedian2007wealth $382,890 $15,560Medianwealthchange2007to2009(nominal) -$33,780 $0Medianwealthchange2007to2009(percentage) -11.3% -3.0%Percentagewholostnetworth 60.4% 49.0%Percentagewholostatleast10% 51.2% 45.2%Percentagewholostatleast25% 36.2% 40.3%Percentagewholostatleast50% 17.3% 32.9%
Ownerscomparedtorenters