homeownership education week seminar
TRANSCRIPT

Company Confidential©2015 Genworth MI Canada Inc. All rights reserved.
Celebrating 20 years of helping Canadians achieve the dream of homeownership.
Decoding Today’s First-Time Homebuyer Understanding motivations, triggers and behaviours of
millennial homebuyers
Genworth Canada
Homeownership Education Week Seminar
April 7, 2015
NOTICE: This document contains confidential, non-public company information. Further distribution of this document is strictly prohibited.

First-Time Homeownership
Study Results
David MacDonald
Group Vice President, Financial Services
Environics Research Group

Methodology
2
Background
● The purpose of this research is to gain deeper insights into the financial preparedness and fitness of First Time homebuyers in advance of the Genworth Canada’s Homeownership Education Week.
Methodology
● A total of 1,800 interviews were completed between February 5 to March 4, 2015.
● Interviewing targeted those aged 25-40 years of who had purchased their first home in the past 24 months. Oversampling in Toronto, Montreal, Calgary and Vancouver allows for deeper analysis in those cities.
● 77% are Millennials. Of the 20% who are immigrants, 62% are new to Canada, having arrived in the past 10 years.
Values are percent (%) Total Vancouver BC Calgary Alberta MB/SK Toronto Ontario Montreal Quebec Atlantic
Unweighted Counts 1800 200 113 141 148 143 246 300 114 247 148
Weighted Counts 1800 32 205 58 141 121 138 560 87 334 125
Findings
3

Type of Home Purchases
4
Q9. What kind of home did you purchase?
Findings:
• Over half (55%) of first-time homebuyers say they purchased a fully detached house.
• Just under two in ten purchased a condominium (17%) or a townhouse (15%).
• Just over one in ten (13%) purchased a semi-detached house.
• Those in Montreal (40%), Toronto (39%), Calgary (24%) and Vancouver (47%) are more likely to have purchased a condo. So too are those buying a home on their own (27%).
55%
17%
15%
13%
<0.5%
<0.5%
<0.5%
Fully detached home
Condominium
Townhouse/row house
Duplex/semi-detachedhome
Trailer/mobile home
Other
DK/NA
Region
Total Vancouver BC Calgary Alberta MB/SK Toronto Ontario Montreal Quebec Atlantic
Condominium 17% 47% 16% 24% 13% 22% 39% 11% 40% 11% 5%
Townhouse/row house 15% 24% 19% 20% 10% 7% 19% 22% 12% 3% 7%
Duplex/Semi-detached 13% 3% 4% 7% 17% 6% 15% 16% 21% 12% 14%
Fully Detached 55% 25% 59% 49% 59% 66% 28% 51% 26% 72% 71%

Type of Home Purchases
5
Q10. Was the home you purchased…?
Findings:
• Eight in ten (80%) FTBs say they purchased a re-sale home while two in ten (20%) purchased a brand new home.
• Those in Calgary (31%), the rest of Alberta (31%) or Vancouver (36%) are more likely to say they bought a brand new home.
80%
20%
An existing, re-salehome
Bought brand newfrom builder/
developer

Purchased With
6
11. Did you purchase your home…
62%
35%
2%
1%
<0.5%
With aspouse/partner
By yourself
Parents
Other familymember
Other
Findings:
• Six in ten (62%) purchased their home with a spouse or partner while just over one-third (35%) purchased the home on their own.
• Those in Toronto (47%) and Vancouver (44%) are more likely to say they bought their home on their own.
• Men are more likely than women to say they bought the home on their own (42% vs. 29%), while women are more likely to say they bought the home with their spouse or partner (69% vs. 56%).

Motivation for Buying Home
7
Q14. Which of the following were motivations that led you to purchase a home rather than keep living where you were? Select all that apply
53%
47%
47%
44%
32%
31%
19%
15%
15%
11%
8%
7%
4%
1%
<0.5%
Believe owning a home is a wiser financial decision
Saved enough for a down payment
Wanting to own the home you live in so are in control of it
Became financially confident that I could afford it
Disliked renting a home
Wanted to buy a home now before prices increased further
Getting married/moving in together with partner
Got a new job/raise/bonus
Birth of a child
Spoke to a professional who showed me that I could afford it
Disliked living at parent’s home
Received an inheritance or gift of large sum of money
Attended a home show to educate yourself on the process
Other
DK/NA

Importance of Home Characteristics
8
Q15. How important were each of the following as reasons for why you chose your current home?
66%
51%
46%
36%
33%
38%
30%
29%
24%
27%
21%
26%
24%
24%
18%
28%
40%
44%
49%
46%
39%
46%
44%
47%
42%
43%
37%
39%
31%
22%
94%
91%
90%
85%
79%
77%
76%
72%
71%
69%
65%
63%
63%
55%
39%
Price
Safe neighbourhood
Size/space of the home
Style/design of home
Value as investment/take advantage of rising prices
Type of neighbourhood want to raise your kids in
Proximity to work
Energy efficiency of home
Features/upgrades
Potential to renovate and resell
Proximity to shopping
Proximity to schools
Energy efficiency of appliances in home
Proximity to public transit
Potential to rent out part or all of it
Very important
Somewhat important

Price Paid and Down Payment
9
Q18.To help us understand home prices and mortgage financing please indicate the total purchase price of your home, as well as the down payment you made.
Findings:
• The median home price for first-time buyers is $293,000 and the median down payment is $34,000, representing 12% of the total home price.
• 63% indicate making a down payment of less than 20%, with those buying a detached home being more likely than those buying a condo to put down less than 20% (65% vs. 57%).
• Those in Calgary (73%) are more likely than those in Toronto (43%) and Vancouver (47%) to have put down less than 20%.
Median
Price paid for your home $293K
Total down payment for your home
$34K
Size of the mortgage $242K
Down payment as proportion of the total cost of the home
12%
Proportion with high ratiomortgages
63%

Price Paid and Down Payment
10
Q18.To help us understand home prices and mortgage financing please indicate the total purchase price of your home, as well as the down payment you made.
Region
MedianTotal Vancouver BC Calgary Alberta MB/SK Toronto Ontario Montreal Quebec Atlantic
Price paid for your home $293K $420K $300k $370k $330K $275K $425K $325K $250K $203K $185K
Total down payment for your home $34K $75K $25k $40K $35K $25K $90K $50K $30K $19K $15K
Size of the mortgage $242K $316K $245k $307K $302K $235K $320K $273K $225K $178K $161K
Down payment as proportion of the total cost of the home
12% 20% 10% 10% 10% 10% 21% 18% 13% 10% 8%
Proportion with high ratio mortgages 63% 47% 68% 72% 74% 70% 38% 51% 62% 77% 77%
Proportion getting gift or loan for DP 28% 40% 35% 31% 26% 33% 35% 28% 23% 20% 24%

Sources for Obtaining Down Payment
11
Q21. From which of the following sources did you obtain the funds for your down payment? Select all that apply
69%
39%
24%
22%
9%
8%
5%
3%
1%
1%
1%
Your own/partner’s savings/non-registered investments
Withdrawal from an RRSP (Home Buyer’s Plan)
Withdrawal from a TFSA (Tax-FreeSavings Account)
Gift from a family member
Loan from a family member
Line of credit/other financing
Wedding gift
Proceeds from the sale of a propertyby your co-purchaser
Income or sale of assets owned inthe country you immigrated from
Inheritance
DK/NA
Findings:
• Seven in ten (69%) say they obtained funds for their down payment from their, or their partner’s, savings or non-registered investments, while four in ten (39%) say they made a withdrawal from their RRSP.
• The proportion drawing from their own or their partner’s savings is highest in Vancouver (75%) and Toronto (75%).
• Over two in ten say they withdrew money from their TFSA (24%). Combined, 28% received a gift (22%) or loan (9%) from a family member.
• FTBs in Vancouver and Toronto are also the most likely to receive loans or gifts from family members (40% and 35% respectively).

Importance of Sources of Information
12
Q26. How important were each of the following sources of information to you in helping you learn about your mortgage options?
37%
28%
28%
24%
22%
18%
19%
15%
12%
9%
10%
9%
36%
43%
39%
40%
39%
37%
33%
33%
23%
26%
21%
21%
73%
71%
66%
64%
61%
55%
52%
48%
35%
35%
31%
30%
Mortgage broker/specialist
Family/friends
Bank/credit union representative
Real estate agent
Internet (personal finance websites/media)
Internet (lending institution)
Financial planner/advisor (not affiliated with the lendinginstitution)
Mobile tools (for example apps, online calculators, etc.)
Builder/developer
Traditional media (newspapers, magazines)
Attending a local home show
Social media (personal finance blogs)
Very important
Somewhat important
Help in Obtaining Mortgage
13
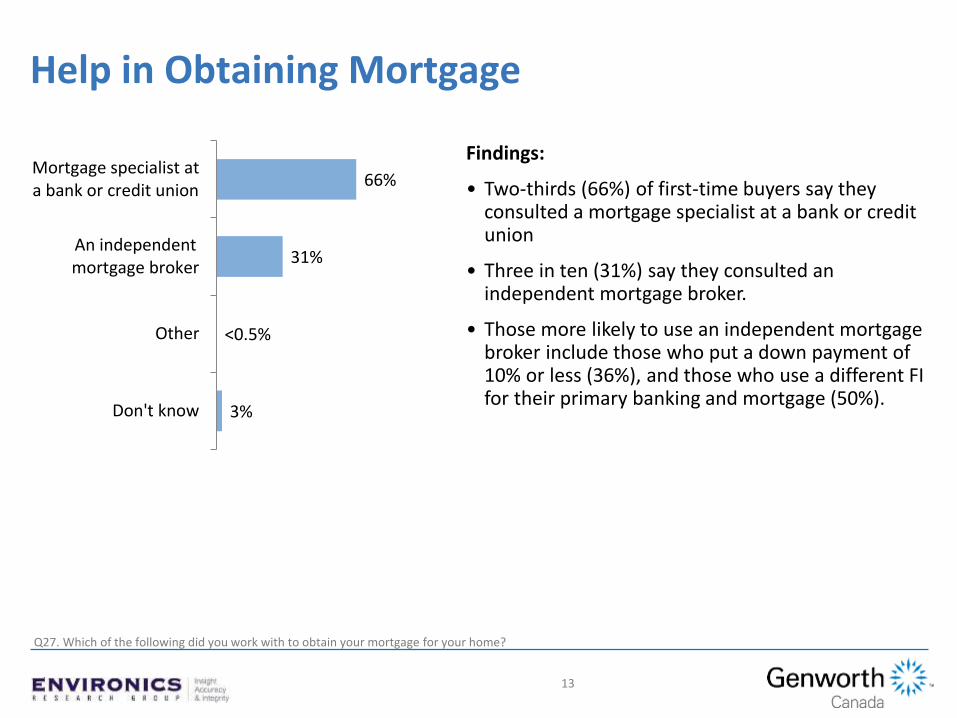
Q27. Which of the following did you work with to obtain your mortgage for your home?
66%
31%
<0.5%
3%
Mortgage specialist ata bank or credit union
An independentmortgage broker
Other
Don't know
Findings:
• Two-thirds (66%) of first-time buyers say they consulted a mortgage specialist at a bank or credit union
• Three in ten (31%) say they consulted an independent mortgage broker.
• Those more likely to use an independent mortgage broker include those who put a down payment of 10% or less (36%), and those who use a different FI for their primary banking and mortgage (50%).

Additional Debt Since Purchasing Home
14
Q41. Since you bought your home, have you had to take on additional debt to cover any of the following? Select all that apply
18%
15%
13%
9%
57%
3%
Yes, to pay forrenovations/repairs
anticipated before youbought them home
Yes, to pay for furniture,decorating, etc.
Yes, to pay for renovations/repairs you didn’t realize would be necessary when you …
Yes, for reasons not relatedto buying the home (e.g., a
new car loan)
No, I have not taken on anyfurther debt
Don’t know
Findings:
• Under two in ten first-time buyers say they took on additional debt to pay for renovations they anticipated making when they purchased their home (18%), while 13% took on debt to pay for repairs or renovations they did not anticipate.
• 15% took on debt to purchase furniture or to decorate.
• Nearly six in ten (57%) have not taken on additional debt.
Net: 28%

Actions Taken in Past Year to Pay Off Mortgage Faster
15
Q48. In the past year, have you done either of the following to pay off your mortgage faster?
24%
26%
72%
69%
4%
5%
Double-up, or increasethe amount of your bi-
weekly/monthlymortgage payments
Make a larger, once ayear lump-sum payment
Yes No Don't know
Findings:
• More than a third (36%) have taken steps to pay off their mortgage faster.
• One quarter of first-time buyers say they have doubled-up on or increased their mortgage payments in the past year (24%), and a similar proportion have made a once a year lump sum payment (26%).
• Fully 14% claim to have done both.

Findings: Confidence and Financial Situation
16

Savings
17
Q43.Thinking of your financial situation over the past year, which of the following most accurately reflects your situation…?
50%
34%
9%
4%
3%
Able to pay all your bills &save some money
Managed to pay all of yourbills/savings did not grow
Had to draw on yoursavings to pay all of your
bills
Had to borrow money toget by
Don't know
Findings:
• Half (50%) of first-time buyers say that over the past year they have been able to pay their bills and save money, while one-third (34%) were able to pay their bills but did not grow their savings.
• Nine percent had to draw on their savings to pay their bills and four percent had to borrow to get by.
* For comparison only.

Financial Situation
18
Q46. Compared to this time last year, has your financial situation…
43%
47%
9%
Improved
Stayed thesame
Gottenworse
Findings:
• Just over four in ten (43%) say their financial situation has improved over the past year, while nearly half (47%) say their situation has not changed.
• Nine percent say their situation has gotten worse.
* For comparison only.

Financial Attitudes
19
Q51. For each of the following, please indicate if you strongly agree, somewhat agree, somewhat disagree or strongly disagree….
79%
73%
39%
I have a lot of confidence inmy long-term financial health
I have a long-term financialplan for retirement I am
working towards
I am concerned about makingends meet month to month
Findings:
• Eight in ten (79%) first-time buyers agree they have a lot of confidence in their long-term financial health while three-quarters (73%) agree they have a long-term financial plan for retirement they are working towards.
• Four in ten (39%) strongly (10%) or somewhat (29%) agree that they are concerned about making ends meet month to month.
* For comparison only.

Appendix – Demographic Profiles
20

Respondent Profile
21
2%
11%
3%8% 7% 8%
31%
5%
19%
7%
Vancouver Rest ofBC
Calgary Rest ofAlberta
MB/SK Toronto Rest ofOntario
Montreal Rest ofQuebec
Atlantic
Age
36%41%
23%
<30 30-34 35+
Region (weighted)
Male50%
Female50%
Gender

Respondent Profile
Country Immigrated From*
22
Birth Place
70%
10%
20%
In current province In another province In another country
New to Canada (Immigrated 2004 or later)*
English77%
French23%
Language
Yes62%
No38%
31%
21%
12%9%
7%
19%
China/Taiwan
SouthAsia
WesternEurope
OtherAsia
Africa Other
*If born in another country

Respondent Profile
Employment
23
Marital Status
81%
9%
2%
6%
1%
<0.5%
Working full-time
Working part-time
Unemployed or looking
At home full time
A student
Retired
18%
10%
25%
46%
1%
<0.5%
Single, not in a committedrelationship
Single, in a committed relationship
Living together/common-law
Married
Separated or divorced
Widowed
Household Income
Education
3%
15%
26% 25% 23%
5%2%
<$25K $25K-$49K
$50K-$74K
$75K-$99K
$100K-$149K
$150K-$199K
$200K+
10%
27%
43%
19%
<0.5%
High school or less
College/vocational/CEGEP
University
Post-graduate studies
Don’t know/not sure

Financial Services Research Division
Environics Research Group33 Bloor Street East, Suite 900
Toronto, Ontario M4W 3H1Tel: 416-920-9010Fax: 416-920-3299
Web: www.environics.ca
David MacDonald, MBA, CMRP
Group Vice President
Robert Stel, MBA, CMRP
Vice President
About Environics Research
A global company based in Canada, Environics offers a full range of quantitative and qualitative research services, as well as a unique social values methodology and unrivaled advanced analytics capabilities.
At Environics, our industry specialists work with our statisticians to ensure that clients come away from the research process with insights – not just numbers. From research design through data analysis and interpretation, we help our clients understand their environment and act on the evidence.
Kait Filer
Research Associate
Brittany Denham
Research Associate

Celebrating 20 years of helping Canadians achieve the dream of homeownership.
For more information:
1-800-511-8888 Genworth.ca Homeownership.ca
Thank you