homelessness in portland, oregon: an analysis of homeless
TRANSCRIPT

Portland State University Portland State University
PDXScholar PDXScholar
Geography Masters Research Papers Geography
5-2019
Homelessness in Portland, Oregon: An Analysis of Homelessness in Portland, Oregon: An Analysis of
Homeless Campsite Spatial Patterns and Spatial Homeless Campsite Spatial Patterns and Spatial
Relationships Relationships
Krystle N. Harrell Portland State University
Follow this and additional works at: https://pdxscholar.library.pdx.edu/geog_masterpapers
Part of the Geographic Information Sciences Commons, Physical and Environmental Geography
Commons, and the Spatial Science Commons
Let us know how access to this document benefits you.
Recommended Citation Recommended Citation Harrell, Krystle N., "Homelessness in Portland, Oregon: An Analysis of Homeless Campsite Spatial Patterns and Spatial Relationships" (2019). Geography Masters Research Papers. 24. https://pdxscholar.library.pdx.edu/geog_masterpapers/24 10.15760/geogmaster.24
This Thesis is brought to you for free and open access. It has been accepted for inclusion in Geography Masters Research Papers by an authorized administrator of PDXScholar. Please contact us if we can make this document more accessible: [email protected].

i
Homelessness in Portland, Oregon:
An Analysis of Homeless Campsite Spatial Patterns and Spatial Relationships
by
Krystle N. Harrell
A research paper submitted in partial fulfillment of the requirements for the degree of
Master of Science
in
Geography
Research Committee:
Martin Swobodzinski, Chair
David Banis
Hunter Shobe
Portland State University
2019

ii
Abstract.
Homelessness is a complex American social issue. Understanding the homeless population,
including how many people experience homelessness, how they entered the experience, their
demographics, how they survive, and where they survive, aids policymakers, planners, and
advocates in developing the appropriate approaches and solutions to end and prevent
homelessness. Analysis of homeless spatial patterns and distributions across different locales
provides a more in-depth understandings of this population and how best to support them, from
the local to national level. Using geographic information systems (GIS) and statistical methods, this
study examines the spatial patterns of homeless campsites and their relationship with urban
features including, administrative zones, transportation, and homeless support services in Portland,
Oregon. Findings indicate significant concentrations of homeless campsites across the city, as well
as significant relationships between campsites and all identified urban features. These
understandings of how and where the homeless population survive is essential in developing the
most effective means of engaging with and supporting this dynamic and varied population.

iii
Acknowledgements.
Only due to the tremendous help of my research committee, colleagues, and family was the
success of this project possible. I would like to express my sincerest and greatest appreciation to
my family, and most importantly, Yon, who listened to every idea I had, pulled me out of every
rabbit hole of information I dug myself into, and who supported me every step of the way, thank
you. I could not have done this without you. To Dr. Martin Swobodzinski, thank you for guiding me
through the twists and turns of this process and supporting me when I had no idea what I was
doing. I appreciate your differing perspectives and insights, and for believing in me. Dr. Hunter
Shobe introduced me to a whole new side of geography in which I never knew I was interested.
Thank you for opening my eyes to urban and human geography, and for always being willing to
offer advice and direction. Finally, to David Banis, who at my first mention of being interested in
understanding homelessness set me on an incredible path of exploration, challenges, and growth;
thank you. I truly appreciate your unwavering support and for always being available to help me
get off the hamster wheel of ideas upon which I normally found myself.

iv
Contents.
Abstract……………………………………………………......………………………………………………………………..………… ii
Acknowledgements……………………………………………...………………………………………………..………………..... iii
List of Figures………………………………………………...…………………………………………………...……………………. v
List of Tables……………………………………………………………………………………………………………………………. vi
Introduction…………………………………………………………………………………………………...……………………..…. 1
Review of Homeless Research Literature…………………………………………………………..………………………. 3
Defining Homelessness……………………………………………………………………………….…………..….…. 4
Characterizing the Homeless…………………………………………………………………….………..………….. 5
Counting the Homeless…………………………………………………………………………………………....……. 5
Understanding Homelessness: Causes, People, and Geography ………………………………………. 7
Federal Approaches and Social Responses…………………………………………….………………….….... 11
Study Area………………………………………………………………………………………………………………….……………. 13
Methodology……………………………………………………………………………………………………………………………. 15
Data………………………………………………………………................................................……………….…………. 15
Analysis…………………………………………………………………………………………………………..………...…. 18
Findings and Discussion………………………………………………………………………………….………..………………. 21
Conclusion………………………………………………………………………………………………………….……………………. 45
References…………………………………………………………………………………………………….……………………...…. 50
Appendices…………………………………………………………………………………………………….………...………...……. 55
A: One Point of Contact Online Report Form…………………………………….………………………......... 55
B: Methodology Workflow………………………...…………………………………….………………………......... 55

v
List of Figures
Figure 1. Study Area: Portland, Oregon………………………………………………………………...……...…..….……. 14
Figure 2. Single Week of Campsite Reports (One Point of Contact Reporting System)………….……… 22
Figure 3. Campsite Locations…………………………………………………………………………………………….……… 22
Figure 4. Campsite Kernel Density…………………………………………………………………..……...……………….... 23
Figure 5. Campsite Grid Density……………………………………………………………………...……………...……….... 24
Figure 6. Change in Campsite Totals (2017 to 2018) ………………………………….…………………...………… 25
Figure 7. ‘No Camping’ signs at Laurelhurst Park…………………………………………….……………………….... 26
Figure 8. Getis-Ord Gi* Results…………………………………………………………………………….……………………. 27
Figure 9. Local Moran’s I Results………………………………………………………………………………………….…… 28
Figure 10. Detail of Laurelhurst Park Significant Hotspot…………………….…………………………………….. 29
Figure 11. Laurelhurst Park Weekly Campsite Totals (2018) …………………………………………..……….... 30
Figure 12. Laurelhurst Park Histogram of Weekly Campsite Totals (2018) ……………...………………… 30
Figure 13. Laurelhurst Park Outlier Week (8-14 January 2018) …………………………………..……..……… 31
Figure 14. Detail of Powell Park Significant Hotspot…………………………………………………………………... 32
Figure 15. Powell Park Weekly Campsite Totals (2018) ………….……………………………………………….... 32
Figure 16. Powell Park Histogram of Weekly Campsite Totals (2018) ………………….……..……...…….... 33
Figure 17. Map of Generalized Zoning Categories………………………….…………………………………………... 34
Figure 18. MAX Stop Significant Hotspots……………………..……………………………………………...…………… 38
Figure 19. Support Service and MAX Stop Multi-Ring Buffer Analysis..……………………………………….. 39
Figure 20. Top 10 Neighborhoods (Density of Campsites) ……………………………………...………….……… 40
Figure 21. Detail of Lloyd District and Old Town/Chinatown Neighborhoods…………….…………..…… 42
Figure 22. Detail of Laurelhurst and Lents Neighborhoods………………………………………………………… 44
vi
List of Tables
Table 1. Description of Generalized Zoning Categories………………………………………………………………. 19
Table 2. Moran’s I Analysis of Campsite Distribution………………………………………….…..……………….…. 26
Table 3. Frequency Ratio Analysis of Zoning Categories……………………………………………….……………. 35
Table 4. Chi-Square Analysis of Zoning Categories………………………………………………………….…………. 36
Table 5. Proximity Analysis of Support Services…………………………………………………………………….…... 37
Table 6. Chi-Square Analysis of Support Services…………………………………………………...…………….……. 39
Table 7. Chi-Square Analysis of MAX Stops………………………………………………………………………….….…. 40
Table 8. Distribution of Campsites and Urban Features amongst Top 10 Neighborhoods………….…. 41

1
Introduction.
Homelessness is one of the most pressing social issues in America today, with the latest
national estimates indicating that more than 500,000 Americans are without adequate personal
shelter on any given night (Henry et al. 2018). Homelessness has always existed throughout
American history, with distinctive eras characterized by the ‘Hobos and Tramps’ of the 1890s
through the Great Depression and the ‘Skid Rows’ of the 1940s through 1970s. In the 1980s, just as
researchers believed homelessness was coming to an end due to the post-WWII economic boom, it
re-emerged as a strikingly important social issue. The homeless men and women formerly hidden
amongst skid rows and the inner urban core were plastered front and center on the urban
landscape; instigating an era of ‘new homelessness’ (Shlay and Rossi 1992).
The emergence of this distinctive new type of homelessness in the 1980s spurred the
production of a great deal of research on the subject, primarily stemming from sociology,
psychology, urban planning, public policy, and public health. More recently, geographers have
provided a different perspective to the discussion of homelessness; emphasizing spatial aspects of
the social phenomenon, and offering alternative conceptualizations to the prevailing notions of
homelessness as a result of individual deficits (Takahashi 1996). Rather, they base their
explanations on overarching social structures, including poverty and social exclusion. Geographers
have also highlighted the importance of local analysis in understanding how individual and social
factors, as well as, the diversity of the population, and their patterns in relation to shelters, services,
and society as a whole, differ across various geographic locations. Understanding how these factors
and patterns diverge or coincide amongst locales is useful to the wider agenda of homeless research
as we continually seek to better understand individual and structural causes, and develop
appropriate approaches to end and prevent homelessness.
Portland Homelessness.
In Portland, Oregon the state and extent of homelessness is not very different from other
major urban cities. Historically rooted in an industrial economy of logging, agriculture, and
shipbuilding, Portland has always attracted and relied on a transient workforce (Streckert 2016).
However, as the economy and job market changed after World War II (WWII), the former manual
day laborers then became the vagrant inhabitants of the Skid Row and Old Town/Chinatown areas
within the city. Eventually, as urban renewal efforts of the 1950s and 1960s displaced the homeless

2
population hidden amongst the flophouses and single-room occupancy (SRO) hotels, and
deinstitutionalization in the 1970s and 1980s introduced a whole new group to the already large
homeless population, Portland began its era of the ‘new’, visible homelessness (Streckert 2016).
This ‘new’ era of homelessness, and the difficulty of understanding and managing the
problem, is one of the most important social issues at the forefront of the minds of citizens,
policymakers, and advocates across the city (Molly Harbarger 2019). Important enough that
Portland State University, the city’s research university, established a research center dedicated
solely to helping “reduce homelessness and its negative impacts on individuals, families and
communities” (Portland State University 2019). This is not surprising, as Oregon was ranked
second, just behind California, for having the highest rate of unsheltered homeless people based on
the 2018 national Point-In-Time (PIT) count (Nigel Jaquiss 2018). These counts are integral to
understanding the extent of homelessness in a region, and are mandated by the U.S. Department of
Housing and Urban Development (HUD) in order to receive appropriate funding to support the
current population and prevent further instances of homelessness. These counts, conducted every
year for sheltered homeless and every two years for unsheltered homeless, began in 2005 and have
provided a sociospatial context of homelessness not previously available. However, this
information is usually aggregated to large geographic areas at the city, state, and national levels.
Such aggregation does not allow for in-depth analysis of homeless spatial patterns within a region,
which is crucial to understanding local variations, or similarities, which in turn inform the larger
context and understanding of homelessness.
My research aims to provide this missing in-depth analysis of homeless spatial patterns for
Portland, Oregon, by using a volunteered geographic information (VGI) dataset of homeless
campsite locations within the city. I used this data to not only explore where homeless campsites
concentrate, but also their relationship to specific urban features, including support services,
transportation, and certain administrative or geographic areas. There have been other projects
aimed at visualizing the extent of homelessness as a means of easier consumption for the wider
public, but nearly all of those rely on census tract data, or data aggregated to larger geographical
areas, as in the case of PIT counts. Conversely, my research aims to provide a more granular, sub-
neighborhood perspective of the homeless spatial patterns within the city, adding to our
understanding of homelessness within Portland, and demonstrating the value of using VGI to collect

3
local level, citizen-provided, data in the continued effort to further understand and develop
appropriate methods to support this population.
Review of Homeless Research Literature.
American homelessness is a centuries old phenomenon and as such benefits from quite a
vast collection of literature and research on the subject. Though it is not the focus of this research
to examine the full history of homelessness in America, understanding the subject through a
historical lens can offer great insight into this complex and multifaceted social issue across time
(Murphy and Tobin 2011). In this section I review the major literature contributions, which
generally reflect three major eras of homelessness in the United States: 1890s through the Great
Depression, 1940s thru 1970s, and Contemporary (since 1980). In each era, as homelessness re-
emerged as an important social issue, research consistently explored five broad categories: defining
homelessness, categorizing the population, counting the population, understanding the population
and causes leading them to this experience, and understanding the approaches aimed at solving and
preventing the problem.
Given the abundance of homeless literature, especially in the 1980s and 1990s, there are
also ample literature reviews summarizing and organizing the overwhelming amount of literature.
Two of the most comprehensive reviews, of which I rely heavily on in my understanding of the
larger context of literature, are from Shlay and Rossi (1992) and Lee, Tyler, and Wright (2010). In
their 1992 review of recent literature, Shlay and Rossi take careful stock of the extensive homeless
literature produced in the 1980s in response to the striking increase of visible homelessness across
the United States. Almost twenty years later, Lee, Tyler, and Wright ‘revisit’ the exploration of ‘new’
homelessness, the type of homelessness which took rise in the 1980s and continues today,
describing literature published since Shlay and Rossi’s significant work (Lee, Tyler, and Wright
2010). Both reviews efficiently describe and organize major research according to the five main
aforementioned themes. In the following sections, I aim to do the same, focusing on contemporary
literature and the theme of ‘understanding homelessness’, from which my research objectives are
derived.

4
Defining Homelessness.
Early definitions from the Hobo and Tramp (1890s the 1930s) and Skid Row (1940s
through 1970s) eras focused on an individual’s social attachments and position in society (Shlay
and Rossi 1992; Lee, Tyler, and Wright 2010). Many homeless individuals during these times,
primarily single males, resided in cheap hotels or lodging houses, in areas that facilitated their
ability to secure temporary or seasonal employment. They were poor, lived outside ‘normal’ family
relationships, and usually maintained only superficial social relationships; consigning them to a
lower social class and ultimately to being defined as homeless (Bahr 1973).
Since the 1980s definitions of homelessness have shifted from a focus on social attachments
to one centered on a lack of housing. More narrow definitions define the homeless as those absent
personal housing or a stable dwelling on any given night, including those on the streets or in
emergency shelters (Takahashi 1996). Broader definitions also consider those individuals and
families living in socially inadequate conditions, whether that be living ‘doubled up’ with family
members, or in some facility (jail or hospital), or even in Single Room Occupancy (SRO) hotels
(Breakey and Fischer 1990; Shlay and Rossi 1992). These newer definitions reflect changing social
values and norms of adequate living conditions given post World War II (WWII) housing
improvements (Shlay and Rossi 1992).
Even with the abundance of literature on the subject there remains great debate about
defining homelessness and it is only made more difficult by the fact that the subject and the
experience is dynamic. With contemporary research finding that for many individuals
homelessness is intermittent, recurring, and not at all dominated by the stereotypical lifelong
homeless experience, it is increasingly difficult to define and characterize the population as it
constantly changes (Blasi 1990; Shlay and Rossi 1992; Lee, Tyler, and Wright 2010). Ultimately, as
Lois M. Takahashi synthesized, changing definitions imply that homelessness be considered on a
“continuum of deprivation”, from those living unsheltered on the streets to those sheltered in
overcrowded and socially unacceptable housing conditions (Takahashi 1996, 293). The
Department of Housing and Urban Development (HUD) captures this continuum by including four
broad categories in their most recent definition of homelessness: 1) those living in a place not
meant for human habitation including those exiting an institution, 2) people at risk of losing their
primary nighttime residence within 14 days, 3) families with children or youth-headed households
with unstable housing, 4) and those fleeing or attempting to flee domestic violence (National

5
Alliance to End Homelessness 2012a). For the purposes of my research I rely on this HUD
definition of homelessness, specifically the population residing in places not meant for human
habitation, in this case, living unsheltered on the street.
Characterizing the Homeless.
Defining homelessness aids policymakers and advocates in determining who needs support,
while characterizing the homeless aids in determining how to support the identified population.
There is no shortage of research on the categorization of the homeless. Shlay and Rossi (1992)
found that in the 1980s alone there were at least 60 local and national studies regarding the
characteristics and composition of the population; providing a ‘clear demographic and social
portrait’ (Shlay and Rossi 1992, 134). Primarily, research into characteristics of the homeless focus
on gathering information regarding an individual’s age, sex, family status, race and ethnicity,
educational attainment, economic and labor market status, and personal vulnerabilities – mental,
physical, or emotional disabilities, substance abuse, etc. (Shlay and Rossi 1992).
Studies of the ‘old homeless’, the pre-1980s population, found the population to be largely
homogeneous. These populations were primarily ‘white, male, single, and beyond middle age’
(Shlay and Rossi 1992, 133; Murphy and Tobin 2014). Though women, families, and youth were
indicated as members of earlier homeless populations, they began to represent a significantly
larger portion of the ‘new homeless’ population from the 1980s on. The post-modern ‘new
homeless’ are a more diverse population. Increasing not only in the number of women, families,
and youth, but they are also younger, include higher proportions of minorities, are more educated
than earlier eras, have lower employment rates, and a higher proportion of the population lacking
even basic shelter (Rossi 1990; Shlay and Rossi 1992; Lee, Tyler, and Wright 2010; Murphy and
Tobin 2014). Characteristics that remain constant from previous eras are the high rates of extreme
poverty, high levels of mental, physical, and substance abuse issues, as well as, social isolation and a
lack of familial ties (Rossi 1990). Developing these categorizations of the homeless population
allow for a better understanding of the dynamics of homelessness, and are crucial in continued
efforts to design policies and programs aimed at alleviating the hardship of the homeless
experience (Rossi 1990; Shlay and Rossi 1992).
Counting the Homeless.
Just as contentious as the topic of defining homelessness is the task of counting the
homeless population. Establishing estimates allows policymakers, program managers, advocates,
6
and the wider public to understand the extent of the problem, as well as, track changes in the
population over time. Historically, population estimates were greatly impacted and skewed by the
broadening or narrowing of the homeless definitions applied; with the former yielding alarmingly
high totals, and the latter reporting drastically lower estimates. Further complicating the
undertaking of estimates is the fluid nature of the homeless experience, the populations' mobility,
as well as temporal considerations such as the season or time of day the survey is conducted (Burt
and Cohen 1989; Breakey and Fischer 1990; Takahashi 1996).
Though attempts were made in the 1930s to include homeless counts in the decennial
census surveys, more scientifically sound and rigorous estimate surveys took rise in the 1980s and
1990s as homelessness became a permanent urban fixture which warranted greater understanding
of the extent of the problem (Blasi 1990). Two broad methods are commonly used: indirect and
direct estimation methods. Indirect methods rely on data provided by operators of services
normally used by homeless individuals, or other key informants. Such methods are prone to
inflating estimates due to their likelihood of duplicating individuals who use multiple resources or
use a single resource multiple times; or if they include services used by underprivileged, yet
housed, individuals, such as soup kitchens, or first aid services. Conversely, such studies also run
the risk of underestimating the total population if all services used by homeless individuals are not
included in aggregate counts (Breakey and Fischer 1990).
Where indirect estimates engage service providers and key informants to determine
population estimates, direct estimate approaches employ methods in which researchers engage
with those experiencing homelessness. Direct studies in the 1980s and 1990s included street-to-
shelter ratios in which individuals actively using support services, such as soup kitchens, were
surveyed. While other methods included surveys of persons in shelters or institutions, as well as,
‘homeless appearing’ persons in public spaces or other non-dwelling spaces (Breakey and Fischer
1990). Such direct studies, including the 1990 and 2000 Census attempts at conducting a single
night street and shelter count (S-night count), are criticized and limited due to issues of defining
and identifying homeless individuals, the inability to locate and engage homeless individuals whom
avoid contact, and not having robust enough resources to cover a significantly representative local
geographic area (Breakey and Fischer 1990; Shlay and Rossi 1992; Lee, Tyler, and Wright 2010).

7
Since 2005 HUD has required that communities receiving funds per provisions of the
McKinney-Vento Homeless Assistance Grants program conduct unduplicated counts of the
sheltered (those sleeping in some form of emergency, transitional, or permanent shelter) and
unsheltered (those sleeping in places not meant for habitation, such as parks, transit terminals, or
under bridges) homeless individuals within their communities on a single night; otherwise known
as Point-In-Time (PIT) counts (National Alliance to End Homelessness 2012b). These federally
mandated, direct method, counts are conducted annually for sheltered individuals, and every other
year for unsheltered individuals; providing policymakers and advocates the most reliable local
estimates of the rate of homelessness on any given night (National Alliance to End Homelessness
2012b). These local estimates are subsequently aggregated to state and national estimates.
Despite the wide use of these estimates by policymakers, advocates, and media outlets, they are
heavily criticized for the limited definition of the homeless used, significant undercounting,
inconsistent methodologies, and for failing to represent the “transitory nature of homelessness”
(National Law Center on Homelessness & Poverty 2017, 6). Criticism notwithstanding, the
consistent collection of estimates since 2005 allows policymakers, advocates, and the wider public
to better assess how the population has changed over time, and determine the effectiveness of
implemented programs and policies.
Understanding Homelessness: Causes, People, and Geography.
There is an abundance of literature and research on a wide breadth of topics pertaining to
understanding homelessness in some capacity. For the purposes of my research, I focused on two
main themes: understanding the causes, and understanding the individuals, specifically how they
live, where they live, and why.
Understanding Causes.
Reflecting social and political perceptions of homeless individuals as “hobos” and
“vagrants”, the overarching causes of homelessness pre-1960s (except for during the Depression
Era) focused on an individual’s own culpability in the form of drinking, drugs, or immaturity
(Anderson 1961; Somerville 2013; Murphy and Tobin 2014). Conversely, from the 1960s to 1980s
(and the Depression Era) explanations of homelessness attributed the plight to mounting social
factors, including lack of living-wage-providing jobs, lack of affordable housing, and urban renewal
in numerous metropolitan areas (Robertson and Greenblatt 1992; Somerville 2013). This stark
dichotomy of structural versus individual explanations produced great debate amongst researchers

8
for an extended period; with many current social science researchers remaining on opposite ends
of the spectrum (Takahashi 1996).
Influenced by critical realist, feminist, and ecological theoretical perspectives,
contemporary researchers bridge the gap between the dichotomy of previous eras’ explanations by
adopting a more balanced causal model; one that considers the phenomenon to be a convergence of
both macro-level (structural or social) and micro-level (individual or personal) factors (Shlay and
Rossi 1992; Takahashi 1996; Neale 1997; Sommer, America, and Sommer 2001; Fitzpatrick 2005;
Toro 2007; Lee, Tyler, and Wright 2010; Nooe and Patterson 2010; Murphy and Tobin 2014). In
this type of model macro-level factors are those that put people, normally poor people, at-risk of
homelessness due to structural factors including: housing market dynamics (lack of
affordable/available housing), economic restructuring (increased low-wage and limited-benefit
service jobs), deindustrialization (fewer low-skill level and management level jobs), decreased
support to vulnerable populations (deinstitutionalization), welfare reorganization (reduced
services for low-income families), and demographic changes (more single-person and single-parent
households) (Shinn and Weitzman 1990; Shlay and Rossi 1992; Takahashi 1996; Lee, Tyler, and
Wright 2010). Micro-level factors are considered to be those individual factors, or personal
vulnerabilities, that cause members of the at-risk population to become homeless such as: negative
childhood experiences (abuse, poverty, substance use, etc.), mental disorders, disaffiliation from
social ties, loss of a significant other, domestic violence, time spent in institutions (medical or
penal), low-income, minority ethnicity, physical disability, and job insecurity (Anderson 1961; Bahr
1973; Shinn and Weitzman 1990; Lee, Tyler, and Wright 2010).
Understanding Homeless Individuals: How and Where They Survive.
It is important to understand how the homeless population live and navigate the experience
in order to enable advocates and policymakers to better support the population. Significant
contributions to this in-depth understanding have primarily come from ethnographic and
longitudinal studies (Blasi 1990). Through extended time spent with hundreds of homeless
individuals in their own environments, researchers are able to provide an “understanding of the
larger context of homelessness” (Blasi 1990, 215). Not only can we better understand the means by
which homeless individuals survive on the street, but also through in-depth interviews, we can
understand their life experiences and pathways into homelessness; further informing our
understanding of structural and individual causes (Blasi 1990; Shinn and Weitzman 1990; Snow

9
and Anderson 1993). Ethnographic and longitudinal studies have reinforced the contemporary
conceptualization of the homeless population as diverse, not only in demographics, but also in
terms of pathways into homelessness and support services required.
These findings have led to a temporal understanding of homelessness as falling into three
categories: temporary or transitional, in which individuals transition between stable housing and
for which homelessness is normally a short-term or once-in-a-lifetime crisis; episodic, in which
individuals are not able to maintain long-term stable housing and cycle in and out of homelessness
for short time periods; and chronic, for those whom homelessness is a permanent condition (Shlay
and Rossi 1992; Kuhn and Culhane 1998; Sommer, America, and Sommer 2001; Lee, Tyler, and
Wright 2010). Ethnographic studies have also yielded information regarding how homeless
individuals survive or cope with life on the streets; depicting the homeless population to be highly
adaptive, resourceful, pragmatic, and “active decision-makers” in determining how to meet their
basic needs (Snow and Anderson 1993; Lee, Tyler, and Wright 2010, 507).
Also important to better supporting the population is the development of a geography of
homelessness through the use of localized studies to understand the spatial relationship between
urban space and survival strategies of the homeless population (Shinn and Weitzman 1990; Snow
and Mulcahy 2001). Research has shown that the homeless are usually relegated to marginal space
- community space that is of little use to domiciled individuals, entrepreneurs, or politicians, and as
such, it is normally abandoned and left to the marginalized populations to inhabit (Snow and
Mulcahy 2001). During previous eras of homelessness, this marginal space was primarily found on
skid rows and the immediate area surrounding them; leading to a geographic concentration of the
homeless and their support services in the urban core of any given city. With contemporary urban
renewal efforts in metropolitan areas these homeless rest sites have been disrupted or demolished,
forcing the population to disperse throughout the area. Despite this dispersal throughout a defined
geographic area, ethnographic and census research has found that the homeless still tend to
concentrate, in a polynucleated form, near services, and in areas that are most amenable to their
survival, such as areas that offer the ability to find food, transportation, income, conduct personal
hygiene, feel safe, and feel warm (Snow and Mulcahy 2001; Schor, Artes, and Bomfim 2003; Lee and
Price-Spratlen 2004; Lee, Tyler, and Wright 2010).

10
Going beyond ethnographic and census studies, the use of statistical analysis and
geographic information systems (GIS) has yielded an increased amount of quantitative literature
describing homeless spatial patterns in global cities; reinforcing ethnographic research depictions
of the population as adaptive survivalist. Schor et al. (2003) conducted statistical analysis on a
series of indicators to identify determinants of homeless spatial distributions within the city of Sao
Paulo, Brazil. The authors concluded that the homeless population were likely to concentrate in
areas where they could find work (or any form of income), food, shelter, warmth, and safety.
Commercial areas, with their abundance of businesses and services that produce waste that can be
exchanged for income (such as recycling), the increased opportunities to acquire food directly from
businesses or patrons, and the relative vacancy of such areas later in the evening, are more likely to
meet the survival needs of the homeless (Schor, Artes, and Bomfim 2003).
In 2004, Lee and Price-Spratlen used S-Night data from 1990 and 2000 to explore the
spatial distribution of homeless populations across different geographic scales and community
contexts. The authors found that despite the initial dispersion of the homeless population in the
1980s and 1990s, as a result of skid row removal and other urban renewal efforts, homeless
populations generally tend to exhibit some form of polynucleated concentration; with increasing
populations found outside of the traditional skid rows. They also confirm that this polynucleated
concentration parallels the spatial distribution of the support service infrastructure, creating
“zones of dependence” that attract the homeless population to reside near support services (Dear
and Wolch 1987; Lee and Price-Spratlen 2004, 46).
In Japan, Wataru Suzuki used GIS to explore the spatial patterns of the Osaka homeless
population, finding that, similar to Schor et al. in 2003, the spatial distribution was closely linked to
the availability of food, health care, and employment in an area (Suzuki 2008). D. Ellen Talbo used
GIS to provide a “geographic reference and perspective” on homelessness in Buffalo, NY, by
identifying the relationship between unsheltered homeless rest sites and shelters throughout the
city (Talbo 2006, 4). Talbo highlights how the use of GIS data and “products” adds a sense of
“capacity and support” to research aimed at informing the policy-making process, allowing for the
development of data-driven solutions (Talbo 2006, 4).
The aforementioned studies on the spatial patterns of homeless populations all yielded
similar results, finding higher concentrations near support services, and purport that this
11
information is important for policymakers and advocates as they determine how best to support
the community. Given this understanding of the significant role the location of services plays in
overall homeless spatial patterns, it is also important to understand the distribution of these
services. Research has found that the placement of support services, whether it be a shelter, food
kitchen/pantry, or healthcare service, coincide with economic class boundaries, with services
normally concentrated, in low-income, high-minority neighborhoods (Takahashi 1996; Lobao and
Murray 2005). Such spatial distributions of services highlights the power of the Not In My
Backyard (NIMBY) phenomenon to exclude not only homeless individuals themselves, but also their
support systems, from certain community spaces (Takahashi 1996; Snow and Mulcahy 2001; Lee
and Price-Spratlen 2004). The power of middle-class residents to invoke legal, political, and zoning
measures to keep services out of their neighborhoods, forces the homeless and their support
services to primarily remain within the urban core, or more recently, also in rural communities
(Takahashi 1996; Lee, Tyler, and Wright 2010).
Contemporary ethnographic, longitudinal, and geographic studies into the lives of homeless
individuals have changed the way policymakers, advocates, and the general public understand this
marginalized population. Researchers have shown the predominant form of homelessness to be
more of a temporary experience rather than chronic. As well, they provide further evidence that
the homeless population is diverse and as such requires diverse support services to survive.
Geographic perspectives on homelessness have provided statistical and quantitative analysis of the
spatial patterns of the homeless population; supporting an understanding of the geography of a
mobile, and sometimes hidden, population. With such information, policymakers and advocates
can continue to develop solutions and approaches to support the dynamic homeless population.
Federal Approaches and Social Responses.
Federal approaches and social responses to homelessness have reflected the ebb and flow
of the aforementioned research themes (Murphy and Tobin 2014). During early eras when
homelessness was seen as the result of deviant and self-inflicted behavior, service responses to the
phenomenon were quite harsh; focusing on vagrancy and tramp laws that criminalized and
imprisoned members of the population (Leginski 2007). Save for services resulting from the Great
Depression and New Deal, there were not significant federal responses until the 1980s (Leginski
2007).

12
As homelessness re-emerged and became a dire social issue resulting from significant shifts
in the American economic environment, and social perceptions departed from the ‘fault of their
own doing’ perspective, federal responses shifted as well (Shlay and Rossi 1992; Lee, Tyler, and
Wright 2010; Murphy and Tobin 2014). While pre and early 1980s policies treated homelessness
as a short-term, emergency situation that could be stemmed by temporary shelter, contemporary
research depicted the homeless population as diverse and as such requiring diverse solutions (Blasi
1990). As a result, policy recommendations shifted to include a three-tier approach to providing
housing for the homeless, in the form of emergency shelter, transitional housing, and permanent
housing. As well, researchers have highlighted the need for increased social services, including job
training, adult education, substance abuse treatment programs, and food services (Shinn and
Weitzman 1990; Shlay and Rossi 1992; Lee, Tyler, and Wright 2010).
Accordingly, Federal responses have reflected this new understanding and shifted to
include more long-term and permanent strategies. The first comprehensive legislation enacted, the
McKinney-Vento Act of 1987, prominently addressed emergency homeless services, including food,
shelter, and health care; while neglecting to fully address the fundamental issues of education, jobs,
and housing (Takahashi 1996; Lee, Tyler, and Wright 2010). Nonetheless, this piece of legislation
illustrates the impact research can have on social and political change. Researchers continue to
urge for changes to long-term measures, suggesting an overall housing-first approach, development
and approval of non-conventional and self-constructed housing, alterations to zoning codes to allow
for more inhabitable space, and increased welfare benefits or less restrictive welfare eligibility
guidelines (Shlay and Rossi 1992; Takahashi 1996; Lee, Tyler, and Wright 2010; Przybylinski
2015).
The role of the geographic perspective in understanding how and where homeless people
survive is proving evermore useful considering nearly any policy or advocacy effort that relies on
funding normally requires data-driven evidence regarding the scope and extent of the homeless
problem in an area, e.g. HUD mandated PIT counts to support funding needs. The use of GIS
systems to not only track homeless rest sites, but also to map and visualize homeless spatial
patterns and distributions, as well as understand various spatial relationships, greatly aids in
developing a more comprehensive understanding of homeless geography and extent. Specifically,
VGI allows for more granular, local-level, detailed analysis and understanding of homeless spatial
patterns. In recognizing the importance of the geographic perspective to funding and supporting
13
the homeless population, this study aims to add to the understanding of the geography of
homelessness in Portland by examining the spatial patterns of homeless campsites and their
relationship to various urban features.
Study Area.
The city of Portland sits along the Columbia and Willamette Rivers in Northern Oregon. A
growing city in the Pacific Northwest, and the largest in Oregon, Portland is home to more than
650,000 people and has a land area of 133 mi2 (See Figure 1); and sits at the center of the greater
Portland-Vancouver-Hillsboro, OR-WA Metro area which extends 6,687 mi2 into seven different
counties in Oregon and Washington (U.S. Census Bureau QuickFacts 2018; Census Reporter 2019).
The city established itself as a prosperous, industrial, West Coast city in the late 1800s by making
efficient and profitable use of the Willamette and Columbia Rivers; shipping goods during the Gold
Rush, shipbuilding and distribution during the World Wars, and using the rail lines to distribute
agricultural goods throughout the region. The remnants of Portland’s industrial history are visible
through the current zoning distribution within the city. Industrial (IND) zones line the river, while
condensed Mixed Use Residential (MUR) areas spread out from the IND zones along the city’s major
arterials. As well, in line with the city’s historical expansion outward from the initial downtown
settlement on the West side of the Willamette River, the zoning majority of Single Family
Residential (SFR) expands outward from the concentration of Mixed Family Residential (MFR)
zoning downtown.
The city is divided into five sections (North, Northwest, Southwest, Southeast, Northeast)
comprised of more than 90 city-recognized neighborhoods, all with their own unique cultures,
demographics, and lifestyles (City of Portland, Oregon 2019a). North Portland, with its diverse
mixture of residential, industrial, and commercial areas, is home to the iconic St. Johns Bridge,
which spans across the Willamette and towers over the picturesque Cathedral Park. In the
Northwest and Southwest, set amongst the hills and with Forest Park as a backdrop, neighborhoods
like Forest Heights and Hillside/King Heights attract families seeking seclusion and space. Inner
Northeast Portland hosts some of the poorest and richest neighborhoods. The neighborhoods of
Irvington, Alameda, and Laurelhurst are some of the most expensive and oldest in the area; while
the historically minority dominated neighborhoods - specifically by African Americans - of Albina
and King, have undergone gentrification since the 1990s, and are now popular, culturally diverse,

14
moderately expensive neighborhoods. In the inner Southeast, the Buckman and Richmond
neighborhoods attract young Millennials, Gen-Xers, and small families with its expansive array of
breweries, restaurants, cafes, and eclectic stores. Outer Southeast and Northeast Portland are more
suburban in nature, with their abundance of space, community farming, and reasonable home
prices; attracting more and more families to its culturally diverse group of neighborhoods. These
outer East neighborhoods continue to grow as gentrification and urban renewal of Inner Portland
push low and middle-income groups outward (Portland Oregon Neighborhoods Guide n.d.).
Figure 1. Study Area – Portland, Oregon.
15
Methodology.
I aim to understand where homeless campsites tend to cluster in the city, how these
clusters are related to urban features, and identify sub-neighborhood patterns of homeless spatial
preferences. This study uses VGI collected by the City of Portland from January 2016 through
December 2018 and a combination of GIS and statistical methods to identify and analyze homeless
campsite patterns across the city through. The following sections detail the data and methods I
employed to conduct this analysis.
Data.
The primary data source used to explore homeless spatial patterns in Portland was a VGI
dataset obtained from the City of Portland’s Homelessness/Urban Camping Impact Reduction
Program (HUCIRP) (City of Portland, Oregon 2019b). VGI, a term coined by Michael Goodchild in
2007, is a relatively new, and widely applicable, geographic phenomenon that allows citizens to
provide information on various subjects in their local geographic area (Goodchild 2007). For local
governments, VGI offers a way for citizens to be both sensors of their local environments -
countering the typical top-down dissemination of information, as well as, partners in achieving the
social goals of their communities, reinforcing the idea of democratic transparency and
responsiveness to citizen concerns (Johnson and Sieber 2013). Despite the cost-effectiveness and
advantageous geographic perspective offered by VGI, the issues of quality, accuracy, and reliability
are of great concern amongst researchers(J. Flanagin and Metzger 2008; Goodchild and Li 2012;
Johnson and Sieber 2013). As well, researchers have noted that social disparities and the digital
divide may impact who is able to contribute and their motives for doing so; increasing the potential
for bias and concerns of credibility (J. Flanagin and Metzger 2008; Elwood, Goodchild, and Sui
2012).
The City of Portland began collecting volunteered reports of urban campsites in December
2015 through their One Point of Contact Campsite Reporting system, in an effort to simplify and
streamline reports submitted by community members on the matters of homelessness and urban
camping. This data provides real-time, local-level, information on homeless populations
throughout the city as compared to the Point-in-Time (PIT) counts conducted by the city/county
every two years. While the HUD mandated PIT counts provide aggregate estimates of unsheltered
and sheltered homeless individuals on a given night (traditionally in late January), the totals are

16
generalized to large geographic regions of the city; lacking crucial information about the current
and constantly changing local conditions. As Johnson and Sieber (2013) discussed, individual
community members are better suited to provide such local information as they are closer to the
issues (both in proximity and personal investment) and are able to more frequently collect data
than government officials. As well, this VGI data provides us a spatial measurement of homeless
campsite locations overtime which, given the transitory nature of the homeless experience, depicts
a more accurate reflection of where homeless individuals tend to congregate and to what extent
(Shaw 2018).
Though the VGI data allows for a more detailed illustration of local homeless campsite
patterns, it is not without limitations. This data only represents ‘reported’ campsites, and as such
does not reflect every possible homeless campsite established within the city limits. Rather, the
data represents the subset of homeless campsites that exist and were reported by community
members presumably concerned with and/or threatened by their presence (herein referred to as
‘campsites’). Accordingly, there may be gaps in the dataset for areas in which homelessness is
tolerated or where citizens do not feel empowered to report such activity. Also of note, the raw
data points are not representative of the total number of individual camps at a campsite. Due to the
design of the online and telephonic reporting systems, it was possible for reporters to submit a
single report for campsites that consisted of numerous individually occupied camps and tents. As
such, it is possible for a data point to represent one individual camp or a collection of camps. In this
study the term ‘camp’ indicates the existence of a single tent, while ‘campsite’ refers to a collection
of camps. In addition, this collection method is relatively new, only beginning in December 2015, so
the changes in total count and distribution of reported campsites may be more reflective of
increased knowledge of the reporting system, rather than actual changes in campsite densities.
Given these issues as possible factors skewing the VGI data, much of the perceived bias is
outweighed when one considers the three-year data collection timeframe, the large study area size,
and a dataset consisting of more than 50,000 total campsites(Johnson and Sieber 2013; Megler,
Banis, and Chang 2014). As well, concerns of potentially missing data due to the ‘digital divide’ are
mitigated by the fact that reports can be submitted via phone for those without internet.
The campsite dataset includes spatial information, either in the form of an intersection
description and/or exact spatial coordinates, as well as information regarding the size, duration,
occupant description, occupant behavior, and type (vehicle or tent) for a given campsite. While

17
useful in the city’s efforts to clear ‘problem’ campsites (those deemed detrimental to health and
safety of all citizens), the additional information was not relevant to my focus on campsite spatial
patterns, and as such was not explored further.
As discussed earlier, previous research indicated that homeless individuals tend to
concentrate in areas that provide access to basic needs including food, income, shelter,
socialization, and support services. To examine these factors in Portland, I used the Regional Land
Information System (RLIS) to collect the city ‘Zoning’, and ‘Transit’ GIS datasets (RLIS Live 2014).
The Zoning dataset provides zoning designation boundaries for the entire Metro area, including 47
regional zone classifications, which are also available as ten (10) consolidated generalized
categories. For the purposes of this research I used the generalized zoning categories for all
applicable analysis. As there are organizations that provide homeless individuals transit vouchers
to access the Portland Bus, MAX, and Streetcar systems, I used the ‘Light Rail’ dataset to further
explore the relationship between campsites and these transit stops. Only the MAX and Streetcar
(herein referred to only as MAX) stops were selected for analysis because the MAX lines,
particularly the Green Line, are more commonly used by homeless individuals due to inconsistent
fare checks (Thacher Schmid 2017). I excluded the Portland Bus stops from my analysis given the
requirement to produce a fare, and because the bus network extends across nearly the entire city,
and as such, any given campsite would more than likely be in close proximity to a bus stop, as the
most bus stops are generally within a ¼-mile of each other.
The final dataset used was the ‘Rose City Resource’, a digital guide to services available
throughout the metropolitan area for those experiencing homelessness and poverty (Mapping
Action Collective 2018). The list includes nearly 500 resources, in 11 general categories including,
health and wellness services, shelters, food services, and employment services. For analysis
purposes I excluded services without precise geographic information, including those with
confidential locations, phone-only services, or simply lacking geographic information. As well,
those outside the study area were eliminated, resulting in 269 total support services in the final
analysis dataset.

18
Analysis.
Similar to more recent VGI focused studies on the spatial patterns of other social
phenomena, specifically graffiti in Australia and San Francisco, I used ArcGIS 10.6 software and a
combination of statistical and GIS analysis methods to explore the spatial distribution and different
spatial relationships of homeless campsites in Portland, Oregon (Haworth, Bruce, and Iveson 2013;
Megler, Banis, and Chang 2014; ESRI 2018).
As described in the previous data section, the full dataset included 61,615 reported
campsites from December 2015 through December 2018. To trim the data down to the most
pertinent information, I excluded reports lacking spatial information, those outside the study area,
and the 43 reports from December 2015, resulting in 53,051 mapped reports. In 2016 there were
4,653 campsites; 21,055 in 2017; and 27,343 in 2018. I also separated the data by year to facilitate
the distinction of temporal changes between 2016, 2017, and 2018.
After trimming the data, I established a common areal unit, to facilitate density and
clustering calculations, by creating a grid overlay of the study area. I first used the Average Nearest
Neighbor tool to determine the minimum distance threshold I could use when designing my grid.
With an Observed Mean Distance of 36.76 feet, I made sure the grid size was no smaller than this
value; and after a few different trials created a grid with cells of 1,000 feet per side using the Create
Fishnet tool. This ensured each grid cell encompassed a small area relative to the city, at least one
city block, and allowed for the distinction of sub-neighborhood patterns.
Using the grid, I spatially joined the campsite points, deriving a density of campsites across
the city for all three years, as well as, each individual year. To further explore the campsite
densities and identify hotspots I ran the Kernel Density tool in ArcMap, at ¼-mile search radius
increments. I found the ¾-mile search radius to be the best, as it detailed more dense spots than the
1-mile increment, yet generalized the data to a better degree than the ¼-mile and ½-mile
increments. This results in a map indicating areas of relatively low or high concentrations.
To examine the relationship between campsites and different zoning areas I used the
generalized zoning categories, detailed in Table 1. I used the Spatial Join tool to determine the total
number of campsites per zoning area. I ran this tool on the full (three-year) dataset and each year
separately to explore changes over time. As well, using the totals of campsites per zoning category,

19
I calculated a frequency ratio to determine if the campsites were randomly distributed across the
zones. To calculate the frequency ratio, I determined the percent of the total study area that each
zoning category covered, and then calculated the percent of the total campsites within each zoning
category. The last step is to divide the percent of total zoning category area by the percent of total
campsites, yielding a frequency ratio. Values less than one (1) indicate there are more campsites
than expected given the total area of the zoning category.
Table 1. Generalized Zoning Categories for the City of Portland
Generalized Zone Code Description
Commercial COM
Includes central commercial (normal central business district and downtown activities), general commercial (larger retail services and goods), neighborhood commercial (neighborhood services like grocery stores), and office commercial (community establishments and services in low-rise buildings)
Industrial IND Light industrial (warehousing, distribution, and light manufacturing), heavy industrial (bottling, chemical processing, and heavy manufacturing), and business parks (light industrial and limited commercial)
Multi-Family Residential MFR Single family, townhouses, and row houses; max density of 15 to 85 units / net acre
Mixed-Use Residential MUR Mixed use commercial and residential buildings
Parks and Open Space POS Parks and Open Space
Single Family Residential SFR Single family detached housing or attached housing with lot sizes between 2,000 and 3,500 sq. ft.
To explore the proximity relationship between campsites, MAX (transit) stops, and support
services, I used the Euclidean Distance tool to determine the distance between each campsite and
either a MAX stop or support service. I used the Extract Raster Value tool to assign the raster value
from the MAX and support services Euclidean distance rasters to each campsite, representing the
distance from each respective campsite to the nearest MAX stop or support service. I could then
determine the average distance for all campsites to all support services, each individual category of
support service, and all MAX stops.
Using the grid with the spatially joined campsites, I ran the Hotspot Analysis (Getis-Ord Gi*)
tool to identify statistically significant hot or cold spots across the study area. I used the ‘Inverse
Distance’ method of spatial relationship conceptualization, so that nearby neighbors had a larger
influence than campsites farther away. I also used the Incremental Spatial Autocorrelation tool to
determine at which distance the underlying spatial processes affect the spatial clustering of the
campsites. However, this indicated that spatial autocorrelation peaked at 10,241 feet (just under
20
two miles), and as my focus was on neighborhood level analysis I chose to use the default distance
band of 1,000 feet, which corresponds to the size of the grid cells. Additionally, I used Cluster and
Outlier Analysis (Anselin Local Moran’s I) to identify spatial outliers that are not indicated by the
hotspot analysis.
Based on the Hotspot Analysis, I chose nine statistically significant locations to analyze
trends at each site. Three were sites in demographically different areas of the city: Laurelhurst
Park; a portion of the Buckman neighborhood, boxed in by SE 11th Ave., SE 12th Ave., SE Ash St.,
and SE Alder St.; and the I-205 Multi-Use Path adjacent to Lents Park. Three were transit stops
along the TriMet MAX Green Line: SE Flavel, SE 82nd Ave., and Hollywood. The final three local
sites, which exhibited inconsistent campsite occupation, were near the Moda Center, between the
building and I-5 Interstate; near the interchange of U.S. Highway 26 and I-405 to the Southwest of
downtown Portland; and, Powell Park in Southeast Portland. I analyzed campsites for 2018 that fell
within a ¼-mile buffer around each MAX stop, or fell within the specified individual polygons
representing the remaining local analysis sites. My primary aim was to explore reporting trends for
these areas so I distilled reports by week for the entire year, creating graphical representations of
these values.
For local analysis, I also spatially joined the campsites to a shapefile representing the 94
distinctive neighborhoods of Portland. I determined the neighborhoods with the highest density of
campsites (total campsites, normalized by geographic area of the neighborhood), and selected the
top 10 for further analysis. I also used the Tabulate Area tool to determine the percentage of each
zoning category within the selected neighborhoods. Finally, I spatially joined the corresponding
campsites to the zoning categories for each individual neighborhood, to understand how campsites
are distributed amongst zoning areas within each neighborhood.
The final statistical analysis used Chi-Square (X2) tests to examine if there was a significant
association between observed and expected counts of campsites based on their distance to MAX
stops and support structures, and their distribution within each zoning category. For the MAX
stops and support structures, I used the Multiple Ring Buffer tool to create quarter-mile buffer
bands from each feature, extending out to two miles. I then spatially joined the campsites to the
quarter-mile bands, determining how many campsites were in each. Of note, it is possible that in
areas where MAX stops or support services are more concentrated a campsite could appear in

21
multiple ¼-mile bands, e.g. in the ¼-mile band for support service ‘A’ and in the 1-mile band for
support service ‘B’. However, in this study, the selected multiple-ring buffer parameters allowed a
campsite to fall within and represent a value for only one ¼-mile band. I then created a bivariate
table consisting of the total number of campsites within each distance band, and using the
chisq.test() function in the R software package determined the X2 statistics for both feature sets.
For the zoning categories, I used the total campsites per zone that I calculated previously to create
the bivariate table, and again used the chisq.test() function to determine the X2 statistic.
Based on the predictive factors outlined in previous literature and the methods outlined
above, I expect to find that not only are homeless campsites concentrated in specific areas of the
city, but also that these areas of concentration indicate a significant relationship with urban
features, such as support services, transit nodes, and specific administrative and geographic zones
(Schor, Artes, and Bomfim 2003). Additionally, I expect to find a significant relationship between
homeless campsites and the zoning category of Mixed Use Residential, as it offers the best
opportunity for homeless individuals to meet their basic daily needs.
Findings and Discussion.
Overall Density and Spatial Patterns.
Figure 2 is a screen capture image illustrating one week of reported campsites, retrieved
from the City of Portland website. I used three years’ worth of this data (a total of 53,051 data
points) to examine the overall density of campsites across the study area (see Figure 3). In both
Figure 2 and Figure 3, the representation of the data in this manner is misleading. The one-week
view of data does not highlight some of the more persistent concentrations, while the three-year
illustration depicts homeless campsites as being all-encompassing and overwhelming, obscuring
some of the local and temporal patterns. Rather, by parsing and analyzing the data through
different methods we are able to see more specific concentrations, significant clusters of campsites,
temporal differences, and even start to develop an understanding of why these campsites are where
they are.

22
Figure 2. Screen capture of one week of reported campsites from One Point of Contact Reporting System.
Figure 3. Map of all reported campsites, 2016 - 2018 (n = 53,051).

23
Figure 4 shows the density for the three-year period (a), and each year separately (b,c,d).
Areas of high density, indicated by the darker spots on the maps are primarily in the Downtown,
Lloyd, Buckman, Laurelhurst, Foster-Powell, and Lents neighborhoods; painting a very different
picture than in the overall map depicting each single campsite.
Figure 4. Map of Campsite Kernel density (a) 2016 -2018 (n=53,051); (b) 2016 (n=4,653); (c) 2017 (n=21,055); (d) 2018 (n=27,343).
Figure 5 displays the density of campsites using the 1,000 ft grid. These maps also indicate
higher densities of campsites in the aforementioned neighborhoods; however, with the grid we can
see sub-neighborhood patterns. Notably, the high density associated with the Laurelhurst
neighborhood actually appears to primarily occur in one grid cell (the red one in the middle of the
map), which represents approximately one local street block; specifically, the Laurelhurst Park
Annex. The same is true for the Lents, Hollywood, and Woodland Park areas, which indicate higher

24
densities are following a linear spatial pattern in these neighborhoods. Visualizing the campsite
data this way is helpful in distilling more accurate locations of campsite densities. Rather than
relying on the kernel density, which would make it seem these neighborhoods are inundated with
campsites throughout the entire sub-area, the grid density indicates that the areas contributing to
the higher densities are actually small areas within the neighborhoods, allowing for more focused
analysis and engagement.
Figure 5. Map of Campsite Density per 1,000ft grid cell (a) 2016 -2018; (b) 2016; (c) 2017; (d) 2018.
Temporal Changes in Campsites.
I also used the grid densities to explore temporal differences between campsites in 2017
and 2018. I excluded an examination of changes between 2016 and 2017 since there were more
than four times as many total campsites in 2017 than in 2016. This is most likely due to increased
knowledge about the reporting system, and it would be inappropriate to interpret such drastic
campsite totals changes as having to do with actual increased campsites or changes in spatial

25
distribution. Figure 6 displays the result of subtracting the total campsites per grid cell for 2018
from the respective 2017 grid cell. Light purple to dark blue cells indicate a decrease in camps from
2017 to 2018, while light red to dark red cells indicate an increase in camps for the time period.
Figure 6. Change in Campsite Totals (2017 to 2018)
Most notably, the darkest blue cell represents a decrease of nearly 400 campsites reported
at Laurelhurst Park and Annex from 2017 to 2018. This large decrease may be due in part to the
posting of ‘No Camping’ signs (see Figure 7) at Laurelhurst Park, and two other Southeast Portland
parks (Sewallcrest and Midland) in July 2017. The signs were posted in response to the Laurelhurst
Neighborhood Association (LNA) demanding that the city address individuals living along and
within the park. Thirty-one (31) signs were posted in July 2017, along with increased policing of
the area, and Laurelhurst residents were reportedly “ecstatic” that campsites “dropped
tremendously” as a result (Dirk 2017; Wilson 2017).

26
Figure 7. ‘No Camping’ Signs at Laurelhurst Park (Dirk 2017).
Clustering of Campsites.
The Moran’s I index for the campsite densities indicates significant clustering. Table 2
shows the I, z, and p values for each period.
Table 2. Spatial Autocorrelation Analysis (Global Moran's I)
Time Period
Moran's Index (I) z-Score (z) p-Value (p)
2016-2018 0.3623 33.21 0
2016 0.2322 21.94 0
2017 0.2916 27.04 0
2018 0.3696 33.86 0
The Getis-Ord Gi* hotspot analysis was used to determine if any of the high-density areas
identified in the kernel density were also statistically significant. Figure 8, shows the results from
this analysis, which indicate statistically significant clustering of high values, hotspots, in the
neighborhoods previously noted as having high densities of campsites, including, Downtown, Lloyd,
Buckman, Laurelhurst, Foster-Powell, and Lents.

27
Figure 8. Map of Getis-Ord Gi*(Hot Spot Analysis), (a) 2016 -2018; (b) 2016; (c) 2017; (d) 2018.
I also used Anselin Local Moran’s I to analyze statistically significant hot spots, cold spots,
and spatial outliers. Figure 9 displays these results. For the full 3-year range, we can see clustering
of high values, the light red color, in the same Downtown, Inner-East, and Outer-East areas. What
we can see with the Local Moran’s I analysis that is not evident with the Getis-Ord Gi*, are the
clusters of low values along the edges of the city, indicating that there are significantly fewer
campsites in these areas. With the separate annual analyses, we can see differences in the High-
Low outliers, Low-High Outliers, and overall Low-Low clusters. The High-Low outliers for 2016 are
most likely due to the sparse reporting for that year, as compared to 2017 and 2018, which only
had four High-Low outliers between the two years. The appearance of the three High-Low Outliers
in the Far-Outer East in 2018 indicate new areas with a high number of reports relative to their
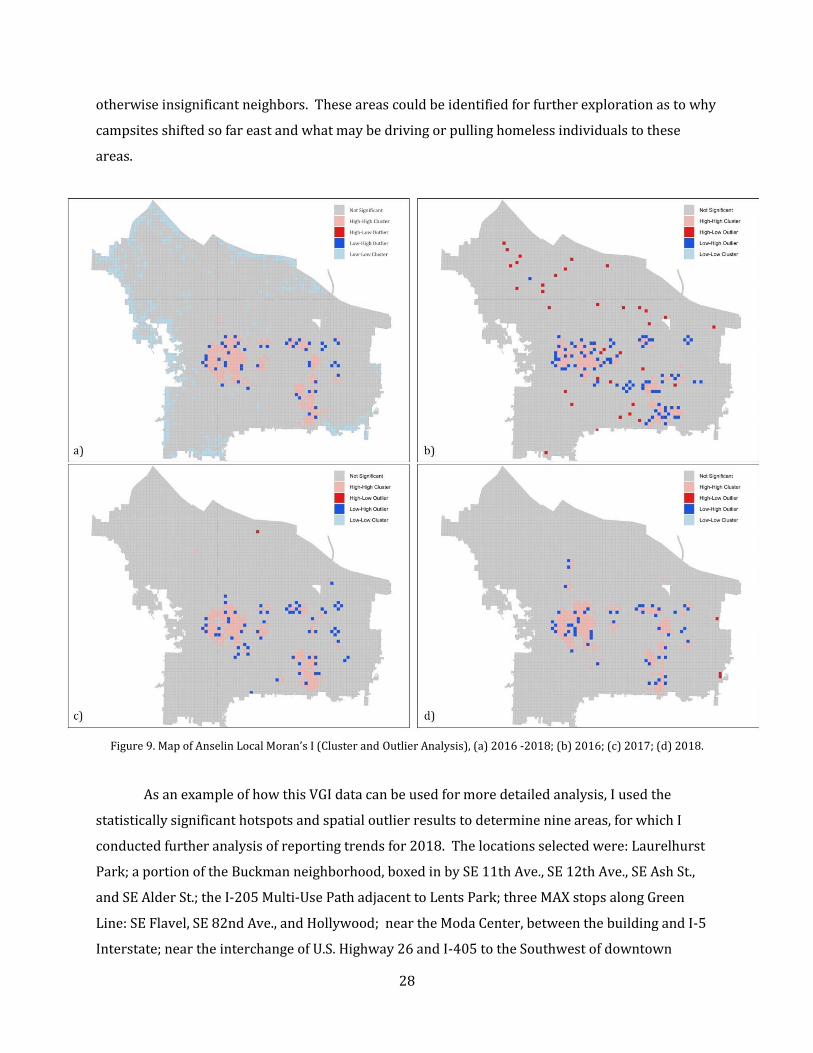
28
otherwise insignificant neighbors. These areas could be identified for further exploration as to why
campsites shifted so far east and what may be driving or pulling homeless individuals to these
areas.
Figure 9. Map of Anselin Local Moran’s I (Cluster and Outlier Analysis), (a) 2016 -2018; (b) 2016; (c) 2017; (d) 2018.
As an example of how this VGI data can be used for more detailed analysis, I used the
statistically significant hotspots and spatial outlier results to determine nine areas, for which I
conducted further analysis of reporting trends for 2018. The locations selected were: Laurelhurst
Park; a portion of the Buckman neighborhood, boxed in by SE 11th Ave., SE 12th Ave., SE Ash St.,
and SE Alder St.; the I-205 Multi-Use Path adjacent to Lents Park; three MAX stops along Green
Line: SE Flavel, SE 82nd Ave., and Hollywood; near the Moda Center, between the building and I-5
Interstate; near the interchange of U.S. Highway 26 and I-405 to the Southwest of downtown

29
Portland; and finally, Powell Park in Southeast Portland. For the sake of succinctness, I will only
describe the results from two of the sites: Laurelhurst Park and Powell Park.
Laurelhurst Park is a historically registered park located in the Laurelhurst neighborhood,
of Southeast Portland. The neighborhood has a strong association that has been quite successful in
getting the city to respond to their outcries of ‘dealing’ with the homeless in the area, specifically
around and within the park (Redden 2016; Dirk 2017; Harbarger 2017; VanderHart 2017; Wilson
2017). Given the neighborhood’s propensity to prominently, and sometimes judicially, object to
homelessness in the area it is not surprising that the analysis identified Laurelhurst Park as a
significant hotspot (Figure 10).
Figure 10. Map of Laurelhurst Park as a Significant Hot Spot (2018).

30
In 2018, there were 206 campsites reported at Laurelhurst Park; and as discussed earlier
this total represents a decrease of more than 400 reports from 2017. Figure 11 depicts the number
of reports per week for the entirety of 2018, and Figure 12 illustrates the distribution of the total
number of campsites reported each week. From the weekly reports we can see a distinctive outlier
of more than 60 reports during the second week of 2018 (8-14 January), while the histogram
indicates that except for the first two weeks of the year (1-14 January), weekly campsite totals were
never higher than 10.
Figure 11. Graph of all reported campsites at Laurelhurst Park in 2018.
Figure 12. Histogram of all reported campsites at Laurelhurst Park in 2018.
0
10
20
30
40
50
60
Nu
mb
er o
f R
epo
rted
Cam
psi
tes
Week of the Year (2018)
0
10
20
30
40
50
60
0-10 10-20 20-30 30-40 40-50 50-60 60-70
Fre
qu
ency
Number of Reported Campsites
31
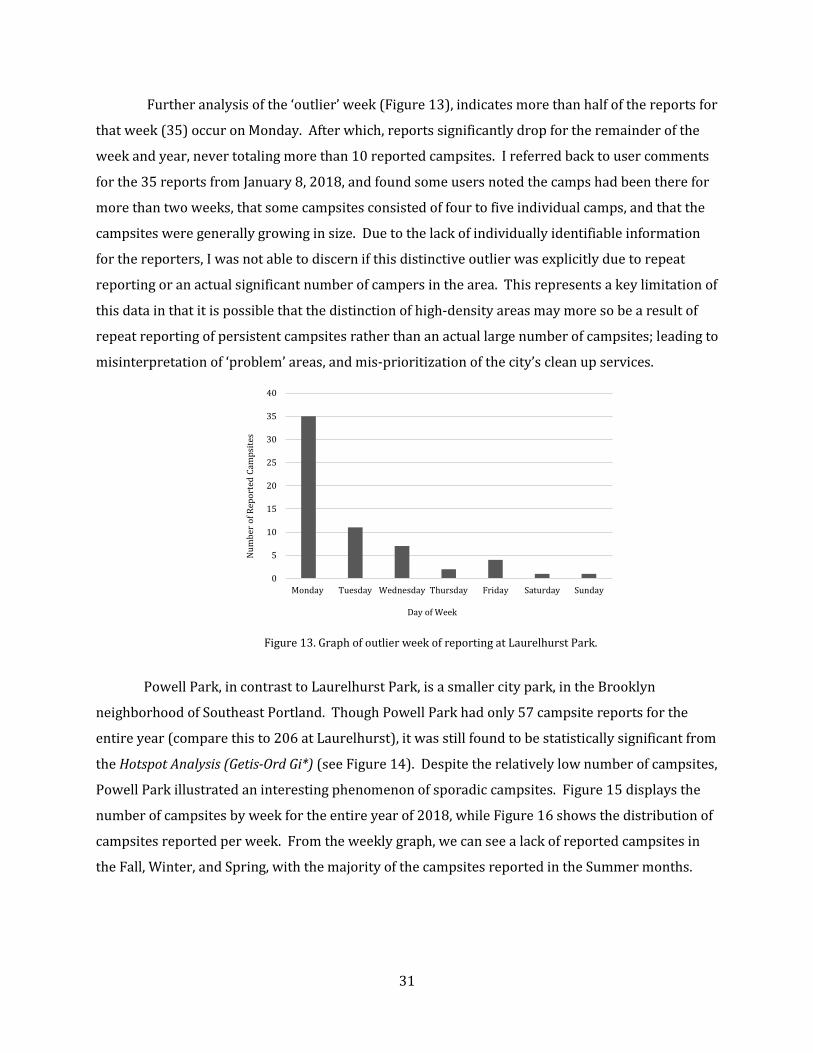
Further analysis of the ‘outlier’ week (Figure 13), indicates more than half of the reports for
that week (35) occur on Monday. After which, reports significantly drop for the remainder of the
week and year, never totaling more than 10 reported campsites. I referred back to user comments
for the 35 reports from January 8, 2018, and found some users noted the camps had been there for
more than two weeks, that some campsites consisted of four to five individual camps, and that the
campsites were generally growing in size. Due to the lack of individually identifiable information
for the reporters, I was not able to discern if this distinctive outlier was explicitly due to repeat
reporting or an actual significant number of campers in the area. This represents a key limitation of
this data in that it is possible that the distinction of high-density areas may more so be a result of
repeat reporting of persistent campsites rather than an actual large number of campsites; leading to
misinterpretation of ‘problem’ areas, and mis-prioritization of the city’s clean up services.
Figure 13. Graph of outlier week of reporting at Laurelhurst Park.
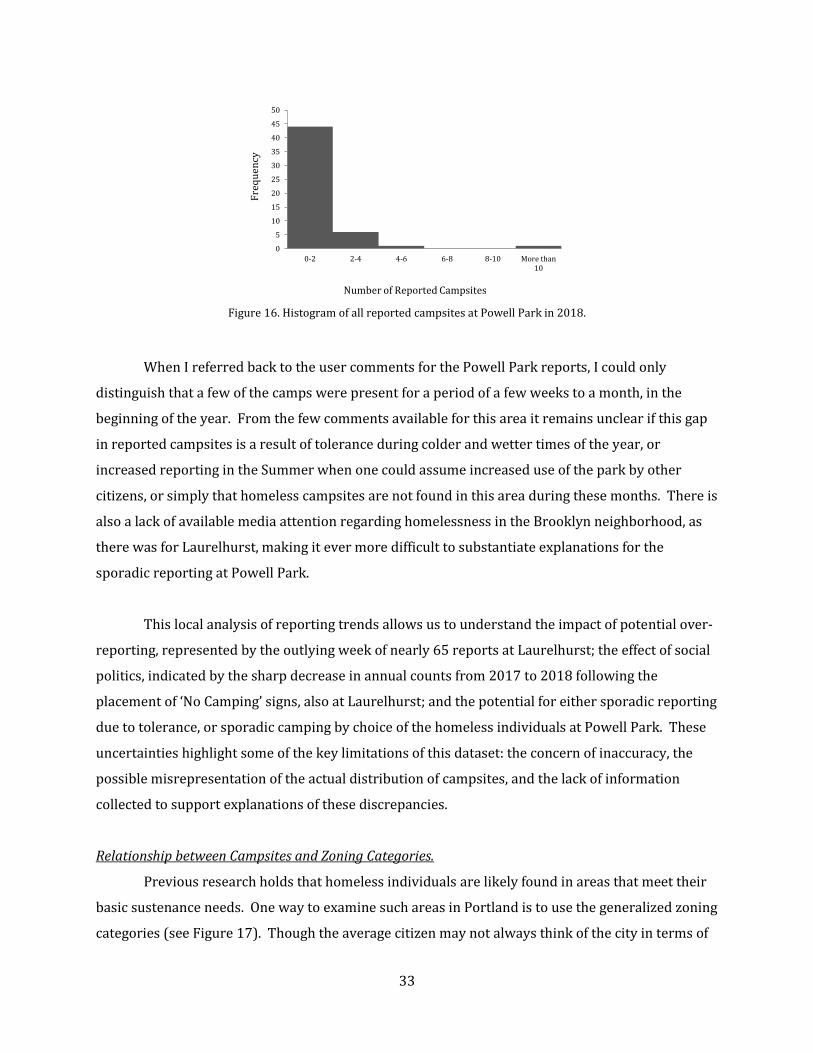
Powell Park, in contrast to Laurelhurst Park, is a smaller city park, in the Brooklyn
neighborhood of Southeast Portland. Though Powell Park had only 57 campsite reports for the
entire year (compare this to 206 at Laurelhurst), it was still found to be statistically significant from
the Hotspot Analysis (Getis-Ord Gi*) (see Figure 14). Despite the relatively low number of campsites,
Powell Park illustrated an interesting phenomenon of sporadic campsites. Figure 15 displays the
number of campsites by week for the entire year of 2018, while Figure 16 shows the distribution of
campsites reported per week. From the weekly graph, we can see a lack of reported campsites in
the Fall, Winter, and Spring, with the majority of the campsites reported in the Summer months.
0
5
10
15
20
25
30
35
40
Monday Tuesday Wednesday Thursday Friday Saturday Sunday
Nu
mb
er o
f R
epo
rted
Cam
psi
tes
Day of Week

32
Figure 14. Map of Powell Park as a Significant Hot Spot (2018).
Figure 15. Graph of all reported campsites at Powell Park in 2018.
0
2
4
6
8
10
12
14
Nu
mb
er o
f C
amp
site
s R
epo
rted
Week of the Year (2018)
33
Figure 16. Histogram of all reported campsites at Powell Park in 2018.
When I referred back to the user comments for the Powell Park reports, I could only
distinguish that a few of the camps were present for a period of a few weeks to a month, in the
beginning of the year. From the few comments available for this area it remains unclear if this gap
in reported campsites is a result of tolerance during colder and wetter times of the year, or
increased reporting in the Summer when one could assume increased use of the park by other
citizens, or simply that homeless campsites are not found in this area during these months. There is
also a lack of available media attention regarding homelessness in the Brooklyn neighborhood, as
there was for Laurelhurst, making it ever more difficult to substantiate explanations for the
sporadic reporting at Powell Park.
This local analysis of reporting trends allows us to understand the impact of potential over-
reporting, represented by the outlying week of nearly 65 reports at Laurelhurst; the effect of social
politics, indicated by the sharp decrease in annual counts from 2017 to 2018 following the
placement of ‘No Camping’ signs, also at Laurelhurst; and the potential for either sporadic reporting
due to tolerance, or sporadic camping by choice of the homeless individuals at Powell Park. These
uncertainties highlight some of the key limitations of this dataset: the concern of inaccuracy, the
possible misrepresentation of the actual distribution of campsites, and the lack of information
collected to support explanations of these discrepancies.
Relationship between Campsites and Zoning Categories.
Previous research holds that homeless individuals are likely found in areas that meet their
basic sustenance needs. One way to examine such areas in Portland is to use the generalized zoning
categories (see Figure 17). Though the average citizen may not always think of the city in terms of
0
5
10
15
20
25
30
35
40
45
50
0-2 2-4 4-6 6-8 8-10 More than10
Fre
qu
ency
Number of Reported Campsites
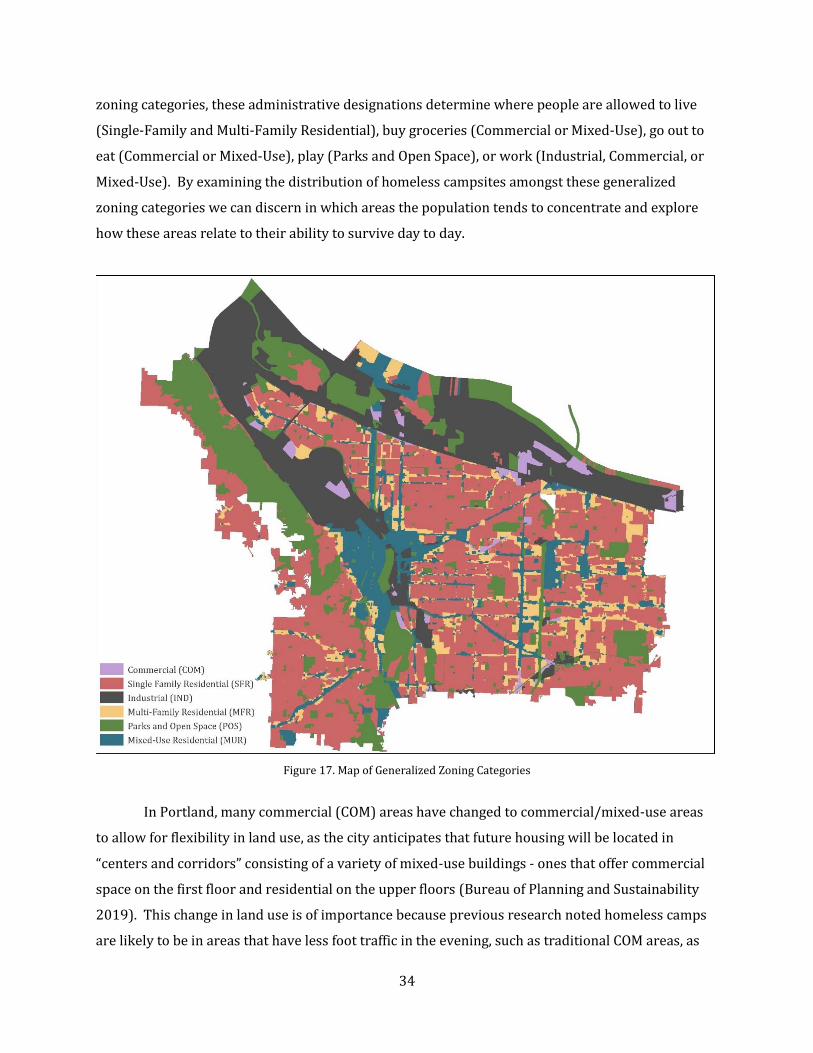
34
zoning categories, these administrative designations determine where people are allowed to live
(Single-Family and Multi-Family Residential), buy groceries (Commercial or Mixed-Use), go out to
eat (Commercial or Mixed-Use), play (Parks and Open Space), or work (Industrial, Commercial, or
Mixed-Use). By examining the distribution of homeless campsites amongst these generalized
zoning categories we can discern in which areas the population tends to concentrate and explore
how these areas relate to their ability to survive day to day.
Figure 17. Map of Generalized Zoning Categories
In Portland, many commercial (COM) areas have changed to commercial/mixed-use areas
to allow for flexibility in land use, as the city anticipates that future housing will be located in
“centers and corridors” consisting of a variety of mixed-use buildings - ones that offer commercial
space on the first floor and residential on the upper floors (Bureau of Planning and Sustainability
2019). This change in land use is of importance because previous research noted homeless camps
are likely to be in areas that have less foot traffic in the evening, such as traditional COM areas, as

35
this allows individuals to establish a campsite with less fear of being disturbed by other citizens or
authorities. However, given the limited amount of exclusively COM areas in Portland, homeless
individuals are more likely to concentrate in the MUR areas that can provide food, income, or
socialization, despite the increased number of housed citizens that reside in the same area, and this
may impede on their ability to achieve some sense of privacy or safety. As well, this larger
population of housed citizens in the previously commercial areas could potentially increase
reporting in the area; leading to misrepresentation of the actual homeless population in the area,
and skewing any understanding of temporal changes, as it would be unclear if the changes were due
to increased and repetitive reporting or actual increasing campsite totals.
To examine the relationship between campsites and the different zoning categories, I
calculated a frequency ratio to determine the distribution of campsites amongst the categories. The
results shown in Table 3 indicate that given a frequency ratio of 0.27 for MUR, there are more
campsites (36% of total campsites) in this relatively small zoning area (only 9% of the total city
area) than expected if campsites were distributed across all categories proportionately, relative to
their land area. Conversely, Single-Family Residential (SFR) zoning constitutes nearly 60% of the
city land area, yet only 12% of the total campsites are in these areas.
Table 3. Frequency Ratio of Campsites and Generalized Zoning Categories
Zoning Category Category Area
(Sq. Mi) Category Area
(% of Total Area) Campsite
Occurrence Campsite Occurrence
(% of Total Points) Frequency Ratio (area%:point%)
MUR 14.39 9.92% 19,559 36.70% 0.27
MFR 11.76 8.11% 7,807 14.65% 0.55
COM 2.62 1.81% 1,658 3.11% 0.58
POS 26.29 18.12% 9,972 18.71% 0.97
IND 29.17 20.11% 7,672 14.40% 1.40
SFR 60.83 41.93% 6,623 12.43% 3.37
MUR areas in Portland are synonymous with the main centers and corridors of an area that
‘serve as the anchors of convenient, walkable neighborhoods” (Bureau of Planning and
Sustainability 2015). In simpler terms, these areas are normally the ‘Main Street’, where you find
the majority of restaurants, local stores, and buildings with retail on the first floor and living space
above. For homeless individuals, such areas are attractive as they provide a means to procure food,
income, or a sense of safety and shelter. It is possible to acquire food either directly from
restaurants, their waste, or from people patronizing the establishments. With the amount of
recycling materials produced by retail and service businesses, as well as, by the individual

36
residences above the establishments, many homeless individuals can procure some form of income
in these areas.
Additionally, I used the Chi-Square test to statistically determine if there is a significant
association between campsites and specific zoning categories. The results are in Table 4. Given the
Null Hypothesis (H0) of equal allocation of campsites independent of zoning category, the results
specify an expected campsite count of 8,831. However, since the observed values differ from the
expected values in all zones, most notably by more than 10,000 campsites in MUR, and we have a p-
value of 2.2e-16, we can reject the H0 and confirm a significant relationship between administrative
zones and campsites. The ‘Residuals’ annotated for each Chi-Square indicates whether the
variables exhibit positive (attraction) or negative (repulsion) association, while the ‘Contribution’
values represent the percentage each zoning category contributed to the Chi-Square statistic.
Based on these results, MUR contributes more than 65% to the Chi-Square statistic, and indicates a
positive association between campsites and this zoning category; while Multi-Family Residential
(MFR) only contributes 0.66% to the statistic and exhibits negative association between campsites
and this particular zoning category.
Table 4. Chi-Square Analysis of Campsite Zoning Distribution
Zone Category COM SFR IND MFR POS MUR
Observed Campsites 1,658 6,623 7,672 7,807 9,972 19,559
Expected Campsites 8,881.83 8,881.83 8,881.83 8,881.83 8,881.83 8,881.83
Residual -76.65 -23.97 -12.84 -11.40 11.57 113.29
Contribution (%) 29.80 2.91 0.84 0.66 0.68 65.11
X2 Statistic 19,714
P-value < 2.2e-16
Degrees of freedom (df) 5
These stark differences between the distribution of campsites in each zoning category
illustrated by the frequency ratio and Chi-Squared calculations further supports the premise that
homeless camps are more likely to concentrate in areas that allow them to meet such basic needs as
food, income, shelter, and some sense of privacy. In the case of Portland, MUR areas are best suited
to meet these needs.
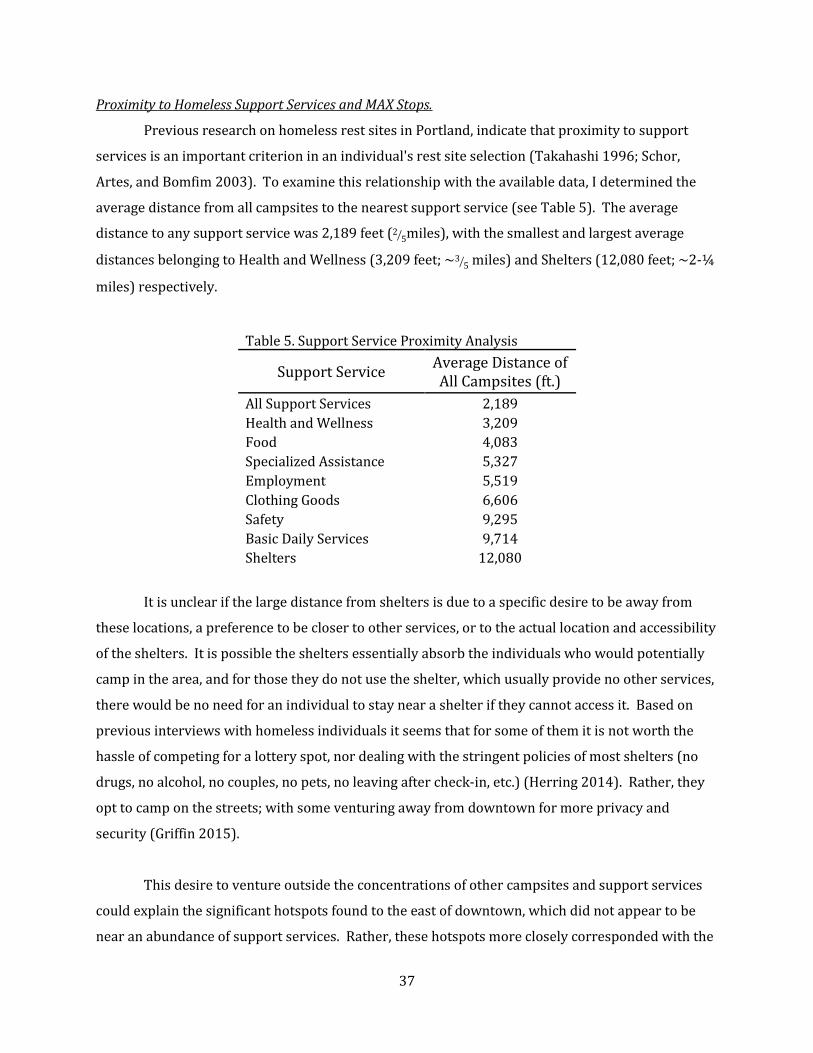
37
Proximity to Homeless Support Services and MAX Stops.
Previous research on homeless rest sites in Portland, indicate that proximity to support
services is an important criterion in an individual's rest site selection (Takahashi 1996; Schor,
Artes, and Bomfim 2003). To examine this relationship with the available data, I determined the
average distance from all campsites to the nearest support service (see Table 5). The average
distance to any support service was 2,189 feet (25⁄ miles), with the smallest and largest average
distances belonging to Health and Wellness (3,209 feet; ~35⁄ miles) and Shelters (12,080 feet; ~2-¼
miles) respectively.
Table 5. Support Service Proximity Analysis
Support Service Average Distance of All Campsites (ft.)
All Support Services 2,189
Health and Wellness 3,209
Food 4,083
Specialized Assistance 5,327
Employment 5,519
Clothing Goods 6,606
Safety 9,295
Basic Daily Services 9,714
Shelters 12,080
It is unclear if the large distance from shelters is due to a specific desire to be away from
these locations, a preference to be closer to other services, or to the actual location and accessibility
of the shelters. It is possible the shelters essentially absorb the individuals who would potentially
camp in the area, and for those they do not use the shelter, which usually provide no other services,
there would be no need for an individual to stay near a shelter if they cannot access it. Based on
previous interviews with homeless individuals it seems that for some of them it is not worth the
hassle of competing for a lottery spot, nor dealing with the stringent policies of most shelters (no
drugs, no alcohol, no couples, no pets, no leaving after check-in, etc.) (Herring 2014). Rather, they
opt to camp on the streets; with some venturing away from downtown for more privacy and
security (Griffin 2015).
This desire to venture outside the concentrations of other campsites and support services
could explain the significant hotspots found to the east of downtown, which did not appear to be
near an abundance of support services. Rather, these hotspots more closely corresponded with the

38
MAX Green line and the associated stops that would allow for relatively easy access back into the
concentration of support services downtown (Figure 18). Just as with support services, I
determined the average distance from all campsites to the nearest MAX stop. The average distance
to any stop was 2,950 feet (~ ½-miles).
Figure 18. Map of Significant MAX Hot Spots in Eastern Portland.
The findings of a relatively low average distance of campsites to MAX stops and specific
support structures indicates a type of relationship between the campsite locations and these
features. To confirm this perceived relationship statistically, I used the Chi-Square test to examine
the distribution of campsites in quarter-mile intervals, extending up to two miles, from both
support services and MAX stops. Figure 19 illustrates the multi-ring buffers extending outward
from the two datasets; and the dark to light shading indicates that the total campsites found in each
¼-mile band decrease as the distance increases.

39
Figure 19. Multi-Ring Buffers (at ¼-mile increments, up to 2 miles) for a) MAX stops and b) support services.
The Chi-Square results found in Tables 6 and 7 indicate a significant relationship between
campsite distribution, and both support services and MAX stops as evident by the significantly low
p-values for both categories. The tables also note the ‘Residual’ and ‘Contribution’ values for each
¼-mile band for both support services and MAX stops. In this case, the ¼-mile band positively
contributed the most to the Chi-Square statistic for support services and MAX stops (58.49% and
72.78%, respectively), while the ¾-mile band for both variables contributed the least (1.66% and
0.15%) to the statistics and exhibited negative association with the campsite variable; supporting
the premise that campsites are more likely to be close to support services or transit nodes that
allow easy access to those services. Furthermore, these findings are also in line with interviews of
homeless individuals who have highlighted their propensity to camp near and use the MAX stops,
specifically the Green line, due to the lack of fare checks along the route and the ability to reach
support services downtown and return to their sleep sites outside the main downtown area (Griffin
2015; Thacher Schmid 2017).
Table 6. Chi-Square Analysis of Campsite Distance to Support Services
Distance Band (Mile) 0.25 0.5 0.75 1 1.25 1.5 1.75 2
Observed Campsites 23,208 13,391 9,386 2,868 1,799 1,231 457 338
Expected Campsites 6,584.75 6,584.75 6,584.75 6,584.75 6,584.75 6,584.75 6,584.75 6,584.75
Residual 204.85 83.88 34.52 -45.80 -58.98 -65.98 -75.51 -76.98
Contribution (%) 58.49 9.80 1.66 2.92 4.85 6.07 7.95 8.26
X2 71,150
P-value < 2.2e-16
Degrees of freedom (df) 7
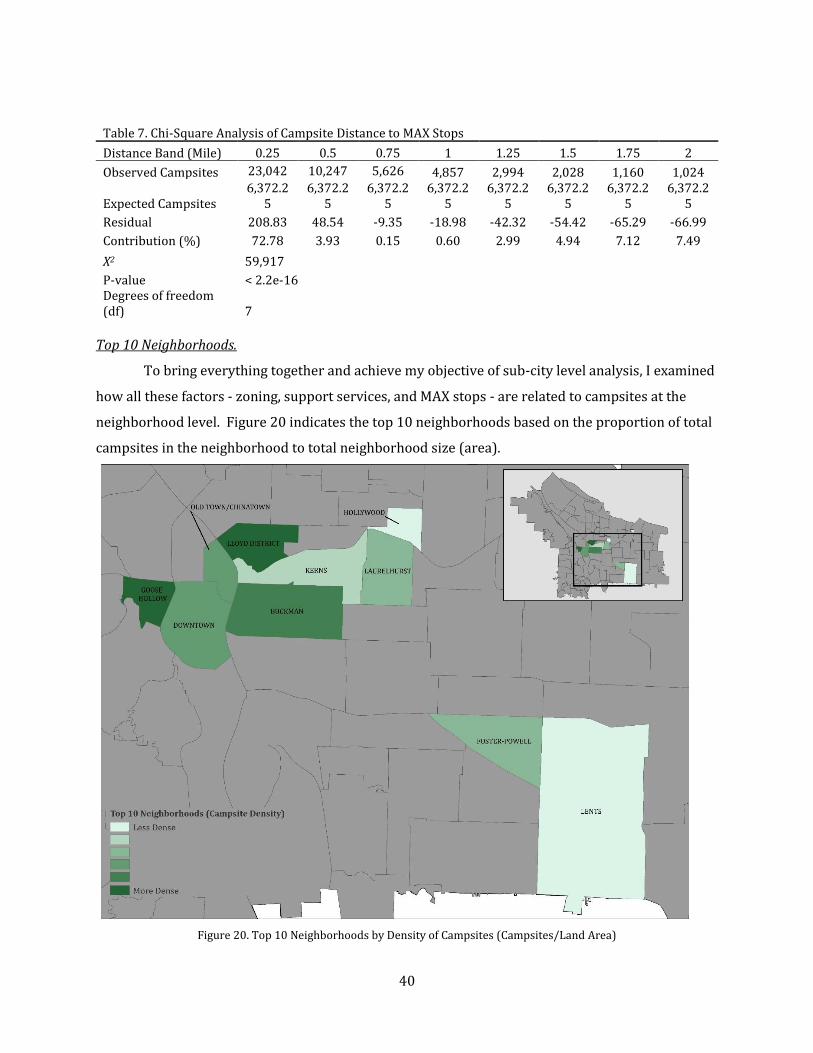
40
Table 7. Chi-Square Analysis of Campsite Distance to MAX Stops
Distance Band (Mile) 0.25 0.5 0.75 1 1.25 1.5 1.75 2
Observed Campsites 23,042 10,247 5,626 4,857 2,994 2,028 1,160 1,024
Expected Campsites 6,372.2
5 6,372.2
5 6,372.2
5 6,372.2
5 6,372.2
5 6,372.2
5 6,372.2
5 6,372.2
5
Residual 208.83 48.54 -9.35 -18.98 -42.32 -54.42 -65.29 -66.99
Contribution (%) 72.78 3.93 0.15 0.60 2.99 4.94 7.12 7.49
X2 59,917
P-value < 2.2e-16 Degrees of freedom (df) 7
Top 10 Neighborhoods.
To bring everything together and achieve my objective of sub-city level analysis, I examined
how all these factors - zoning, support services, and MAX stops - are related to campsites at the
neighborhood level. Figure 20 indicates the top 10 neighborhoods based on the proportion of total
campsites in the neighborhood to total neighborhood size (area).
Figure 20. Top 10 Neighborhoods by Density of Campsites (Campsites/Land Area)
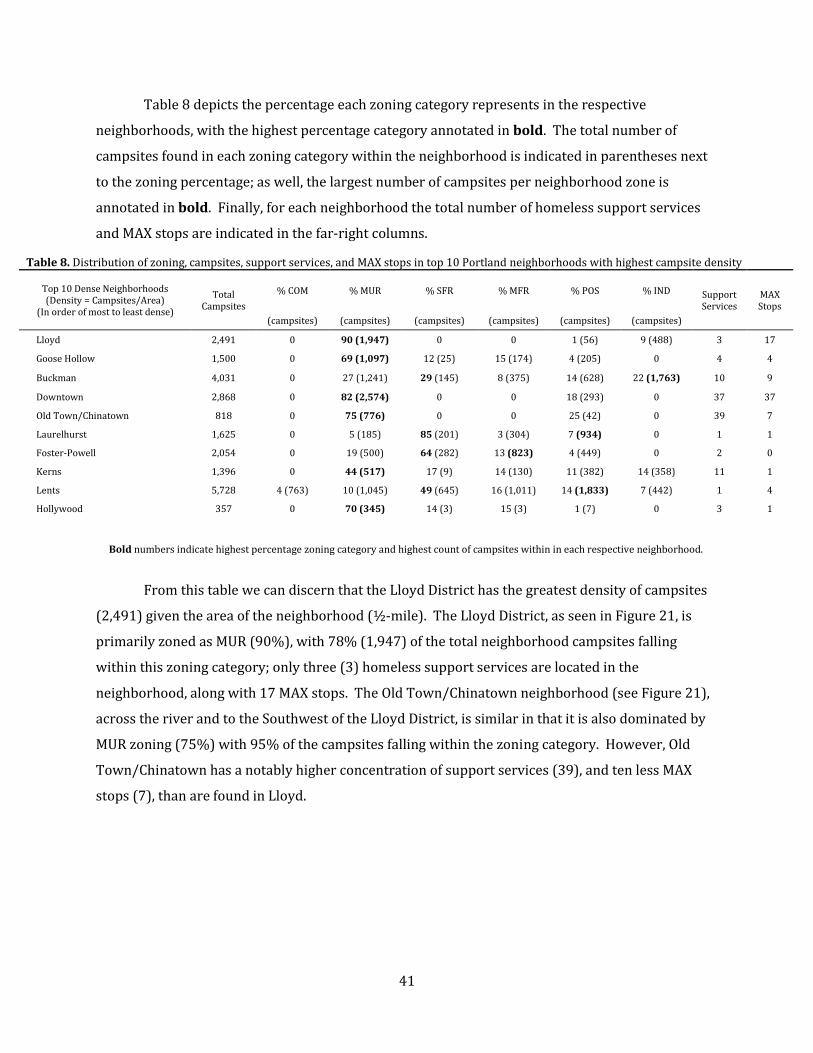
41
Table 8 depicts the percentage each zoning category represents in the respective
neighborhoods, with the highest percentage category annotated in bold. The total number of
campsites found in each zoning category within the neighborhood is indicated in parentheses next
to the zoning percentage; as well, the largest number of campsites per neighborhood zone is
annotated in bold. Finally, for each neighborhood the total number of homeless support services
and MAX stops are indicated in the far-right columns.
Table 8. Distribution of zoning, campsites, support services, and MAX stops in top 10 Portland neighborhoods with highest campsite density
Top 10 Dense Neighborhoods (Density = Campsites/Area)
(In order of most to least dense)
Total Campsites
% COM % MUR % SFR % MFR % POS % IND Support Services
MAX Stops
(campsites) (campsites) (campsites) (campsites) (campsites) (campsites)
Lloyd 2,491 0 90 (1,947) 0 0 1 (56) 9 (488) 3 17
Goose Hollow 1,500 0 69 (1,097) 12 (25) 15 (174) 4 (205) 0 4 4
Buckman 4,031 0 27 (1,241) 29 (145) 8 (375) 14 (628) 22 (1,763) 10 9
Downtown 2,868 0 82 (2,574) 0 0 18 (293) 0 37 37
Old Town/Chinatown 818 0 75 (776) 0 0 25 (42) 0 39 7
Laurelhurst 1,625 0 5 (185) 85 (201) 3 (304) 7 (934) 0 1 1
Foster-Powell 2,054 0 19 (500) 64 (282) 13 (823) 4 (449) 0 2 0
Kerns 1,396 0 44 (517) 17 (9) 14 (130) 11 (382) 14 (358) 11 1
Lents 5,728 4 (763) 10 (1,045) 49 (645) 16 (1,011) 14 (1,833) 7 (442) 1 4
Hollywood 357 0 70 (345) 14 (3) 15 (3) 1 (7) 0 3 1
Bold numbers indicate highest percentage zoning category and highest count of campsites within in each respective neighborhood.
From this table we can discern that the Lloyd District has the greatest density of campsites
(2,491) given the area of the neighborhood (½-mile). The Lloyd District, as seen in Figure 21, is
primarily zoned as MUR (90%), with 78% (1,947) of the total neighborhood campsites falling
within this zoning category; only three (3) homeless support services are located in the
neighborhood, along with 17 MAX stops. The Old Town/Chinatown neighborhood (see Figure 21),
across the river and to the Southwest of the Lloyd District, is similar in that it is also dominated by
MUR zoning (75%) with 95% of the campsites falling within the zoning category. However, Old
Town/Chinatown has a notably higher concentration of support services (39), and ten less MAX
stops (7), than are found in Lloyd.

42
Figure 21. Distribution of Campsites and Urban Features in Lloyd District and Old Town/Chinatown
Diverging from the primarily MUR neighborhoods of Lloyd and Old Town/Chinatown, the
Laurelhurst neighborhood (ranked sixth for campsite density) has the highest percentage of Single
Family Residential (SFR) zoning of all the top 10 neighborhoods, 85%; though the majority of
campsites (57%) are found in Park and Open Space (POS) zones. As well, as indicated in Figure 22
there is only one (1) MAX stop, and only one (1) support service in the neighborhood. Given the
lack of support services and MAX stops in the neighborhood, this distribution highlights a spatial
preference for areas other than Mixed-Use Residential or in close proximity to established support
services and accessible transit.
Additionally, during my personal observations of Laurelhurst park for the better part of a
year, I noticed the homeless individuals camped along the street between the main park and annex
were mostly in vehicles, with a few tents being packed away in the morning. As well, they used the
park restroom, retrieved what food they could from the gas station across the street, and had a

43
tendency to setup on the far east end of the annex street; seemingly setting themselves as far away
from the large residential homes lining the west side of the park annex. These findings on the
distribution of campsites in the neighborhood, as well as my personal observations at Laurelhurst
Park and Annex, highlight the desire of some homeless individuals to have the same sense of
seclusion and privacy many housed individuals seek in their places of rest; as well, it highlights how
adaptable and self-reliant this population can be when support services are not readily accessible.
The Lents neighborhood, Figure 22, has one of the lower densities (ranked ninth of the top
10 neighborhoods) despite having the greatest number of campsites (5,728) due to its large land
area (3.7 sq. miles). Similar to the Laurelhurst neighborhood, SFR (49%) is the largest zoning
category in Lents, with the majority of campsites (32%) also found in POS areas. However, Lents
differs in that it has one (1) support service and four (4) MAX stops. Also interesting for Lents is
that of the 5,728 campsites in the neighborhood, more than half of them (2,949, 51%) fall within a
¼-mile of the four (4) MAX stops in the neighborhood. The MAX stops also correspond with the
main POS areas within Lents, which indicates the internal distribution of campsites within Lents
can be attributed to two factors: the relative abundance of POS (14% of the neighborhood), which
provide space outside of the residential areas where tensions tend to escalate quickly between the
housed and the homeless, and the location of the MAX Green line stops, which allow for easy access
back to the main cluster of support services downtown (Griffin 2015).

44
Figure 22. Distribution of Campsites and Urban Features in a) Laurelhurst and b) Lents.
b)
a)

45
Breaking down the distribution of campsites in these high-density neighborhoods indicates
there are multiple factors at play regarding campsite spatial preference across the city. In the Lloyd
and Old Town/Chinatown neighborhoods campsite densities can be attributed to the abundance of
services supporting the population (42 between the two areas), MAX stops (24 total) that allow for
easy transition between the concentration of services in the area, and the dominance of MUR and
POS zoning which provide increased opportunity to obtain food or income, as well as places that
are normally vacated at night, allowing for safe set up of their shelters. The high campsite densities
present in the SFR dominant neighborhoods of Laurelhurst and Lents illustrate a spatial preference
for Parks and Open Spaces, which can offer some sense of seclusion and privacy, as well as a
proximity relationship with MAX stops (in the case of Lents), which allow for easy access back to
the bulk of the support services located in the city center.
These findings regarding the neighborhood level distribution of campsites, along with the
statistical findings from the frequency ratio and Chi-Squared tests indicate a significant relationship
between homeless campsite spatial patterns and the identified factors of zoning categories (land
use), proximity to support services, and proximity to certain types of transportation nodes. In the
following section, I will discuss what these findings mean within the larger context of homeless
research and the usefulness of similar data collection and analysis methods for future research.
Conclusion.
Unsheltered homelessness is a significant and visible social issue that has plagued the city of
Portland, just like many other large metropolitan areas, since the 1980s. Also since the 1980s,
geographers have called for and provided geographic perspectives on the issue down to the local
level, greatly increasing our understanding of how and where homeless populations survive day to
day. As well, spatial understandings of homeless populations are proving evermore important to
municipalities as they rely on more in-depth understandings of homelessness in order to more
effectively engage and support this community. The use of GIS in forming these spatial
understandings aids policymakers and advocates in developing data-supported decisions regarding
homeless service allocation and engagement strategies throughout their geographic areas.
In response to previous proclamations regarding the importance of and need for more local
analysis of homelessness, this study analyzed the spatial patterns and distributions of homeless

46
campsites in Portland, Oregon at the city, neighborhood, and sub-neighborhood levels (Shinn and
Weitzman 1990). At the city level, the analysis identified distinctive hotspots (large
concentrations), with the most intensive concentrations found in and adjacent to the main
downtown areas. Also identified were less intense, yet significant, concentrations to the east
including the Laurelhurst, Foster-Powell, and Lents neighborhoods. However, sub-neighborhood
analysis of these regions identified more specific areas of increased camping than was evident from
the city-level perspective; including significant camps at Laurelhurst’s namesake park, and
primarily near the MAX stops in the Far East neighborhoods.
Based on previous literature on homeless spatial patterns in other U.S. and international
cities, I also explored the relationship between campsites and three urban feature variables:
administrative zones, homeless support services, and transit nodes. I used Chi-Square tests to
examine the distribution of campsites in relation to the three variables, and found all three
exhibited significant relationships. For administrative zoning categories, the results indicated the
most significant positive relationship was between campsites and the MUR areas across the city.
The proximity relationship analysis for support services and transit nodes indicated a positive
relationship up to a ¾-mile and ½-mile distance for the respective variables. At the neighborhood
level, I used the administrative zoning categories to illustrate the distribution of camps throughout
certain high-density neighborhoods, indicating an overall prevalence of camps in the MUR portions
of these neighborhoods; mirroring the findings for the city as a whole. The neighborhood analysis
also highlighted that there is no one singular factor able to explain campsite spatial preference as
the top 10 neighborhoods for campsite density exhibited a different distribution of the variables
amongst the neighborhoods. Two of the highest density neighborhoods, though both dominated by
MUR zoning, had extremely different concentrations of support services and transit nodes: 3 and 17
respectively in Lloyd District, while Old Town/Chinatown had 39 and 7 respectively. Laurelhurst
and Lents, two of the less dense top 10 neighborhoods, are predominately zoned for SFR, have only
two support services and four transit nodes between them both, and campsites are more likely to
be found in the Parks and Open Spaces of these areas.
These findings are consistent with previous literature regarding spatial determinants of
homeless campsites in metropolitan areas. In line with research outcomes from studies in Brazil,
Japan, and Buffalo, NY, Portland homeless campsites are found to be concentrated along main
streets, in commercial areas, and forming a generally polynucleated distribution in relation to

47
support services and transit nodes. This study was able to establish a clear campsite spatial
preference for areas near support services as well as an alternate preference to be outside of these
high concentration areas for more privacy and less hassle, but still near transit nodes that allow for
easy access to these services. These understandings are helpful as policymakers and advocates
continue to determine the best way to allocate services and support this population. Though there
are benefits to geographically concentrating support services downtown and creating a service hub,
if the city were to place more services out east, near the high concentration of homeless campsites,
it could greatly alleviate the stress and risk of homeless individuals having to use the MAX lines,
without a paid fare, to reach the single main service hub downtown (Takahashi 1996).
In this study, the VGI data, while not an exhaustive representation of campsites in the city
(as it represents only the sample of campsites citizens cared to report), enabled an in-depth, and
more granular analysis of homeless spatial patterns. The data allowed us to analyze beyond what
was possible with the generalized PIT data and find significant areas in which we could dive deeper
to understand not just where people are but why they may be there. When used carefully, such VGI
data can be extremely useful in providing planners and advocates local, real-time information that
has not been otherwise captured in such a feasible or comprehensive manner. This detailed
information about the location of campsites provides a more comprehensive spatial understanding
of the unsheltered population, aiding in planning for precise engagement of individuals, planning
for effective allocation of support services, as well as, a new method of locating this transitory
population during PIT counts. I believe these benefits far outweigh concerns of reporting
inaccuracy or misleading information, as it is the responsibility of advocates and researchers to see
beyond the inaccuracies and provide a true depiction of the extent of homeless to the wider public.
By informing the public about new understandings of the extent and patterns of homelessness, they
in turn can provide more informed local information through the reporting system; inevitably
providing new data for research, engagement, and support. Additionally, the continued collection
of such data is important to understanding temporal changes to visible homelessness in the region.
Understanding where people are now and where they move over time, and why, can offer insight
into underlying factors effecting the extent and distribution of homelessness; ultimately informing
approaches to ending and preventing homelessness
Due to the nature of VGI, this data says as much about those reporting as it does about the
spatial distribution of campsites. Though the report form has improved since I began my research

48
(limiting data entry text boxes and asking more explicit questions), if the city were to collect more
uniquely identifiable, yet not personal, information in the form, we can learn more about those
reporting; such as where they reside and if it corresponds to where they are reporting, their
demographic makeup, and potentially their impetus for reporting. We can use such data to engage
these neighborhoods and communities in an effort to better understand and address their
concerns; as well as, inform them about the needs of homeless people and how, as a community,
they can embrace and support them.
Homelessness is an undeniably complicated social issue, and by using VGI and GIS to
analyze the spatial patterns of the unsheltered homeless and their relation to urban features this
study offered new insight into the geography of homelessness in Portland, Oregon, as well as
demonstrated the value of using such methods in better understanding and supporting the
homeless population. Homeless activity spaces frequently change given the nomadic nature of the
experience, and VGI data provides more geographically accurate and temporally complete
information than is possible with PIT counts. This not only allows for more in-depth understanding
of local patterns of homelessness, but also allows the local government to engage with citizens,
increase transparency, and facilitate a bottom-up approach to understanding and addressing citizen
concerns. By using GIS and statistical analysis methods to analyze homelessness in Portland we can
provide planners and advocates with data-driven understandings of where the homeless
population is, as well as strong indicators as to why they are there. In order to inform the wider
understanding of national homelessness, it is necessary to have such understandings for various
locations with major homeless populations, and as such, the analysis methods used here were
chosen so as to be easily replicated in other locales. If VGI data is not available, 3-1-1 data (non-
emergency issues reported by citizens and which most major cities maintain) is a great alternative
to still providing more detailed analysis than which is possible with PIT data. However, I urge other
locales to adopt, in any feasible form, the collection of such VGI data, as it is currently one of the
most comprehensive and accurate ways to understand the dynamic homeless population. This will
not only enable more granular analysis and understanding, but also allow municipalities to engage
with the wider community and understand their concerns through a bottom-up approach.
In conclusion, this GIS and statistical analysis of homeless spatial patterns and their relation
to specific urban features in the City of Portland, made possible by the collection of VGI data,
provided new insight into an aspect of the geography of homelessness within the region. By

49
analyzing the issue through a spatial lens, we were able to discern where homeless campsites tend
to concentrate across the city, down to a sub-neighborhood level, and further distill their proximity
relationship to support services and transportation. This knowledge enables planners and
advocates to engage with this population where they are and determine how to allocate and invest
city resources so as to best support their needs. Homeless spatial patterns should continue to be
examined quantitatively so as to explore temporal changes and social change impacts; additionally,
by including qualitative analysis, such as ethnographic or Public Participation GIS (PPGIS) studies,
we could hope to learn more, directly from those experiencing homelessness, about why they camp
where they do, and the reasoning or factors that affect their movement patterns or activity space.
Ultimately, geographic perspectives on homelessness, whether they be qualitative or quantitative,
are crucial to understanding and supporting those currently experiencing homelessness, and
understanding the pathways into homelessness so as to prevent any other individual or family from
entering the experience.

50
References.
Anderson, N. 1961. The Hobo: The Sociology of the Homeless Man. University of Chicago Press.
Bahr, H. M. 1973. Skid Row: An Introduction to Disaffiliation. Oxford University Press, Incorporated.
Blasi, G. L. 1990. Social Policy and Social Science Research on Homelessness. Journal of Social Issues 46 (4):207–219.
Breakey, W. R., and P. J. Fischer. 1990. Homelessness: The Extent of the Problem. Journal of Social Issues 46 (4):31–47.
Bureau of Planning and Sustainability. 2015. Mixed Use Zones Project: Code Concepts Report - Summary.
———. 2019. Why are commercial zones changing to commercial/mixed use? | Frequently Asked Questions (FAQs) | The City of Portland, Oregon. https://www.portlandoregon.gov/bps/article/571007 (last accessed 25 May 2019).
Burt, M. R., and B. E. Cohen. 1989. Who Is Helping the Homeless? Local, State, and Federal Responses. Publius 19 (3):111–128.
Census Reporter. 2019. Census profile: Portland-Vancouver-Hillsboro, OR-WA Metro Area. Census Reporter. http://censusreporter.org/profiles/31000US38900-portland-vancouver-hillsboro-or-wa-metro-area/ (last accessed 31 May 2019).
City of Portland, Oregon. 2019a. Community & Civic Life. https://www.portlandoregon.gov/civic/ (last accessed 25 May 2019).
———. 2019b. Homelessness Toolkit. https://www.portlandoregon.gov/toolkit/69845 (last accessed 25 May 2019).
Dear, M. J., and J. R. Wolch. 1987. Landscapes of Despair: From Deinstitutionalization to Homelessness. Princeton University Press.
Dirk, V. 2017. The City’s Now Using “No Camping” Signs to Deter Campers from Parks. Portland Mercury 30 August. https://www.portlandmercury.com/news/2017/08/30/19282812/the-citys-now-using-no-camping-signs-to-deter-campers-from-parks (last accessed 7 May 2019).
Elwood, S., M. F. Goodchild, and D. Z. Sui. 2012. Researching Volunteered Geographic Information: Spatial Data, Geographic Research, and New Social Practice. Annals of the Association of American Geographers 102 (3):571–590.
ESRI. 2018. ArcGIS Desktop. Redlands, California, USA: Environmental Systems Research Institute.
Fitzpatrick, S. 2005. Explaining Homelessness: a Critical Realist Perspective. Housing, Theory and Society 22 (1):1–17.
Goodchild, M. F. 2007. Citizens as sensors: the world of volunteered geography. Geojournal 69 (4):211–221.

51
Goodchild, M. F., and L. Li. 2012. Assuring the quality of volunteered geographic information. Spatial Statistics 1:110–120.
Griffin, A. 2015. No shelter in Portland. OregonLive.com. https://www.oregonlive.com/projects/portland-homeless/shelter.html (last accessed 25 May 2019).
Harbarger, M. 2017. Laurelhurst neighborhood asks city to ban homeless camping near parks, schools. oregonlive.com. https://www.oregonlive.com/portland/2017/07/laurelhurst_neighborhood_asks.html (last accessed 25 May 2019).
Haworth, B., E. Bruce, and K. Iveson. 2013. Spatio-temporal analysis of graffiti occurrence in an inner-city urban environment. Applied Geography 38:53–63.
Henry, M., A. Mahathey, T. Morrill, A. Robinson, A. Shivji, and R. Watt. 2018. The 2018 Annual Homeless Assessment Report (AHAR) to Congress, Part 1: Point-in-Time Estimates of Homelessness. The U.S. Department of Housing and Urban Development.
Herring, C. 2014. The New Logics of Homeless Seclusion:Homeless Encampments in America’s West Coast Cities.
J. Flanagin, A., and M. Metzger. 2008. The Credibility of Volunteered Geographic Information. GeoJournal 72:137–148.
Johnson, P. A., and R. E. Sieber. 2013. Situating the Adoption of VGI by Government. In Crowdsourcing Geographic Knowledge: Volunteered Geographic Information (VGI) in Theory and Practice, eds. D. Sui, S. Elwood, and M. Goodchild, 65–81. Dordrecht: Springer Netherlands https://doi.org/10.1007/978-94-007-4587-2_5 (last accessed 23 May 2019).
Kuhn, R., and D. P. Culhane. 1998. Applying Cluster Analysis to Test a Typology of Homelessness by Pattern of Shelter Utilization: Results from the Analysis of Administrative Data. American Journal of Community Psychology 26 (2):207–232.
Lee, B. A., and T. Price-Spratlen. 2004. The Geography of Homelessness in American Communities: Concentration or Dispersion? City and Community 3 (1):3–27.
Lee, B. A., K. A. Tyler, and J. D. Wright. 2010. The New Homelessness Revisited. Annual Review of Sociology 36 (1):501–521.
Leginski, W. 2007. Historical and Contextual Influences on the U.S. Response to Contemporary Homelessness. https://www.huduser.gov/portal/publications/homeless/p1.html (last accessed 7 June 2018).
Lobao, E. G., and A. T. Murray. 2005. Exploratory Analysis of the Homeless Shelter System in Columbus, Ohio. Geografiska Annaler: Series B, Human Geography 87 (1):61–73.
Mapping Action Collective. 2018. Rose City Resource - Northwest Open Data Exchange. https://opendata.imspdx.org/dataset/rose-city-resource (last accessed 25 May 2019).

52
Megler, V., D. Banis, and H. Chang. 2014. Spatial analysis of graffiti in San Francisco. Applied Geography 54:63–73.
Molly Harbarger. 2019. Homelessness surges to top concern among Portlanders, poll finds - oregonlive.com. 8 February. https://www.oregonlive.com/business/2019/02/homelessness-surges-to-top-concern-among-portlanders-poll-finds.html (last accessed 24 May 2019).
Murphy, J., and K. Tobin. 2011. Homelessness comes to school. Thousand Oaks, Calif: Corwin Press.
———. 2014. Homelessness in the U.S.: a historical analysis. American Educational History Journal 41 (2):267–284.
National Alliance to End Homelessness. 2012a. Changes in the HUD Definition of “Homeless.”
———. 2012b. What is a Point-in-Time Count? National Alliance to End Homelessness. https://endhomelessness.org/resource/what-is-a-point-in-time-count/ (last accessed 3 April 2019).
National Law Center on Homelessness & Poverty. 2017. Don’t Count On It: How the HUD Point-In-Time Count Underestimates the Homelessness Crisis in America.
Neale, J. 1997. Homelessness and theory reconsidered. Housing Studies 12 (1):47–61.
Nigel Jaquiss. 2018. Oregon Has Nation’s Second Highest Rate of Unsheltered Homeless People, According to New Federal Report - Willamette Week. https://www.wweek.com/news/2018/12/17/oregon-has-nations-second-highest-rate-of-unsheltered-homeless-people-according-to-new-federal-report/ (last accessed 24 May 2019).
Nooe, R. M., and D. A. Patterson. 2010. The Ecology of Homelessness. Journal of Human Behavior in the Social Environment 20 (2):105–152.
Portland Oregon Neighborhoods Guide. PDX Listed. https://www.pdxlisted.com/neighborhoods/ (last accessed 20 March 2019).
Portland State University. 2019. Portland State Homelessness Research & Action Collaborative. https://www.pdx.edu/homelessness-collaborative/ (last accessed 24 May 2019).
Przybylinski, S. 2015. The Right to Dream: Assessing the Spatiality of a Homeless Rest Site in Portland, Oregon. http://archives.pdx.edu/ds/psu/14574 (last accessed 18 April 2018).
Redden, J. 2016. Homeless swept out of Laurelhurst Park. https://joomlakave.com. https://pamplinmedia.com/pt/9-news/319788-199527-homeless-swept-out-of-laurelhurst-park (last accessed 25 May 2019).
RLIS Live. 2014. Metro. https://www.oregonmetro.gov/rlis-live (last accessed 25 May 2019).
Robertson, M. J., and M. Greenblatt eds. 1992. Homelessness: a national perspective. New York: Plenum Press.
Rossi, P. H. 1990. The old homeless and the new homelessness in historical perspective. American Psychologist 45 (8):954–959.

53
Schor, S. M., R. Artes, and V. C. Bomfim. 2003. Determinants Of Spatial Distribution Of Street People In The City Of São Paulo. Urban Affairs Review 38 (4):592–602.
Shaw, T. 2018. The Effect of Public Policy on the Spatial Distribution of Orange County’s Homeless Population: A Case Study in the Lower Santa Ana River Area.
Shinn, M., and B. C. Weitzman. 1990. Research on Homelessness: An Introduction. Journal of Social Issues 46 (4):1–11.
Shlay, A. B., and P. H. Rossi. 1992. Social Science Research and Contemporary Studies of Homelessness. Annual Review of Sociology 18 (1):129–160.
Snow, D. A., and L. Anderson. 1993. Down on Their Luck : A Study of Homeless Street People. Berkeley: University of California Press. http://stats.lib.pdx.edu/proxy.php?url=http://search.ebscohost.com/login.aspx?direct=true&db=nlebk&AN=10103&site=ehost-live (last accessed 12 April 2019).
Snow, D. A., and M. Mulcahy. 2001. Space, Politics, and the Survival Strategies of the Homeless. American Behavioral Scientist 45 (1):149–169.
Somerville, P. 2013. Understanding Homelessness. Housing, Theory and Society 30 (4):384–415.
Sommer, H., H. U. America, and H. Sommer. 2001. Homelessness in Urban America: A Review of the Literature.
Streckert, J. 2016. The Birthplace of Homelessness. Portland Mercury 16 March. https://www.portlandmercury.com/feature/2016/03/16/17757826/the-birthplace-of-homelessness (last accessed 18 March 2019).
Suzuki, W. 2008. What determines the spatial distribution of homeless people in Japan? Applied Economics Letters 15 (13):1023–1026.
Takahashi, L. M. 1996. A decade of understanding homelessness in the USA: from characterization to representation. Progress in Human Geography 20 (3):291–310.
Talbo, D. E. 2006. Homelessness in Buffalo, NY: A Qualitative and Spatial Review.
Thacher Schmid. 2017. Why Do Homeless People Ride the MAX Green Line All Day? Willamette Week 12 July. https://www.wweek.com/news/city/2017/07/12/why-do-homeless-people-ride-the-max-green-line-all-day/ (last accessed 25 May 2019).
Toro, P. A. 2007. Toward an International Understanding of Homelessness. Journal of Social Issues 63 (3):461–481.
U.S. Census Bureau QuickFacts. 2018. https://www.census.gov/quickfacts/portlandcityoregon (last accessed 20 March 2019).
VanderHart, D. 2017. Sorry, Laurelhurst. You’re Not Getting “Safe Zones” From Homelessness. Portland Mercury. https://www.portlandmercury.com/blogtown/2017/08/04/19212701/sorry-laurelhurst-youre-not-getting-safe-zones-from-homelessness (last accessed 25 May 2019).

54
Wilson, J. 2017. New signs, police patrols wipe out problem homeless camps around Laurelhurst Park. KPTV.com. https://www.kptv.com/news/new-signs-police-patrols-wipe-out-problem-homeless-camps-around/article_b0d71420-be61-5bf4-aab5-4df7846af2a5.html (last accessed 25 May 2019).

55
Appendix A: One Point of Contact Online Report Form

56

57
Appendix B: Methodology Flowchart