home visiting services account annual report, 2019
TRANSCRIPT

HOME VISITING SERVICES ACCOUNT ANNUAL REPORT, 2019
Home Visiting Services Account Annual Report, 2019
This project is funded in part, by the State of Washington, Washington Department of Children, Youth, and Families and Home Visiting Services Account through
funds provided by the US Department of Health and Human Services, Health Resources and Services Administration grant X10MC31177

HOME VISITING SERVICES ACCOUNT ANNUAL REPORT, 2019
Contents Key Findings .................................................................................................................................................. 1
Future Directions .......................................................................................................................................... 1
Introduction .................................................................................................................................................. 1
Families Served in SFY 2019 .......................................................................................................................... 2
HVSA Priority Populations ......................................................................................................................... 3
Home Visiting Program Engagement ............................................................................................................ 5
Program Referrals ..................................................................................................................................... 5
Program Enrollment & Visit Dosage ......................................................................................................... 5
Program Retention .................................................................................................................................... 6
Home Visiting Services Provided................................................................................................................... 7
HVSA Aligned Measures ............................................................................................................................ 7
Improved Maternal and Child Health ....................................................................................................... 9
Reduced Child Injuries, Abuse and Neglect ............................................................................................ 10
Improved School Readiness and Achievement ....................................................................................... 10
Reduced Crime or Domestic Violence .................................................................................................... 12
Lessons Learned and Future Direction ....................................................................................................... 12
Data Limitations .......................................................................................................................................... 13
Selected References .................................................................................................................................... 14
Appendix 1: Measure Definitions ............................................................................................................... 15
Appendix 2: HVSA Aligned Measures by Model ......................................................................................... 16
Appendix 3: HVSA Aligned Measures by DCYF Region ............................................................................... 17

1
HOME VISITING SERVICES ACCOUNT ANNUAL REPORT, 2019
Key Findings HVSA served 2,806 families with 2,791 children across 25 counties in Washington State
From the beginning of State Fiscal Year 2018 (SFY 2018) to the end of SFY 2019, performance on
specific measures was noted:
o Percent of filled funded slots increased from 72% to 83%
o Daily literacy activities significantly increased from 68% to 79%
o Intimate Partner Violence screening rate improved from 66% to 70%
Performance varied across geography and home visiting models
Visit dosage and family retention remained below model goals
60% of local implementing agencies were rewarded for reaching the 85% enrollment
performance milestone, while 38% reached the dosage performance milestones
During SFY 2018 and 2019, 36 local implementing agencies participated in Continuous Quality
Improvement projects focused on improving family engagement
Future Directions for the HVSA Support competency and confidence in screening and referral tools for depression, intimate
partner violence and child development
Deepen understanding of family engagement including what supports better engagement, what
role does workforce have on engagement and how does engagement affect family outcomes
Identify opportunities for workforce development
Introduction Home visiting is a voluntary, family-centered service offered to expectant parents and families with new
babies and young children to support the physical, social and emotional health and development of the
child. These services are an effective strategy for improving child health and development, especially in
populations with limited resources. The Home Visiting Services Account (HVSA) was established by the
legislature in 2010 (RCW 43.216.130) and is administered and led by the Department of Children, Youth
& Families (DCYF) in partnership with Thrive Washington1 and the Washington State Department of
Health (DOH).
Local implementing agencies (LIAs) have been contracting directly with DCYF (formerly Department of
Early Learning, DEL) for just over two years to provide home visiting services. LIAs are obligated to high
levels of data collection and reporting, expending significant resources to comply with these
requirements, all while providing high quality services to families. These data collection and reporting
requirements allow the HVSA to assess the services received, by whom and with what outcomes. Prior
to July 2017, the statewide HVSA partners (DCYF, Thrive Washington and DOH) engaged programs in a
process to select home visiting performance measures that reflect model efforts as well as HVSA
priorities. Starting with the federal Maternal, Infant and Early Childhood Home Visiting (MIECHV)
measures, the HVSA selected a subset of six process and two outcome measures that reflect the breadth
and depth of the home visiting work in Washington. These eight Aligned Measures, incorporated in the
state fiscal year 2018 (SFY 2018) contracts, started in July 2017 (see definitions, Appendix 1A). In the
1 Ounce Washington is listed as Thrive Washington throughout this report. The official transfer of Thrive Washington to Ounce Washington occurred on Feb. 1, 2020, following this reporting period.”
2
HOME VISITING SERVICES ACCOUNT ANNUAL REPORT, 2019
following fiscal year, SFY 2019, the HVSA initiated a new performance-based contracting effort to
improve family enrollment and home visit frequency. Financial incentives were offered to LIAs who met
specific Performance Milestones during the contract period (see definitions, Appendix 1B). This report
highlights a few successes and opportunities to focus improvement efforts going forward based on
performance in SFY 2019.
In SFY 2019 (July 1, 2018 - June 30, 2019), the HVSA administered a mix of federal and state funding
streams to support 40 LIAs, offering eight home visiting models in 25 counties. This report focuses on
the characteristics and experiences of families served. However, during the same period of the report,
LIAs engaged in training, coaching, technical assistance and evaluation and research studies. Details on
other aspects of home visiting system development and support can be found on the DCYF website.
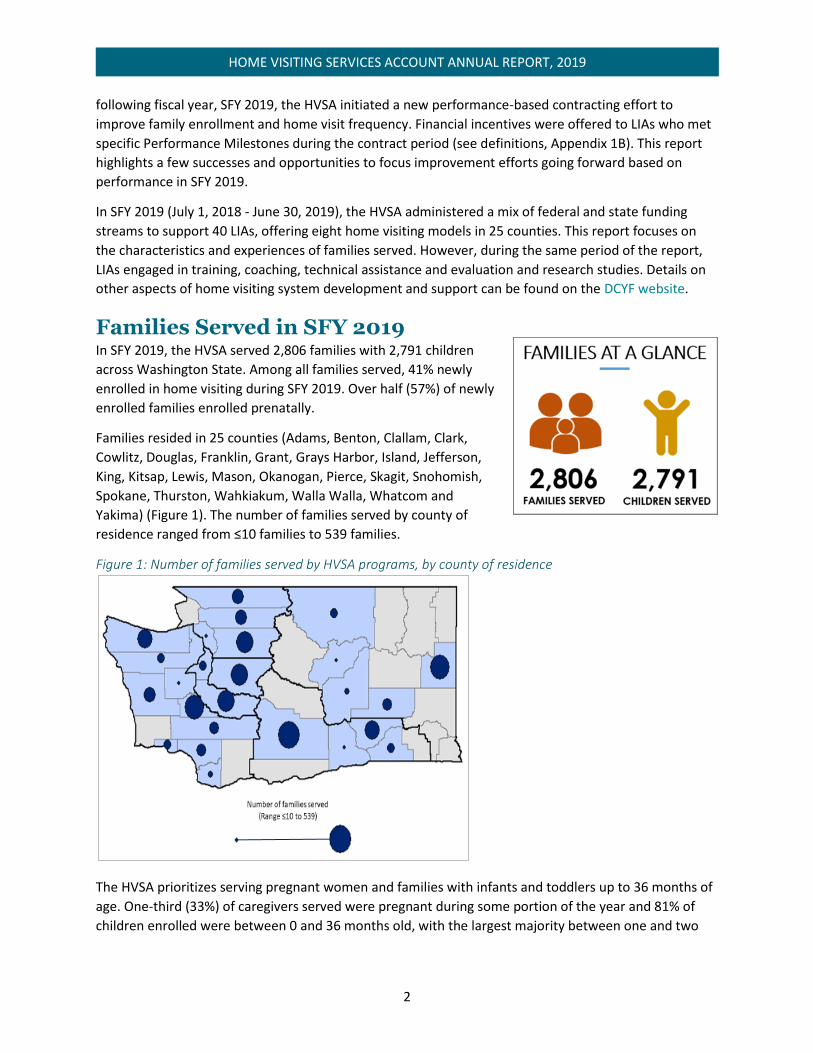
Families Served in SFY 2019 In SFY 2019, the HVSA served 2,806 families with 2,791 children
across Washington State. Among all families served, 41% newly
enrolled in home visiting during SFY 2019. Over half (57%) of newly
enrolled families enrolled prenatally.
Families resided in 25 counties (Adams, Benton, Clallam, Clark,
Cowlitz, Douglas, Franklin, Grant, Grays Harbor, Island, Jefferson,
King, Kitsap, Lewis, Mason, Okanogan, Pierce, Skagit, Snohomish,
Spokane, Thurston, Wahkiakum, Walla Walla, Whatcom and
Yakima) (Figure 1). The number of families served by county of
residence ranged from ≤10 families to 539 families.
Figure 1: Number of families served by HVSA programs, by county of residence
The HVSA prioritizes serving pregnant women and families with infants and toddlers up to 36 months of
age. One-third (33%) of caregivers served were pregnant during some portion of the year and 81% of
children enrolled were between 0 and 36 months old, with the largest majority between one and two
3
HOME VISITING SERVICES ACCOUNT ANNUAL REPORT, 2019
years of age. In total, nine out of every 10 families
included a pregnant caregiver and/or a child between
the ages of 0 to 36 months.
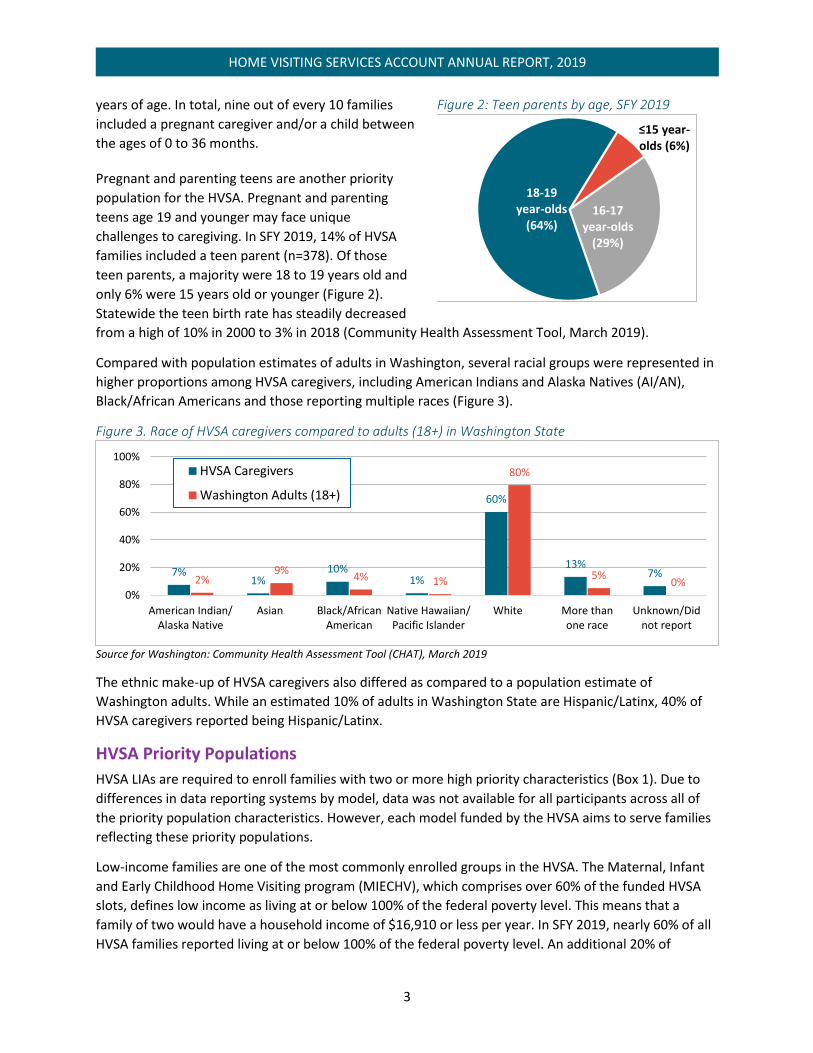
Pregnant and parenting teens are another priority
population for the HVSA. Pregnant and parenting
teens age 19 and younger may face unique
challenges to caregiving. In SFY 2019, 14% of HVSA
families included a teen parent (n=378). Of those
teen parents, a majority were 18 to 19 years old and
only 6% were 15 years old or younger (Figure 2).
Statewide the teen birth rate has steadily decreased
from a high of 10% in 2000 to 3% in 2018 (Community Health Assessment Tool, March 2019).
Compared with population estimates of adults in Washington, several racial groups were represented in
higher proportions among HVSA caregivers, including American Indians and Alaska Natives (AI/AN),
Black/African Americans and those reporting multiple races (Figure 3).
Figure 3. Race of HVSA caregivers compared to adults (18+) in Washington State
Source for Washington: Community Health Assessment Tool (CHAT), March 2019
The ethnic make-up of HVSA caregivers also differed as compared to a population estimate of
Washington adults. While an estimated 10% of adults in Washington State are Hispanic/Latinx, 40% of
HVSA caregivers reported being Hispanic/Latinx.
HVSA Priority Populations
HVSA LIAs are required to enroll families with two or more high priority characteristics (Box 1). Due to
differences in data reporting systems by model, data was not available for all participants across all of
the priority population characteristics. However, each model funded by the HVSA aims to serve families
reflecting these priority populations.
Low-income families are one of the most commonly enrolled groups in the HVSA. The Maternal, Infant
and Early Childhood Home Visiting program (MIECHV), which comprises over 60% of the funded HVSA
slots, defines low income as living at or below 100% of the federal poverty level. This means that a
family of two would have a household income of $16,910 or less per year. In SFY 2019, nearly 60% of all
HVSA families reported living at or below 100% of the federal poverty level. An additional 20% of
7%1%
10%1%
60%
13%7%
2%9%
4% 1%
80%
5%0%
0%
20%
40%
60%
80%
100%
American Indian/Alaska Native
Asian Black/AfricanAmerican
Native Hawaiian/Pacific Islander
White More thanone race
Unknown/Didnot report
HVSA Caregivers
Washington Adults (18+)
Figure 2: Teen parents by age, SFY 2019
≤15 year-olds (6%)
16-17 year-olds
(29%)
18-19 year-olds
(64%)

4
HOME VISITING SERVICES ACCOUNT ANNUAL REPORT, 2019
families were living between 100% and 200%
of the federal poverty level. Note that 1 out
of 5 families were missing data on annual
household income or number of household
members supported by their annual income.
While we continue to work with programs to
improve data collection, it remains a
challenging data point to track.
Data also suggest that at least half of HVSA
families have experienced one of the six
adverse experiences listed as an HVSA
priority (Box 1). An estimated 22% of
caregivers reported a history of or potential
current experience with IPV; 30% reported a
familial history or current experience with
substance use, including tobacco; and 39%
reported depressive symptoms per routine
screenings by the home visitors. When asked
at enrollment or during an annual update,
4% of families reported being homeless.
Because data on homelessness are collected
infrequently, this may be a conservative depiction of families’ experiences with homelessness and
housing instability.
Box 1: HVSA Priority Populations
Demographic Characteristics
American Indian/Alaskan Native Non-Hispanic
Poverty/Low Income
Teen Parents
Non-English Speaking or Recent Immigrant
Enrolled in Workfirst/TANF Adverse Experiences
Prior Child Welfare System Involvement
Intimate Partner Violence
Familial History or Current Experience with Substance Use, Including Tobacco
Parent Mental Illness
Current and Previously Incarcerated Parents
Homeless/Unstable Housing Other Characteristics
Parents with Low Educational Attainment
Parents with Disabilities
Families Currently or Formerly in The Military
Children with Disabilities, Especially Those Not
Linked with Early Intervention Services
The Jones family enrolled in Parents As Teachers (PAT) in August 2015 when their baby was 3 months old. Prior to
participating in PAT, the parents were homeless and residing at the Salvation Army. They were placed into emergency
housing following the birth of their daughter. They were referred for TANF and the PAT program. The PAT parent educator
(PE) worked with both parents supporting positive parenting, teaching about developmental stages and domains, helping
with goal setting, offering resources and referrals and generally giving support to help cope with the many stressors and
challenges of having a newborn. The PE also assisted the family with healthy communication skills as it became more and
more obvious there were difficulties in their relationship. In 2017, the mother gave birth to a second child. Around the same
time, the mother disclosed to her PE that there were multiple domestic violence incidents, as the father’s mental health
problems escalated. He kidnapped their 2-year-old daughter and took her out of state. The CPS worker was on the verge of
issuing an Amber Alert when the father made contact from the East Coast and acknowledged he had their daughter and she
was safe. Some months later, he returned to Washington and a protection order was filed immediately and CPS removed
both children from the mother. She was extremely distraught and the PE continued doing supervised PAT visits at the DSHS
office. The mother complied with all court-ordered mandates including mental health counseling and DV classes. The PE
supported her visits with her children and helped prepare her to get them back, reinforcing the importance of structure and
routines both for the mother and the children’s successful reunification. The mother repeatedly stated she and her children
could not have been successful without the help and support of their PE and the ongoing stability and predictability of the
visits. The children are on track developmentally and the mother is continuing with mental health counseling and has
integrated meditation and mindfulness exercises to deal with her stress. Please note: names and other identifiable information have been changed for the safety of families throughout this report.
5
HOME VISITING SERVICES ACCOUNT ANNUAL REPORT, 2019
Home Visiting Program Engagement
Program Referrals
Coordinated outreach and referral systems are the first steps in successful family engagement. These
community-based home visiting programs depend on a wide referral network to identify, locate and
contact families who might benefit from home visiting services.
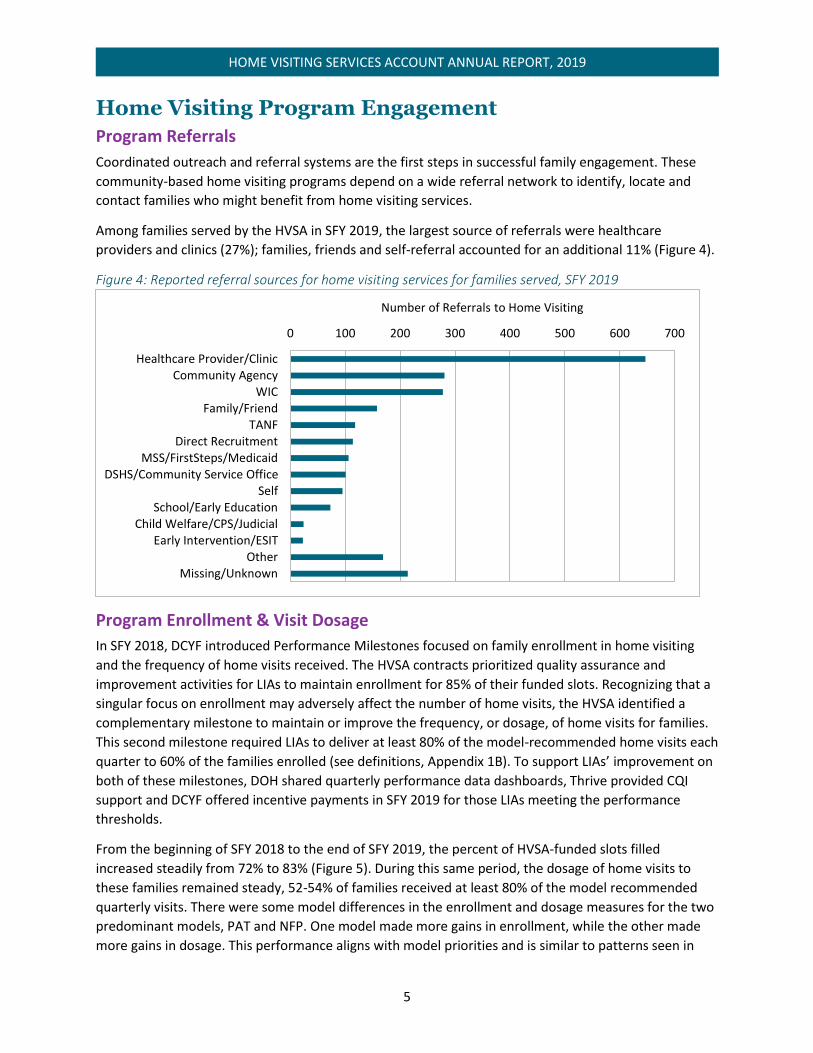
Among families served by the HVSA in SFY 2019, the largest source of referrals were healthcare
providers and clinics (27%); families, friends and self-referral accounted for an additional 11% (Figure 4).
Figure 4: Reported referral sources for home visiting services for families served, SFY 2019
Program Enrollment & Visit Dosage
In SFY 2018, DCYF introduced Performance Milestones focused on family enrollment in home visiting
and the frequency of home visits received. The HVSA contracts prioritized quality assurance and
improvement activities for LIAs to maintain enrollment for 85% of their funded slots. Recognizing that a
singular focus on enrollment may adversely affect the number of home visits, the HVSA identified a
complementary milestone to maintain or improve the frequency, or dosage, of home visits for families.
This second milestone required LIAs to deliver at least 80% of the model-recommended home visits each
quarter to 60% of the families enrolled (see definitions, Appendix 1B). To support LIAs’ improvement on
both of these milestones, DOH shared quarterly performance data dashboards, Thrive provided CQI
support and DCYF offered incentive payments in SFY 2019 for those LIAs meeting the performance
thresholds.
From the beginning of SFY 2018 to the end of SFY 2019, the percent of HVSA-funded slots filled
increased steadily from 72% to 83% (Figure 5). During this same period, the dosage of home visits to
these families remained steady, 52-54% of families received at least 80% of the model recommended
quarterly visits. There were some model differences in the enrollment and dosage measures for the two
predominant models, PAT and NFP. One model made more gains in enrollment, while the other made
more gains in dosage. This performance aligns with model priorities and is similar to patterns seen in
0 100 200 300 400 500 600 700
Healthcare Provider/ClinicCommunity Agency
WICFamily/Friend
TANFDirect Recruitment
MSS/FirstSteps/MedicaidDSHS/Community Service Office
SelfSchool/Early Education
Child Welfare/CPS/JudicialEarly Intervention/ESIT
OtherMissing/Unknown
Number of Referrals to Home Visiting

6
HOME VISITING SERVICES ACCOUNT ANNUAL REPORT, 2019
other states. At this time, DOH has not done further analysis to examine reasons for these differences.
Similarly, the additional models supported by the HVSA typically performed stronger in one measure or
the other.
Figure 5: HVSA performance on family enrollment and visit dosage by quarter, SFY 2018-2019
A review of the Performance Milestones achievements in SFY 2019, found that 27 LIAs earned at least
one performance payment during the year, while four LIAs met each Milestone every quarter (see
definitions, Appendix 1B). Overall, 22 (60%) LIAs successfully
reached 85% enrollment in one or more quarters and 14 (38%)
LIAs reached 80% dosage for 60% of their families in one or more
quarters.
To promote program improvement and achievement of the
Performance Milestones, the HVSA simultaneously launched
Continuous Quality Improvement (CQI) projects with LIAs to test
rapid improvements. LIAs engaged in two annual CQI projects, completed in six-month cycles. LIAs had
the opportunity to select from a menu of topics, yet over the two contract years, SFY 2018 and SFY
2019, all 36 participating HVSA LIAs focused at least one CQI project on some aspect of family
engagement – including enrollment, dosage, retention and reducing missed visits.
Applying CQI methods of small-scale, iterative tests of change, home visiting programs tested new
strategies to improve family engagement related to communication, recruitment, incentives, scheduling
visits and Group Connections (PAT). Of those programs that focused on increasing or maintaining
enrollment, CQI appears to have had a positive impact on these efforts. As discussed above, overall
rates for dosage remained relatively stagnant, despite the CQI focus. However, some individual
programs who focused CQI on dosage and visit frequency did experience positive change.
Program Retention
In SFY 2019, the HVSA added a new Performance Milestone – Family Retention, or how long a family
remains in a home visiting program. For most of the models supported by the HVSA, typical
programming provides two years of education and support, with extensions dependent on additional
0%
10%
20%
30%
40%
50%
60%
70%
80%
90%
100%
Jul-Sep17 Oct-Dec17 Jan-Mar18 Apr-Jun18 Jul-Sep18 Oct-Dec18 Jan-Mar19 Apr-Jun19
SFY 2018 SFY 2019
Enrollment Performance Enrollment Goal
Dosage Performance Dosage Goal
SFY 2019 LIA Performance
Milestones
Enrollment: 22 LIAs
Dosage: 14 LIAs

7
HOME VISITING SERVICES ACCOUNT ANNUAL REPORT, 2019
births or ongoing family needs. Together with dosage and content of services, family retention is a
necessary component of program implementation (Anne et al., 2018). Dosage and retention measure
the “quantity” of home visiting. Whether this “quantity” is associated with family outcomes is a question
for further research. During SFY 2019, 1,139 families exited from home visiting services. A third of the
exited families remained enrolled for 24 months or more, half reached 12 months of enrollment and
15% exited prior to reaching three months (Figure 6). At the time of exit, families were asked why they
were leaving the program. Nearly one-third of exiting families graduated from the program, aged-out of
services, reported returning to school or starting a job or reported receiving services elsewhere.
However, 1 in 5 families was lost to follow-up, highlighting the barriers and competing demands for
populations eligible for home visiting.
Figure 6: Family retention among SFY 2019 exits
Family retention is a priority for CQI, as well as performance awards. In SFY 2020 all LIAs will engage in a
year-long CQI Learning Collaborative project, focused on either Caregiver Depression or Family
Retention. Family Retention was identified as a key component of family engagement and an area with
room for improvement and learning. As reflected in the data related to exit reasons, a family’s decision
to remain or disengage in home visiting services is nuanced and not always positive or negative.
Sustained engagement in home visiting services is dependent on a number of factors, including family
circumstances and commitments, the relationship between the family and home visitor, home visiting
staff transitions and more generally how home visiting is able to meet family needs. In SFY 2020, 24
HVSA programs have chosen to participate in the Family Retention CQI Learning Collaborative.
Home Visiting Services Provided
HVSA Aligned Measures
HVSA Aligned Measures include eight performance indicators that all HVSA programs collect and report
on for participating caregivers and children (Box 2). These eight measures cover four domains that
encompass the children’s and caregivers’ health, well-being and development. Most of the HVSA
Aligned measures are process measures, with just two outcome measures, Breastfeeding and Child
Maltreatment. A process measure articulates whether or how much an activity happened, whereas an
outcome measure is how well did something happen. Some measures are assessed once per child or

8
HOME VISITING SERVICES ACCOUNT ANNUAL REPORT, 2019
caregiver (e.g., IPV screening) while others
are tracked annually (e.g., parent-child
interaction). See Appendix 1 for measure
definitions.
The Aligned Measures have been generally
stable over the past two years although
some differences were observed (Figure 7).
Differences were noted across home visiting
models, possibly reflecting the differences in
how data are collected or the model-specific
priorities (Appendix 2) and across
geographies (Appendix 3). For example, a
greater proportion of NFP clients completed
developmental screenings and well-child
visits compared to other models, while more
PAT clients reported daily literacy activities.
Given that SFY 2019 was only the second
year using this performance measurement
framework, there is work being done to
support programs to meet these
requirements including individual technical
assistance and data dashboards to monitor progress.
Figure 7: Statewide performance on eight HVSA Aligned Measures, SFY 2018 and 2019
Box 2: HVSA Aligned Measures
Domain 1. Improved Maternal and Newborn Health
Continued Breastfeeding at 6 months of age
Routine Well Child Visits completed on time
Depression Screening completed for caregivers
Domain 2. Reduced Child Injuries, Abuse and Neglect
Investigated case of Child Maltreatment
initiated
Domain 3. Improved School Readiness and Achievement
Observation of Parent-Child Interaction
completed
Child receives Daily Literacy Activities from
family member
Child Developmental Screenings completed on
time
Domain 4. Reduced Crime or Domestic Violence
Intimate Partner Violence (IPV) Screening
completed for caregivers
57%
72%
74%
53%
68%
63%
66%
53%
70%
74%
3%
47%
79%
61%
70%
0% 10% 20% 30% 40% 50% 60% 70% 80% 90% 100%
Breastfeeding
Well Child Visits
Depression Screening
Child Maltreatment
Parent Child Interaction
Daily Literacy Activities
Developmental Screening
Intimate Partner Screening
SFY 2018 SFY 2019
9
HOME VISITING SERVICES ACCOUNT ANNUAL REPORT, 2019
Improved Maternal and Child Health
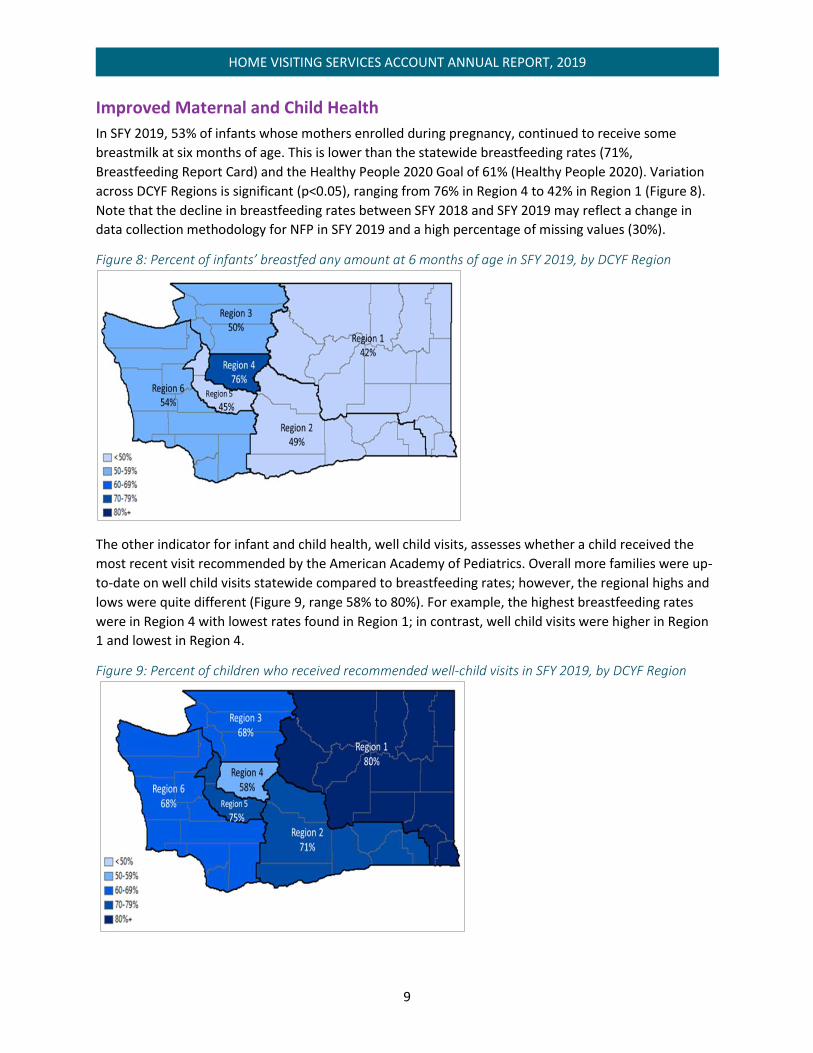
In SFY 2019, 53% of infants whose mothers enrolled during pregnancy, continued to receive some
breastmilk at six months of age. This is lower than the statewide breastfeeding rates (71%,
Breastfeeding Report Card) and the Healthy People 2020 Goal of 61% (Healthy People 2020). Variation
across DCYF Regions is significant (p<0.05), ranging from 76% in Region 4 to 42% in Region 1 (Figure 8).
Note that the decline in breastfeeding rates between SFY 2018 and SFY 2019 may reflect a change in
data collection methodology for NFP in SFY 2019 and a high percentage of missing values (30%).
Figure 8: Percent of infants’ breastfed any amount at 6 months of age in SFY 2019, by DCYF Region
The other indicator for infant and child health, well child visits, assesses whether a child received the
most recent visit recommended by the American Academy of Pediatrics. Overall more families were up-
to-date on well child visits statewide compared to breastfeeding rates; however, the regional highs and
lows were quite different (Figure 9, range 58% to 80%). For example, the highest breastfeeding rates
were in Region 4 with lowest rates found in Region 1; in contrast, well child visits were higher in Region
1 and lowest in Region 4.
Figure 9: Percent of children who received recommended well-child visits in SFY 2019, by DCYF Region

10
HOME VISITING SERVICES ACCOUNT ANNUAL REPORT, 2019
Identifying potential caregiver mental health issues and providing services and referrals is a key role for
home visitors. In SFY 2019, depression screenings and referrals were added as Performance Milestones
in an effort to elevate the importance of timely screening. The goal of the depression screening
performance award was to incentivize screening for all newly enrolled caregivers within three months of
enrollment or three months following the birth of their child if the caregiver enrolled prenatally. Home
visitors screen caregivers with the Patient Health Questionnaire-9 (PHQ-9). For SFY 2019, LIAs received
incentive awards for the 720 caregivers screened for depression during the screening window in the
fiscal year. Depression screening rates across the HVSA remained constant at 74%, with regional
variation from 54% to 83% (Appendix 3).
The depression referral performance award is designed to
incentivize appropriate follow-up and connection to services for
caregivers who screen positive or disclose depressive symptoms.
This may include making a new referral for mental health
services, completing a referral or confirming the caregiver is
receiving the recommended services and documenting the work. In SFY 2019, incentive awards were
made for 145 caregivers who received a referral following a positive depression screening; however, this
only accounted for one-third of the positive screenings reported. Additional support to home visitors
may include education on mental health and depression, coaching on supporting discussions with clients
about mental health, improving data collection and understanding the value of data reporting. Systems-
level issues such as the availability of mental health providers in rural communities and the availability
of culturally appropriate services may need to be addressed. In SFY 2020, 13 home visiting programs
selected to participate in the caregiver depression screening and referrals CQI Learning Collaborative.
Reduced Child Injuries, Abuse and Neglect
While reducing child abuse and neglect is often cited as one of the primary goals for home visiting, it is
difficult to measure. This is the only Aligned Measure that relies on administrative data collected by
Child Protective Services (CPS), rather than using parent self-report. In Washington, what that means is
that the HVSA is dependent on parents providing consent to the HVSA to use confidential individual
identifiers to match with CPS data. In SFY 2019, 67% of the children enrolled in home visiting had a
parent or guardian who consented to share confidential data with the HVSA. Among these children, 3%
had a case investigation initiated in SFY 2019.
Improved School Readiness and Achievement
The three indicators for school readiness and achievement cover interactions in the home between
adult and children and routine child developmental screenings by the home visitor. Nurturing the
SFY 2019 Depression
Performance Milestones
Screenings: 720 Caregivers
Referrals: 145 Caregivers
A Clark County Public Health client wrote under "What I like about NFP"
"A kind and caring nurse that comes to your home on a regular basis. My nurse was eager to help with my
many questions about my changing body from birth to 2 years old. She brought lots of good reading material
and movies. Healthcare is so confusing these days but she helped me navigate and find me and my daughter
good doctors and dentists. She listened and genuinely cared. This program is amazing. Being a first time
mom is so scary, but because of NFP I embraced being the best mom I can be. Thank you so much!”

11
HOME VISITING SERVICES ACCOUNT ANNUAL REPORT, 2019
parent-child relationship is one of the primary goals for all of the home visiting models funded by the
HVSA; yet measuring the strength of that relationship is challenging. Instead, the HVSA uses a process
measure to monitor that the parent-child interaction (PCI) is assessed at minimum annually.
Despite the focus on the relationship by home visitors, the formal assessment and reporting of PCI is
low. In SFY 2019, only 47% of parents were assessed using an HVSA-approved tool. For both SFY 2018
and 2019, the Home Observation for Measurement of the Environment (HOME) tool was the primary
assessment tool included in this measure. Additional MIECHV-approved tools used by LIAs will be
reviewed in SFY 2020 by the HVSA and may expand the list of approved tools for PCI assessment.
Many home visiting models use the Ages & Stages Questionnaires, Third Edition (ASQ-3) to routinely
screen for potential developmental delays. The screening tool assesses development in skill areas
including communication, gross and fine motor, problem-solving and social development. The
expectation is that at a minimum, children are screened at 9-10 months, 18 months and 24 or 30
months of age. Screening rates for the HVSA were 61%, comparable to performance in SFY 2018.
Regional variation follows a similar pattern to the other school readiness measures with higher rates in
Eastern Washington and lower rates in urban centers (Appendix 3).
Figure 10: Percent of children screened for developmental delays by Region, SFY 2019
Centralia College had a mother of a 2-year-old share her story:
"I feel the PAT program helped me grow personally with my son by giving me new ideas with
approaching a situation with him and many new activity ideas for keeping my busy energetic toddler
happy. I also feel it helped me to see what stages my son will go through next and what to expect from it
when I had absolutely no idea. I think all of the information and fun books have really helped progress my
kiddo big time. Overall, this program is so helpful and really useful for first time moms and of course for
all of the moms out there. Thanks PAT! And our home visitor. Our family is really grateful!"
After being enrolled in PAT for several months, this mom had the confidence to enroll for classes at
Centralia College. Being in the PAT program was her gateway to becoming a college student.

12
HOME VISITING SERVICES ACCOUNT ANNUAL REPORT, 2019
Reduced Crime or Domestic Violence
The one measure in this domain, Intimate Partner Violence (IPV) screening improved from 66% in SFY
2018 to 70% in SFY 2019. IPV screening rates were significantly higher in Eastern Washington regions
(Regions 1 and 2) compared to Western Washington regions (Regions 3, 4, 5 and 6) (Figure 11, range
52% to 82%). During SFY 2019, three eastern Washington LIAs participated in a national CQI Learning
Collaborative that worked to improve IPV screenings and referrals. IPV screening rates for these three
LIAs remained high in SFY 2019 (82-97%).
Figure 11: Percent of caregivers screened for IPV in SFY 2019, by Region
Lessons Learned and Future Direction SFY 2019 was a year of learning and growth for the HVSA. The end of June 2019 marked the two-year
anniversary for accountability to the Aligned Measures and the one-year anniversary for the
Performance Milestones. Congratulations are due across the HVSA for the significant accomplishment of
adopting a uniform set of measures and milestones to monitor progress statewide. This effort required
dedicated home visitors and LIAs to implement, modify and improve home visiting services and
reporting, as well as state-level HVSA leadership commitment to provide trainings and support for
model fidelity, data collection and reporting.
Looking at the Aligned Measures, in SFY 2019 there was improved performance in daily literacy activities
and IPV screening, yet the majority of measures remained unchanged from the prior year. Several
performance indicators displayed geographic variation. The reasons for these geographic differences
may be due to differences in distribution of models, model goals, how models collect the data and
population served by programs (e.g., the population in Seattle metropolitan area vs. other areas; urban
vs. rural populations). Further geographic analyses are warranted.
Health screenings and referrals for depression, IPV and child development continue to require training
support for the home visitor to promote competency and confidence in the tools. CQI methods will
continue to promote practice improvements for depression and IPV screenings and referrals, with
improved outcomes anticipated in SFY 2020. Additionally, a deeper understanding of the parent-child
relationship, including how to support and assess the relationship, continues to be a priority for the LIAs
and the HVSA. As the HVSA expands the performance-based contracting work to include program

13
HOME VISITING SERVICES ACCOUNT ANNUAL REPORT, 2019
outcomes, the parent-child relationship continues to be recognized as one of the foundational outcomes
of interest across all of the home visiting models.
Two areas of particular ongoing interest to the HVSA are workforce development and family
engagement. In 2019, the HVSA along with regional MIECHV partners, published findings from the
MIECHV Innovation Grant focused on the home visiting workforce in Region X (Green et al, 2019). This
body of work provides insights into the current makeup of the home visiting workforce, challenges to
hiring, retention and staff advancement in the field, as well as opportunities for further analyses of the
associations between workforce and family outcomes. Family engagement, which encompasses
enrollment, dosage, retention and overall participation in home visiting, is another area ripe for
additional exploration. While HVSA-funded LIAs were successful in reaching more families in SFY 2019,
visit dosage and retention remained below model expectations. In 2019, the HVSA began to explore the
relationship between home visitor workload with family engagement and outcomes. This is a rich area
for further study moving forward.
Lastly, the HVSA continues to engage in national communities of practice dedicated to advancing home
visiting and continue to seek insights from national and local studies, including but not limited to the
national Maternal and Infant Home Visiting Program Evaluation (MIHOPE) study results recently
published (see Duggan et al, 2018 and Michalopoulos et al, 2019 studies in references).
Data Limitations It is important to note that the data and information included in this annual report are subject to a
number of limitations. The report should to be interpreted with these limitations in mind.
First, families enrolled in home visiting programs are often experiencing many challenges and may be
reluctant to share fully with their home visitor until a trusting relationship is built.
Second, the data collection and reporting requirements for the HVSA allow for routine monitoring and
evaluation across all models, LIAs and families funded by the HVSA. The burden to meet these
requirements, however, is high for the home visitor and is variable across models, dependent on model
priorities, data collection forms and supporting data systems. Changes to the HVSA measures, the HVSA
data system and the model data collection and reporting systems create opportunities for improved
measurement, while also presenting challenges to producing comprehensive, routine monitoring data.
Third, this report used available data, feedback from the field and best practices for combining data
from different sources. Select models or programs were not included in some analyses if data elements
were not available. For example, some models do not report the number of family members in a
household, making the calculation of the federal poverty level unobtainable. In SFY 2019, the HVSA
adopted a new quality assurance plan and committed to working with programs and models to ease the
reporting burden while meeting the monitoring needs of funders and stakeholders.

14
HOME VISITING SERVICES ACCOUNT ANNUAL REPORT, 2019
Selected References Anne Duggan, Ximena A. Portilla, Jill H. Filene, Sarah Shea Crowne, Carolyn J. Hill, Helen Lee and Virginia
Knox. (2018). Implementation of Evidence-Based Early Childhood Home Visiting: Results from the Mother
and Infant Home Visiting Program Evaluation. OPRE Report 2018-76A. Washington, DC: Office of
Planning, Research and Evaluation, Administration for Children and Families, U.S. Department of Health
and Human Services.
Beth L Green, Peggy Nygren, Mackenzie Burton, Amy Gordon, Diane Reid. (2019). Maternal, Infant and
Early Childhood Home Visiting (MIECHV) Region X Workforce Innovations Project, Final Evaluation
Report. Center for Improvement of Child & Family Services, School of Social Work, Portland State
University. Online: https://www.dcyf.wa.gov/services/child-dev-support-providers/home-
visiting/innovation-grant
Breastfeeding Report Card, United States 2018. Centers for Disease Control and Prevention, U.S.
Department of Health and Human Services. Online:
https://www.cdc.gov/breastfeeding/data/reportcard.htm
Charles Michalopoulos, Kristen Faucetta, Carolyn J. Hill, Ximena A. Portilla, Lori Burrell, Helen Lee, Anne
Duggan and Virginia Knox. (2019). Impacts on Family Outcomes of Evidence-Based Early Childhood Home
Visiting: Results from the Mother and Infant Home Visiting Program Evaluation. OPRE Report 2019-07.
Washington, DC: Office of Planning, Research and Evaluation, Administration for Children and Families,
U.S. Department of Health and Human Services.
Community Health Assessment Tool (CHAT), March 2019. Single year intercensal estimates 2018.
Forecasting Division, Washington State Office of Financial Management, March 2019
Healthy People 2020. Office of Disease Prevention and Health Promotion, U.S. Department of Health
and Human Services. Online: https://www.healthypeople.gov/2020/default

15
HOME VISITING SERVICES ACCOUNT ANNUAL REPORT, 2019
Appendix 1: Measure Definitions
A. HVSA Aligned Performance Measures
Measure Definition
Breastfeeding Percent of infants (among mothers who enrolled in home visiting prenatally) who were breastfed any amount at 6 months of age
Depression screening Percent of primary caregivers enrolled in home visiting who are screened for depression using a validated tool within 3 months of enrollment or delivery
Well child visits Percent of children enrolled in home visiting who received the last recommended well child visit based on the American Academy of Pediatrics (AAP) schedule.
CPS involvement Percent of children enrolled in home visiting with at least one investigated case of maltreatment following enrollment within the reporting period
Parent-child interaction
Percent of primary caregivers enrolled in HV who receive an observation of caregiver-child interaction using a validated tool
Literacy activities Percent of children enrolled in home visiting with a family member who reported that during a typical week s/he read, told stories and/or sang songs with their child daily, every day
Child development screenings
Percent of children enrolled in home visiting with at least one screening for developmental delays with a validated tool according to the AAP-defined age groups
IPV screening Percent of primary caregivers enrolled in home visiting who are screened for interpersonal violence (IPV) within 6 months of enrollment using a validated tool
B. HVSA Aligned Performance Measures
Measure Definition
Enrollment Program meets or exceeds enrollment of 85% of their Maximum Service Capacity (caseload) during the report period, using cross-sectional count of families currently served at the end of each month. Evaluated Quarterly.
Dosage Program with at least 60% of their total enrolled families receiving minimum of 80% of expected number of home visits (per model requirements) during the report period. Evaluated Quarterly.
Depression screening Primary caregivers enrolled in home visiting screened for depression using a validated tool within 3 months of enrollment or delivery during the report period. Evaluated Annually.
Depression Referrals Primary caregivers referred to or connected with services during the report period following a positive screening. Evaluated Annually.
16
HOME VISITING SERVICES ACCOUNT ANNUAL REPORT, 2019
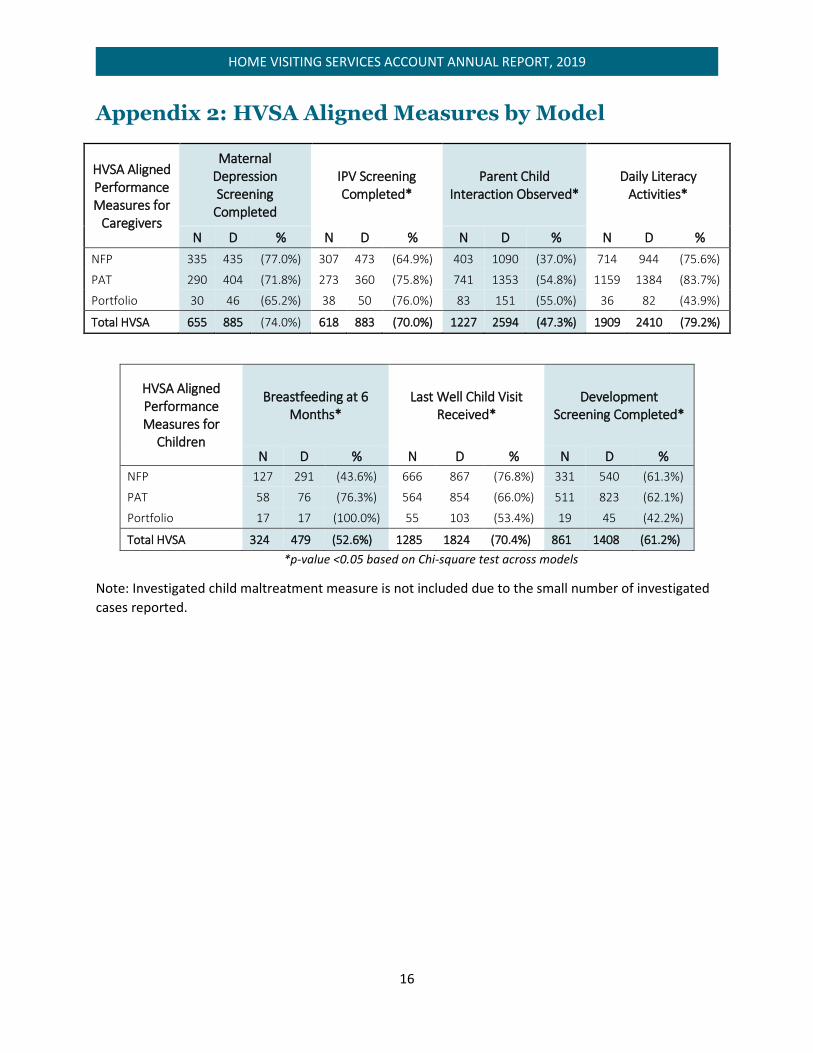
Appendix 2: HVSA Aligned Measures by Model
HVSA Aligned Performance Measures for
Caregivers
Maternal Depression Screening
Completed
IPV Screening Completed*
Parent Child Interaction Observed*
Daily Literacy Activities*
N D % N D % N D % N D %
NFP 335 435 (77.0%) 307 473 (64.9%) 403 1090 (37.0%) 714 944 (75.6%)
PAT 290 404 (71.8%) 273 360 (75.8%) 741 1353 (54.8%) 1159 1384 (83.7%)
Portfolio 30 46 (65.2%) 38 50 (76.0%) 83 151 (55.0%) 36 82 (43.9%)
Total HVSA 655 885 (74.0%) 618 883 (70.0%) 1227 2594 (47.3%) 1909 2410 (79.2%)
HVSA Aligned Performance Measures for
Children
Breastfeeding at 6 Months*
Last Well Child Visit Received*
Development Screening Completed*
N D % N D % N D %
NFP 127 291 (43.6%) 666 867 (76.8%) 331 540 (61.3%)
PAT 58 76 (76.3%) 564 854 (66.0%) 511 823 (62.1%)
Portfolio 17 17 (100.0%) 55 103 (53.4%) 19 45 (42.2%)
Total HVSA 324 479 (52.6%) 1285 1824 (70.4%) 861 1408 (61.2%)
*p-value <0.05 based on Chi-square test across models
Note: Investigated child maltreatment measure is not included due to the small number of investigated
cases reported.

17
HOME VISITING SERVICES ACCOUNT ANNUAL REPORT, 2019
Appendix 3: HVSA Aligned Measures by DCYF Region
HVSA Aligned Performance Measures for
Caregivers
Maternal Depression Screening
Completed
IPV Screening Completed*
Parent Child Interaction Observed*
Daily Literacy Activities*
N D % N D % N D % N D %
Region 1 105 127 (82.7%) 106 131 (80.9%) 219 381 (57.5%) 290 371 (78.2%)
Region 2 172 221 (77.8%) 184 222 (82.9%) 342 700 (48.9%) 549 660 (83.2%)
Region 3 82 118 (69.5%) 77 119 (64.7%) 138 333 (41.4%) 223 294 (75.9%)
Region 4 53 99 (53.5%) 72 107 (67.3%) 113 298 (37.9%) 151 222 (68.0%)
Region 5 61 84 (72.6%) 41 86 (47.7%) 89 238 (37.4%) 157 205 (76.6%)
Region 6 182 236 (77.1%) 138 218 (63.3%) 326 644 (50.6%) 539 658 (81.9%)
Total HVSA 655 885 (74.0%) 618 883 (70.0%) 1227 2594 (47.3%) 1909 2410 (79.2%)
HVSA Aligned Performance* Measures for
Children
Breastfeeding at 6 Months*
Last Well Child Visit Received*
Development Screening Completed*
N D % N D % N D %
Region 1 17 41 (41.5%) 237 295 (80.3%) 161 215 (74.9%)
Region 2 47 96 (49.0%) 351 497 (70.6%) 244 390 (62.6%)
Region 3 15 30 (50.0%) 147 215 (68.4%) 105 194 (54.1%)
Region 4 41 54 (75.9%) 92 159 (57.9%) 82 168 (48.8%)
Region 5 28 62 (45.2%) 134 179 (74.9%) 57 103 (55.3%)
Region 6 54 101 (53.5%) 324 479 (67.6%) 212 337 (62.9%)
Total HVSA 202 384 (52.6%) 1285 1824 (70.4%) 861 1407 (61.2%)
*p-value <0.05 based on Chi-square test across models
Note: Investigated child maltreatment measure is not included due to the small number of investigated
cases reported.