home properties 2006 annual report
TRANSCRIPT

Home Properties 2006 Annual Report
H O M E D E L I V E R SH O M E D E L I V E R S

Profile Home Properties (NYSE: HME), the sixth largest
publicly traded apartment company in the United States,
is a real estate investment trust (REIT) with operations
primarily along the East Coast of the country. We adhere
to a simple and straightforward business plan in our
effort to provide investors with dependable financial
returns that exceed those of comparable investments.
Our apartment communities generate excellent financial
results through physical improvements and an unwavering
commitment to customer service. Home Properties and
its predecessor company have a proven track record of
creating and preserving value in multifamily rental
housing since 1967.
Mission Our mission is to maximize long-term
shareholder value by acquiring, repositioning, developing
and managing market-rate apartment communities
while enhancing the quality of life for our residents
and providing employees with opportunities for growth
and accomplishment.
Vision Our vision is to be a prominent owner and
manager of market-rate apartment communities located
in high barrier, high growth markets.
Table of Contents The Home Properties Portfolio ........................................... 2
Letter to Shareholders ....................................................... 3
Home Delivers .................................................................. 6
Form 10-K ..................................................................... 13
Corporate Information/ The Home Properties Pledge .....................Inside Back Cover
Performance Highlights
• Funds from operations rose 8.0% to a record $3.07 per share
• Net operating income increased 6.8%
• Exited low barrier, low growth Detroit and Upstate New York markets
• Acquired 3,067 apartment units in high barrier, high growth East Coast markets
• Utility reimbursements of $8.6 million more than tripled from 2005
• HME 2006 year-end stock price up 45.3% over year-end 2005
• Dividend increased for the 12th consecutive year
10-Year Comparative Annual Total Returns
8.4%
S&P500
EquityREITs*
ApartmentREITs*
HomeProperties
14.5%16.0% 16.8%
*NAREIT Indices
1-Year Comparative Annual Total Returns
15.8%
S&P500
EquityREITs*
ApartmentREITs*
HomeProperties
35.1%40.0%
51.6%
*NAREIT Indices

1
Same Property Net Operating Income Growth (%)
HME Multifamily Sector
3.6
-4.9
-1.1
-5.2
2.2
-0.6
2.9 3.5
2004 20052002 2003 2006
6.87.6
Total Revenues (in millions)
$283$329
2002 2003 2004 2005
$367
12.5% Compound Annual Growth Rate
$401
2006
$454
Funds From Operations Per Diluted Share
$2.62 $2.77
2002 2003 2004 2005
$2.54
See GAAP reconciliation in Form 10-K.
$2.84
2006
$3.07
Stable Occupancy and Same Property Rental Rate Growth
92.0% 93.1%92.3%
5.8%
2.8%
2002 2003 2004
2.8%
2005
2.4%
93.1%
Economic Occupancy Rental Rate Growth
2006
3.1%
94.0%
Financial Highlights
As of December 31,($ in thousands) 2006 2005 2004 2003 2002
Property revenues1 $ 448,763 $ 397,921 $ 363,869 $ 323,927 $ 279,377
Net operating income2 $ 257,918 $ 223,015 $ 206,067 $ 187,343 $ 167,057
Net income $ 110,485 $ 81,512 $ 47,022 $ 41,798 $ 44,939
Funds from operations $ 147,089 $ 137,606 $ 126,953 $ 132,803 $ 121,745
Real estate before accumulated depreciation $ 3,451,762 $ 3,330,710 $ 3,123,901 $ 2,752,992 $ 2,597,278
Total debt $ 2,124,313 $ 1,924,086 $ 1,702,722 $ 1,380,696 $ 1,335,807
Owned communities 123 153 150 147 152
1Rental income plus property other income2Property revenues minus operating and maintenance expenses
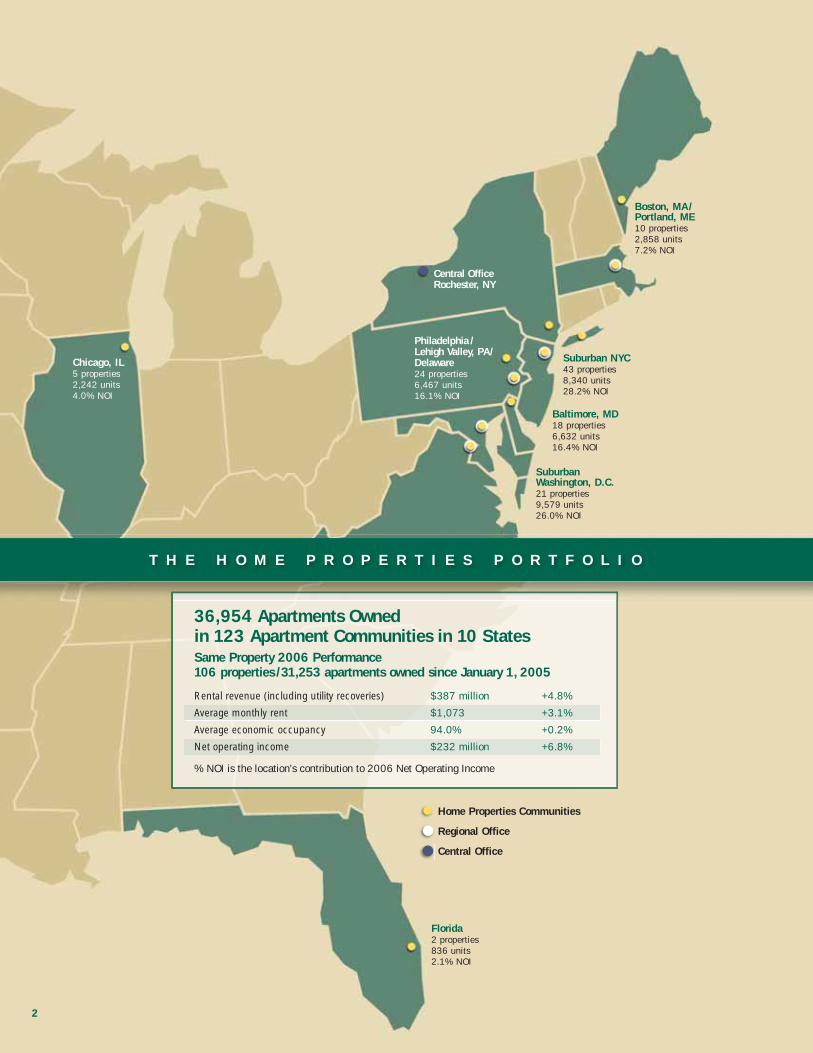
Suburban NYC43 properties8,340 units28.2% NOI
Boston, MA/Portland, ME10 properties2,858 units7.2% NOI
Philadelphia /Lehigh Valley, PA/Delaware24 properties6,467 units16.1% NOI
Baltimore, MD18 properties6,632 units16.4% NOI
Suburban Washington, D.C.21 properties9,579 units 26.0% NOI
Chicago, IL5 properties 2,242 units4.0% NOI
% NOI is the location’s contribution to 2006 Net Operating Income
Same Property 2006 Performance106 properties / 31,253 apartments owned since January 1, 2005
Central OfficeRochester, NY
Florida2 properties836 units 2.1% NOI
36,954 Apartments Owned in 123 Apartment Communities in 10 States
Home Properties Communities
Regional Office
Central Office
2
Rental revenue (including utility recoveries) $387 million +4.8%
Average monthly rent $1,073 +3.1%
Average economic occupancy 94.0% +0.2%
Net operating income $232 million +6.8%
T H E H O M E P R O P E R T I E S P O R T F O L I O

In 2006, Home Properties delivered on every strategic initiative
we presented in last year’s letter to shareholders with very
favorable results. First and foremost, we successfully completed
the disposition of our portfolios in Detroit (19 properties/5,046
units) and Upstate New York (18 properties/4,567 units),
exiting our two major low barrier, low growth markets. These
sales, refl ecting our initiatives to focus on high barrier, high
growth markets and adopt a more active portfolio management
philosophy, generated over $320 million in net proceeds
which will fund further expansion in our targeted East Coast
markets. Second, we made signifi cant progress in the
implementation of our utility cost recovery programs with a
$5.4 million increase in utility reimbursements over 2005.
Third, we advanced our initiative to become a more effi cient
operator, beginning the implementation of a web-based
property management system and a central pricing system
which also are expected to increase revenue.
The fi nancial results of these strategic initiatives and a more
favorable operating environment for our business produced the
highest funds from operations (FFO) in our history as a public
company. The market recognized Home’s achievements and
potential with a steady increase in the share price during 2006
reaching a record high of $63.78 on November 21 and fi nishing
the year at $59.27, 45.3% above year-end 2005 and the largest
annual increase in the company’s history. In 2006, Home
delivered a total shareholder return of 51.6%, the third highest
total return in the 12-company public apartment REIT sector.
The positive momentum continued into 2007 with Home shares
reaching successive all-time highs during January and February.
Overall, 2006 was an outstanding year for Home Properties
which positioned us to deliver even better results going forward.
A more detailed review of the Company’s 2006 fi nancial and
operating performance follows, along with a discussion of our
strategy and what we see for our business going forward.
Dear Fellow Shareholders:
3
A L E T T E R T O O U R S H A R E H O L D E R S

In 2006, Home Properties generated funds from operations of
$147.1 million, or $3.07 per share, an 8.0% increase from 2005
FFO of $2.84 per share. For properties owned since January 1,
2005 (the Core properties), same-property total revenue increased
by 5.0% in 2006 while net operating income (NOI) increased by
6.8%. Refl ecting a more favorable operating environment, improved
property management and successful marketing initiatives, average
economic occupancy for the Core properties was 94.0% in 2006,
up from 93.8% in 2005, with rent, including utility cost
reimbursements, rising 4.8%.
The acquisition environment in our target markets remained
challenging in 2006. Despite the continuation of very competitive
market conditions, we exceeded our 2006 goal of $150 million in
gross acquisitions by 140% through acquisition of 3,067 units
(eight properties) for $360.1 million. Our 2006 objective is
$400 million in gross acquisitions, refl ecting more favorable
expectations of market conditions in 2007 and the availability
of funds generated by our October 2006 convertible notes
offering and the Detroit and Upstate New York portfolio sales.
Our target markets for acquisitions remain selected East Coast
markets in the Northeast, Mid-Atlantic and Florida.
What’s Ahead for Home? From a strategic and an operating perspective, 2006 was a stand-
out year. After such exceptionally strong results, the question that
may be on the minds of investors is how we will maintain our
momentum and continue to build the business and enhance our
fi nancial performance. The following overview of our major
strategic initiatives and objectives makes the case for Home
advancing our major fi nancial goals of maximizing NOI and FFO
growth to further increase returns for our shareholders.
High Barrier, High Growth Market Focus With the completion
of the Detroit and Upstate New York portfolio sales, our current
portfolio is 92% in high barrier, high growth geographic markets.
The major benefi ts of our signifi cantly greater concentration in
high barrier, high growth markets are limited new apartment
supply, a greater spread between the cost of owning a home and
renting, reduced vulnerability to economic downturns, a larger
renter population and better job growth. These factors make our
target markets among the most attractive apartment markets in the
United States, enhancing our opportunities for future NOI and
FFO growth while creating a more valuable franchise for Home.
Increasing New Development Activity While our primary
focus will remain on acquiring and repositioning mature apartment
properties in high barrier, high growth markets, over the last few
years, we have successfully added development expertise to
our earnings growth arsenal. We accomplished this by building
new units on land adjacent to owned communities. In 2004, we
began the development of 120 units in Portland, Maine and are
following with another 216 units in Allentown, Pennsylvania that
will be completed in 2008. The stabilized yield on these fi rst two
developments of suburban garden apartments is expected to be
approximately 7.5% with an unleveraged internal rate of return
of 16%. Within our markets and portfolio, we see opportunity for
development on entitled land and on adjacent/excess land in
several owned communities, as well as density opportunities to
replace existing garden apartments with mid- or high-rise
structures. Our plan is to prudently ramp up development activity
with a longer-term goal in fi ve years to invest $200 million
annually in new development and subsequently place an average
of 800 newly developed units in service each year.
Sustained Repositioning Returns We also plan to continue
successfully repositioning recently acquired properties by
maintaining a minimum budgeted return on upgrades of 9%
with many specifi c upgrades achieving a much higher return of
up to 15% in 2006. Our track record and expertise in rehabilitating
and repositioning is unique in the industry, and we continue to
fi nd ways to better and more profi tably reposition mature
apartment communities.
Completion of Energy Cost Recovery Programs We also look to
achieve additional revenue growth in 2007 with the expected
completion of the fi nal phase of our energy cost recovery programs’
implementation by mid-year. This timetable puts us on track to
realize an additional $8.6 million in utility reimbursements in 2007.
Going forward, this program removes most of the volatility of heating
costs from our earnings compared to pre-implementation results.
4
H O M E D E L I V E R S
2006 Performance Review

Revenue Enhancement and Efficiency Opportunities We are on
track with our implementation of the MRI (Management Reporting
International) web-based property management system. A pilot
program at one property began in 2006 with two additional pilots
following in early 2007. Adopting a web-based property
management system enhances management’s ability to monitor
regional and property performance through comprehensive real-
time management reports and make necessary adjustments more
quickly. In tandem with the MRI implementation, we are instituting
a centralized pricing system using the LRO (Lease Rent Optimizer)
program to facilitate analytical market-based pricing decisions.
These systems support our drive to become a more effi cient and
profi table operator by identifying opportunities to enhance rent
pricing, effi ciencies and cost savings. The MRI and LRO systems
further enhance our technology platform which we upgraded in
2006 with a redesigned web site to better support marketing of our
communities to prospective residents.
Multiple Expansion Progress and Potential The favorable
results of our strategic and operational initiatives are having a
positive effect on our goal to expand our FFO multiple relative
to our peers. At year-end 2006, Home’s FFO multiple was 19.3
times 2006 FFO compared with the public apartment REIT
average of 22.3. This multiple gap, three times below our peer
average, compared with a gap of 3.6 times at year-end 2005. We
believe our 2007 initiatives and operating plan will put us on a
sound course to further narrow the multiple gap.
Continued Dividend Growth On October 27, 2006, the Board
increased the common dividend for the twelfth consecutive year to
an annualized rate of $2.60 per share. This increase represents a
4.4% yield based on the $59.27 closing price of HME shares on
December 29, 2006, the last trading day of the year, and is among
the highest in our sector. The increased dividend refl ects the Board’s
confi dence in Home’s future performance based on an improved
operating environment, the success of our repositioning strategy and
energy cost recovery programs, and the strength of our geographic
markets and balance sheet. We are committed to continuing Home’s
exemplary record in our peer group of consistent dividend growth.
In last year’s annual report, we said that more than ever we
were managing for peak performance. In 2006 we delivered on
our strategy and goals with signifi cantly improved operating
fundamentals. Without question, managing for peak
performance remains our mindset and the track the Company
is on for 2007 and beyond.
We hope that you will be able to join us at our annual
shareholders’ meeting on May 1, 2007 at 2:30 p.m. at the Dryden
Theatre, George Eastman House, in Rochester, New York. We thank
you for your confi dence in Home Properties and look forward to
delivering continued success for the benefi t of our shareholders.
5
Norman LeenhoutsCo-Chair of the Board
Nelson B. LeenhoutsCo-Chair of the Board
Edward J. PettinellaPresident and Chief Executive Officer
Sincerely,
H I G H E S T F F O I N C O M P A N Y H I S T O R Y
Strong Capital Structure
Equity 57%Common stock, 70%Perpetual preferred, 2%Operating partnershipunits, 28%
Debt 43%Fixed, 99%Floating, 1%
$4.9 Billion Total Capitalization$59.27 per share at 12/31/2006
Commonand PreferredStock
OP Units
Debt

Signifi cant Repositioning Experience and Expertise Acquiring and repositioning mature C to B- apartment properties is a core
competency of Home Properties. Among East Coast public REITs, we are unique in our repositioning approach, experience and capabilities.
Since our 1994 IPO, Home Properties has acquired and repositioned 190 communities with
more than 52,000 units.
To secure the maximum returns from repositioning communities, we employ a very
disciplined approach to the post-acquisition rehabilitation and revitalization process requiring
a minimum 9% return on our repositioning investments which is often greatly exceeded. Our
extensive repositioning experience has helped us build signifi cant internal design and construction
management skills. We also use approved subcontractors in our markets who have proven their
ability to work within our plans, standards, budget and schedules.
The complete initial repositioning of a community typically takes place over a fi ve to seven year period. Our repositioning process
is comprehensive and typically begins with improvements in landscaping, signage and common areas to increase the curb appeal
and marketability of the property. Apartment interiors are renovated when residents move out with the most signifi cant investments
made in upgrading kitchens and baths. Complete remodeling of dated
kitchens and bathrooms typically includes new appliances, fl ooring,
counters, cabinets, lighting, tile, fi xtures, sinks, bathtubs and toilets. It
may include the removal of kitchen walls to open up the living area. A
typical interior upgrade also includes repainting, new carpeting and the
addition of six-panel doors. Where feasible, we will add in-unit washers
and dryers which bring a high return on investment. A typical apartment
makeover takes approximately two weeks to complete which minimizes
loss of rental income.
6
2006 Repositioning Investments
▲ 1 new community center
▲ 13,163 new windows
▲ 949 remodeled kitchens
▲ 1,061 complete bath upgrades
Apartment Quality
Mon
thly
Apa
rtm
ent
Ren
t
$1,600
$1,500
$1,400
$1,300
$1,200
$1,100
$1,000
$900
$800C - C C + B - B B +
Typical Impact of Repositioning
$900$950
$1,050
$1,200
$1,370
$1,590
H O M E D E L I V E R S

7
The Hamptons, North Lauderdale, FL
Units: 836
Date acquired: July 2004
2006 economic occupancy: 94.2%
2006 NOI growth: 17.0%
Compound annual rentalgrowth rate: 10.7%
Purchase price per unit: $84,000
Undepreciated book value per unit: $95,000
Projected IRR: 14.4%
Barrington Gardens, Matawan, NJ
Units: 148
Date acquired: March 2005
2006 economic occupancy: 96.9%
2006 NOI growth: 65.6%
Compound annual rental growth rate: 9.9%
Purchase price per unit: $50,300
Undepreciated book value per unit: $67,800
Projected IRR: 20.0%
AfterBeforeAfterBefore
In repositioning acquired communities, we correct deferred maintenance while making the necessary infrastructure improvements
to upgrade the community and reduce long-term operating costs. These improvements can include new HVAC systems, roofs, new
balconies and windows, and refreshing of exterior trim work. In many communities, we also will add or upgrade community centers
and swimming pools to enhance resident quality of life and appeal to new renters.
Our overall objective in repositioning is to upgrade properties that were C to B- level when acquired to the B to B+ level, which
over time signifi cantly increases the property’s rental income, NOI and market value. The strong concentration of our portfolio in prime
supply-constrained real estate markets further enhances the value our repositioning investments create.
After
6 . 8 % 2 0 0 6 N O I G R O W T H
Before After Before After
Before
Before After

Quality New Development In 2004, Home Properties began new apartment
development as a small-scale pilot program to grow earnings and net asset value.
Our objective also was to assess the viability of development as a supplement to the
acquisition of existing apartment communities.
Our fi rst new development project was Liberty Commons Apartments, adjacent
to Redbank Village Apartments, our 500-unit community in South Portland, Maine.
It consists of 120 garden apartments in six three-story buildings. Phase I of 48 units
was completed in 2005 and quickly occupied, with the remaining units completed
in the summer of 2006. Fourth quarter 2006 occupancy was 96.7%. This project is
expected to generate an excellent yield of 7.5% in its fi rst year of stabilized occupancy.
Our second development, Trexler Park West Apartments (216 units), is next to our existing owned community, Trexler Park Apartments
(249 units), in Allentown, Pennsylvania. It is similar in design to Liberty Commons and also includes a new community center and
swimming pool to be used by both communities. The cost per unit for both projects is approximately $120,000. At year-end 2006, 84 units
at Trexler Park West were completed. Financial results for the project are expected to be comparable to Liberty Commons.
With the success of these two new developments, we are implementing a plan to
conservatively increase new development of A quality communities in high barrier
Mid-Atlantic markets where we have a strong presence and deep market knowledge.
The benefi t of new development in these markets is high expected profi tability with
the potential for a greater fi nancial contribution than from acquisition of existing units.
Two new developments totaling 668 units in suburban Washington, D.C. markets will
be started in 2007. Additional plans are in place for projects that will move us toward
our long-term goal of placing in service an average of 800 newly developed apartment
units each year.
8
H O M E D E L I V E R S
September 2006 ribbon cutting at Trexler Park West Apartments, Allentown, PA
Trexler Park West Apartments, Allentown, PAUnits: 216 Date built: 2005-2008 Estimated cost per unit: $120,000 Average monthly rent 2006 Q4: $1,229 Projected IRR*: 16.0%
*over fi ve-year holding period

Exceptional Service to Residents The quality and commitment of our employees enables us to offer a
unique and powerful guarantee: The Home Properties Pledge to Residents. The Home Properties Pledge sets
high service standards reinforced by a money-back guarantee and also gives residents the option to cancel
their lease for job loss, job transfer or health reasons. The combination of a money-back service guarantee and
lease fl exibility makes the Home Properties Pledge to Residents a highly effective competitive differentiator
in our markets. Another unique service enhancement Home Properties provides for residents is a full-service
customer contact center that provides 24 hour/7 day a week multi-lingual support for prospective resident
inquiries and maintenance requests for all Home Properties communities.
To ensure that we are maintaining our high service standards, we formally survey residents regularly at all Home Properties
communities and following completion of service requests processed through our contact center. In 2006, 89% of residents responding
said they were pleased with the service. Additionally, 84% of new residents said they are likely to recommend us to others and 87% rank
us four or fi ve out of fi ve (fi ve being the best) on their customer service experience.
Our high level of service to residents contributes to a turnover rate signifi cantly below the national average. In 2006, Home Properties
resident turnover rate was 44%, compared to a national turnover rate of 60% for garden apartments.
In 2007, we are introducing a corporate tagline, Where Courtesy & Comfort Count, to better communicate to the marketplace the
unique service experience Home Properties provides residents. Our new tagline strongly emphasizes two of our core values: service
and quality. Our employees live these values by excelling in extending exceptional courtesy to prospective and current residents, and
by ensuring that residents are comfortable in their apartment homes. The promise made by our tagline, in combination with the Home
Properties Pledge, further sets us apart from our competitors.
9
The Home Properties team of 1,200 employees is the foundation for the exceptional apartment living experience we provide our more than 70,000 residents.
7 . 5 % I N I T I A L R E T U R N O N F I R S T N E W D E V E L O P M E N T
2006 Resident Turnover: 44% vs. 60% National Garden Apartment Average

Successful Energy Cost Recovery Programs In 2006, we advanced our initiative to transfer utility costs to residents based on
usage, moving away from our historical “one-price” philosophy that included those costs in monthly rent. This former pricing structure
subjected Home Properties in recent years to greater volatility in energy costs, particularly natural gas, which is subject to pricing swings
and is more diffi cult to offset and manage, even using forward purchases and hedging strategies.
Last year, we completed implementation of our program to allocate water and sewer
costs to residents, an initiative that recovered $6.4 million in these costs for the full year.
We also made signifi cant progress in transferring heating costs, recovering $2.2 million
in 2006. Depending on the property, market practice and regulations, we utilized energy
surcharges, submeters/RUBs (Ratio Utility Billing Systems) or meters to transfer heating
costs to residents.
The aggregate recovery from our two utility cost recovery programs was $8.6 million in
2006. Our plan calls for the natural gas program to be completed in 2007 with an expected
recovery of an additional $8.6 million from both programs in 2007.
Even with the implementation of these programs, we were able to increase both occupancy and rents in 2006. Following heating
program completion, we anticipate that the Company’s annual share of total natural gas costs, excluding common area expenses, will
be 15%, down from 77% when we fi rst began implementation of the pilot program in 2005. In addition to the cost recovery associated
with these programs, we believe shifting to residents the risk of fl uctuating heating costs has and will continue to have a favorable effect
on the beta and FFO multiple of Home Properties stock.
10
H O M E D E L I V E R S
Utility Reimbursement Revenues (in millions)
2004 2005 2006 2007 Projected
$0.0
$3.0
$8.6
$17.2

Targeting High Barrier East Coast Markets A major 2006 initiative was to signifi cantly increase our presence in high barrier,
high growth markets through acquisitions and by exiting our major low barrier, low growth markets. We were very successful on both
fronts, making eight acquisitions (3,067 units) in our target markets and selling both our Detroit and Upstate New York portfolios. The
net effect of these transactions was to increase our concentration in high barrier markets from 78% at 2005 year-end to 92% at 2006
year-end. The favorable shift to a signifi cantly greater concentration of units in high barrier, high growth markets during 2006 was the
major contributor to the 10.5% increase in our average monthly rent for the owned portfolio to $1,076 in 2006.
Our focus for continued growth is on the high barrier, high growth East Coast markets where we have already successfully built
critical mass and created signifi cant value through repositioning. Our success in East Coast markets is refl ected in our 2006 acquisition
activity which was concentrated in the Mid-Atlantic and Boston markets where we acquired 2,176 units (four properties) and 891
units (four properties) respectively. Our two largest markets, the suburbs of New York City and Washington, D.C., comprised 48.5% of
our 2006 year-end portfolio and contributed 54.2% to 2006 NOI, a share we expect will increase after two full years of owning newly
acquired properties in these regions. Our 2006 acquisitions in the Boston market signifi cantly increased our presence there to a total of
2,143 units and seven communities at year-end 2006. We intend to maintain our presence in the suburbs of Chicago, our one major
11
Left to right: Braddock Lee Apartments, Alexandria, VA; Devonshire Hills, Hauppauge, NY; Village Square Townhomes and Apartments, Glen Burnie, MD
Apartment communities in our three largest markets: Suburban Washington, D.C., Suburban New York City, Suburban Baltimore
9 2 % O F P O R T F O L I O I N H I G H B A R R I E R M A R K E T S
non-East coast market, as Chicago is the third largest MSA in the U.S. and the suburban area has many of the favorable demographics
and market characteristics of our suburban East Coast markets. The Chicago region also has performed favorably for us.
Our target markets all share characteristics that make them superior apartment markets. The major attributes are high average
home prices, a favorable supply/demand relationship and large prime renter populations including immigrants, Echo Boomers (the
children of the Baby Boomers) born from 1982 to 1995 and seniors. Notably, the median average home value in Home’s target markets
is $290,192 compared with the U.S. average of $161,602 (source: Claritas Inc.).

12
Outstanding Value Creation Home Properties’ total 2006 return to shareholders of 51.6% was the highest annual total return in
our history as a public company and well above the 2006 average total return of 40.0% for the NAREIT Apartment REIT Index and
15.8% for the S&P 500. Returns at this level are both gratifying and exceptional, making it important to also note Home Properties’
outstanding long-term record of value creation. Over 12 years as a public company,
Home Properties provided shareholders with an average annual total return (price
appreciation + dividends) of 16.5%.
Home Properties’ total return also outperformed the major broader market and
apartment indices over the last fi ve years. A $100 investment in Home Properties on
December 31, 2001, assuming reinvestment of dividends, was worth $256.56 on
December 31, 2006. The same $100 investment with dividends reinvested was worth
$135.02 in the S&P 500 composite index and $254.57 in the NAREIT Apartment REIT
index at year-end 2006.
Home Properties also stands out in the apartment REIT sector for its record of consist-
ent dividend growth, increasing the common dividend for 12 consecutive years. Home
Properties’ current annual common dividend of $2.60 per share represents a 4.4% annual
yield based on the share price at year-end 2006. This yield is more than double the average
dividend yield of all stocks in the S&P 500. For shareholders owning Home Properties
stock throughout 2006, dividend payments of $2.57 in 2006 represent an annual yield of
6.3% based on our 2005 year-end closing price of $40.80.
Canterbury Apartments, Baltimore, MD
Units: 618
Date acquired: July 1999
2006 economic occupancy: 94.9%
2006 NOI growth: 9.2%
Compound annual rental growth rate: 5.9%
Purchase price per unit: $42,600
Undepreciated book valueper unit: $57,800
Projected IRR: 19.3%
H O M E D E L I V E R S 5 1 . 6 % T O T A L 2 0 0 6 R E T U R N
Common Dividend Per Share
$2.41 $2.45
2002 2003 2004 2005
$2.49 $2.53
2006
$2.57
5-Year Cumulative Return
$135.02
$254.57
S&P500
Apartment REITS
$100 invested on December 31, 2001, assuming reinvestment of dividends
Home Properties
$256.56

Page 1 of 112
UNITED STATES SECURITIES AND EXCHANGE COMMISSION
Washington, D.C. 20549
FORM 10-K (Mark One) (X) ANNUAL REPORT PURSUANT TO SECTION 13 OR 15(d) OF THE SECURITIES EXCHANGE
ACT OF 1934
For the fiscal year ended December 31, 2006 or
( ) TRANSITION REPORT PURSUANT TO SECTION 13 OR 15(d) OF THE SECURITIES EXCHANGE ACT OF 1934
For the transition period from ____________________ to ____________________
Commission File Number 1-13136
HOME PROPERTIES, INC. (Exact name of Registrant as specified in its Charter)
MARYLAND 16-1455126
(State or other jurisdiction (I.R.S. Employer of incorporation or organization) Identification Number)
850 CLINTON SQUARE ROCHESTER, NEW YORK 14604 (Address of principal executive offices)
Registrant's telephone number, including area code: (585) 546-4900 Securities registered pursuant to Section 12(b) of the Act:
Title of each class Name of each exchange on which registered
Common Stock, $.01 par value New York Stock Exchange
Securities registered pursuant to section 12(g) of the Act:
_____________________________ (Title of class)
_____________________________
(Title of class)
Indicate by checkmark if the registrant is a well-known seasoned issuer, as defined in Rule 405 of the Securities Act.
YES X NO Indicate by checkmark if the registrant is not required to file reports pursuant to Section 13 or Section 15(d) of the Act.
YES NO X

Indicate by checkmark whether the registrant (1) has filed all reports required to be filed by Section 13 or 15(d) of the Securities Exchange Act of 1934 during the preceding 12 months (or for such shorter period that the registrant was required to file such reports), and (2) has been subject to such filing requirements for the past 90 days.
YES X NO Indicate by checkmark if disclosure of delinquent filers pursuant to Item 405 of Regulation S-K (§229.405 of this chapter) is not contained herein, and will not be contained, to the best of registrant's knowledge, in definitive proxy or information statements incorporated by reference in Part III of this Form 10-K or any amendment to this Form 10-K.
YES NO X Indicate by checkmark whether the registrant is a large accelerated filer, an accelerated filer, or a non-accelerated filer. See definition of "accelerated filer and large accelerated filer" in Rule 12b-2 of the Exchange Act. (Check one): Large accelerated filer / X / Accelerated filer / / Non-accelerated filer / / Indicate by checkmark whether the registrant is a shell company (as defined in Rule 12b-2 of the Act).
YES NO X The aggregate market value of the shares of common stock held by non-affiliates (based on the closing sale price on the New York Stock Exchange) on June 30, 2006, was approximately $1,796,700,000.
As of February 16, 2007, there were 33,205,831 shares of common stock, $.01 par value, outstanding.
DOCUMENTS INCORPORATED BY REFERENCE
Document Parts Into Which Incorporated
Proxy Statement for the Annual Meeting of Stockholders to be held on May 1, 2007
Part III

3
HOME PROPERTIES, INC.
TABLE OF CONTENTS Page PART I. Item 1. Business 4 Item 1A. Risk Factors 12 Item 1B. Unresolved Staff Comments 16 Item 2. Properties 16 Item 3. Legal Proceedings 22 Item 4. Submission of Matters to a Vote of Security Holders 22 Item 4A. Executive Officers 23 PART II. Item 5. Market for the Registrant's Common Equity, Related Shareholder Matters, and
Issuer Purchases of Equity Securities 25 Item 6. Selected Financial Data 28 Item 7. Management's Discussion and Analysis of Financial Condition and Results of
Operations 31 Item 7A. Quantitative and Qualitative Disclosures About Market Risk 54 Item 8. Financial Statements and Supplementary Data 55 Item 9. Changes in and Disagreements with Accountants on Accounting and Financial
Disclosure 55 Item 9A. Controls and Procedures 55 Item 9B. Other Information 56 PART III. Item 10. Directors and Executive Officers of the Registrant 57 Item 11. Executive Compensation 60 Item 12. Security Ownership of Certain Beneficial Owners and Management and Related
Stockholders Matters 60 Item 13. Certain Relationships and Related Transactions 60 Item 14. Principal Accountant Fees and Services 60 PART IV. Item 15. Exhibits, Financial Statement Schedules 61

4
PART I
Forward-Looking Statements
This Form 10-K contains forward-looking statements within the meaning of Section 27A of the Securities Act of 1933 and Section 21E of the Securities Exchange Act of 1934. Our actual results could differ materially from those set forth in each forward-looking statement. Certain factors that might cause such a difference are discussed in this report, included in the section entitled "Overview" on page 31 of this Form 10-K.
Item 1. Business
The Company
Home Properties, Inc. ("Home Properties" or the "Company") is a self-administered and self-managed real estate investment trust ("REIT") that owns, operates, acquires, develops and rehabilitates apartment communities. The Company's properties are regionally focused primarily in select Northeast, Mid-Atlantic and Southeast Florida markets of the United States. The Company was formed in November 1993 to continue and expand the operations of Home Leasing Corporation ("Home Leasing"). The Company completed an initial public offering of 5,408,000 shares of common stock (the "IPO") on August 4, 1994.
The Company conducts its business through Home Properties, L.P. (the "Operating Partnership"), a New York limited partnership in which the Company held a 71.4% partnership interest as of December 31, 2006 (65.2% at December 31, 2005) (such interest has been calculated as the percentage of outstanding common shares divided by the total outstanding common shares and limited partnership units in the Operating Partnership ("UPREIT Units") outstanding) and a management company – Home Properties Resident Services, Inc. ("HPRS"), which is a Maryland corporation. Formerly, a portion of the Company’s business was also conducted by Home Properties Management, Inc. also a Maryland corporation, which was merged into HPRS on November 21, 2006.
Home Properties, through its affiliates described above, as of December 31, 2006, operated 127 communities with 39,136 apartment units. Of these, 36,954 units in 123 communities are owned outright (the "Owned Properties"), 868 units in one community are managed and partially owned by the Company as general partner, and 1,314 units in three communities are managed for other owners (collectively, the "Managed Properties").
The Owned Properties and the Managed Properties (collectively, the "Properties") are concentrated in the following market areas:
Apts. Apts. Managed As Apts. Apt. Market Area Owned General Partner Fee Managed Totals
Suburban Washington, D.C. 9,579 - - 9,579 Suburban New York City 8,340 - - 8,340 Baltimore, MD 6,632 - 1,314 7,946 Philadelphia, PA 6,467 - - 6,467 Chicago, IL 2,242 - - 2,242 Boston, MA 2,143 - - 2,143 Southeast Florida 836 - - 836 Portland, ME 715 - - 715 Columbus, OH - 868 - 868
Total # of Units 36,954 868 1,314 39,136
Total Number of Communities 123 1 3 127
The Company's mission is to maximize long-term shareholder value by acquiring, repositioning, developing and managing market-rate apartment communities while enhancing the quality of life for its residents and providing employees with opportunities for growth and accomplishment. Our vision is to be a prominent owner and manager

5
of market-rate apartment communities, located in selected high barrier, high growth markets. The areas we have targeted for growth are the Baltimore, Boston, New York City, Philadelphia, Southeast Florida and Washington, D.C. regions. We expect to maintain or grow portfolios in markets that profitably support our mission as economic conditions permit.
The Company's business strategies include: (i) aggressively managing and improving its communities to achieve increased net operating income; (ii) acquiring additional apartment communities with attractive returns at prices that provide a positive spread over the Company's long-term blended cost of capital; (iii) developing new apartment communities on raw land, on land adjacent to existing owned communities and where there are density opportunities to replace existing garden apartments with mid- or high-rise structures; (iv) disposing of properties that have reached their potential, are less efficient to operate, or are located in markets where growth has slowed to a pace below the markets targeted for acquisition; and (v) maintaining a strong and flexible capital structure with cost-effective access to the capital markets.
Structure
The Company was formed in November 1993 as a Maryland corporation and is the general partner of the Operating Partnership. On December 31, 2006, it owned a 72.8% interest in the Operating Partnership (such interest has been calculated as the percentage of outstanding common and preferred units in the Operating Partnership owned by the Company divided by the total outstanding common shares, preferred shares, and UPREIT Units outstanding) – one percent as sole general partner and the remainder as a limited partner through its wholly owned subsidiary, Home Properties I, LLC, which owns 100% of the limited partner, Home Properties Trust. A portion of the limited partner interests held by Home Properties Trust as of December 31, 2006 consisted of all of the Series F Limited Partnership Units (2,400,000 units, or 4.9% of the total). Those preferred interests in the Operating Partnership have rights and preferences that mirror the rights and preferences of the holders of the related series of preferred shares in the Company. The remaining units (32,615,310 or 66.9% of the total) held by Home Properties Trust have basically the same rights as the other holders of the other UPREIT Units. Those other holders are certain individuals and entities who received UPREIT Units as consideration for their interests in entities owning apartment communities purchased by the Operating Partnership, including certain officers and directors of the Company.
The Operating Partnership is a New York limited partnership formed in December 1993. Holders of UPREIT Units in the Operating Partnership may redeem an UPREIT Unit for one share of the Company's common stock or cash equal to the fair market value at the time of the redemption, at the option of the Company. Management expects that it will continue to utilize UPREIT Units as a form of consideration for a portion of its acquisition properties.
HPRS is and HP Management was, prior to its merger into HPRS in November 2006, a wholly owned subsidiary of the Company, and as a result the accompanying consolidated financial statements include the accounts of both companies. HPRS is and HP Management was a taxable REIT subsidiary under the Tax Relief Extension Act of 1999. HP Management was formed in January 1994 and HPRS was formed in December 1995. Both companies managed, for a fee, certain of the commercial, residential and development activities of the Company and provided construction, development and redevelopment services for the Company. With the transfers of the affordable management properties and commercial management contracts, the amount of activity in HPRS and HP Management was minimal in 2006 and HP Management therefore was merged into HPRS.
In September 1997, Home Properties Trust ("QRS") was formed as a Maryland real estate trust and as a qualified REIT subsidiary. The QRS is wholly owned by Home Properties I, LLC which is owned 100% by the Company. The QRS is a limited partner of the Operating Partnership and holds all of the Company’s interest in the Operating Partnership, except for the 1% held directly by the Company as sole general partner.
The Company currently has approximately 1,200 employees and its executive offices are located at 850 Clinton Square, Rochester, New York 14604. Its telephone number is (585) 546-4900.

6
Operating Strategies
The Company will continue to focus on enhancing investment returns by: (i) developing new apartments and acquiring apartment communities and repositioning those apartment communities for long-term growth at prices that provide a positive spread over the Company's long-term blended cost of capital; (ii) recycling assets by disposing of properties in low growth markets and those that have reached their potential or are less efficient to operate due to size or remote location; (iii) balancing its decentralized property management philosophy with the efficiencies of centralized support functions and accountability including volume purchasing; (iv) enhancing the quality of living for the Company's residents by improving the service and physical amenities available at each community every year; (v) adopting new technology so that the time and cost spent on administration can be minimized while the time spent attracting and serving residents can be maximized; (vi) continuing to utilize its written "Pledge" of customer satisfaction that is the foundation on which the Company has built its brand recognition; and (vii) focusing on reducing expenses while constantly improving the level of service to residents.
Acquisition and Sale Strategies
The Company's strategy is to grow primarily through acquisitions in the suburbs of major metropolitan markets that have significant barriers to new construction, easy access to the Company's headquarters, and enough apartments available for acquisition to achieve a critical mass. Targeted markets also possess other characteristics, including acquisition opportunities below replacement costs, a mature housing stock, high average single-family home prices and stable or moderate job growth. The Company currently expects that its growth will be focused primarily within suburban sub-markets of selected metropolitan areas within the Northeast, Mid-Atlantic and Southeast Florida regions of the United States where it has already established a presence. The largest metropolitan areas the Company will focus on include Baltimore, Boston, New York City, Philadelphia, Southeast Florida, and Washington, D.C. The Company may expand into new markets that possess the characteristics described above. Continued geographic specialization is expected to have a greater impact on operating efficiencies versus widespread accumulation of properties. The Company will continue to pursue the acquisition of individual properties as well as multi-property portfolios. It may also consider strategic investments in other apartment companies, as well as strategic alliances, such as joint ventures. The Company has anticipated closing on acquisitions of $400 million in its budget for 2007.
During 2006, the Company acquired eight communities with a total of 3,067 units for an aggregate consideration of $360.1 million, or an average of approximately $117,400 per apartment unit. The weighted average expected first year capitalization rate for the acquired communities was 6.7%. Capitalization rate ("cap rate") is defined as the rate of interest used to convert the first year expected net operating income ("NOI") less a 3.0% management fee into a single present value. NOI is defined by the Company as rental income and property other income less operating and maintenance expenses. The acquisitions were concentrated in Boston, Baltimore and Washington, D.C.
During 2006, the Company completed the sale of 39 communities with a total of 9,705 units for an aggregate consideration of $495.3 million, at a weighted average expected first-year cap rate of 7.6%. Of the properties, 37 sold were in markets that management viewed as mature markets (Detroit and Upstate New York) where the properties had reached their potential. The Company recycled the proceeds from those properties, which were expected to produce a weighted average unleveraged internal rate of return ("IRR") of 7.4%, with the purchase of properties expected to produce an unleveraged IRR of 9.0%. IRR is defined as the discount rate at which the present value of the future cash flows of the investment is equal to the cost of the investment. Several of the properties sold were originally acquired through transactions where the sellers received UPREIT Units as consideration in order to provide them with the opportunity to defer tax obligations. We refer to these transactions as "UPREIT transactions." Generally, in UPREIT transactions, the Company has made certain commitments to the sellers regarding the Company's sale of the property. As a result, tax deferred Section 1031 exchanges were used to continue to defer taxable gains of the UPREIT investor.
The Company will continue to contemplate the sale of some of its communities. Typically, a property will be targeted for sale if management is of the opinion that it has reached its potential or if it is located in a slower growth market or is less efficient to operate. A certain number of the properties may originally have been acquired through UPREIT transactions. Therefore, those sales will have to be matched with suitable acquisitions using a tax deferred exchange. The Company has anticipated closing on sales of $50 million in its budget for 2007.

7
Financing and Capital Strategies
The Company intends to adhere to the following financing policies: (i) maintaining a ratio of debt-to-total market capitalization (total debt of the Company as a percentage of the market value of outstanding diluted common stock (including the common stock equivalents of the UPREIT Units) plus total debt) of approximately 55% or less; (ii) utilizing primarily fixed rate debt; (iii) varying debt maturities to avoid significant exposure to interest rate changes upon refinancing; and (iv) maintaining a line of credit so that it can respond quickly to acquisition opportunities.
On December 31, 2006, the Company's debt was approximately $2.1 billion and the debt-to-total market capitalization ratio was 42.9% based on the year-end closing price of the Company's common stock of $59.27. The weighted average interest rate on the Company's mortgage debt as of December 31, 2006 was 5.8% and the weighted average maturity was approximately six and one-half years. Debt maturities are staggered, ranging from June 2007, through January 2042. As of December 31, 2006, the Company had an unsecured line of credit facility from M&T Bank of $140 million. This facility is available for acquisition and other corporate purposes and bears an interest rate at 0.75% over the one-month LIBOR rate. As of December 31, 2006, the one-month LIBOR rate was 5.3% and there was nothing outstanding on the line of credit.
Management expects to continue to fund a portion of its continued growth by taking advantage of its UPREIT structure and using UPREIT Units as currency in acquisition transactions. During 2006, the Company issued $20.4 million of UPREIT Units as consideration for one acquired property. During 2005, the Company issued $55.6 million worth of UPREIT Units as consideration for three acquired properties. It is difficult to predict the level of demand from sellers for this type of transaction.
During periods when the Company's shares are trading at a premium to its estimate of net asset value ("NAV"), it is unlikely that management would engage in share repurchases. In such circumstances, it is more likely that management would pursue issuing equity in order to raise capital to be used to pay down existing indebtedness. This should be neutral to both earnings per share and NAV, increase the level of unencumbered assets and better position the Company to fund future acquisition and development pipeline needs.
The Company's Board of Directors has approved a stock repurchase program under which the Company may repurchase shares of its outstanding common stock and UPREIT Units. Shares or units may be repurchased through the open market or in privately-negotiated transactions. The Company's strategy is to opportunistically repurchase shares at a discount to its underlying net asset value, thereby continuing to build value for long-term shareholders. At December 31, 2004, there was approval remaining to purchase 2,000,000 shares. On each of February 16, 2005 and November 4, 2005, the Board of Directors approved a 2,000,000-share increase in the stock repurchase program. During 2005, the Company repurchased 2,779,805 shares of its outstanding common stock at a cost of $111.7 million at a weighted average price of $40.20 per share. During 2006, the Company repurchased 2,613,747 shares of its outstanding common stock at a cost of $142.5 million at a weighted average price of $54.53 per share. On October 27, 2006, the Board of Directors approved an additional 2,000,000-share increase in the stock repurchase program, resulting in a remaining authorization level of 2,606,448 shares as of December 31, 2006.

8
Competition
The Company’s properties are primarily located in developed areas where there are other multi-family properties which directly compete for residents. There is also competition from single family homes and condominiums for sale or rent. The competitive environment may have a detrimental effect on the Company’s ability to lease apartments at existing and at newly developed properties, as well as on rental rates.
In addition, the Company competes with other real estate investors in seeking property for acquisition and development. These competitors include pension and investment funds, insurance companies, private investors, local owners and developers and other apartment REITs. This competition could increase prices for properties that the Company would like to purchase and impact the Company’s ability to achieve its long-term growth targets.
The Company believes, however, that it is well positioned to compete effectively for both residents and properties as a result of its:
• focus on service and resident satisfaction, as evidenced by The Home Properties Pledge, which provides a money-back service guarantee and lease flexibility;
• ability to issue UPREIT Units in purchase transactions, which provides sellers with the opportunity to defer taxes; and
• unique re-positioning strategy that differentiates the Company from its competitors both for residents and properties.
Market Environment
The markets in which Home Properties operates could be characterized as stable, with moderate levels of job growth. For 2006, there continues to be the trend of slightly lower job growth in the Company's markets of 1.2% compared to 1.7% for the country.
The information on the Market Demographics and Multifamily Supply and Demand tables on Pages 9 and 10 were compiled by the Company from the sources indicated on the tables. The methods used include estimates and, while the Company feels that the estimates are reasonable, there can be no assurance that the estimates are accurate. There can also be no assurance that the historical information included on the table will be consistent with future trends.
New construction in the Company's markets is low relative to the existing multifamily housing stock and compared to other regions of the country. In 2006, Home Properties' markets represented 27.7% of the total estimated existing U.S. multifamily housing stock, but only 19.9% of the country's estimated net new supply of multifamily housing units.
An analysis of future multifamily supply compared to projected multifamily demand can indicate whether a particular market is tightening, softening or in equilibrium. The fourth to last column in the Multifamily Supply and Demand table on Page 10 reflects current estimated net new multifamily supply as a percentage of new multifamily demand for the Company's markets and the United States. In 2006, net new multifamily supply as a percent of net new multifamily demand in Home Properties' markets was approximately 65%, compared to a national average of 68%. Both Home Properties' markets and the country as a whole seem to be tightening on a measurement of supply/demand equilibrium. In 2005, these same percentages were 71% and 81% for the Company and the country, respectively. On a year over year basis, there seems to be less supply to meet the estimated demand.
The third to the last column in the Multifamily Supply and Demand table on Page 10 shows the estimated net new multifamily supply as percent of existing multifamily housing stock. In the Company's markets, net new supply only represents 0.6% of the existing multifamily housing stock. This compares to the national average net new multifamily supply estimates at 0.8% of the multifamily housing stock.

9
Market Demographics
December December 2006 Job Job Multifamily Growth Growth 2006 Units as a % 2006
% of 2006 Trailing Trailing December Median of Total Multifamily Owned Number of 12 Months 12 Months Unemployment Home Housing Units Housing
MSA Market Area Units Households % Change Actual Rate Value Stock (4) Stock (5) Northern VA/DC 25.9% 1,980,700 2.4% 71,200 2.9% 314,752 30.9% 642,981 Suburban New York City (1) 22.6% 6,842,970 0.6% 54,400 3.7% 385,095 44.9% 3,272,898 Baltimore, MD 18.0% 1,032,049 1.1% 14,800 3.8% 246,006 21.9% 240,707 Eastern PA (2) 17.5% 2,526,694 1.2% 38,000 3.9% 185,800 19.3% 521,041 Chicago, IL 6.0% 3,416,814 1.1% 52,000 3.9% 232,978 32.5% 1,181,709 Boston, MA 5.8% 1,710,643 0.7% 17,000 4.4% 379,590 33.2% 593,994 Southeast Florida (3) 2.3% 2,055,392 2.3% 56,700 3.1% 206,634 41.8% 971,424 Portland, ME 1.9% 212,885 0.5% 1,000 3.3% 217,379 17.2% 43,266 Home Properties Markets 100.0% 19,778,147 1.2% 305,100 3.6% 290,192 35.3% 7,468,020 United States 112,267,302 1.7% 2,301,000 4.6% 161,602 21.7% 26,915,288 (1) Suburban New York City is defined for this report as New York-Northern New Jersey-Long Island, NY-NJ-PA MSA. (2) Eastern Pennsylvania is defined for this report as Philadelphia-Camden-Wilmington, PA-NJ-DE-MD MSA & Allentown-Bethlehem-Easton PA-NJ MSA. (3) Southeast Florida is defined for this report as Miami-Fort Lauderdale-Miami Beach, FL MSA. (4) Based on Claritas 2006 estimates calculated from the 2000 U.S. Census figures. (5) 2006 Multifamily Housing Stock is from Claritas estimates based on the 2000 U.S. Census. Sources: Bureau of Labor Statistics (BLS); Claritas, Inc.; US Census Bureau - Manufacturing & Construction Div. Data collected is data available as of February 8, 2007 and in some cases may be preliminary. BLS is the principal fact-finding agency for the Federal Government in the broad field of labor economics and statistics. Claritas, Inc. is a leading provider of precision marketing solutions and related products/services. U.S. Census Bureau's parent federal agency is the U.S. Dept. of Commerce, which promotes American business and trade.

10
Multifamily Supply and Demand
Estimated Estimated Estimated Net New Net New Estimated Estimated 2006 Multifamily Multifamily 2006 Estimated 2006 New Supply as a Supply as a Expected
New 2006 Net New Multifamily % of New % of Expected Excess Supply of Multifamily Multifamily Household Multifamily Multifamily Excess Revenue
MSA Market Area Multifamily(6) Obsolescence (7) Supply (8) Demand (9) Demand Stock Demand (10) Growth (11) Northern VA/DC 8,745 3,215 5,530 14,675 37.7% 0.9% 9,145 1.4% Suburban New York City (1) 29,692 16,364 13,328 16,292 81.8% 0.4% 2,964 0.1% Baltimore, MD 1,699 1,204 495 2,162 22.9% 0.2% 1,667 0.7% Eastern PA (2) 3,643 2,605 1,038 4,892 21.2% 0.2% 3,854 0.7% Chicago, IL 14,432 5,909 8,523 11,272 75.6% 0.7% 2,749 0.2% Boston, MA 6,301 2,970 3,331 3,765 88.5% 0.6% 434 0.1% Southeast Florida 17,738 4,857 12,881 15,808 81.5% 1.3% 2,927 0.3% Portland, ME 220 216 4 115 3.5% 0.0% 111 0.3% Home Properties Markets 82,470 37,340 45,130 68,981 65.4% 0.6% 23,851 0.3% United States 360,999 134,576 226,423 333,044 68.0% 0.8% 106,621 0.4% (1)-(5) see footnotes prior page (6) Estimated 2006 New Supply of Multifamily = Multifamily permits (2006 figures U.S. Census Bureau, Mfg. & Constr. Div., 5+ permits only) adjusted by
the average % of permits resulting in a construction start (estimated at 95%). (7) Estimated 2006 Multifamily Obsolescence = 0.5% of Estimated 2006 multifamily housing stock. (8) Estimated 2006 Net New Multifamily Supply = Estimated 2006 New Supply of Multifamily - Estimated 2006 multifamily obsolescence. (9) Estimated 2006 New Multifamily Household Demand = Trailing 12 month job growth (Nonfarm, not seasonally adjusted payroll employment figures)
(12/31/2005-12/31/2006) multiplied by the expected % of new household formations resulting from new jobs (66.7%) and the % of multifamily households in each market (based on Claritas estimates).
(10) Expected Excess Demand = Estimated 2006 New Multifamily Household Demand - Estimated 2006 Net New Multifamily Supply. (11) Expected Excess Revenue Growth = Expected Excess Demand divided by 2006 Multifamily Housing Stock. This percentage is expected to reflect the
relative impact that changes in the supply and demand for multifamily housing units will have on occupancy rates and/or rental rates in each market, beyond the impact caused by broader economic factors, such as inflation and interest rates.

11
Environmental Matters
Under various laws and regulations relating to the protection of the environment, an owner of real estate may be held liable for the costs of removal or remediation of certain hazardous or toxic substances located on or in its property. Environmental laws include those regulating the existence of asbestos-containing materials, management of surfaces with lead-based paints (including related required notices to residents), use of and/or the existence of underground storage tanks and waste management activities. These laws often impose liability without regard to whether the owner was responsible for, or even knew of, the presence of such substances. The presence of such substances may adversely affect the owner's ability to rent or sell the property or use the property as collateral. Independent environmental consultants have conducted "Phase I" environmental site assessments (which involve visual inspection but not soil or groundwater analysis) on substantially all of the Owned Properties. Phase I assessments did not reveal any environmental liability that would have a material adverse effect on the Company. In addition, the Company is not aware of any environmental liability that management believes would have a material adverse effect on the Company. There is no assurance that Phase I assessments would reveal all environmental liabilities or that environmental conditions not known to the Company may exist now or in the future which would result in liability to the Company for remediation or fines, either under existing laws and regulations or future changes to such requirements.
Available Information
The Company’s annual reports on Form 10-K, quarterly reports on Form 10-Q, current reports on Form 8-K and other reports required by Sections 13(a) and 15(d) of the Securities Exchange Act of 1934, as amended, are electronically filed with the Securities and Exchange Commission (“SEC”). The public may read and copy any materials the Company files with the SEC at the SEC’s Public Reference Room at 100 F Street NE, Washington, DC 20549-2521. Please call the SEC at 1-800-SEC-0330 for further information on the operation of the Public Reference Room. The SEC maintains a Web site at www.sec.gov that contains reports, proxy and information statements, and other information regarding issuers that file electronically with the SEC.
Company Web Site
The Company maintains an Internet Web site at www.homeproperties.com. The Company provides free of charge access to its reports filed with the SEC, and any amendments thereto, through this Web site. These reports are available as soon as reasonably practicable after the reports are filed electronically with the SEC and are found under "Investors/Financials/SEC Filings." In addition, paper copies of annual and periodic reports filed with the SEC may be obtained at no charge by contacting the Corporate Secretary, Home Properties, Inc., 850 Clinton Square, Rochester, New York 14604. The address is also included within the SEC filings or under "Investors/Shareholder Services/Contact Information," on the Company's Web site.
Current copies of the Company’s Code of Business Conduct and Ethics, Code of Ethics for Senior Financial Officers, Corporate Governance Guidelines and Charters for the Audit, Compensation, Corporate Governance/Nominating and Real Estate Investment Committees of the Board of Directors are also available on the Company’s Web site under the heading “Investors/Corporate Governance/Highlights.” Copies of the these documents are also available at no charge upon request addressed to the Corporate Secretary at Home Properties, Inc., 850 Clinton Square, Rochester, New York 14604. The address is also included on the Company’s Web site under “Investors/Shareholder Services/Contact Information”.
The reference to our Web site does not incorporate by reference the information contained in the Web site and such information should not be considered a part of this report.

12
Item 1A. Risk Factors
As used in this section, references to "we" or "us" or "our" refer to the Company, the Operating Partnership, and HPRS.
The following risks apply to Home Properties, the Operating Partnership, and HPRS, in addition to other risks and factors set forth elsewhere in this Form 10-K.
Real Estate Investment Risks
We are subject to risks that are part of owning real estate.
Real property investments are subject to varying degrees of risk. If our communities do not generate revenues sufficient to meet operating expenses, including debt service and capital expenditures, our cash flow and ability to make distributions to our stockholders will be adversely affected. A multifamily apartment community’s revenues and value may be adversely affected by the general economic conditions; local economic conditions; local real estate considerations (such as over supply of or reduced demand for apartments); the perception by prospective residents of the safety, convenience and attractiveness of the communities or neighborhoods in which they are located and the quality of local schools and other amenities; and increased operating costs (including real estate taxes and utilities). Certain significant fixed expenses are generally not reduced when circumstances cause a reduction in income from the investment.
We depend on rental income for cash flow to pay expenses and make distributions.
We are dependent on rental income to pay operating expenses and to generate cash to enable us to make distributions to our stockholders. If we are unable to attract and retain residents or if our residents are unable, due to an adverse change in the economic condition of the region or otherwise, to pay their rental obligations, our ability to make expected distributions will be adversely affected. In addition, the weather and other factors outside of our control can result in an increase in the operating expenses for which we are responsible.
Real estate investments are relatively illiquid, and we may not be able to respond to changing conditions quickly.
Real estate investments are relatively illiquid and, therefore, we have limited ability to vary our portfolio quickly in response to changes in economic or other conditions. In addition, the prohibition in the Internal Revenue Code (the “Code”) on REITs holding property for sale and related regulations may affect our ability to sell properties without adversely affecting distributions to stockholders. A significant number of our properties were acquired using UPREIT Units and are subject to certain agreements, which restrict our ability to sell such properties in transactions that would create current taxable income to the former owners.
Our business is subject to competition.
We plan to continue to acquire additional multifamily residential properties in the Northeast, Mid-Atlantic and Southeast Florida regions of the United States. There are a number of multifamily developers and other real estate companies that compete with us in seeking properties for acquisition, prospective residents and land for development. Most of our properties are in developed areas where there are other properties of the same type. Competition from other properties may affect our ability to attract and retain residents, to increase rental rates and to minimize expenses of operation. Competition for the acquisition of properties could increase prices for the types of properties we would like to pursue and adversely affect our financial performance.
Repositioning and development risks could affect our profitability.
A key component of our strategy is to acquire properties and to reposition them for long-term growth. In addition, we have developed and are in the process of developing new apartment units. We plan to continue to expand our development activities. A variety of factors could negatively impact our ability to timely complete repositioning activities and to develop new units within anticipated budgets and time-lines. These include delays in obtaining

13
necessary governmental permits and authorizations and increased costs of construction. Our inability to charge rents that will be sufficient to offset the effects of these delays and any increase in costs may impair our profitability.
Short-term leases expose us to the effects of declining market conditions.
Virtually all of the leases for our Properties are short-term leases (generally, one year or less). Typically, our residents can leave after the end of a one-year lease term. As a result, our rental revenues are impacted by declines in market conditions more quickly than if our leases were for longer terms.
A significant uninsured property or liability loss could adversely affect us in a material way.
Certain extraordinary losses may not be covered by our comprehensive liability, fire, extended and rental loss insurance. If an uninsured loss occurred, we could lose our investment in, and cash flow from, the affected property (but we would be required to repay any indebtedness secured by that property and related taxes and other charges).
Compliance with laws and regulations may be costly.
Many laws and governmental regulations are applicable to the Properties and changes in the laws and regulations, or their interpretation by agencies and the courts, occur frequently. Under the Americans with Disabilities Act of 1990 (the "ADA"), all places of public accommodation are required to meet certain federal requirements related to access and use by disabled persons. In addition, the Fair Housing Amendments Act of 1988 (the "FHAA") requires apartment communities first occupied after March 13, 1990 to be accessible to the handicapped. Non-compliance with the ADA or the FHAA could result in the imposition of fines or an award of damages to private litigants. Management believes that the Properties are substantially in compliance with present ADA and FHAA requirements. Under the Federal Fair Housing Act and state fair housing laws, discrimination on the basis of certain protected classes is prohibited. Violation of these laws can result in significant damage awards to victims. The Company has a strong policy against any kind of discriminatory behavior and trains its employees to avoid discrimination or the appearance of discrimination. There is no assurance, however, that an employee will not violate the Company's policy against discrimination and thus violate fair housing laws. This could subject the Company to legal actions and the possible imposition of damage awards.
Real Estate Financing Risks
There are general risks related to debt.
We are subject to the customary risks associated with debt financing including the potential inability to refinance existing mortgage indebtedness upon maturity on favorable terms. If a property is mortgaged to secure payment of indebtedness and we are unable to meet its debt service obligations, the property could be foreclosed upon. This could adversely affect our cash flow and, consequently, the amount available for distributions to stockholders.
There is no legal limit on the amount of debt we can incur.
The Board of Directors has adopted a policy of limiting our indebtedness to approximately 55% of our total market capitalization (with the equity component of total market capitalization based on the per share net asset value published by Home Properties in its most recent quarterly earnings press release), but our organizational documents do not contain any limitation on the amount or percentage of indebtedness, we may incur. Accordingly, the Board of Directors could alter or eliminate its current policy on borrowing. If this policy were changed, we could become more highly leveraged, resulting in an increase in debt service that could adversely affect our ability to make expected distributions to stockholders and increase the risk of default on our indebtedness. Our net asset value fluctuates based on a number of factors. Our line of credit agreement and agreement with holders of our preferred stock limit the amount of indebtedness we may incur.

14
We may not be able to refinance our debt when it matures.
We are subject to the risks normally associated with debt financing, including the risk that our cash flow will be insufficient to meet the required payments of principal and interest. Because a significant amount of the financing is not fully self-amortizing, we anticipate that only a portion of the principal of our indebtedness will be repaid prior to maturity. So, we will need to refinance debt. Accordingly, there is a risk that we will not be successful in refinancing existing indebtedness or that the terms of such refinancing will not be as favorable as the terms of the existing indebtedness. We aim to stagger our debt maturities with the goal of minimizing the amount of debt which must be refinanced in any year.
Financing may not be available and issuing equity could dilute our stockholders' interests.
Our ability to execute our business strategy depends on our access to an appropriate blend of debt financing, including unsecured lines of credit and other forms of secured and unsecured debt, and equity financing, including common and preferred equity. Debt or equity financing may not be available in sufficient amounts, or on favorable terms or at all. If we issue additional equity securities to finance developments and acquisitions instead of incurring debt, the interests of our existing stockholders could be diluted.
Federal Income Tax Risks
There is no assurance that we will continue to qualify as a REIT.
We believe that we have been organized and have operated in such manner so as to qualify as a REIT under the Code, commencing with our taxable year ended December 31, 1994. A REIT generally is not taxed at the corporate level on income it currently distributes to its shareholders as long as it distributes currently at least 90% of its taxable income (excluding net capital gain). No assurance can be provided, however, that we have qualified or will continue to qualify as a REIT or that new legislation, Treasury Regulations, administrative interpretations or court decisions will not significantly change the tax laws with respect to our qualification as a REIT or the federal income tax consequences of such qualification.
We are required to make certain distributions to qualify as a REIT, and there is no assurance that we will have the funds necessary to make the distributions.
In order to continue to qualify as a REIT, we currently are required each year to distribute to our stockholders at least 90% of our taxable income (excluding net capital gain). In addition, we will be subject to a 4% nondeductible excise tax on the amount, if any, by which certain distributions made by us with respect to the calendar year are less than the sum of 85% of our ordinary income, 95% of our capital gain net income for that year, and any undistributed taxable income from prior periods. We intend to make distributions to our stockholders to comply with the 90% distribution requirement and to avoid the nondeductible excise tax and will rely for this purpose on distributions from the Operating Partnership. However, differences in timing between taxable income and cash available for distribution could require us to borrow funds or to issue additional equity to enable us to meet the 90% distribution requirement (and, therefore, to maintain our REIT qualification) and to avoid the nondeductible excise tax. The Operating Partnership is required to pay (or reimburse us, as its general partner, for) certain taxes and other liabilities and expenses that we incur, including any taxes that we must pay in the event we were to fail to qualify as a REIT. In addition, because we are unable to retain earnings (resulting from REIT distribution requirements), we will generally be required to refinance debt that matures with additional debt or equity. There can be no assurance that any of these sources of funds, if available at all, would be available to meet our distribution and tax obligations.
Our failure to qualify as a REIT would have adverse consequences.
If we fail to qualify as a REIT, we will be subject to federal income tax (including any applicable alternative minimum tax) on our taxable income at regular corporate rates. In addition, unless entitled to relief under certain statutory provisions, we will be disqualified from treatment as a REIT for the four taxable years following the year during which REIT qualification is lost. The additional tax burden on us would significantly reduce the cash available for distribution by us to our stockholders. Our failure to qualify as a REIT could reduce materially the
15
value of our common stock and would cause all our distributions to be taxable as ordinary income to the extent of our current and accumulated earnings and profits (although, subject to certain limitations under the Code, corporate distributees may be eligible for the dividends received deduction with respect to these distributions).
The Operating Partnership intends to qualify as a partnership but there is no guaranty that it will qualify.
We believe that the Operating Partnership qualifies as a partnership for federal income tax purposes. No assurance can be provided, however, that the Internal Revenue Service (the “IRS”) will not challenge its status as a partnership for federal income tax purposes, or that a court would not sustain such a challenge. If the IRS were to be successful in treating the Operating Partnership as an entity that is taxable as a corporation, we would cease to qualify as a REIT because the value of our ownership interest in the Operating Partnership would exceed 5% of our assets and because we would be considered to hold more than 10% of the voting securities of another corporation. Also, the imposition of a corporate tax on the Operating Partnership would reduce significantly the amount of cash available for distribution to its limited partners. Finally, the classification of the Operating Partnership as a corporation would cause its limited partners to recognize gain (upon the event that causes the Operating Partnership to be classified as a corporation) at least equal to their “negative capital accounts” (and possibly more, depending upon the circumstances).
Other Risks
The ability of our stockholders to effect a change of control is limited by certain provisions of our Articles of Incorporation as well as by Maryland law and our Executive Retention Plan.
Our Articles of Amendment and Restatement of the Articles of Incorporation, as amended (the “Articles of Incorporation”), authorize the Board of Directors to issue up to a total of 80 million shares of common stock, 10 million shares of excess stock and 10 million shares of preferred stock and to establish the rights and preferences of any shares issued. Further, under the Articles of Incorporation, the stockholders do not have cumulative voting rights.
In order for us to maintain our qualification as a REIT, not more than 50% in value of our outstanding stock may be owned, directly or indirectly, by five or fewer individuals (as defined in the Code to include certain entities) at any time during the last half of its taxable year. We have limited ownership of the issued and outstanding shares of common stock by any single stockholder to 8.0% of the aggregate value of our outstanding shares
The percentage ownership limit described above, the issuance of preferred stock in the future and the absence of cumulative voting rights could have the effect of: (i) delaying or preventing a change of control of us even if a change in control were in the stockholders’ interest; (ii) deterring tender offers for our common stock that may be beneficial to the stockholders; or (iii) limiting the opportunity for stockholders to receive a premium for their common stock that might otherwise exist if an investor attempted to assemble a block of our common stock in excess of the percentage ownership limit or otherwise to effect a change of control of us.
As a Maryland corporation, we are subject to the provisions of the Maryland General Corporation Law. Maryland law imposes restrictions on some business combinations and requires compliance with statutory procedures before some mergers and acquisitions may occur, which may delay or prevent offers to acquire us or increase the difficulty of completing any offers, even if they are in our stockholders’ best interests. In addition, other provisions of the Maryland General Corporation Law permit the Board of Directors to make elections and to take actions without stockholder approval (such as classifying our Board such that the entire Board is not up to re-election annually) that, if made or taken, could have the effect of discouraging or delaying a change in control.
Also, to assure that our management has appropriate incentives to focus on our business and Properties in the face of a change of control situation, we have adopted an executive retention plan which provides some key employees with salary, bonus and some benefits continuation in the event of a change of control.

16
Potential conflicts of interest could affect some directors' decisions.
Unlike persons acquiring common stock, certain of our directors, who constitute less than a majority of the Board of Directors, own a significant portion of their interest in us through UPREIT Units. As a result of their status as holders of UPREIT Units, those directors and other limited partners may have interests that conflict with stockholders with respect to business decisions affecting us and the Operating Partnership. In particular, those directors may suffer different or more adverse tax consequences than us upon the sale or refinancing of some of the Properties as a result of unrealized gain attributable to those Properties. Thus, those directors and the stockholders may have different objectives regarding the appropriate pricing and timing of any sale or refinancing of Properties. In addition, those directors, as limited partners of the Operating Partnership, have the right to approve certain fundamental transactions such as the sale of all or substantially all of the assets of the Operating Partnership, merger or consolidation or dissolution of the Operating Partnership and certain amendments to the Operating Partnership Agreement.
The future sale of shares may negatively impact our stock price.
Sales of substantial amounts of shares of common stock in the public market or the perception that such sales might occur could adversely affect the market price of the common stock. The Operating Partnership has issued and outstanding approximately 13.3 million UPREIT Units as of December 31, 2006, to persons other than us or the Trust, which may be exchanged on a one-for-one basis for shares of Common Stock under certain circumstances. In addition, Home Properties has granted options to purchase shares of stock to certain directors, officers and employees of Home Properties, of which, as of December 31, 2006, 2,348,014 options remained outstanding and unexercised.
Item 1B. Unresolved Staff Comments
None.
Item 2. Properties
As of December 31, 2006, the Owned Properties consisted of 123 multifamily residential communities containing 36,954 apartment units. At the time of the IPO (August 4, 1994), Home Properties owned 11 communities containing 3,065 units and simultaneously with the closing of the IPO acquired an additional four communities containing 926 units. In 2006, Home Properties acquired 3,067 apartment units in eight communities for a total purchase price of $360.1 million. Also in 2006, the Company sold 39 communities with a total of 9,705 units for total consideration of $495.3 million.
The Owned Properties are generally located in established markets in suburban neighborhoods and are well maintained and well leased. Average economic occupancy at the Owned Properties was 93.9% for 2006. Occupancy is defined as total possible rental income, net of vacancy and bad debt expense as a percentage of total possible rental income. Total possible rental income is determined by valuing occupied units at contract rates and vacant units at market rents. The Owned Properties are typically two- and three-story garden style apartment buildings in landscaped settings and a majority are of brick or other masonry construction. The Company believes that its strategic focus on appealing to middle income residents and the quality of the services it provides to such residents results in lower resident turnover. Average turnover at the Owned Properties was approximately 44% for 2006, which is significantly below the national average of approximately 60% for garden-style apartments.
Resident leases are generally for a one year term. Security deposits equal to one month's rent or less are generally required.
Certain of the Owned Properties secure mortgage loans. See Schedule III contained herein (F-39 to F-42).
The table on the following pages illustrates certain of the important characteristics of the Owned Properties as of December 31, 2006.

17
Communities Wholly Owned and Managed by Home Properties (2) (3) (3) # Age Average 2006 2006 2005 2006 2005 12/31/2006 Of In Year Apt Size % Resident Average % Average % Avg Mo Rent Avg Mo, Rent Total Cost Regional Area Apts Years Acq (Sq Ft) Tumover Occupancy Occupancy Rate per Apt Rate per Apt (000) Core Communities (1) FL - Southeast The Hamptons 668 17 2004 1,052 52% 94% 96% $979 $878 $63,628 FL - Southeast Vinings at Hampton Village 168 17 2004 1,207 42% 94% 95% 1,060 956 15,843 IL - Chicago Blackhawk Apartments 371 45 2000 793 49% 92% 91% 845 827 23,486 IL - Chicago Courtyards Village 224 35 2001 674 50% 96% 94% 771 751 16,579 IL - Chicago Cypress Place 192 36 2000 852 40% 95% 93% 904 887 13,981 IL - Chicago The Colony 783 33 1999 704 50% 95% 93% 816 807 53,939 IL - Chicago The New Colonies 672 32 1998 657 55% 93% 91% 701 699 34,072 MA - Boston Gardencrest Apartments 696 58 2002 847 32% 96% 95% 1,380 1,326 105,291 MA - Boston Stone Ends Apartments 280 27 2003 815 44% 96% 96% 1,212 1,175 37,008 MA - Boston The Village at Marshfield 276 34 2004 735 41% 94% 94% 1,128 1,099 34,014 MD - Baltimore Bonnie Ridge Apartments 960 40 1999 998 39% 93% 92% 1,008 984 77,817 MD - Baltimore Canterbury Apartments 618 28 1999 934 46% 95% 93% 869 829 35,695 MD - Baltimore Country Village Apartments 344 35 1998 776 48% 93% 93% 837 803 22,716 MD - Baltimore Falcon Crest Townhomes 396 37 1999 993 50% 91% 91% 929 883 22,676 MD - Baltimore Fenland Field 234 36 2001 934 45% 92% 94% 1,057 1,025 19,630 MD - Baltimore Gateway Village Apartments 132 17 1999 963 47% 92% 93% 1,205 1,144 10,335 MD - Baltimore Mill Towne Village 384 33 2001 812 42% 94% 95% 816 787 28,200 MD - Baltimore Morningside Heights Apartments 1,050 41 1998 864 45% 94% 94% 830 807 60,667 MD - Baltimore Owings Run Apartments 504 11 1999 1,136 44% 94% 94% 1,080 1,008 43,827 MD - Baltimore Selford Townhomes 102 19 1999 987 44% 94% 92% 1,229 1,193 8,102 MD - Baltimore Shakespeare Park Apartments 84 23 1999 793 19% 98% 97% 825 810 4,973 MD - Baltimore The Manor Apartments (MD) 435 37 2001 1,004 39% 93% 92% 1,123 1,113 46,259 MD - Baltimore Timbercroft Townhomes 284 34 1999 998 17% 99% 99% 797 767 12,858 MD - Baltimore Village Square (MD) 370 38 1999 948 45% 95% 96% 1,085 1,034 24,281 MD - Baltimore Woodholme Manor Apartments 177 37 2001 817 26% 94% 91% 788 733 10,263 ME - Portland Mill Company Gardens 95 55 1998 542 68% 94% 95% 758 747 3,383 ME - Portland Redbank Village Apartments 500 62 1998 735 40% 93% 92% 805 793 25,621 NJ - Northern Chatham Hill Apartments 308 39 2004 944 33% 96% 95% 1,574 1,503 55,508 NJ - Northern East Hill Gardens 33 48 1998 654 24% 98% 96% 1,441 1,386 3,092 NJ - Northern Lakeview Apartments 106 57 1998 492 35% 98% 97% 1,247 1,195 8,424 NJ - Northern Northwood Apartments 134 41 2004 937 38% 94% 97% 1,194 1,139 16,426 NJ - Northern Oak Manor Apartments 77 50 1998 918 26% 98% 97% 1,713 1,682 7,742 NJ - Northern Pleasant View Gardens 1,142 38 1998 746 35% 94% 93% 1,060 1,022 77,204 NJ - Northern Pleasure Bay Apartments 270 35 1998 685 43% 94% 96% 1,054 999 15,626 NJ - Northern Regency Club Apartments 372 32 2004 941 48% 92% 94% 1,105 1,072 41,167 NJ - Northern Royal Gardens Apartments 550 38 1997 874 33% 93% 92% 1,128 1,083 34,709 NJ - Northern Wayne Village 275 41 1998 760 37% 97% 96% 1,281 1,219 22,257 NJ - Northern Windsor Realty Company 67 53 1998 628 48% 94% 95% 1,136 1,101 5,720 NY - Alb/Hudson Valley Carriage Hill Apartments 140 33 1996 898 64% 95% 93% 1,196 1,211 8,501 NY - Alb/Hudson Valley Cornwall Park 75 39 1996 1,320 48% 94% 88% 1,591 1,624 8,243 NY - Alb/Hudson Valley Lakeshore Villa Apartments 152 31 1996 952 53% 90% 93% 1,056 1,049 9,350 NY - Alb/Hudson Valley Patricia Apartments 100 32 1998 725 26% 94% 95% 1,376 1,345 7,888 NY - Alb/Hudson Valley Sherwood Consolidation 224 37 2002 831 33% 96% 97% 1,189 1,090 19,128 NY - Alb/Hudson Valley Sunset Garden Apartments 217 35 1996 840 50% 94% 95% 926 912 10,375 NY - Long Island Bayview & Colonial 160 39 2000 884 31% 95% 96% 1,186 1,150 14,849

18
Communities Wholly Owned and Managed by Home Properties (2) (3) (3) # Age Average 2006 2006 2005 2006 2005 12/31/2006 Of In Year Apt Size % Resident Average % Average % Avg Mo Rent Avg Mo, Rent Total Cost Regional Area Apts Years Acq (Sq Ft) Tumover Occupancy Occupancy Rate per Apt Rate per Apt (000) Core Communities (1) NY - Long Island Cambridge Village Associates 82 39 2002 747 39% 96% 97% 1,536 1,454 8,064 NY - Long Island Coventry Village Apartments 94 31 1998 831 34% 95% 96% 1,357 1,336 6,389 NY - Long Island Devonshire Hills 297 38 2001 803 37% 95% 96% 1,720 1,662 55,348 NY - Long Island East Winds Apartments 96 40 2000 888 40% 95% 93% 1,145 1,117 8,987 NY - Long Island Hawthorne Court 434 38 2002 678 43% 93% 94% 1,361 1,331 48,962 NY - Long Island Heritage Square 80 57 2002 718 25% 98% 97% 1,529 1,441 9,172 NY - Long Island Holiday Square 144 27 2002 570 15% 96% 95% 1,087 1,033 11,638 NY - Long Island Lake Grove Apartments 368 36 1997 836 49% 94% 93% 1,391 1,368 34,138 NY - Long Island Maple Tree 84 55 2000 936 31% 95% 93% 1,153 1,136 7,679 NY - Long Island Mid-Island Apartments 232 41 1997 546 42% 93% 95% 1,257 1,227 16,676 NY - Long Island Rider Terrace 24 45 2000 825 50% 93% 91% 1,245 1,223 2,125 NY - Long Island South Bay Manor 61 46 2000 849 51% 90% 93% 1,536 1,519 7,658 NY - Long Island Southern Meadows 452 35 2001 845 36% 95% 95% 1,352 1,325 49,322 NY - Long Island Stratford Greens Associates 359 32 2002 725 49% 96% 96% 1,399 1,384 54,326 NY - Long Island Terry Apartments 65 30 2000 722 34% 95% 96% 1,151 1,107 5,249 NY - Long Island Westwood Village Apartments 242 37 2002 829 34% 95% 96% 2,154 2,088 40,463 NY - Long Island Woodmont Village Apartments 96 38 2002 704 35% 95% 95% 1,283 1,240 11,180 NY - Long Island Yorkshire Village Apartments 40 37 2002 779 40% 97% 97% 1,560 1,489 4,277 PA - Philadelphia Beechwood Gardens 160 39 1998 875 43% 94% 94% 830 826 7,130 PA - Philadelphia Castle Club Apartments 158 39 2000 878 42% 93% 95% 930 807 13,598 PA - Philadelphia Chesterfield Apartments 247 33 1997 812 39% 96% 96% 901 872 15,453 PA - Philadelphia Curren Terrace 318 35 1997 782 53% 94% 93% 907 906 20,279 PA - Philadelphia Executive House Apartments 100 41 1997 700 55% 92% 95% 938 927 7,088 PA - Philadelphia Glen Brook Apartments 174 43 1999 707 46% 91% 91% 813 771 9,133 PA - Philadelphia Glen Manor Apartments 174 30 1997 667 45% 92% 91% 762 763 8,177 PA - Philadelphia Golf Club Apartments 399 37 2000 857 54% 92% 91% 1,010 1,009 37,789 PA - Philadelphia Hill Brook Place Apartments 274 38 1999 699 49% 94% 96% 874 849 16,923 PA - Philadelphia Home Properties of Bryn Mawr 316 55 2000 822 57% 92% 93% 1,051 1,037 31,491 PA - Philadelphia Home Properties of Devon 631 43 2000 917 58% 93% 90% 1,088 1,062 64,751 PA - Philadelphia Home Properties of Newark 432 38 1999 860 47% 93% 94% 852 827 28,455 PA - Philadelphia New Orleans Park 442 35 1997 685 38% 95% 93% 818 792 25,797 PA - Philadelphia Racquet Club East Apartments 466 35 1998 911 42% 94% 96% 1,022 1,000 33,243 PA - Philadelphia Racquet Club South 103 37 1999 816 45% 94% 96% 876 858 6,398 PA - Philadelphia Ridley Brook Apartments 244 44 1999 925 37% 95% 95% 877 842 13,262 PA - Philadelphia Sherry Lake Apartments 298 41 1998 812 44% 94% 94% 1,159 1,132 27,662 PA - Philadelphia The Landings 384 33 1996 912 52% 95% 93% 960 961 28,310 PA - Philadelphia Trexler Park Apartments 249 32 2000 921 49% 90% 93% 1,051 1,030 22,662 PA - Philadelphia Valley View Apartments 177 33 1997 764 66% 89% 91% 833 807 10,534 PA - Philadelphia Village Square (PA) 128 33 1997 795 41% 95% 93% 909 909 8,033 PA - Philadelphia William Henry Apartments 363 35 2000 938 57% 91% 92% 1,095 1,098 37,114 VA - Suburban DC Braddock Lee Apartments 255 51 1998 757 37% 97% 95% 1,200 1,184 19,251 VA - Suburban DC Brittany Place 591 38 2002 922 42% 92% 92% 1,072 1,051 58,597 VA - Suburban DC Cider Mill 864 28 2002 834 46% 93% 94% 1,055 1,034 92,616 VA - Suburban DC East Meadow Apartments 150 35 2000 1,034 46% 96% 96% 1,262 1,229 14,898 VA - Suburban DC Elmwood Terrace 504 33 2000 946 44% 93% 90% 848 831 28,631

19
Communities Wholly Owned and Managed by Home Properties (2) (3) (3) # Age Average 2006 2006 2005 2006 2005 12/31/2006 Of In Year Apt Size % Resident Average % Average % Avg Mo Rent Avg Mo, Rent Total Cost Regional Area Apts Years Acq (Sq Ft) Tumover Occupancy Occupancy Rate per Apt Rate per Apt (000) Core Communities (1) VA - Suburban DC Falkland Chase Apartments 450 69 2003 759 35% 95% 93% 1,220 1,162 64,518 VA - Suburban DC Orleans Village 851 38 2000 1,015 42% 93% 94% 1,254 1,193 86,359 VA - Suburban DC Park Shirlington Apartments 294 51 1998 858 36% 96% 93% 1,185 1,159 23,109 VA - Suburban DC Seminary Hill Apartments 296 46 1999 888 60% 93% 93% 1,186 1,172 22,232 VA - Suburban DC Seminary Towers Apartments 539 42 1999 879 37% 94% 93% 1,211 1,186 41,922 VA - Suburban DC Tamarron Apartments 132 19 1999 1,075 33% 96% 95% 1,325 1,243 12,051 VA - Suburban DC The Apartments at Wellington Trace 240 4 2004 1,106 53% 96% 97% 1,201 1,166 30,756 VA - Suburban DC The Manor Apartments (VA) 198 32 1999 845 49% 94% 94% 981 973 11,653 VA - Suburban DC The Sycamores 185 28 2002 876 43% 96% 97% 1,285 1,200 23,077 VA - Suburban DC Virginia Village 344 39 2001 1,010 51% 95% 95% 1,210 1,204 35,858 VA - Suburban DC West Springfield Terrace 244 28 2002 1,019 51% 95% 96% 1,336 1,268 37,940 VA - Suburban DC Woodleaf Apartments 228 21 2004 709 35% 93% 93% 1,050 998 22,814 Core Total/Weighted Average 31,253 37 856 44% 94% 94% $1,073 $1,040 $2,702,570 2005 Acquisition Communities (4) MD - Baltimore Ridgeview at Wakefield Valley 204 9 2005 916 51% 94% 93% $1,013 $1,007 $22,373 NJ - Northern Barrington Gardens 148 33 2005 922 22% 97% 95% 853 792 10,029 NJ - Northern Hackensack Gardens 198 58 2005 636 14% 98% 97% 865 805 15,980 NY - Long Island Sayville Commons 342 5 2005 1,106 15% 98% 97% 1,395 1,333 65,079 PA - Philadelphia The Brooke at Peachtree Village 146 20 2005 1,261 34% 97% 97% 1,014 972 17,291 VA - Suburban DC Cinnamon Run 511 46 2005 1,006 35% 95% 98% 1,112 1,041 70,174 VA - Suburban DC Peppertree Farm 881 52 2005 1,051 39% 87% 92% 1,095 1,050 101,744 2005 Total/Weighted Average 2,430 32 1,009 33% 93% 96% $1,096 $996 $302,670 2006 Acquisition Communities (4) MA - Boston Highland House 172 37 2006 733 32% 94% N/A $1,108 N/A $18,257 MA - Boston Liberty Place 107 18 2006 994 50% 93% N/A 1,344 N/A 15,234 MA - Boston The Heights at Marlborough 348 33 2006 876 56% 92% N/A 1,179 N/A 50,604 MA - Boston The Meadows at Marlborough 264 34 2006 855 58% 90% N/A 1,189 N/A 35,452 MD - Baltimore Heritage Woods 164 33 2006 965 41% 97% N/A 928 N/A 14,127 MD - Baltimore The Coves at Chesapeake 469 24 2006 986 57% 89% N/A 1,152 N/A 66,889 MD - Baltimore Top Field 156 33 2006 1,149 27% 97% N/A 1,072 N/A 18,348 ME - Portland Liberty Commons (5) 120 1 2006 1,064 35% 96% N/A 1,074 N/A 14,738 VA - Suburban DC Mount Vernon Square 1,387 32 2006 868 42% 93% N/A 1,076 N/A 143,266 2006 Total/Weighted Average 3,187 27 908 46% 93% N/A $1,142 N/A $376,915 2006 Construction Communities (6) PA - Philadelphia Trexler Park West 84 0 2006 1,071 15% 67% N/A $1,204 N/A $12,042

20
Communities Wholly Owned and Managed by Home Properties (2) (3) (3) # Age Average 2006 2006 2005 2006 2005 12/31/2006 Of In Year Apt Size % Resident Average % Average % Avg Mo Rent Avg Mo, Rent Total Cost Regional Area Apts Years Acq (Sq Ft) Tumover Occupancy Occupancy Rate per Apt Rate per Apt (000) Core Communities (1) Owned Portfolio Total/Weighted Avg 36,954 36 871 44% 94% 94% $1,076 $1,040 $3,394,197 (1) "Core Communities" represents the 31,253 apartment units owned consistently throughout 2005 and 2006. (2) "Resident Turnover" reflects, on an annual basis, the number of moveouts divided by the total number of apartment units. (3) "Average % Occupancy" is the average economic occupancy for the 12 months ended December 31, 2005 and 2006. (4) For communities acquired during 2005 and 2006, this is the average occupancy from the date of acquisition. (5) Liberty Commons was constructed during a period spanning from 2004 to 2006. As construction was completed and 100% of the units were all in service for some part of 2006, this property has
been grouped with the 2006 Acquisition Communities. (6) Trexler Park West is under construction. Upon completion, there will be a total of 216 apartment units. As of December 31, 2006, 84 apartment units were in service.

21
Property Development
The Company has the ability to develop new market-rate communities. It plans to engage in development activity only in markets in which it currently is doing business to add net asset value and supplement future earnings and growth. It expects to develop new apartment communities on raw land and on land adjacent to existing owned properties, as well as to increase the density of units at some communities currently owned.
The Company has completed the development of a 120-unit apartment community in South Portland, Maine adjacent to a market-rate property the Company acquired in 1998. The first phase of the project, consisting of 48 units, was completed in the summer of 2005. The second and third phases added 72 units which were completed in the summer of 2006. The total construction cost of this community was $14.6 million, or approximately $122,000 per unit. In addition, the Company is developing a 216-unit apartment community in Allentown, Pennsylvania, adjacent to a market-rate community purchased in 2000. At year-end 2006, 84 units were completed at a cost of $10.6 million. The entire project is expected to be completed in the fourth quarter of 2008. The total construction cost for this development is anticipated to be $25.9 million upon completion. The costs associated with construction in progress for this development was $1.4 million as of December 31, 2006. An additional project was in the pre-construction stage during 2006. That project is Falkland Chase, located in Silver Spring, Maryland, with 450 garden apartments constructed between 1936 and 1939. The Company acquired the property in 2003 for $58.9 million. The property is well located within walking distance of the metro line into Washington and is near seven million square feet of office space. The Company is planning on redeveloping the North parcel, which will be renamed Falkland North. This parcel currently contains 182 apartments that will be demolished and redeveloped into 1,020 units in four high-rise buildings with a community center, exercise room, swimming pool, convenience retail shops and a major supermarket. If this project progresses as expected, approvals will be obtained in 2007, design completed in 2008, construction started in 2009, and units placed in service in 2011 and 2012. The pre-construction costs for this project, included in other assets on the balance sheet, was $755,000 as of December 31, 2006. Based on preliminary budgets, the total construction cost for this development is anticipated to be $306 million.
During 2006, the Company hired a Vice President of Development who has extensive multifamily development experience in the Mid-Atlantic region and has demonstrated his ability to source projects in that region. The Company’s management of an extensive property portfolio and its acquisition activities also provide a source of potential new development opportunities.
On February 2, 2007, the Company purchased two land parcels located in Silver Spring, MD and Alexandria, VA from a single seller for total consideration of $46.5 million. The projects are fully designed and have obtained all discretionary approvals. While several administrative approvals are still necessary, construction on both projects is expected to start in 2007, with completion anticipated in 2009 for the Maryland project and 2010 for the Virginia project. The development in Silver Spring, Maryland is a 14-story building which will contain 247 apartments and 10,600 square feet of retail or nonresidential space. The property is approximately three blocks south of Home Properties’ Falkland Chase apartment community described above. The other development parcel is adjacent to the Huntington Metro station just south of Old Town Alexandria in Fairfax County, Virginia and consists of 421 units in four, four-story buildings. Based on preliminary budgets, the Silver Spring project is anticipated to cost approximately $74 million and the Alexandria project is estimated to cost approximately $123 million upon completion.
Property Management
As of December 31, 2006, the Managed Properties consist of: (i) 868 apartment units where Home Properties is the general partner of the entity that owns the property; and (ii) 1,314 apartment units managed for others.
On January 1, 2004, the Company sold certain assets of its commercial property management division to Home Leasing LLC, which was owned by Nelson and Norman Leenhouts and is now owned by Nelson Leenhouts. Nelson and Norman Leenhouts are the founders of the Company, former Co-Chief Executive Officers of the Company, and current Co-Chairs of the Company's Board of Directors (the "Leenhoutses"). This division managed approximately 2.2 million square feet of gross leasable area, as well as certain planned communities. The majority of the managed commercial properties are and have been owned in whole or in part by the Leenhoutses since before the Company's IPO in 1994. Subsequently, some of the assets were transferred from Home Leasing to Broadstone

22
Real Estate, LLC (“Broadstone”), which is owned in part by Norman Leenhouts, Amy L. Tait and Mrs. Tait's spouse. The sale was completed in order to permit the Company to focus solely on the direct ownership and management of market-rate apartment communities. The contribution from the commercial property management division to Home Properties’ 2003 earnings was significantly less than one-half of one percent. The initial amount paid was $82,000. In addition, the Company is entitled to receive a percentage of the management fee received by Broadstone and its assigns in connection with the management of one of the commercial properties for a period not to exceed 36 months. As Broadstone continued to manage that property for three years, the Company received an additional deferred purchase price of $139,000, for a total consideration of $221,000. The gain on sale amounted to approximately $108,000 for the three years ended December 31, 2006.
The Company may pursue the management of additional properties not owned by the Company, but will only do so when such additional properties can be effectively and efficiently managed in conjunction with other properties owned or managed by Home Properties, or where the Company views the properties as potential acquisitions in desirable markets.
The following table details managed multifamily communities broken down by market area.
Communities Managed by Home Properties by Market Area as of December 31, 2006 Community Managed as General Partner
MARKET AREA/Community City # of Apts.
NORTHERN/CENTRAL OHIO Briggs/Wedgewood Apartments Columbus 868
Total Apt. Units in Community Managed as General Partner 868 Communities Fee Managed
MARYLAND Annapolis Roads Apartments Annapolis 282 Dunfield Townhomes Baltimore 312 Fox Hall Baltimore 720
Total Apt. Units in Communities Fee Managed 1,314 Total 2,182
Supplemental Property Information
At December 31, 2006, none of the Properties have an individual net book value equal to or greater than ten percent of the total assets of the Company or would have accounted for ten percent or more of the Company's aggregate gross revenues for 2006. There is no tenant who has one or more leases which, in the aggregate, account for more than 10% of the aggregate gross revenues for the year ended December 31, 2006.
Item 3. Legal Proceedings
The Company is subject to a variety of legal actions for personal injury or property damage arising in the ordinary course of its business, most of which are covered by liability insurance. Various claims of employment and resident discrimination are also periodically brought. While the resolution of these matters cannot be predicted with certainty, management believes that the final outcome of such legal proceedings and claims will not have a material adverse effect on the Company's liquidity, financial position or results of operations.
Item 4. Submission of Matters to Vote of Security Holders
None.

23
Item 4A. Executive Officers
The following table sets forth, as of February 16, 2007, the eight executive officers of the Company, together with their respective ages, positions and offices.
Name Age Position
Edward J. Pettinella 55 President and Chief Executive Officer of Home Properties and HPRS
David P. Gardner 51 Executive Vice President and Chief Financial Officer of Home Properties and HPRS
Ann M. McCormick 50 Executive Vice President, General Counsel and Secretary of Home Properties and HPRS
Scott A. Doyle 45 Senior Vice President, Property Management of Home Properties and HPRS
Johanna A. Falk 42 Senior Vice President and Chief Administrative/Information Officer of Home Properties and HPRS
Robert J. Luken 42 Senior Vice President, Chief Accounting Officer and Treasurer of Home Properties and HPRS
Janine M. Schue 44 Senior Vice President, Human Resources of Home Properties and HPRS
John E. Smith 56 Senior Vice President and Chief Investment Officer of Home Properties and HPRS
Information regarding Edward Pettinella is set forth below under "Directors" in Item 10.
David P. Gardner has served as Executive Vice President of the Company since 2004 and a Vice President and Chief Financial Officer of the Company since its inception. He holds the same titles in HPRS. Mr. Gardner joined Home Leasing Corporation in 1984 as Vice President and Controller. In 1989, he was named Treasurer of Home Leasing and Chief Financial Officer in December 1993. From 1977 until joining Home Leasing, Mr. Gardner was an accountant at Cortland L. Brovitz & Co. Mr. Gardner is a graduate of the Rochester Institute of Technology and is a Certified Public Accountant.
Ann M. McCormick has served as Executive Vice President since 2004 and a Vice President, General Counsel and Secretary of the Company since its inception. She holds the same titles in HPRS. Mrs. McCormick joined Home Leasing in 1987 and was named Vice President, Secretary and General Counsel in 1991. Prior to joining Home Leasing, she was an associate with the law firm of Nixon Peabody LLP. Mrs. McCormick is a graduate of Colgate University and holds a Juris Doctor from Cornell University. She is on the Board of Directors of Greater Rochester Housing Partnership, the Alzheimer’s Association of the Finger Lakes, and St. Ann's of Greater Rochester, Inc.

24
Scott A. Doyle has served as a Senior Vice President since 2000, and, from 1997 until 2000, was a Vice President of the Company. He holds the same title in HPRS. He joined Home Properties in 1996 as a Regional Property Manager. Mr. Doyle has been in property management for more than 20 years and is a Certified Property Manager (CPM) as designated by the Institute of Real Estate Management. Prior to joining Home Properties, he worked with CMH Properties, Inc., Rivercrest Realty Associates and Arcadia Management Company. Mr. Doyle serves on the Advisory Board of the Residential Property Management Program at Virginia Tech. He is a graduate of State University at Plattsburgh, New York.
Johanna A. Falk has served as Senior Vice President since 2000 and as Chief Administrative/Information Officer since 2003. She had been a Vice President of the Company since 1997. She holds the same titles in HPRS. She joined the Company in 1995 as an investor relations specialist, was responsible for the Information Systems Department through 2002, and was promoted to Chief Administrative/Information Officer in February 2003. Prior to joining the Company, Mrs. Falk was employed as a marketing manager at Bausch & Lomb Incorporated and Champion Products, Inc. and as a financial analyst at Kidder Peabody. She is a graduate of Cornell University and holds an MBA from the Wharton School of The University of Pennsylvania.
Robert J. Luken has served as Senior Vice President since 2004, and as Chief Accounting Officer since January, 2005. He has been the Company's Treasurer since 2000 and became a Vice President in 1997. He holds the same title in HPRS. He joined the Company in 1996, serving as its Controller. Prior to joining the Company, he was the Controller of Bell Corp. of Rochester and an Audit Supervisor for PricewaterhouseCoopers LLP. Mr. Luken is a graduate of St. John Fisher College and is a Certified Public Accountant. He is on the Board of Directors of St. Joseph's Villa of Rochester.
Janine M. Schue has served as Senior Vice President of the Company since 2004, after joining the Company in October of 2001. She holds the same title in HPRS. Prior to joining the Company, she was employed by NetSetGo as Vice President of Human Resources and prior to that by Wegmans Food Markets, Inc. as Director of Human Resources. Ms. Schue is a graduate of and holds a Masters of Education from the State University of New York at Albany. Ms. Schue has notified the Company that she is resigning her position effective March 31, 2007.
John E. Smith has served as Chief Investment Officer of the Company since January, 2006, and as Senior Vice President since 2001. From 1998 until 2001, he was a Vice President of the Company. He holds the same title in HPRS. Prior to joining the Company in 1997, Mr. Smith was general manager for Direct Response Marketing, Inc. and Executive Vice President for The Equity Network, Inc. Mr. Smith was Director of Investment Properties at Hunt Commercial Real Estate for 20 years. He has been a Certified Commercial Investment Member (CCIM) since 1982, a New York State Certified Instructor and has taught accredited commercial real estate courses at various institutions in four states.

25
PART II
Item 5. Market for the Registrant's Common Stock and Related Stockholder Matters and Issuer Purchases of Equity Securities
Market Information, Holders and Dividends
The Common Stock has been traded on the New York Stock Exchange ("NYSE") under the symbol "HME" since July 28, 1994. The following table sets forth for the previous two years the quarterly high and low sales prices per share reported on the NYSE, as well as all distributions paid with respect to the common stock.
High Low Distribution
2006 First Quarter $52.47 $41.70 $.64 Second Quarter $55.51 $47.24 $.64 Third Quarter $58.98 $53.79 $.64 Fourth Quarter $63.52 $57.36 $.65
2005 First Quarter $42.39 $38.75 $.63 Second Quarter $43.15 $38.78 $.63 Third Quarter $46.27 $38.50 $.63 Fourth Quarter $42.45 $36.05 $.64
As of February 16, 2007, the Company had approximately 4,024 shareholders of record, 33,205,831 common shares (plus 13,556,434 UPREIT Units convertible into 13,556,434 common shares) were outstanding, and the closing price was $62.50. It is the Company's policy to pay dividends. The Company has historically paid dividends on a quarterly basis in the months of February, May, August and November.
Securities Authorized for Issuance Under Equity Compensation Plans
The following table provides information as of December 31, 2006 with respect to shares of our common stock that may be issued under the Stock Benefit Plans:
Plan Category
Number of Securities to be
Issued Upon Exercise of Outstanding
Options
Weighted Average
Exercise Price of
Outstanding Options
Number of Securities Remaining
Available for Future
Issuance Options:
Equity compensation plans approved by security holders 2,170,612 $40.85 625,300 Equity compensation plans not approved by security holders 177,402 32.78 -
Total Options 2,348,014 $40.24 625,300 Restricted Stock Awards:
Equity compensation plans approved by security holders 218,305 N/A 66,534 Equity compensation plans not approved by security holders 52,100 N/A -
Total Restricted Stock Awards 270,405 N/A 66,534

26
Performance Graph
The following graph compares the cumulative return on the Company's common stock during the five year period ended December 31, 2006 to the cumulative return of the NAREIT All Equity REIT Index and the Standard and Poor's 500 Index for the same period. The total return assumes that dividends were reinvested quarterly at the same discounted price as provided under the Company’s DRIP and is based on a $100 investment on December 31, 2001. Stockholders should note that past performance does not predict future results.
$50
$100
$150
$200
$250
$300
12/31/2001 12/31/2002 12/31/2003 12/31/2004 12/31/2005 12/31/2006
HME NAREIT Equity S&P 500
COMPARISON OF CUMULATIVE RETURNS
12/31/2001 12/31/2002 12/31/2003 12/31/2004 12/31/2005 12/31/2006 HME $100.00 $117.24 $147.28 $166.90 $168.35 $256.56 NAREIT Equity $100.00 $103.82 $142.37 $187.33 $210.12 $283.78 S&P 500 $100.00 $ 77.90 $100.24 $111.15 $116.61 $135.02
Our future filings with the SEC may "incorporate information by reference," including this Form 10-K. Unless we specifically state otherwise, this Performance Graph shall not be deemed to be incorporated by reference and shall not constitute soliciting material or otherwise be considered filed under the Securities Act of 1933, as amended, or the Securities Exchange Act of 1934, as amended.
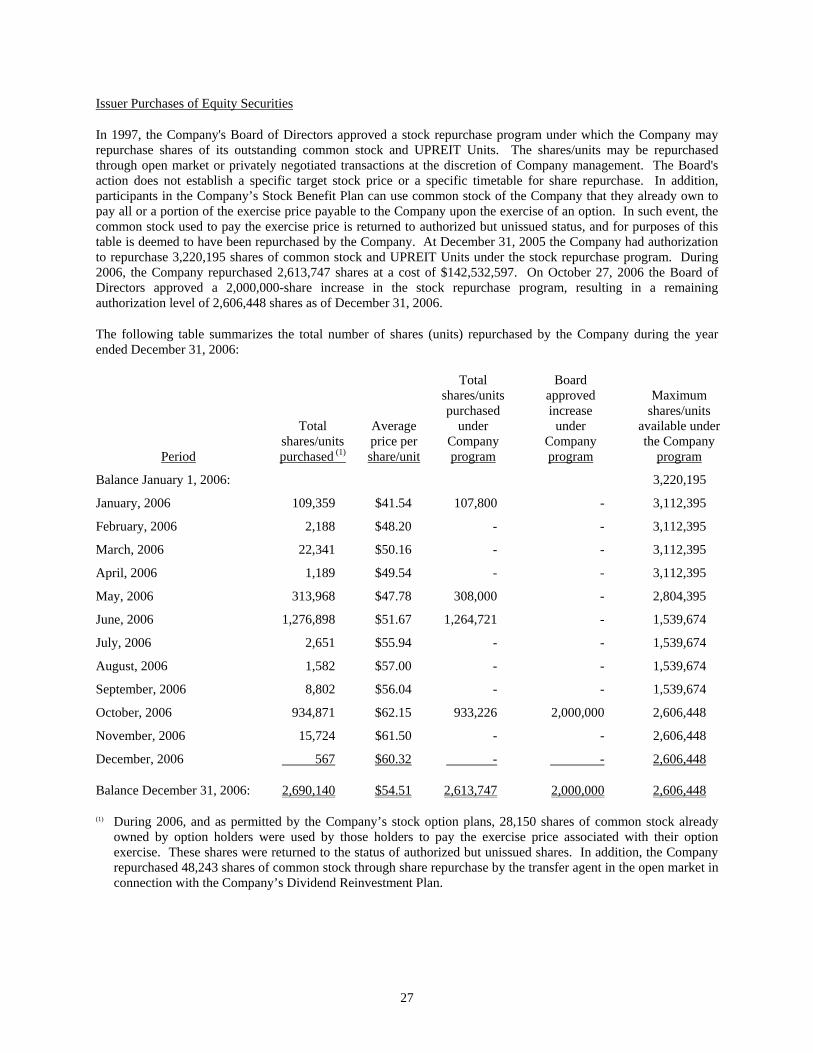
27
Issuer Purchases of Equity Securities
In 1997, the Company's Board of Directors approved a stock repurchase program under which the Company may repurchase shares of its outstanding common stock and UPREIT Units. The shares/units may be repurchased through open market or privately negotiated transactions at the discretion of Company management. The Board's action does not establish a specific target stock price or a specific timetable for share repurchase. In addition, participants in the Company’s Stock Benefit Plan can use common stock of the Company that they already own to pay all or a portion of the exercise price payable to the Company upon the exercise of an option. In such event, the common stock used to pay the exercise price is returned to authorized but unissued status, and for purposes of this table is deemed to have been repurchased by the Company. At December 31, 2005 the Company had authorization to repurchase 3,220,195 shares of common stock and UPREIT Units under the stock repurchase program. During 2006, the Company repurchased 2,613,747 shares at a cost of $142,532,597. On October 27, 2006 the Board of Directors approved a 2,000,000-share increase in the stock repurchase program, resulting in a remaining authorization level of 2,606,448 shares as of December 31, 2006.
The following table summarizes the total number of shares (units) repurchased by the Company during the year ended December 31, 2006:
Total Board shares/units approved Maximum purchased increase shares/units Total Average under under available under shares/units price per Company Company the Company
Period purchased (1) share/unit program program program
Balance January 1, 2006: 3,220,195
January, 2006 109,359 $41.54 107,800 - 3,112,395
February, 2006 2,188 $48.20 - - 3,112,395
March, 2006 22,341 $50.16 - - 3,112,395
April, 2006 1,189 $49.54 - - 3,112,395
May, 2006 313,968 $47.78 308,000 - 2,804,395
June, 2006 1,276,898 $51.67 1,264,721 - 1,539,674
July, 2006 2,651 $55.94 - - 1,539,674
August, 2006 1,582 $57.00 - - 1,539,674
September, 2006 8,802 $56.04 - - 1,539,674
October, 2006 934,871 $62.15 933,226 2,000,000 2,606,448
November, 2006 15,724 $61.50 - - 2,606,448
December, 2006 567 $60.32 - - 2,606,448
Balance December 31, 2006: 2,690,140 $54.51 2,613,747 2,000,000 2,606,448
(1) During 2006, and as permitted by the Company’s stock option plans, 28,150 shares of common stock already owned by option holders were used by those holders to pay the exercise price associated with their option exercise. These shares were returned to the status of authorized but unissued shares. In addition, the Company repurchased 48,243 shares of common stock through share repurchase by the transfer agent in the open market in connection with the Company’s Dividend Reinvestment Plan.

28
Item 6. Selected Financial and Operating Information
The following table sets forth selected financial and operating data on a historical basis for the Company and should be read in conjunction with the financial statements appearing elsewhere in this Form 10-K (amounts in thousands, except per share data).
2006 2005 2004 2003 2002 Revenues: Rental income $420,988 $378,506 $348,932 $311,682 $268,468 Other income (1) 33,004 22,019 18,200 17,187 14,201 Total Revenues 453,992 400,525 367,132 328,869 282,669 Expenses: Operating and maintenance 190,845 174,906 157,802 136,584 112,320 General and administrative 22,626 19,652 23,978 22,607 12,649 Interest 106,773 92,178 77,145 70,277 59,981 Depreciation and amortization 96,142 80,944 70,710 57,794 45,898 Prepayment penalties - - - - 3,275 Impairment of assets held as general partner - 400 1,116 2,518 3,533 Total Expenses 416,386 368,080 330,751 289,780 237,656
Income from operations 37,606 32,445 36,381 39,089 45,013 Equity in losses of unconsolidated affiliates - - (538) (1,892) (17,493) Income before minority interest, discontinued operations and extraordinary item 37,606 32,445 35,843 37,197 27,520 Minority interest in limited partnership - - 441 - - Minority interest in operating partnerships (9,614) (8,629) (9,204) (9,171) (3,017) Income from continuing operations 27,992 23,816 27,080 28,026 24,503 Discontinued operations, net of minority interest 82,493 57,696 20,330 13,781 20,638 Income before loss on disposition of property and business and
cumulative effect of change in accounting principle 110,485 81,512 47,410 41,807 45,141 Loss on disposition of property and business, net of minority
interest - - (67) (9) (202) Income before cumulative effect of change in accounting principle 110,485 81,512 47,343 41,798 44,939 Cumulative effect of change in accounting principle, net of
minority interest - - (321) - - Net income 110,485 81,512 47,022 41,798 44,939 Preferred dividends (5,400) (6,279) (7,593) (11,340) (14,744) Premium on Series B preferred stock repurchase - - - - (5,025) Net income available to common shareholders $105,085 $ 75,233 $ 39,429 $ 30,458 $ 25,170 Basic earnings per share data: Income from continuing operations $0.69 $0.55 $0.59 $0.57 $0.18 Discontinued operations 2.52 1.80 0.62 0.47 0.79 Cumulative effect of change in accounting principle - - (0.01) - - Net income available to common shareholders $3.21 $2.35 $1.20 $1.04 $0.97 Diluted earnings per share data: Income from continuing operations $0.68 $0.54 $0.58 $0.56 $0.17 Discontinued operations 2.47 1.79 0.61 0.47 0.79 Cumulative effect of change in accounting principle - - (0.01) - - Net income available to common shareholders $3.15 $2.33 $1.18 $1.03 $0.96 Cash dividends declared per common share $2.57 $2.53 $2.49 $2.45 $2.41 Balance Sheet Data: Real estate, before accumulated depreciation $3,451,762 $3,330,710 $3,123,901 $2,752,992 $2,597,278 Total assets 3,240,418 2,977,870 2,816,796 2,513,317 2,456,266 Total debt (including held for sale) 2,124,313 1,924,086 1,702,722 1,380,696 1,335,807 Redeemable/convertible preferred stock (2) 60,000 60,000 85,000 85,000 167,680 Stockholders' equity 755,617 656,812 720,422 741,263 726,242 Other Data: Net cash provided by operating activities $162,996 $136,466 $159,342 $154,227 $135,581 Net cash provided by (used in) investing activities 159,653 (179,944) (160,654) (109,253) (297,680) Net cash provided by (used in) financing activities (209,828) 40,944 3,284 (48,653) 160,162 Funds From Operations (3) 147,089 137,606 126,953 132,803 121,745 Adjusted Funds From Operations(4) 125,530 115,720 104,787 111,020 100,654 Weighted average number of shares outstanding: Basic 32,697,794 31,962,082 32,911,945 29,208,242 26,054,535 Diluted 33,337,557 32,328,105 33,314,038 29,575,660 26,335,316 Total communities owned at end of period 123 153 150 147 152 Total apartment units owned at end of period 36,954 43,432 41,776 40,946 41,776
29
(1) Other income includes property other income, interest income and other income.
(2) Redeemable preferred stock is redeemable solely at the option of the Company.
(3) Pursuant to the revised definition of Funds From Operations (“FFO”) adopted by the Board of Governors of the National Association of Real Estate Investment Trusts ("NAREIT"), FFO is defined as net income (computed in accordance with accounting principles generally accepted in the United States of America ("GAAP")) excluding gains or losses from sales of property, minority interest and extraordinary items plus depreciation from real property including adjustments for unconsolidated partnerships and joint ventures less dividends from non-convertible preferred shares. In 2006 and 2003, the Company added back debt extinguishment costs which were incurred as a result of repaying property specific debt triggered upon sale as a gain or loss on sale of the property. In 2002, the Company added back the premium on the Series B preferred stock repurchase. Because of the limitations of the FFO definition as published by NAREIT as set forth above, the Company has made certain interpretations in applying the definition. The Company believes all adjustments not specifically provided for are consistent with the definition.
FFO falls within the definition of “non-GAAP financial measure” set forth in Regulation S-K and as a result the Company is required to include in this report a statement disclosing the reasons why management believes that presentation of this measure provides useful information to investors. Management believes that in order to facilitate a clear understanding of the combined historical operating results of the Company, FFO should be considered in conjunction with net income as presented in the consolidated financial statements included elsewhere herein. Management believes that by excluding gains or losses related to dispositions of property and excluding real estate depreciation (which can vary among owners of similar assets in similar condition based on historical cost accounting and useful life estimates), FFO can help one compare the operating performance of a company’s real estate between periods or as compared to different companies. The Company also uses this measure to compare its performance to that of its peer group. FFO does not represent cash generated from operating activities in accordance with generally accepted accounting principles and is not necessarily indicative of cash available to fund cash needs. FFO should not be considered as an alternative to net income as an indication of the Company's performance or to cash flow as a measure of liquidity.

30
(3) (continued)
The following table sets forth the calculation of FFO and Adjusted Funds From Operations for the previous five years, beginning with "net income available to common shareholders" from the Company's audited financial statements prepared in accordance with GAAP:
2006 2005 2004 2003 2002
Net income available to common shareholders $105,085 $ 75,233 $ 39,429 $ 30,458 $ 25,170 Convertible preferred dividends(a) - 880 2,194 5,939 10,589 Depreciation from real property(b) 99,421 97,686 91,564 79,577 67,919 Impairment on general partner investment - - 945 1,785 1,470 Loss from sale of property - - 50 260 202 Minority interest 9,614 8,629 9,204 9,171 3,017 Minority interest – discontinued operations 1,947 1,828 4,353 6,179 9,209 Impairment of real property - - - 423 1,565 Gain from sale of discontinued operations (78,748) (46,650) (21,107) (2,599) (5,696)Prepayment penalties - - - - 3,275 Cumulative effect of change in accounting
principle - - 321 - - FFO – Diluted, as defined by NAREIT 137,319 137,606 126,953 131,193 116,720 Loss from early extinguishment of debt in
connection with sale of real estate 9,770 - - 1,610 - Premium paid on Series B repurchased - - - - 5,025 FFO – Diluted, as adjusted by the Company 147,089 137,606 126,953 132,803 121,745 Reserve(4) (21,559) (21,886) (22,166) (21,783) (21,091)Adjusted Funds From Operations $125,530 $115,720 $104,787 $111,020 $100,654 Weighted average common shares/units
outstanding: Basic 47,262.7 47,714.3 48,675.0 45,276.7 42,062.1 Diluted(a) 47,902.4 48,411.3 49,910.5 47,873.8 46,466.4
FFO as adjusted by the Company per share diluted (a) $3.07 $2.84 $2.54 $2.77 $2.62
(a) The calculation of FFO and FFO per share assumes the conversion of dilutive common stock equivalents and convertible preferred stock. Therefore, the convertible preferred dividends are added to FFO, and the common stock equivalent is included in both the basic and diluted weighted average common shares/units outstanding. The convertible preferred stock had an anti-dilutive effect in 2004 on the per-share calculation; therefore, the convertible preferred dividends of $2,194 are not included in FFO for the 2004 diluted calculation. The weighted average common shares/units outstanding assumes conversion of all UPREIT Units to common shares. The diluted shares/units for the year ended December 31, 2004 used for Diluted FFO are 49,910.5 instead of the regular diluted shares/units of 49,077.1.
(b) Includes amounts passed through from unconsolidated investments. All REITs may not be using the same definition for FFO. Accordingly, the above presentation may not be
comparable to other similarly titled measures of FFO of other REITs.
(4) Adjusted Funds From Operations is defined as Funds from Operations less an annual reserve for anticipated recurring, non-revenue generating capitalized costs ("Reserve") of $525 per apartment unit (weighted average units owned during the year). The adjustment from FFO to AFFO only takes into account this reserve level as previously described. The NAREIT definition of FFO or AFFO does not take into account any additional costs of capital improvements and capitalized interest that also are incurred. The total level of capital improvements and capitalized interest (including the amount defined as reserve) for the five years are as follows: 2006 - $101,723; 2005 - $100,013; 2004 - $102,700; 2003 - $106,346; and 2002 - $115,692.

31
Item 7. Management's Discussion and Analysis of Financial Condition and Results of Operations
Overview
The following discussion should be read in conjunction with the consolidated financial statements, the notes thereto, and the selected financial data appearing elsewhere in this Form 10-K. Historical results and percentage relationships set forth in the consolidated financial statements, including trends which might appear, should not be taken as indicative of future operations. The Company considers portions of the information to be "forward-looking statements" within the meaning of Section 27A of the Securities Exchange Act of 1933 and Section 21E of the Securities Exchange Act of 1934, both as amended, with respect to the Company's expectations for future periods. Some examples of forward-looking statements include statements related to acquisitions (including any related pro forma financial information, future capital expenditures, financing sources and availability, and the effects of environmental and other regulations. Although the Company believes that the expectations reflected in those forward-looking statements are based upon reasonable assumptions, it can give no assurance that its expectations will be achieved. Factors that may cause actual results to differ include general economic and local real estate conditions, the weather and other conditions that might affect operating expenses, the timely completion of repositioning activities and development within anticipated budgets, the actual pace of future development, acquisitions and sales, and continued access to capital to fund growth. For this purpose, any statements contained in this report that are not statements of historical fact should be considered to be forward-looking statements. Some of the words used to identify forward-looking statements include "believes", "anticipates", "plans", "expects", "seeks", "estimates", and similar expressions. Readers should exercise caution in interpreting and relying on forward-looking statements since they involve known and unknown risks, uncertainties and other factors which are, in some cases, beyond the Company's control and could materially affect the Company's actual results, performance or achievements.
The Company is engaged in the ownership, management, acquisition, rehabilitation and development of residential apartment communities primarily in selected Northeast, Mid-Atlantic and Southeast Florida markets. As of December 31, 2006, the Company operated 127 apartment communities with 39,136 apartments. Of this total, the Company owned 123 communities, consisting of 36,954 apartments, managed as general partner one partnership that owned 868 apartments, and fee managed three properties with 1,314 apartments for third parties.
Executive Summary
The Company operated during 2006 and 2005 in an improving economic environment. The recession, which started in 2001, continued through mid-2004 resulting in job losses in many parts of the country. For historical reference, Home Properties' markets experienced negative job growth of -0.4% in 2001 and -0.9% in 2002. For 2003, the Company's markets, as well as the country as a whole, experienced flat job growth. For 2004, 2005 and 2006, both the Company’s markets and the country as a whole experienced positive job growth; 1.0%, 1.1% and 1.2% for the Company, and 1.7%, 1.5% and 1.7% for the country, respectively. An increase in job growth leads to household formations, which creates an increase in demand for rental housing. In addition, during 2005 and continuing into 2006, the increasing home mortgage interest rate environment made it more challenging for potential residents who considered making the switch to home ownership. Home ownership continues to be the number one reason our residents give for moving out of our communities. In 2001, home purchases represented 17.8% of our move-outs, growing to 18.8% in 2002, leveling off at 19.6% in 2003, 19.5% for 2004 and 19.4% in 2005. In 2006 we experienced the first significant drop in years, with the percentage reducing to 18.5%. A continued increase in home mortgage rates could push this level down further, which should positively affect our turnover rates and improve occupancy. As referenced in our Market Demographics table on Page 9 of this report, job growth for our markets improved in 2006 with 1.2% growth over 2005, on top of the approximate 1.0% growth in 2005 and 2004. As there is usually a lag between job growth and household formation, this recovery did not create a measurable increased demand for our apartments until the second half of 2005. During the first six months of 2005, same property total revenue was up 1.8%. This improved to 4.0% for same property total revenue growth for the second six months of 2005. During 2006 these figures improved further with 5.0% same property revenue growth for the year.
The reason for using rent concessions, and the ultimate level of those concessions, has changed over the past few years. Concessions for 2003 were 119 basis points of rental revenue, 87 basis points for 2004, 105 basis points for 2005 and 94 basis points for 2006. In 2003, the Company positioned itself to improve occupancy, which resulted in

32
less aggressive rental rate increases and a greater use of rent concessions. In 2004, we were able to maintain and improve occupancies while reducing concessions as the economy improved. In 2005, the overall level of concessions increased to help soften the much more aggressive rental increases and significant use of water and sewer expense recovery which the Company started to pass through to the residents during 2005. The levels of concessions in 2006 are affected by two main components – our geographic repositioning efforts and the utility recovery programs. With the Detroit and Upstate New York regions sold in 2006 and out of the same store pool, concessions have reduced as these were our two weakest markets needing support from concessions. At the same time, the natural gas portion of the utility recovery program was rolled out in 2006, leading to significant increases for the recovery dollars in property other income and increased concession activity for rents to counteract these aggressive increases.
The Company owned 106 communities with 31,253 apartment units throughout 2005 and 2006 where comparable operating results are available for the years presented (the "2006 Core Properties"). Occupancies at the 2006 Core Properties increased slightly by 20 basis points, from 93.8% to 94.0%. Occupancies in the fourth quarter of 2006 averaged 93.5%, compared to 94.0% a year ago. The Company uses a measurement referred to as Available to Rent, or ATR. This is a leading indicator to assess future occupancy rates by reference to units which will be available for rent, based upon leases signed or termination notices received relating to future move in/move out dates. As of the third week of February, 2007, our ATR was 6.2%, compared to the same time period a year ago when ATR was 6.2%. For 2007, we are projecting occupancy averaging 0.1% better than 2006.
Total Same Store Properties (including Detroit and Upstate New York for at least part of the year) rental revenue growth for 2006 was projected to be 3.8%, consisting of 3.4% in rental rate growth, 0.3% in occupancy improvement, and 0.1% in reduction to concessions. Actual results were 3.1% in rental rate growth, 0.2% increase in occupancy, and 0.1% reduction to concessions, totaling 3.4% total rental revenue growth, or 0.4% behind the guidance. It is difficult to compare rental growth without including the utility recovery revenue which is classified as property other income. The Company recorded $8.3 million of recovery revenue in 2006 verses only $2.9 million in 2005. Actual results, including utility recovery revenue, were 4.5% in rental rate growth, 0.2% increase in occupancy, and 0.1% reduction to concessions, totaling 4.8% total rental revenue growth including utility recovery income.
The guidance for 2007 Core Properties (apartment units owned throughout 2006 and 2007, the "2007 Core Properties") revenue growth is 5.1%. Rental rates are projected to increase 3.6%, including above-average rental increases at certain communities resulting from the continued efforts to upgrade the properties. Occupancies are expected to increase 0.1% for the year, and concessions are projected to increase slightly, reducing net rental income by 0.3%, such that rental revenues are projected to increase 3.4%. Property other income is expected to increase substantially year over year, increasing the 3.4% rental revenue growth to 5.1% total revenue growth. The items driving the property other income growth are a $0.8 million marginal increase in water and sewer recovery revenue and a $7.8 million marginal increase in heating cost recovery revenue from the utility recovery initiatives.
Expenses for 2007 Core Properties are projected to increase 5.4%. See below under "Results of Operations" for more details on expense comparisons.
These revenue and expense projections result in 2007 Core Properties net operating income (“NOI”) growth of 4.9% at the mid-point of 2007 guidance. Markets where the Company expects above average NOI growth include: Washington, D.C. 5.6%; Philadelphia 5.6%; Florida 5.5% and Baltimore 5.0%. Markets with below average expectations include: New York City Metro area 4.2%; Boston 3.7% and Chicago 2.6%. Certain historical demographic information for these markets may be found in the tables on Pages 9 and 10 of this report.
Of the two items making up NOI – revenue and operating expenses, the revenue component is likely to be more volatile. An improving economy could create higher demand for rental housing above that projected. An economic recovery that stumbles or creates little new job growth could put pressure on the Company's ability to reach the mid-point of guidance. The Company has given FFO guidance for 2007 with a range of $3.12 to $3.24 per share.
The Company has anticipated closing on acquisitions of $400 million in its budget for 2007. The Company is committed to a disciplined approach to acquisitions, but at the same time recognizes that the continued long term low interest rate levels allow the Company flexibility to adjust hurdle rates and bids to reflect market conditions.

33
The Company is also targeting $50 million in dispositions from properties that have reached their potential. The acquisition market continues to be very competitive, making the 2007 acquisition goal of $400 million slightly aggressive.
During 2005 and 2006, the Company increased its level of stock buy-back activity substantially, repurchasing approximately 5.4 million shares at a weighted price slightly in excess of $47.00 per share. The Company's strategy is to opportunistically repurchase shares at a discount to its underlying net asset value (“NAV”), thereby continuing to build value for shareholders. The Company estimates its NAV per share at December 31, 2006 to be $62.08, based on capitalizing at 5.9% the annualized and seasonally adjusted fourth quarter property net income, plus a 4% growth factor, minus a management fee. At the present time, the 2007 guidance assumes no stock buy-back. The Company will continue to monitor stock prices, the published NAV and acquisition alternatives to determine the current best use of capital between stock buy-back, acquisitions and leverage levels. During periods when our common shares are trading at a premium to NAV, we are not likely to repurchase shares. In such circumstances, it would be more likely that we would issue equity in order to raise capital in order to pay down existing debt. This should be neutral to both NAV and earnings per share, increase the level of unencumbered assets, and better position the Company to fund future acquisition and development pipeline needs. During 2007, the Company will target leverage of approximately 43% of debt-to-total market capitalization in order to meet its above-described acquisition goals.
Results of Operations
Comparison of year ended December 31, 2006 to year ended December 31, 2005.
The Company owned 106 communities with 31,253 apartment units throughout 2005 and 2006 where comparable operating results are available for the years presented (the "2006 Core Properties"). For the year ended December 31, 2006, the 2006 Core Properties showed an increase in total revenues of 5.0% and a net operating income increase of 6.8% over the 2005 period. Property level operating expenses increased 2.8%. Average economic occupancy for the 2006 Core Properties increased from 93.8% to 94.0%, with average monthly rental rates increasing 3.1% to $1,073 per apartment unit.
A summary of the 2006 Core Property NOI is as follows (in thousands):
2006 2005 $ Change % Change
Rent $ 378,289 $ 365,911 $12,378 3.4%
Utility recovery revenue 8,323 2,907 5,416 186.3%
Rent including recoveries 386,612 368,818 17,794 4.8%
Other income 17,710 16,093 1,617 10.0%
Total revenue 404,322 384,911 19,411 5.0%
Operating and maintenance (172,392) (167,770) (4,622) (2.8%)
Net operating income $ 231,930 $ 217,141 $14,789 6.8%
NOI may fall within the definition of "non-GAAP financial measure" set forth in Regulation S-K and, as a result, Home Properties may be required to include in this report a statement disclosing the reasons why management believes that presentation of this measure provides useful information to investors. Home Properties believes that NOI is helpful to investors as a supplemental measure of the operating performance of a real estate company because it is a direct measure of the actual operating results of the Company's apartment communities. In addition, the apartment communities are valued and sold in the market by using a multiple of NOI. The Company also uses this measure to compare its performance to that of its peer group.
During 2006, the Company acquired/developed a total of 3,271 apartment units in ten communities (the "2006 Acquisition Communities"). In addition, the Company experienced full-year results for the 2,430 apartment units in seven apartment communities (the "2005 Acquisition Communities") acquired during 2005. The inclusion of these acquired communities generally accounted for the significant changes in operating results for the year ended
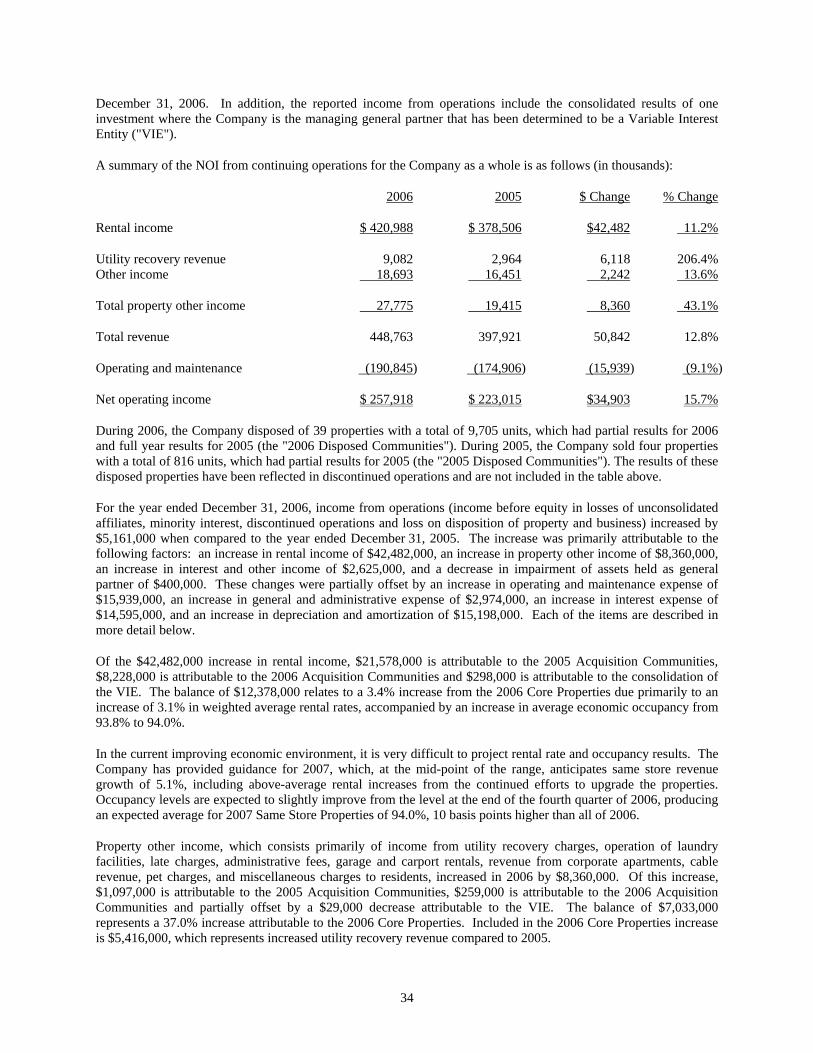
34
December 31, 2006. In addition, the reported income from operations include the consolidated results of one investment where the Company is the managing general partner that has been determined to be a Variable Interest Entity ("VIE").
A summary of the NOI from continuing operations for the Company as a whole is as follows (in thousands):
2006 2005 $ Change % Change
Rental income $ 420,988 $ 378,506 $42,482 11.2%
Utility recovery revenue 9,082 2,964 6,118 206.4% Other income 18,693 16,451 2,242 13.6%
Total property other income 27,775 19,415 8,360 43.1%
Total revenue 448,763 397,921 50,842 12.8%
Operating and maintenance (190,845) (174,906) (15,939) (9.1%)
Net operating income $ 257,918 $ 223,015 $34,903 15.7%
During 2006, the Company disposed of 39 properties with a total of 9,705 units, which had partial results for 2006 and full year results for 2005 (the "2006 Disposed Communities"). During 2005, the Company sold four properties with a total of 816 units, which had partial results for 2005 (the "2005 Disposed Communities"). The results of these disposed properties have been reflected in discontinued operations and are not included in the table above.
For the year ended December 31, 2006, income from operations (income before equity in losses of unconsolidated affiliates, minority interest, discontinued operations and loss on disposition of property and business) increased by $5,161,000 when compared to the year ended December 31, 2005. The increase was primarily attributable to the following factors: an increase in rental income of $42,482,000, an increase in property other income of $8,360,000, an increase in interest and other income of $2,625,000, and a decrease in impairment of assets held as general partner of $400,000. These changes were partially offset by an increase in operating and maintenance expense of $15,939,000, an increase in general and administrative expense of $2,974,000, an increase in interest expense of $14,595,000, and an increase in depreciation and amortization of $15,198,000. Each of the items are described in more detail below.
Of the $42,482,000 increase in rental income, $21,578,000 is attributable to the 2005 Acquisition Communities, $8,228,000 is attributable to the 2006 Acquisition Communities and $298,000 is attributable to the consolidation of the VIE. The balance of $12,378,000 relates to a 3.4% increase from the 2006 Core Properties due primarily to an increase of 3.1% in weighted average rental rates, accompanied by an increase in average economic occupancy from 93.8% to 94.0%.
In the current improving economic environment, it is very difficult to project rental rate and occupancy results. The Company has provided guidance for 2007, which, at the mid-point of the range, anticipates same store revenue growth of 5.1%, including above-average rental increases from the continued efforts to upgrade the properties. Occupancy levels are expected to slightly improve from the level at the end of the fourth quarter of 2006, producing an expected average for 2007 Same Store Properties of 94.0%, 10 basis points higher than all of 2006.
Property other income, which consists primarily of income from utility recovery charges, operation of laundry facilities, late charges, administrative fees, garage and carport rentals, revenue from corporate apartments, cable revenue, pet charges, and miscellaneous charges to residents, increased in 2006 by $8,360,000. Of this increase, $1,097,000 is attributable to the 2005 Acquisition Communities, $259,000 is attributable to the 2006 Acquisition Communities and partially offset by a $29,000 decrease attributable to the VIE. The balance of $7,033,000 represents a 37.0% increase attributable to the 2006 Core Properties. Included in the 2006 Core Properties increase is $5,416,000, which represents increased utility recovery revenue compared to 2005.

35
Interest income increased $1,180,000 due to a higher level of invested excess cash on hand available from sale proceeds of the 2006 Disposed Communities and proceeds from exchangeable senior notes awaiting reinvestment into replacement property.
Other income, which primarily reflects management and other real estate service fees recognized by the Company, increased in 2006 by $1,445,000. This is due primarily to the post closing consultation fees earned in connection with the 2006 Disposed Communities.
Of the $15,939,000 increase in operating and maintenance expenses, $8,521,000 is attributable to the 2005 Acquisition Communities, $2,969,000 is attributable to the 2006 Acquisition Communities partially offset by a $173,000 decrease attributable to the VIE. The balance for the 2006 Core Properties, a $4,622,000 increase in operating expenses or 2.8%, is primarily a result of increases in electricity, gas heating costs, repairs & maintenance and property insurance. These increases were offset in part by reductions in personnel, advertising, and snow removal costs.
The breakdown of operating and maintenance costs for the 2006 Core Properties by line item is listed below (in thousands):
2006 2005 $ Variance % Variance
Electricity $ 6,959 $ 6,414 $ (545) (8.5%)Gas 20,113 18,871 (1,242) (6.6%)Water & sewer 11,297 10,691 (606) (5.7%)Repairs & maintenance 25,885 24,704 (1,181) (4.8%)Personnel expense 33,818 34,199 381 1.1% Site level incentive compensation 2,252 2,419 167 6.9% Advertising 4,161 4,591 430 9.4% Legal & professional 1,176 896 (280) (31.3%)Office & telephone 5,425 5,535 110 2.0% Property insurance 6,813 5,746 (1,067) (18.6%)Real estate taxes 38,512 38,292 (220) (0.6%)Snow 610 1,190 580 48.7% Trash 2,438 2,452 14 0.6% Property management G&A 12,933 11,770 (1,163) (9.9%)Total $ 172,392 $ 167,770 $ (4,622) (2.8%)
With a $1,242,000 increase, natural gas heating costs were up 6.6% over 2005. We experienced significant increases in the cost of natural gas per decatherm in the first quarter. These increases were not unexpected, and rates and usage have come down the balance of the year with positive comparisons to the other three quarters.
As of December 31, 2006, the Company had fixed-price contracts covering approximately 95% of its natural gas exposure for the balance of the 2006/2007 heating season. Risk is further diversified by staggering contract term expirations. For the balance of the 2006/2007 heating season, the Company estimates the average price per decatherm will be approximately $9.50. For calendar year 2007, where the Company has coverage for 85% of its exposure, the Company's negotiated average price per decatherm was approximately $9.22, with an all-in weighted expectation of $8.99 including an estimate for the 15% variable portion. For 2006, the average commodity cost for the year was $9.29. The Company has provided guidance for 2007 which anticipates a 13.1% increase (or $2,700,000) in natural gas heating costs. This is based on the thirty-year average for the number of degrees days for 2007. Both the winter of the first quarter and fourth quarter of 2006 were mild, making for a tough comparison in 2007. Even though the cost per decatherm is expected to go down slightly, usage is expected to increase significantly. For guidance, the portion of the calendar year not covered by fixed price contracts (15%) is assumed to be priced at a level that reflects twelve month strip pricing as of February, 2007.
The increase in repairs and maintenance of 4.8% is mainly attributed to a non-recurring $618,000 reduction in 2005 due to cost reimbursements from fire losses. After factoring the fire reimbursement, the 2006 increase was only
36
$563,000, or 2.2%. The Company has provided guidance for 2007 which anticipates a 4.3% increase in repairs and maintenance.
Personnel expenses were down 1.1% in 2006 versus 2005. The Company experienced favorable variances in workers compensation and health insurance, down $322,000, or 10%. For 2007 guidance, personnel costs are anticipated to increase 5.7%. Part of this increase is attributable to a more normalized level of overtime expected during winter months. As with heating costs described above, the more mild winter in 2006 produced lower snowfall which reduces labor costs.
Site level incentive compensation was down $167,000, or 6.9%. The hurdle rate to earn incentive compensation was set higher in 2006 due to increased optimism, resulting in a slightly lower overall payout.
Advertising costs were down 9.4% as a result of property management decreasing spending on major newspaper ads and focusing instead on internet advertising and resident referral programs.
Legal and professional fees were up $280,000, or 31.3%, due in part to increased efforts for property tax assessment appeals.
Property insurance costs were up 18.6% over 2005, primarily due to a general increase in our property and general liability insurance premiums. Insurance costs have continued to climb due to catastrophe rate increases and higher reinsurance rates. The guidance for 2007 reflects a similar 18.8% increase in insurance costs.
Real estate taxes were up only 0.6% in 2006, reflecting general increased assessments and rates as tax authorities struggle to raise revenues in many regions of the country, mostly offset by selected successful property tax appeals which resulted in $555,000 savings in 2006. The Company expects real estate taxes to increase only 3.0% in 2007 reflecting continued initiatives to challenge assessments and obtain cost reductions.
Snow removal costs were down 580,000 or 48.7%. The year 2006 produced below normal snowfalls compared to normal snowfall in 2005. Snow removal costs are anticipated to revert to normal levels in 2007.
The operating expense ratio (the ratio of operating and maintenance expense compared to rental and property other income) for the 2006 Core Properties was 42.6% and 43.6% for 2006 and 2005, respectively. This 1.0% decrease resulted from the 5.0% increase in total revenue achieved through ongoing efforts to upgrade and reposition properties for maximum potential and the Company's roll out of its heating cost recovery program in 2006, offset by the 2.8% increase in operating and maintenance expense. In general, the Company's operating expense ratio is higher than that experienced in other parts of the country due to relatively high real estate taxes and heating costs in its markets.
General and administrative expenses (“G&A”) increased in 2006 by $2,974,000 or 15% from $19,652,000 in 2005 to $22,626,000 in 2006. General and administrative expenses as a percentage of total revenues (including discontinued operations) were 4.4% for 2006 as compared to 4.0% for 2005. The recently enacted accounting rules effecting stock options and restricted stock, SFAS 123R, required the Company to recognize compensation costs in 2006 for retirement-eligible and near-retirement-eligible employees and directors over a shorter vesting period than 2005, coupled with a significantly higher stock price, resulting in $879,000 higher expense for 2006. Part of the increase ($1,667,000) is the direct result of the increase in corporate incentive compensation bonus accrued in 2006, partially offset by a $1,331,000 reduction in external costs incurred for auditing, tax and consultation expense, including costs to comply with Section 404 of Sarbanes-Oxley. G&A for 2006 also included $505,000 for the development department which was non-existent in 2005. A significant portion of the costs in 2005 related to the non-recurring first year efforts for Section 404 compliance. G&A is expected to decrease 6.5% for 2007, based on the retirement as an employee of Norman Leenhouts, who will remain as Co-Chairman of the Board; partially offset by the ramp up of the development department.
Interest expense increased in 2006 by $14,595,000 as a result of a full year of interest expense for the 2005 Acquisition Communities, the increased borrowings in connection with acquisition of the 2006 Acquisition Communities and interest expense on the exchangeable senior notes, partially offset by lower interest on line of

37
credit expenses. In addition, amortization from deferred charges relating to the financing of properties totaled $2,389,000 and $1,975,000, and was included in interest expense for 2006 and 2005, respectively.
Included in 2005 interest expense are prepayment penalties of $147,000 in connection with the refinancing or payoff of certain mortgages not in connection with a sale any property.
Depreciation and amortization expense increased $15,198,000 due to the additional depreciation expense on the 2006 Acquisition Communities and a full year of depreciation expense for the 2005 Acquisition Communities, as well as the incremental depreciation on the capital expenditures for additions and improvements to the Core Properties in 2006 and 2005 of $67,787,000 and $72,696,000, respectively.
The Company has sold virtually all of the assets associated with its general partner interests in the affordable properties in order to focus solely on the direct ownership and management of market rate apartment communities. During 2005, the Company recorded impairment charges of $400,000, which pertains to an impairment charge taken on the one remaining VIE to reduce its investment to fair market value.
Minority interest increased $985,000 as a direct result of the increase in income from operations, partially offset by a decrease in the minority interest percentage over the prior year.
Included in discontinued operations for 2006 are the operating results, net of minority interest, of the 2006 Disposed Communities. Included in discontinued operations for 2005 are the operating results, net of minority interest, of the 2006 Disposed Communities and the 2005 Disposed Communities. For purposes of the discontinued operations presentation, the Company only includes interest expense and losses from early extinguishment of debt associated with specific mortgage indebtedness of the properties that are sold or held for sale.
Included in the $78,748,000 net gain on disposition of property for 2006 is the sale of 39 apartment communities where the Company recorded a combined gross gain on sale of $110,514,000, net of minority interest of $31,766,000.
Included in the $53,975,000 gain on disposition of property reported for the year 2005 is the sale of four apartment communities where the Company has recorded a combined gross gain on sale of $73,022,000, net of minority interest of $24,227,000. In addition, the Company recorded a $7,686,000 gain, net of minority interest of $2,506,000, during the year related to the disposal of two affordable partnerships.
Net income increased $28,973,000 primarily due to the increase in gain on sale of discontinued operations of $24,773,000 in 2006 compared to 2005; plus $4,176,000 higher income from continuing operations in 2006 compared to 2005.
Comparison of year ended December 31, 2005 to year ended December 31, 2004.
The Company owned 98 communities with 28,855 apartment units throughout 2004 and 2005 where comparable operating results are available for the years presented (the "2005 Core Properties"). For the year ended December 31, 2005, the 2005 Core Properties showed an increase in total revenues of 3.6% and a net operating income increase of 3.4% over the 2004 year-end period. Property level operating expenses increased 4.0%. Average economic occupancy for the 2005 Core Properties increased from 93.4% to 93.5%, with average monthly rental rates increasing 2.4%.

38
A summary of the 2005 Core Property NOI is as follows (in thousands):
2005 2004 $ Change % Change
Rent $ 336,613 $ 327,737 $8,876 2.7%
Utility recovery revenue 2,595 95 2,500 2631.6%
Rent including recoveries 339,208 327,832 11,376 3.5%
Other income 15,179 14,168 1,011 7.1%
Total revenue 354,387 342,000 12,387 3.6%
Operating and maintenance (153,463) (147,628) (5,835) (4.0%)
Net operating income $ 200,924 $ 194,372 $6,552 3.4%
During 2005, the Company acquired a total of 2,430 apartment units in seven communities (the "2005 Acquisition Communities"). In addition, the Company experienced full-year results for the 2,394 apartment units in eight apartment communities (the "2004 Acquisition Communities") acquired during 2004. The inclusion of these acquired communities generally accounted for the significant changes in operating results for the year ended December 31, 2005. In addition, effective April 1, 2004, the reported income from operations include the consolidated results of one investment where the Company is the managing general partner that has been determined to be a VIE.
A summary of the NOI from continuing operations for the Company as a whole is as follows (in thousands):
2005 2004 $ Change % Change
Rental income $ 378,506 $ 348,932 $29,574 8.5%
Utility recovery revenue 2,964 133 2,831 2128.6% Other income 16,451 14,804 1,647 11.1%
Total property other income 19,415 14,937 4,478 30.0%
Total revenue 397,921 363,869 34,052 9.4%
Operating and maintenance (174,906) (157,802) (17,104) (10.8%)
Net operating income $ 223,015 $ 206,067 $16,948 8.2%
During 2004, the Company disposed of five properties with a total of 1,646 units, which had partial results for 2004 (the "2004 Disposed Communities"). The results of the 2004 Disposed Communities, along with the 2006 and 2005 Disposed Communities, have been reflected in discontinued operations and are not included in the table above.
For the year ended December 31, 2005, income from operations (income before equity in losses of unconsolidated affiliates, minority interest, discontinued operations and gain on disposition of property and business) decreased by $3,936,000 when compared to the year ended December 31, 2004. The decrease was primarily attributable to the following factors: an increase in rental income of $29,574,000, an increase in property other income of $4,478,000, a decrease in general and administrative expense of $4,326,000 and a decrease in impairment of assets held as general partner of $716,000. These changes were more than offset by an increase in operating and maintenance expense of $17,104,000, an increase in interest expense of $15,033,000, an increase in depreciation and amortization of $10,234,000 and a decrease in interest and other income of $659,000. Each of the items are described in more detail below.

39
Of the $29,574,000 increase in rental income, $11,451,000 is attributable to the 2004 Acquisition Communities, $8,180,000 is attributable to the 2005 Acquisition Communities and $1,067,000 is attributable to the consolidation of the VIE. The balance of $8,876,000 relates to a 2.7% increase from the 2005 Core Properties due primarily to an increase of 2.4% in weighted average rental rates, accompanied by an increase in average economic occupancy from 93.4% to 93.5%.
Property other income, which consists primarily of income from utility recovery charges, operation of laundry facilities, late charges, administrative fees, garage and carport rentals, revenue from corporate apartments, cable revenue, pet charges, and miscellaneous charges to residents, increased in 2005 by $4,478,000. Of this increase, $661,000 is attributable to the 2004 Acquisition Communities, $287,000 is attributable to the 2005 Acquisition Communities and $19,000 is attributable to the VIE. The balance of $3,511,000 represents a 24.6% increase attributable to the 2005 Core Properties. Included in the 2005 Core Properties increase is $2,500,000 which represents increased utility recovery revenue compared to 2004.
Other income, which primarily reflects management and other real estate service fees recognized by the Company, decreased in 2005 by $759,000. This is due primarily to a decrease in the level of management activity as a result of the sale of the affordable limited partnerships partially offset by increases in other fee managed properties.
Of the $17,104,000 increase in operating and maintenance expenses, $6,439,000 is attributable to the 2004 Acquisition Communities, $3,750,000 is attributable to the 2005 Acquisition Communities and $1,080,000 is attributable to the VIE. The balance for the 2005 Core Properties, a $5,835,000 increase in operating expenses or 4.0%, is primarily a result of increases in utilities, personnel and real estate taxes, offset in part by reductions in advertising, repairs and maintenance, and property insurance.
The breakdown of operating and maintenance costs for the 2005 Core Properties by line item is listed below (in thousands):
2005 2004 $ Variance % Variance Electricity $ 6,115 $ 5,951 $ (164) (2.8%) Gas 18,013 15,300 (2,713) (17.7%) Water & sewer 9,617 9,142 (475) (5.2%) Repairs & maintenance 22,838 22,894 56 0.2% Personnel expense 31,449 30,937 (512) (1.7%) Site level incentive compensation 2,220 1,323 (897) (67.8%) Advertising 4,246 4,297 51 1.2% Legal & professional 802 740 (62) (8.4%) Office & telephone 5,172 5,428 256 4.7% Property insurance 4,334 5,383 1,049 19.5% Real estate taxes 34,563 32,889 (1,674) (5.1%) Snow 1,018 877 (141) (16.1%) Trash 2,146 2,070 (76) (3.7%) Property management G&A 10,930 10,397 (533) (5.1%) Total $ 153,463 $ 147,628 $ (5,835) (4.0%)
The natural gas heating cost variance of 17.7% reflects significant increases in the cost of natural gas per decatherm. For calendar year 2005, the Company's average price per decatherm was $6.98. A year ago, the average commodity cost for the year was approximately $6.00.
The 5.2% increase in water and sewer costs is a function of municipalities across all regions looking at ways to increase revenues. The Company initiated a program to allocate water and sewer costs to residents at a majority of the Owned Properties in March 2005.
The decrease in repairs and maintenance of 0.2% is mainly attributed to a $919,000 decrease in sales tax charges between periods. Included in contract repairs in 2004 is $808,000 of sales tax expense, compared to a reduction in sales tax expense of $111,000 in 2005.

40
Personnel expense was up 1.7% in 2005 versus 2004. Significant variances were normal payroll increases of $958,000, or 2.7%, increase in workers compensation, up $421,000, or 27%, and health insurance, down $867,000, or 33%.
Site level incentive compensation was up $897,000, or 67.8%. This represents an increased focus on creating a higher level of property management compensation coming from incentive based performance measures.
Advertising costs were down 1.2% as a result of property management decreasing spending on major newspaper ads and focusing instead on internet advertising and resident referral programs.
Property insurance costs were down 19.5% over 2004. The Company renewed the property and general liability insurance policy for the year beginning November, 2004 at significantly reduced rates, due to a reduced number of claims and better management of those claims.
Real estate taxes were up 5.1% in 2005, reflecting increased assessments and rates as tax authorities struggle to raise revenues in many regions of the country.
Snow removal costs were up 16.1%. The year 2005 produced normal snowfalls compared to below normal snowfall in 2004.
The operating expense ratio (the ratio of operating and maintenance expense compared to rental and property other income) for the 2005 Core Properties was 43.3% and 43.2% for 2005 and 2004, respectively. This 0.1% increase resulted from the 3.6% increase in total revenue achieved through ongoing efforts to upgrade and reposition properties for maximum potential being offset by the 4.0% increase in operating and maintenance expense. In general, the Company's operating expense ratio is higher than that experienced in other parts of the country due to relatively high real estate taxes in its markets and the Company's practice, typical in its markets, of including heating expenses in base rent.
General and administrative expenses (“G&A”) decreased in 2005 by $4,326,000 or 18% from $23,978,000 in 2004 to $19,652,000 in 2005. Of this decrease, $3,800,000 is attributable to an accrued liability recorded in the fourth quarter of 2004 relating to the March 2005 settlement of a lawsuit and the payment of certain related legal fees, as described below. After taking into account the settlement expense, all other items of G&A decreased $526,000 year over year. Of this net variance, there was a $481,000 decrease in the level of corporate incentive compensation and a $573,000 decrease in other items of G&A; partially offset by $528,000 increased external costs incurred specifically to comply with Section 404 of Sarbanes-Oxley. The total direct external costs incurred during 2005 for Section 404 compliance totaled approximately $2,300,000. A significant portion of this related to costs incurred in 2005 to satisfy the first year efforts for Section 404 compliance.
The $3,800,000 accrued for settlement costs ($3,500,000) and the legal fees ($300,000) relates to a legal action, commenced in 2000, against the Company, the Operating Partnership and Home Leasing Corporation. Home Leasing was owned by Nelson B. Leenhouts and Norman Leenhouts, who are the Co-Chairs of the Board of Directors of the Company. The Company was originally formed to expand and continue Home Leasing's business. The essence of the complaint was that the entity in which the plaintiffs were investors was wrongfully excluded from the Company's initial public offering. In their original complaint, plaintiffs sought damages in the amount of $3,000,000. In the subsequent discovery process, plaintiffs increased damages sought to $10,000,000. Payment in settlement and of legal fees was made on behalf of Home Leasing as well as the Company and the Operating Partnership in recognition of the fact that the matters alleged in the action against Home Leasing related directly and solely to the promotion and creation of the Company.
Interest expense increased in 2005 by $15,033,000 as a result of the increased borrowings in connection with acquisition of the 2005 Acquisition Communities, and a full year of interest expense for the 2004 Acquisition Communities. In addition, amortization from deferred charges relating to the financing of properties totaled $1,975,000 and $1,766,000, and was included in interest expense for 2005 and 2004, respectively.

41
Included in interest expense are prepayment penalties which decreased in 2005 by $158,000 as compared to 2004. During 2005, the Company incurred a total of $147,000 in prepayment penalties in connection with the refinancing or payoff of certain mortgages compared to $305,000 in 2004.
Depreciation and amortization expense increased $10,234,000 due to the additional depreciation expense on the 2005 Acquisition Communities and a full year of depreciation expense for the 2004 Acquisition Communities, as well as the incremental depreciation on the capital expenditures for additions and improvements to the Core Properties in 2005 and 2004 of $64,592,000 and $68,510,000, respectively.
Impairment of assets held as General Partner decreased from $1,116,000 in 2004 to $400,000 in 2005. During 2005, the Company recorded impairment charges of $400,000 relating to the Company's estimate of fair market value of the one remaining VIE. During 2004, the Company recorded impairment charges of $1,116,000 (all in the first quarter). Of this total, $171,000 represented advances made during the first quarter of 2004 to certain of the affordable property limited partnerships which the Company believed would not be repaid upon the sale of the loans. The remaining $945,000 pertained to an additional net impairment charge taken on the 38 properties included in the Company's planned disposition of its affordable portfolio to reduce the investment in the partnerships based upon the revisions to the sale contract in the first quarter. In connection with FIN 46R, the Company was required to consolidate the majority of the affordable limited partnerships results of operations beginning April 1, 2004.
The equity in losses of unconsolidated affiliates of $538,000 is primarily the result of the general partner recording a greater share of the underlying investment's losses due to the loans and advances to certain of the affordable property limited partnerships where the limited partner has no capital account. This is pursuant to the accounting requirements of EITF 99-10, "Percentage Used to Determine the Amount of Equity Method Losses."
Minority interest decreased $575,000 as a direct result of the decrease in income from operations over the prior year.
Included in discontinued operations for the year-ended December 31, 2005, are the 2006 and 2005 Disposed Communities.
Included in the $53,975,000 gain on disposition of property reported for the year 2005 is the sale of four apartment communities where the Company has recorded a combined gross gain on sale of $73,022,000, net of minority interest of $24,227,000. In addition, the Company recorded a $7,686,000 gain, net of minority interest of $2,506,000, during the year related to the disposal of two affordable partnerships.
In connection with the adoption of FIN 46R, the Company recorded a $321,000 cumulative effect charge of a change in accounting principle in the first quarter of 2004. This charge was the result of negative capital accounts of minority interest partners that were absorbed by the Company.
Net income increased $34,490,000 primarily due to the increase in gain on sale of discontinued operations of $42,558,000 in 2005 compared to 2004; partially offset by $5,192,000 lower income from the operation of discontinued operations in 2005 compared to 2004.
Liquidity and Capital Resources
The Company's principal liquidity demands are expected to be distributions to the common stockholders and holders of UPREIT Units,, capital improvements and repairs and maintenance for the properties, acquisition and development of additional properties, stock repurchases, the redemption of the Series F Perpetual Preferred shares described above, and debt repayments. The Company may also acquire equity ownership in other public or private companies that own and manage portfolios of apartment communities. Management anticipates the acquisition of properties of approximately $400 million in 2007, although there can be no assurance that such acquisitions will actually occur.
The Company intends to meet its short-term liquidity requirements through net cash flows provided by operating activities and its existing bank line of credit, described below. The Company considers its ability to generate cash to be adequate to meet all operating requirements and make distributions to its stockholders in accordance with the provisions of the Internal Revenue Code, as amended, applicable to REITs.

42
To the extent that the Company does not satisfy its long-term liquidity requirements through net cash flows provided by operating activities and the line of credit, it intends to satisfy such requirements through property debt financing, proceeds from the sale of properties, the issuance of UPREIT Units, proceeds from sales of its common stock through the Dividend Reinvestment Plan, or issuing additional common shares, shares of the Company's preferred stock, or other securities. As of December 31, 2006, the Company owned 19 properties, with 3,816 apartment units, which were unencumbered by debt.
During 2006, the Company sold 39 communities for a total sales price of $495.3 million. The Company sold four communities during 2005 for a total sales price of $142.6 million. The Company was able to sell these properties at an average capitalization rate of 6.8% and reinvest in the acquisition of properties with more growth potential at an expected first year cap rate of 6.4%. Management has included in its operating plan that the Company will strategically dispose of assets totaling approximately $50 million in 2007, although there can be no assurance that such dispositions will actually occur.
In May 1998, the Company's Form S-3 Registration Statement was declared effective relating to the issuance of up to $400 million of common stock, preferred stock or other securities. As of December 31, 2006, the Company continued to have available securities under the registration statement in the aggregate amount of $144,392,000.
In June 2000, the Company completed the sale of $25 million of Series D Preferred Stock in a private transaction with The Equitable Life Assurance Society of the United States. The Series D Preferred Stock carried an annual dividend rate equal to the greater of 8.775% or the actual dividend paid on the Company's common shares into which the preferred shares could be converted. The stock had a conversion price of $30 per share and a five-year, non-call provision. On May 26, 2005, all 250,000 shares of the Series D Preferred Stock were converted into 833,333 shares of common stock. The conversion of preferred shares to common shares did not have an effect on the reported results of operations.
In March, 2002, the Company issued 2,400,000 shares of its 9.00% Series F Cumulative Redeemable Preferred Stock ("Series F Preferred Shares"), with a $25.00 liquidation preference per share. This offering generated net proceeds of approximately $58 million. The net proceeds were used to fund the repurchase of the Company's Series B Preferred Stock, property acquisitions, and property upgrades. The Series F Preferred Shares are redeemable by the Company at anytime on or after March 25, 2007 at a redemption price of $25.00 per share, plus any accumulated, accrued and unpaid dividends. The Company plans to redeem the Series F Preferred on March 26, 2007. Each Series F Preferred share receives an annual dividend equal to 9.00% of the liquidation preference per share (equivalent to a fixed annual amount of $2.25 per share).
In 2000, the Company obtained an investment grade rating from Fitch, Inc. The rating in effect at December 31, 2006 (no change from initial rating) is a corporate credit rating of "BBB" (Triple-B), with a rating of "BBB-" (Triple-B Minus) for Series F Preferred Stock.
The Company issued $20,397,000, $55,600,000 and $12,100,000 of UPREIT Units as consideration for acquired properties in 2006, 2005 and 2004, respectively.
In 1997, the Company's Board of Directors approved a stock repurchase program under which the Company may repurchase shares of its outstanding common stock and UPREIT Units. The shares/units may be repurchased through open market or privately negotiated transactions at the discretion of Company management. The Board's action did not establish a target price or a specific timetable for repurchase. At December 31, 2004, there was approval remaining to purchase 2,000,000 shares. During 2005, the Company repurchased 2,779,805 shares at a cost of $111,738,000. On each of February 16, 2005 and November 4, 2005, the Board of Directors approved a 2,000,000 share increase in the stock repurchase program, resulting in a remaining authorization level of 3,220,195 shares at December 31, 2005. During 2006, the Company repurchased 2,613,747 shares at a cost of $142,532,597. On October 27, 2006 the Board of Directors approved a 2,000,000-share increase in the stock repurchase program, resulting in a remaining authorization level of 2,606,448 shares as of December 31, 2006. During 2007, the Company will monitor stock prices, the published net asset value, and acquisition alternatives to determine the current best use of capital between the two major uses of capital – stock buyback and acquisitions.

43
The Company has a Dividend Reinvestment and Direct Stock Purchase Plan (the "DRIP"). The DRIP provides the stockholders of the Company an opportunity to automatically invest their cash dividends in common stock. In addition, eligible participants may make monthly payments or other voluntary cash investments in shares of common stock. The maximum monthly investment without prior Company approval is currently $10,000. In the fourth quarter of 2004, the Company began meeting share demand in the program through share repurchase by the transfer agent in the open market on the Company's behalf instead of new share issuance. This removes essentially 100% of the dilution caused by issuing new shares at a price less than the net asset value in an economic and efficient manner. During 2006 and 2005, 48,243 and 66,525 shares of common stock, respectively, were issued under this plan, which were covered by share repurchases. As the stock has been trading at an amount close to NAV, in the fourth quarter of 2006, the Company switched back to issuing new shares to meet demand.
Management monitors the relationship between the Company's stock price and its estimated NAV. During times when the difference between these two values is small, resulting in little "dilution" of NAV by common stock issuances, the Company can choose to issue new shares. At times when the gap between NAV and stock price is greater, the Company has the flexibility to satisfy the demand for DRIP shares with stock repurchased in the open market. In addition, the Company can issue waivers to DRIP participants to provide for investments in excess of the $10,000 maximum monthly investment. No such waivers were granted during 2006 or 2005.
On October 24, 2006, the Company issued $200 million of exchangeable senior notes under an Indenture Agreement. This offering generated net proceeds of $195.8 million. The coupon rate is 4.125%. The notes are exchangeable into cash equal to the principal amount of the notes and, at the Company’s option, cash or common stock for the exchange value (to the extent that the market price of common stock exceeds the initial exchange price of $73.34 per share) subject to adjustment. Upon an exchange of the notes, the Company will settle any amounts up to the principal amount of the notes in cash and the remaining exchange value, if any, will be settled, at the Company’s option, in cash, common stock or a combination of both. The notes are not redeemable at the option of the Company for five years, except to preserve the status of the Company as a REIT.
Holders of the notes may require the Company to repurchase the notes upon the occurrence of certain designated events. In addition, prior to November 1, 2026, the holders may require the Company to repurchase the notes on November 1, 2011, 2016 and 2021. The notes will mature on November 1, 2026, unless previously redeemed, repurchased or exchanged in accordance with their terms prior to that date.
Noteholders may also require an exchange of the notes subsequent to December 31, 2006 should the closing sale price of common stock exceed 130% of the exchange price for a certain period of time or should the trading price on the notes be less than 98% of the product of the closing sales price of common stock multiplied by the applicable exchange rate for a certain period of time.
The notes are structurally subordinated to the secured indebtedness of the Company. The Company is not subject to any financial covenants under the Indenture. In addition, the Indenture will not restrict the ability to pay distributions, incur debt or issue or repurchase securities.
On November 23, 2004, the Company signed a supplemental demand note with M&T Bank. The note had a maximum principal amount of $42 million with interest at 1.25% over the one-month LIBOR rate. The demand note was entered into to fund the Company’s stock repurchase program. The Company had no outstanding balance on the note as of December 31, 2004. In connection with the increased borrowing capacity of the line of credit as described above, this supplemental note was terminated during the third quarter of 2005.
On November 23, 2005, the Company executed a Standard Libor Grid Note with M&T Bank. The note had a maximum principal amount of $40 million with an interest rate at .95% over the one-month LIBOR. Proceeds from this demand note were utilized to fund the Company’s stock repurchase program. The Company had no outstanding balance on the note as of December 31, 2005 and it was terminated.
As of December 31, 2006, the Company had an unsecured line of credit of $140,000 of which there was no outstanding balance. Provided that no event of default under this agreement has occurred, the Company may request on or before September 1, 2007 that the lenders increase the line of credit to an amount not to exceed $190,000. The Company has had no occurrences of default as of December 31, 2006. The line of credit is led by Manufacturers

44
and Traders Trust Company (“M&T Bank”), as Administrative Agent, with three other participants: Citizens Bank of Rhode Island, Chevy Chase Bank, F.S.B., and Comerica Bank. Borrowings under the line of credit bear interest at 0.75% over the one-month LIBOR. The one-month LIBOR was 5.32% at December 31, 2006. The LIBOR interest rate plus 0.75% was 6.07% at December 31, 2006.
Increases in interest rates will raise the Company's interest expense on any outstanding balances and as a result would affect the Company's results of operations and financial condition. The line of credit expires on September 1, 2008 and can be extended one year upon satisfaction of certain conditions. The credit agreement relating to this line of credit requires the Company to maintain certain financial ratios and measurements. The Company was in compliance with these financial covenants for the year ended December 31, 2006.
As of December 31, 2006, the weighted average rate of interest on the Company's $1.9 billion mortgage debt was 5.8% and the weighted average maturity of such indebtedness was approximately six and one half years. Approximately 98.6% of total indebtedness (including the exchangeable senior notes) is at fixed rates. This limits the exposure to changes in interest rates, minimizing the effect of interest rate fluctuations on the Company's results of operations and cash flows.
The Company's net cash provided by operating activities increased from $136,466,000 for the year ended December 31, 2005, to $162,996,000 for the year ended December 31, 2006. The increase was principally due to changes in other assets, accounts payable and accrued liabilities. The change in other assets was principally due to the use of a $7,303,000 deposit for the acquisition of a property in 2006 and a $6,297,000 decrease in 2006 due to the 2006 Disposed Communities. The increase in liabilities over the prior year was primarily due to higher accrued interest of $1,541,000 for the exchangeable senior notes, $1,089,000 accrued interest on debt associated with 2006 and 2005 Acquisition Communities; $1,842,000 higher accrued bonus with the remaining increase due to higher accounts payable and other accrued expenses at the end of 2006 as compared to the prior year end.
Cash provided by (used in) investing activities increased from ($179,944,000) used in 2005 to $159,653,000 provided by in 2006. The dramatic increase in 2006 is attributable to the $349,384,000 increase in proceeds from 2006 Disposed Communities. Also, cash used in the purchase of properties was $31,848,000 lower in 2006 as compared to 2005, and funds added to escrow were $38,713,000 higher in 2006.
Cash provided by (used in) financing activities decreased from $40,944,000 provided by in 2005 to ($209,828,000) used in 2006 primarily due to $167,858,000 less cash provided by debt refinancings; $150,865,000 in mortgage retirements for the 2006 Disposed Communities; $109,000,000 cash used to pay off the line of credit and $34,449,000 higher repurchases of common stock, partially offset by $195,800,000 proceeds from the sale of exchangeable senior notes and $16,536,000 higher proceeds from stock option exercises.
On February 7, 2007, the Board of Directors approved a dividend on the Company's common shares of $.65 per share for the period from October 1, 2006 to December 31, 2006. This is the equivalent of an annual distribution of $2.60 per share. In addition, the Company declared a dividend of $0.5625 per share on its Series F Cumulative Redeemable Preferred Stock for the quarter ended February 28, 2007. The dividends were paid on February 28, 2007 to shareholders of record on February 16, 2007.
Critical Accounting Policies
The preparation of financial statements in conformity with accounting principles generally accepted in the United States of America requires management to make estimates and assumptions in certain circumstances that affect amounts reported in the accompanying consolidated financial statements and related notes. In preparing these financial statements, management has utilized information available including industry practice and its own past history in forming its estimates and judgments of certain amounts included in the financial statements, giving due consideration to materiality. It is possible that the ultimate outcome as anticipated by management in formulating its estimates inherent in these financial statements may not materialize. However, application of the accounting policies below involves the exercise of judgment and use of assumptions as to future uncertainties and, as a result, actual results could differ from these estimates. In addition, other companies may utilize different estimates which may impact comparability of the Company's results of operations to those of companies in similar businesses.

45
Revenue Recognition
The Operating Partnership leases its residential apartment units under leases with terms generally one year or less. Rental income is recognized on a straight-line basis over the related lease term. As a result, deferred rents receivable are created when rental income is recognized during the concession period of certain negotiated leases and amortized over the remaining term of the lease. In accordance with SFAS 141, the Company recognizes rental revenue of acquired in-place "above and below" market leases at their fair value over the weighted average remaining lease term. Property other income, which consists primarily of income from operation of laundry facilities, utility recovery, administrative fees, garage and carport rentals and miscellaneous charges to residents, is recognized when earned (when the services are provided, or when the resident incurs the charge).
Property management fees are recognized when earned based on a contractual percentage of net monthly cash collected on rental income.
Real Estate
Real estate is recorded at cost. Costs related to the acquisition, development, construction and improvement of properties are capitalized. Recurring capital replacements typically include carpeting and tile, appliances, HVAC equipment, new roofs, site improvements and various exterior building improvements. Non-recurring upgrades include, among other items, community centers, new appliances, new windows, kitchens and bathrooms. Interest costs are capitalized until construction is substantially complete. There was $1,087,000, $1,096,000 and $763,000 of interest capitalized in 2006, 2005 and 2004, respectively. Salaries and related costs capitalized for the years ended December 31, 2006, 2005 and 2004 were $2,097,000, $2,135,000 and $3,391,000, respectively. When retired or otherwise disposed of, the related asset cost and accumulated depreciation are cleared from the respective accounts and the net difference, less any amount realized from disposition, is reflected in income. Ordinary repairs and maintenance that do not extend the life of the asset are expensed as incurred.
Management reviews its long-lived assets used in operations for impairment when, in accordance with SFAS No. 144, Accounting for the Impairment or Disposal of Long Lived Assets (“SFAS 144”), there is an event or change in circumstances that indicates an impairment in value. An asset is considered impaired when the undiscounted future cash flows are not sufficient to recover the asset's carrying value. If such impairment is present, an impairment loss is recognized based on the excess of the carrying amount of the asset over its fair value. The Company records impairment losses and reduces the carrying amounts of assets held for sale when the carrying amounts exceed the estimated selling proceeds less the costs to sell.
The Company accounts for its acquisitions of investments in real estate in accordance with SFAS No. 141, Business Combinations (“SFAS 141”), which requires the fair value of the real estate acquired to be allocated to the acquired tangible assets, consisting of land, building, and personal property and identified intangible assets and liabilities, consisting of the value of above-market and below-market leases, value of in-place leases and value of resident relationships, based in each case on their fair values. The Company considers acquisitions of operating real estate assets to be businesses as that term is defined in Emerging Issues Task Force Issue No. 98-3, Determining Whether a Nonmonetary Transaction Involves Receipt of Productive Assets or of a Business.
The Company allocates purchase price to the fair value of the tangible assets of an acquired property (which includes the land, building, and personal property) determined by valuing the property as if it were vacant. The as-if-vacant value is allocated to land, buildings, and personal property based on management's determination of the relative fair values of these assets.
Above-market and below-market in-place lease values for acquired properties are recorded based on the present value (using an interest rate which reflects the risks associated with the leases acquired) of the difference between (i) the contractual amounts to be paid pursuant to the in-place leases and (ii) management's estimate of fair market lease rates for the corresponding in-place leases, measured over a period equal to the remaining non-cancelable term of the lease. The capitalized above-market lease values are included in other assets and are amortized as a reduction of rental income over the remaining non-cancelable terms of the respective leases. The capitalized below-market lease values are included in accrued expenses and other liabilities and are amortized as an increase to rental income over the initial term of the respective leases.

46
Other intangible assets acquired include amounts for in-place lease values that are based upon the Company's evaluation of the specific characteristics of the leases. Factors considered in these analyses include an estimate of carrying costs during hypothetical expected lease-up periods considering current market conditions, and costs to execute similar leases. The Company also considers information obtained about each property as a result of its pre-acquisition due diligence, marketing and leasing activities in estimating the fair value of the tangible and intangible assets acquired. In estimating carrying costs, management also includes real estate taxes, insurance and other operating expenses and estimates of lost rentals at market rates during the expected lease-up periods depending on the property acquired.
The total amount of other intangible assets acquired is further allocated to resident relationships, which includes intangible values based on management's evaluation of the specific characteristics of the residential leases and the Company's resident retention history.
The value of in-place leases and resident relationships are amortized and included in depreciation and amortization expense over the initial term of the respective leases.
The acquisitions of minority interests for shares of the Company's common stock are recorded under the purchase method with assets acquired reflected at the fair market value of the Company's common stock on the date of acquisition. The acquisition amounts are allocated to the underlying assets based on their estimated fair values. During 2006 and 2005, there were 3.8 million and 0.2 million shares of UPREIT Units converted to common stock, respectively. The Company made an adjustment in the amount of $124.6 million and $5.2 million, respectively, to record the fair market value of the conversions.
Discontinued Operations
The Company reports its property dispositions as discontinued operations as prescribed by the provisions of SFAS No. 144, Accounting for the Impairment or Disposal of Long-Lived Assets (“SFAS 144”). Pursuant to the definition of a component of an entity in SFAS 144, assuming no significant continuing involvement by the former owner after the sale, the sale of an apartment community is considered a discontinued operation. In addition, apartment communities classified as held for sale are also considered a discontinued operation. The Company generally considers assets to be held for sale when all significant contingencies surrounding the closing have been resolved, which often corresponds with the actual closing date. As of December 31, 2005, the Company classified 21 properties as held for sale. These 21 properties were sold during 2006 and are included in discontinued operations for all periods presented and classified as held for sale as of December 31, 2005.
Included in discontinued operations for the three years ended December 31, 2006 are the operating results, net of minority interest, of 48 apartment community dispositions (39 sold in 2006, 4 sold in 2005 and 5 sold in 2004). In addition, discontinued operations for the years ended December 31, 2005 and 2004 includes the operating results of four VIEs sold during 2005. For purposes of the discontinued operations presentation, the Company only includes interest expense associated with specific mortgage indebtedness of the properties that are considered discontinued operations.
Capital Improvements
The Company has a policy to capitalize costs related to the acquisition, development, rehabilitation, construction, and improvement of properties. Capital improvements are costs that increase the value and extend the useful life of an asset. Ordinary repair and maintenance costs that do not extend the useful life of the asset are expensed as incurred. Costs incurred on a lease turnover due to normal wear and tear by the resident are expensed on the turn. Recurring capital improvements typically include: appliances, carpeting and flooring, HVAC equipment, kitchen/bath cabinets, new roofs, site improvements and various exterior building improvements. Non-recurring upgrades include, among other items: community centers, new windows, and kitchen/bath apartment upgrades. The Company capitalizes interest and certain internal personnel costs related to the communities under rehabilitation and construction.

47
The Company is required to make subjective assessments as to the useful lives of its properties and improvements for purposes of determining the amount of depreciation to reflect on an annual basis. These assessments have a direct impact on the Company's net income.
Federal Income Taxes
The Company has elected to be taxed as a real estate investment trust ("REIT") under the Internal Revenue Code of 1986, as amended, commencing with the taxable year ended December 31, 1994. As a result, the Company generally is not subject to Federal or State income taxation at the corporate level to the extent it distributes annually at least 90% of its REIT taxable income to its shareholders and satisfies certain other requirements. For the years ended December 31, 2006, 2005 and 2004, the Company distributed in excess of 100% of its taxable income; accordingly, no provision has been made for federal income taxes in the accompanying consolidated financial statements. Stockholders of the Company are taxed on dividends and must report distributions from the Company as either ordinary income, capital gains, or as return of capital.
Included in total assets on the Consolidated Balance Sheets are deferred tax assets of $10,079,000 and $8,496,000 as of December 31, 2006 and 2005, respectively. The deferred tax assets were a result of the net losses associated with the affordable property portfolio sales during 2004 and 2003. Management does not believe it is more likely than not that these deferred assets will be used, and accordingly has recorded a reserve against the deferred tax assets of $10,078,000 and $8,421,000 for the years ended December 31, 2006 and 2005, respectively. The deferred tax assets are associated with HPRS who performs certain of the residential and development activities of the Company. HPRS historically provided commercial management services and provided loan advances to affordable housing entities owned through general partnership interests. As these activities are no longer provided, Management does not currently believe there is a source for future material taxable earnings for HPRS that would give rise to value for the deferred tax assets.
Variable Interest Entities
Effective March 31, 2004, the Company adopted FASB Interpretation No. 46R, Consolidation of Variable Interest Entities, an interpretation of ARB No. 51 – Consolidated Financial Statements. The interpretation addresses consolidation by businesses of special purpose entities (variable interest entities, "VIE"). The Company had made the determination that all 41 of the remaining limited partnerships at the time were Variable Interest Entities.
The Company determined that it was not the primary beneficiary in seven partnerships syndicated under U.S. Department of Housing and Urban Development subsidy programs, all of which have been sold as of December 31, 2005.
The Company had further determined that it was the primary beneficiary in 34 of the VIEs and, therefore, consolidated these entities effective March 31, 2004. Beginning with the second quarter of 2004, the Company consolidated the results of operations of the VIEs. Effective December 31, 2005, the Company had closed on the sale on all but one of the VIEs. The one remaining VIE is not considered held for sale and is included in the Consolidated Statement of Operations for the years ended December 31, 2006, 2005 and 2004.
The Company is currently the general partner in this one VIE with a total of 868 units syndicated using low income housing tax credits under Section 42 of the Internal Revenue Code. As general partner, the Company manages the day-to-day operations of this partnership for a management fee. In addition, the Company has certain operating deficit and tax credit guarantees to its limited partner. The Company is responsible for funding operating deficits to the extent there are any and can receive operating incentive awards if cash flows reach certain levels. The effect on the consolidated balance sheets of including this VIE as of December 31, 2006 and 2005 includes total assets of $20.5 and $21.3 million, total liabilities of $17.9 and $17.9 million, and minority interest of $2.6 and $3.4 million, respectively.
The Company believes the property operations conform to the applicable requirements as set forth above.

48
Acquisitions and Dispositions
In 2006, the Company acquired a total of eight communities with a total of 3,067 units for total consideration of $360,100,000, or an average of approximately $117,400 per unit. For the same time period, the Company sold 39 properties with a total of 9,705 units for total consideration of $495,300,000, or an average of approximately $51,000 per unit. The weighted average expected first year cap rate of the 2006 Acquisition Communities was 6.7% and of the 2006 Disposed Communities was 7.6%. The weighted average unleveraged IRR during the Company's ownership for the properties sold was 9.3%.
In 2005, the Company acquired a total of seven communities with a total of 2,430 units for total consideration of $283,400,000, or an average of approximately $116,900 per unit. For the same time period, the Company sold four properties with a total of 816 units for total consideration of $142,600,000, or an average of $174,700 per unit. The weighted average expected first year cap rate of the 2005 Acquisition Communities was 6.0% and of the 2005 Disposed Communities was 4.0%. The weighted average unleveraged IRR during the Company's ownership for the properties sold was 20.0%.
Contractual Obligations and Other Commitments
The primary obligations of the Company relate to its borrowings under the line of credit, exchangeable senior notes and mortgage notes payable. The Company’s line of credit matures in September 2008, and has no balance outstanding at December 31, 2006. The $1.9 billion in mortgage notes payable have varying maturities ranging from 1 to 36 years. The principal payments on the mortgage notes payable for the years subsequent to December 31, 2006, are set forth in the table below as "long-term debt."
The Company leases its corporate office space from an affiliate and the office space for its regional offices from third parties. The corporate office space requires an annual base rent plus a pro-rata portion of property improvements, real estate taxes, and common area maintenance. The regional office leases require an annual base rent plus a pro-rata portion of real estate taxes. These leases are set forth in the table below as "operating lease."
Purchase obligations represent those costs that the Company is contractually obligated to pay in the future. The significant components of this caption are costs for capital improvements at the Company’s properties, as well as costs for normal operating and maintenance expenses at the site level that are tied to contracts such as utilities, landscaping and grounds maintenance and advertising. The purchase obligations include amounts tied to contracts, some of which expire in 2007. It is the Company's intention to renew these normal operating contracts; however, there has been no attempt to estimate the length or future costs of these contracts.
Tabular Disclosure of Contractual Obligations: Payments Due by Period (in thousands)
Contractual Obligations Total 2007 2008 2009 2010 2011 Thereafter Long-term debt (1) $1,924,313 $171,500 $137,153 $68,351 $307,989 $285,509 $953,811
Operating lease 6,128 1,980 1,946 1,932 200 70 -
Purchase obligations 9,319 8,371 646 165 106 30 1
Total (2) $1,939,760 $181,851 $139,745 $70,448 $308,295 $285,609 $953,812
(1) Amounts include principal payments only. The Company will pay interest on outstanding indebtedness based on the rates and terms summarized in Note 4 to the Consolidated Financial Statements.
(2) The contractual obligations and other commitments in the table are set forth as required by Item 303(a)(5) of Regulation S-K promulgated by the SEC in January of 2003 and are not prepared in accordance with generally-accepted accounting principles.

49
As discussed in the section entitled "Variable Interest Entities," the Company, through its general partnership interest in an affordable property limited partnership, has guaranteed the Low Income Housing Tax Credits to limited partners in this partnership totaling approximately $3 million. With respect to the guarantee of the low income housing tax credits, the Company believes the property's operations conform to the applicable requirements and does not anticipate any payment on the guarantee. In addition, the Company, acting as general partner in this partnership, is obligated to advance funds to meet partnership operating deficits.

50
In connection with the issuance of the Series F Preferred Stock, the Company is required to maintain for each fiscal quarterly period a fixed charge coverage ratio, as defined in the Series F Cumulative Redeemable Preferred Stock Article Supplementary, of 1.75 to 1.0.
The fixed charge coverage ratio and the components thereof do not represent a measure of cash generated from operating activities in accordance with generally accepted accounting principles and are not necessarily indicative of cash available to fund cash needs. Further, this ratio should not be considered as an alternative measure to net income as an indication of the Company’s performance or of cash flow as a measure of liquidity.
The calculation of the fixed charge coverage ratio for the four most recent quarters since the issuance of the Series F Preferred Stock are presented below (in thousands). EBITDA is defined in the Series F Cumulative Redeemable Preferred Stock Article Supplementary as consolidated income before gain (loss) on disposition of property and business, minority interest and extraordinary items, before giving effect to expenses for interest, taxes, depreciation and amortization. Net operating income from discontinued operations in the calculation below is defined as total revenues from discontinued operations less operating and maintenance expenses.
Calculation Presented for Series F Covenants Three-months ended Dec. 31 Sept. 30 June 30 Mar. 31 2006 2006 2006 2006 EBITDA Total revenues $ 118,748 $ 115,255 $ 121,947 $ 119,416 Net operating income from discontinued operations 3,975 5,125 4,950 5,017 Operating and maintenance expense (49,781) (45,650) (49,397) (58,135) General and administrative expense (5,923) (5,607) (6,057) (5,039) $ 67,019 $ 69,123 $ 71,443 $ 61,259 Fixed Charges Interest expense $ 27,800 $ 26,637 $ 27,717 $ 27,195 Interest expense on discontinued operations 7,691 1,279 4,246 1,286 Preferred dividends 1,350 1,350 1,350 1,350 Capitalized interest 79 349 346 313 $ 36,920 $ 29,615 $ 33,659 $ 30,144
Fixed charge coverage ratio: 1.82 2.33 2.12 2.03

51
Capital Improvements
The Company has a policy of capitalizing costs related to the acquisition, development, rehabilitation, construction and improvement of properties. Capital improvements are costs that increase the value and extend the useful life of an asset. Ordinary repair and maintenance costs that do not extend the useful life of the asset are expensed as incurred. Costs incurred on a lease turnover due to normal wear and tear by the resident are expensed on the turn. Recurring capital improvements typically include: appliances, carpeting and flooring, HVAC equipment, kitchen/ bath cabinets, new roofs, site improvements and various exterior building improvements. Non-recurring upgrades include, among other items: community centers, new windows, and kitchen/bath apartment upgrades. The Company capitalizes interest and certain internal personnel costs related to the communities under rehabilitation and construction.
The table below is a list of the items that management considers recurring, non-revenue enhancing capital and maintenance expenditures for a standard garden style apartment. Included are the per unit replacement cost and the useful life that management estimates the Company incurs on an annual basis.
Maintenance Capitalized Expense Total Capitalized Expenditure Cost per Cost per Cost per Useful Per Unit Unit Unit Category Unit Life(1) Per Year(2) Per Year(3) Per Year
Appliances $1,000 18 $ 56 $ 5 $ 61 Blinds/Shades 130 6 22 6 28 Carpets/cleaning 840 6 140 97 237 Computers, equipment, misc.(4) 120 5 24 29 53 Contract repairs - - - 102 102 Exterior painting (5) 84 5 17 1 18 Flooring 250 8 31 - 31 Furnace/Air (HVAC) 765 24 32 43 75 Hot water heater 130 7 19 - 19 Interior painting - - - 138 138 Kitchen/bath cabinets 1,100 25 44 - 44 Landscaping - - - 106 106 New roof 800 24 33 - 33 Parking lot 400 15 27 - 27 Pool/ Exercise facility 100 16 6 23 29 Windows 980 36 27 - 27 Miscellaneous (6) 705 15 47 40 87
Total $7,404 $525 $590 $1,115 (1) Estimated weighted average actual physical useful life of the expenditure capitalized. (2) This amount is not necessarily incurred each and every year. Some years will be higher, or lower depending on
the timing of certain longer life expenditures. (3) These expenses are included in the Operating and maintenance line item of the Consolidated Statement of
Operations. Maintenance labor costs are not included in the $590 per unit estimate. All personnel costs for site supervision, leasing agents, and maintenance staff are combined and disclosed in the Company's same-store expense detail schedule.
(4) Includes computers, office equipment/furniture, and maintenance vehicles. (5) The level of exterior painting may be lower than other similar titled presentations as the Company's portfolio
has a significant amount of brick exteriors. In addition, the other exposed surfaces are most often covered in aluminum or vinyl.
(6) Includes items such as balconies, siding, and concrete/sidewalks.
In reviewing the breakdown of costs above, one must consider the Company's unique strategy in operating apartments which has been to improve every property every year regardless of age. Another part of its strategy is to

52
purchase older properties and rehab and reposition them to enhance internal rates of return. This strategy results in higher costs of capital expenditures and maintenance costs which is more than justified by higher revenue growth, higher net operating income growth and a higher rate of property appreciation.
The Company estimates that during 2006, approximately $525 per unit was spent on recurring capital expenditures. The table below summarizes the breakdown of capital improvements by major categories between recurring and non-recurring, revenue generating capital improvements as follows:
For the year ended December 31, (in thousands, except per unit data) 2006 2005
Recurring (a) Non-
recurring (a) Total Capital (a) Total Capital (a) Cap Ex Per Unit Cap Ex Per Unit Improvements Per Unit Improvements Per UnitNew buildings $ - $ - $ 2,392 $ 70 $ 2,392 $ 70 $ 4,433 $ 139 Major building improvements 3,111 91 14,263 417 17,374 508 16,634 520 Roof replacements 1,128 33 2,803 82 3,931 115 4,676 146 Site improvements 1,128 33 7,222 211 8,350 244 7,659 240 Apartment upgrades 2,256 66 14,207 416 16,463 482 17,788 556 Appliances 1,915 56 1,923 56 3,838 112 3,701 116 Carpeting/flooring 5,846 171 3,914 114 9,760 285 8,417 263 HVAC/mechanicals 1,744 51 9,989 292 11,733 343 9,677 303 Miscellaneous 821 24 2,263 66 3,084 90 2,770 87 Totals $17,949 $525 $58,976 $1,724 $76,925 $2,249 $75,755 $2,370 (a) Calculated using the weighted average number of units outstanding, including 31,253 core units, 2005 acquisition units of 2,430, and 2006 acquisition units of 505 for the year ended December 31, 2006 and 31,253 core units and 2005 acquisition units of 714 for the year ended December 31, 2005.
The schedule below summarizes the breakdown of total capital improvements between core and non-core as follows:
For the year ended December 31, (in thousands, except per unit data)
2006 2005 Recurring (a) Non-recurring (a) Total Capital (a) Total Capital (a) Cap Ex Per Unit Cap Ex Per Unit Improvements Per Unit Improvements Per UnitCore Communities $16,408 $525 $51,379 $1,644 $67,787 $2,169 $72,696 $2,326 2006 Acquisition Communities 265 525 297 588 562 1,113 - - 2005 Acquisition Communities 1,276 525 7,300 3,004 8,576 3,529 3,059 4,284 Subtotal 17,949 525 58,976 1,724 76,925 2,249 75,755 2,370 2006 Disposed Communities 3,552 525 3,515 519 7,067 1,044 12,965 1,336 2005 Disposed Communities - - - - - - 3,313 4,882 Corporate office expenditures (1) - - - - 3,560 - 1,117 - Totals $21,501 $525 $62,491 $1,526 $87,552 $2,051 $93,150 $2,173
(1) No distinction is made between recurring and non-recurring expenditures for corporate office. Corporate office expenditures includes principally computer hardware, software and office furniture and fixtures.
Environmental Issues
Phase I environmental site assessments have been completed on substantially all of the Owned Properties. As of December 31, 2006, there were no recorded amounts resulting from environmental liabilities as there were no known contingencies with respect thereto. Furthermore, no condition is known to exist that would give rise to a material liability for site restoration or other costs that may be incurred with respect to the sale or disposal of a property.
During the past few years, there has been media attention given to the subject of mold in residential communities. The Company has responded to this attention by providing to its community management the Company's "Operation and Maintenance Plan for the Control of Moisture". The Plan, designed to analyze and manage all exposures to

53
mold, has been implemented at all of the Company's communities. There have been only limited cases of mold identified to management due to the application and practice of the Plan. No condition is known to exist that would give rise to a material liability for site restoration or other costs that may be incurred with respect to mold.
Recent Accounting Pronouncements
In July 2006, the FASB issued Interpretation No. 48, Accounting for Uncertainty in Income Taxes (“FIN 48”). FIN 48 addresses the recognition and measurement of assets and liabilities associated with tax positions taken or expected to be taken in a tax return. FIN 48 is effective January 1, 2007. The Company reviewed its current tax positions for any potential uncertain tax positions that would qualify under FIN 48. Based on its review, the Company does not anticipate that the adoption of FIN 48 in January 2007 will have a material impact on the Company’s cash flows, results of operations, financial position or liquidity.
In September 2006, the FASB issued SFAS No. 157, Fair Value Measurements ("SFAS 157"). SFAS 157 defines fair value, establishes a framework for measuring fair value in generally accepted accounting principles, and expands disclosures about fair value measurements. SFAS 157 applies under other accounting pronouncements that require or permit fair value measurements; the FASB having previously concluded in those accounting pronouncements that fair value is the relevant measurement attribute. Accordingly, SFAS 157 does not require any new fair value measurements. SFAS 157 is effective for financial statements issued for fiscal years beginning after November 15, 2007, and interim periods within those fiscal years. The Company is required to adopt SFAS 157 in the first quarter of 2008. The Company is currently evaluating the impact that SFAS 157 will have on its financial statements.
Economic Conditions
Substantially all of the leases at the communities are for a term of one year or less, which enables the Company to seek increased rents upon renewal of existing leases or commencement of new leases. These short-term leases minimize the potential adverse effect of inflation on rental income, although residents may leave without penalty at the end of their lease terms and may do so if rents are increased significantly.
Historically, real estate has been subject to a wide range of cyclical economic conditions, which affect various real estate sectors and geographic regions with differing intensities and at different times. Starting in 2001 and continuing into 2004 many regions of the United States had experienced varying degrees of economic recession and certain recessionary trends, such as a temporary reduction in occupancy and reduced pricing power limiting the ability to aggressively raise rents. Starting in the second half on 2004 and continuing into 2005 and 2006, we have seen a reversal of these recessionary trends. In light of this, we will continue to review our business strategy; however, we believe that given our property type and the geographic regions in which we are located, we do not anticipate any changes in our strategy or material effects on financial performance.
Contingencies
The Company is not a party to any legal proceedings which are expected to have a material adverse effect on the Company's liquidity, financial position or results of operations. The Company is subject to a variety of legal actions for personal injury or property damage arising in the ordinary course of its business, most of which are covered by liability insurance. Various claims of employment and resident discrimination are also periodically brought. While the resolution of these matters cannot be predicted with certainty, management believes that the final outcome of such legal proceedings and claims will not have a material adverse effect on the Company's liquidity, financial position or results of operations.
During April, 2004, the Company finalized negotiations with New York State settling a sales and use tax audit covering the period June 1, 1999 through May 31, 2002. The total cost to the Company as a result of the audit amounted to $861,000. This was included in the first quarter 2004 results and allocated $448,000 to expense and $413,000 capitalized to real estate assets for improvements.
54
As a result of this audit, during the second quarter of 2004, the Company examined its sales and use tax compliance in the other states in which the Company operates. Based upon its internal analysis, the Company estimated its liability as of June 30, 2004 in those states where it found non-compliance and recorded at June 30, 2004 a liability of $1,712,000. This was included in the second quarter results and allocated $761,000 to expense and $951,000 capitalized to real estate assets for improvements. The liability recorded relates to the period beginning on the later of: (i) the date the Company first purchased property in the applicable state; or (ii) January 1, 1997 and ending on June 30, 2004. In addition, the Company increased the liability for sales tax exposure by $68,000 for the six-month period ended December 31, 2004. The Company filed Voluntary Disclosure Agreements (“VDAs”) with the four states where it had significant financial exposure. During the first six months of 2005, the Company signed VDAs with these states limiting the VDA filing period back to January 1, 2001, and the Company had satisfied all financial obligations under the VDAs. For the three- and six-month periods ended June 30, 2005, the Company had recorded adjustments to the liability for both the effects of signing the VDAs as well as for the results of the Company’s additional testing for the first six months. The net impact of these adjustments resulted in a decrease in real estate assets of $175,000, interest expense of $115,000 and operating expenses of $108,000 for a net decrease to the accrued liability of $398,000. During the third quarter of 2005, the Company finalized negotiations with New York State settling a sales tax audit covering the period June 1, 2002 through November 30, 2004. The settlement was not materially different from what had been accrued. The result of the payments on the VDAs and this New York State audit is that the sales tax accrual which had been $1,712,000 (as referenced above) has been reduced to $0 at December 31, 2005.
In connection with the issuance of the Series F Preferred Stock, the Company is required to maintain for each fiscal quarterly period a fixed charge coverage ratio, as defined in the Series F Cumulative Redeemable Preferred Stock Articles Supplementary to the Company's Articles of Incorporation, of 1.75 to 1.0. The fixed charge coverage ratio and the components thereof do not represent a measure of cash generated from operating activities in accordance with generally accepted accounting principles and are not necessarily indicative of cash available to fund cash needs. Further, this ratio should not be considered as an alternative measure to net income as an indication of the Company’s performance or of cash flow as a measure of liquidity. The Company has been in compliance with the covenant since the Series F Preferred Stock was issued. If the Company fails to be in compliance with this covenant for six or more consecutive fiscal quarters, the holders of the Series F Preferred Stock would be entitled to elect two directors to the board of directors of the Company.
Item 7A. Quantitative and Qualitative Disclosures About Market Risk
The Company’s primary market risk exposure is interest rate risk. At December 31, 2006 and December 31, 2005, approximately 89% and 91%, respectively, of the Company’s secured debt bore interest at fixed rates with a weighted average maturity of approximately 6 and 7 years, respectively, and a weighted average interest rate of approximately 5.77% and 5.95%, respectively, including the $28 million and $29 million, respectively, of secured debt which has been swapped to a fixed rate. The remainder of the Company’s secured debt bears interest at variable rates with a weighted average maturity of approximately 21 and 12 years, respectively, and a weighted average interest rate of 4.95% and 4.54%, respectively, at December 31, 2006 and December 31, 2005. The Company does not intend to utilize a significant amount of permanent variable rate debt to acquire properties in the future. On occasion, the Company may use its line of credit in connection with a property acquisition or stock repurchase with the intention of refinancing at a later date. The Company believes, however, that in no event would increases in interest expense as a result of inflation significantly impact the Company's distributable cash flow.
At December 31, 2006 and December 31, 2005, the interest rate risk on $28 million and $29 million, respectively, of such variable rate debt has been mitigated through the use of interest rate swap agreements (the “Swaps”) with major financial institutions. The Company is exposed to credit risk in the event of non-performance by the counter-parties to the Swaps. The Company believes it mitigates its credit risk by entering into these Swaps with major financial institutions. The Swaps effectively convert the variable rate mortgages to fixed rates of 5.35%, 5.39%, 8.22% and 8.40%.
At December 31, 2006 and December 31, 2005, the fair value of the Company’s fixed and variable rate secured debt, including the $28 million and $29 million, respectively, which was swapped to a fixed rate, amounted to a liability of $1.93 billion and $1.89 billion, respectively, compared to its carrying amount of $1.92 billion and $1.84 billion, respectively. The Company estimates that a 100 basis point increase in market interest rates at

55
December 31, 2006 would have changed the fair value of the Company’s fixed and variable rate secured debt to a liability of $1.85 billion.
The Company intends to continuously monitor and actively manage interest costs on its variable rate debt portfolio and may enter into swap positions based upon market fluctuations. In addition, the Company believes that it has the ability to obtain funds through additional debt and/or equity offerings and/or the issuance of UPREIT Units. Accordingly, the cost of obtaining such interest rate protection agreements in relation to the Company's access to capital markets will continue to be evaluated. The Company has not, and does not plan to, enter into any derivative financial instruments for trading or speculative purposes. As of December 31, 2006, the Company had no other material exposure to market risk.
Additional disclosure about market risk is incorporated herein by reference to the discussion under the heading "Results of Operations" in Item 7: Managements Discussion and Analysis of Financial Condition and Results of Operations.
Item 8. Financial Statements and Supplementary Data
The financial statements and supplementary data are listed under Item 15(a) and filed as part of this report on the pages indicated.
Item 9. Changes in and Disagreements with Accountants on Accounting and Financial Disclosure
None.
Item 9A. Controls and Procedures
Evaluation of Disclosure Controls and Procedures.
The Company maintains disclosure controls and procedures that are designed to ensure that information required to be disclosed in the reports filed or submitted by the Company under the Securities Exchange Act of 1934 is recorded, processed, summarized and reported within the time periods specified in the Securities and Exchange Commission’s rules and forms, and that such information is accumulated and communicated to the officers who certify the Company’s financial reports and to the other members of senior management and the Board of Directors.
The principal executive officer and principal financial officer evaluated, as of December 31, 2006, the effectiveness of the disclosure controls and procedures (as defined in Rules 13a-15(e) and 15d-15(e) under the Securities Exchange Act of 1934, as amended (the “Exchange Act”) and have determined that such disclosure controls and procedures are effective.
Management’s Annual Report on Internal Control Over Financial Reporting
The Company’s management is responsible for establishing and maintaining adequate internal control over financial reporting, as such term is defined in Exchange Act Rule 13a-15(f). Because of its inherent limitations, internal control over financial reporting may not prevent or detect misstatements. Also, projections of any evaluation of effectiveness to future periods are subject to the risk that controls may become inadequate because of changes in conditions, or that the degree of compliance with the policies or procedures may deteriorate. The Company’s internal control over financial reporting is a process designed under the supervision of the Company’s principal executive officer and principal financial officer to provide reasonable assurance regarding the reliability of financial reporting and the preparation of the Company’s financial statements for external reporting purposes in accordance with the United States of America generally accepted accounting principles.
Under the supervision and with the participation of management, including the Company’s principal executive officer and principal financial officer, the Company conducted an evaluation of the effectiveness of its internal control over financial reporting based on the framework in Internal Control – Integrated Framework issued by the Committee of Sponsoring Organizations of the Treadway Commission. Based on its evaluation under that

56
framework, management concluded that the Company’s internal control over financial reporting was effective as of December 31, 2006. In addition, management has not identified any material weaknesses in the Company's internal controls.
Management’s assessment of the effectiveness of the Company’s internal control over financial reporting as of December 31, 2006 has been audited by PricewaterhouseCoopers LLP, an independent registered public accounting firm, as stated in their report appearing herein, which expresses unqualified opinions on management’s assessment and on the effectiveness of the Company’s internal control over financial reporting as of December 31, 2006.
Changes in Internal Controls Over Financial Reporting
There were no changes in the internal controls over financial reporting that occurred during the fourth quarter of the year ended December 31, 2006 that have materially affected, or are reasonably likely to materially affect, the Company’s internal control over financial reporting.
Item 9B. Other Information
None.

57
PART III
Item 10. Directors and Executive Officers of the Registrant
Directors
The Board of Directors (the "Board") currently consists of twelve members. The terms for all of the directors of Home Properties expire at the 2007 Shareholders' Meeting.
The information sets forth, as of February 16, 2007, for each director of the Company such director's name, experience during the last five years, other directorships held, age and the year such director was first elected as director of the Company. Year First
Name of Director Age Elected Director William Balderston, III 79 1994 Josh E. Fidler 51 2004 Alan L. Gosule 66 1996 Leonard F. Helbig, III 61 1994 Roger W. Kober 73 1994 Nelson B. Leenhouts 71 1993 Norman Leenhouts 71 1993 Edward J. Pettinella 55 2001 Clifford W. Smith, Jr. 60 1994 Paul L. Smith 71 1994 Thomas S. Summer 53 2004 Amy L. Tait 48 1993
William Balderston, III has been a director of the Company since 1994. From 1991 to the end of 1992, he was an Executive Vice President of The Chase Manhattan Bank, N.A. From 1986 to 1991, he was President and Chief Executive Officer of Chase Lincoln First Bank, N.A., which was merged into The Chase Manhattan Bank, N.A. He is a Senior Trustee of the University of Rochester and a member of the Board of Governors of the University of Rochester Medical Center. Mr. Balderston is a graduate of Dartmouth College. As a result of the Company’s retirement policy, Mr. Balderston will not stand for re-election at the Company’s 2007 Annual Meeting of Stockholders.
Josh E. Fidler has been a director of the Company since August, 2004. Mr. Fidler is a Founding Partner of Boulder Ventures, Ltd., a manager of venture capital funds, which has been in operation since 1995. Since 1985, he has also been a principal in a diversified real estate development business known as The Macks Group. In 1999, the Company acquired 3,297 apartment units from affiliates of The Macks Group. Mr. Fidler was also a principal of the entity which owned a 240-unit apartment community which the Company purchased in 2004. He is a graduate of Brown University and received a law degree from New York University. Mr. Fidler is a member of the Maryland Region Advisory Board of SunTrust Bank, the Board of Johns Hopkins Medicine and President-elect of the Board of Trustees of The Park School.
Alan L. Gosule, has been a director of the Company since 1996. Mr. Gosule has been a partner in the New York Office of the law firm of Clifford Chance US LLP since August 1991 and prior to that time was a partner in the law firm of Gaston & Snow. Mr. Gosule is a graduate of Boston University and its Law School and received an LLM in Taxation from Georgetown University. Mr. Gosule also serves on the Board of Directors of MFA Mortgage Investments, Inc. He is a member of the Board of Advisors of Paloma, LLC, which is the general partner of Simpson Housing Limited Partnership, and is a voting trustee of F.L. Putnam Investment Management Company.
Leonard F. Helbig, III has been a director of the Company since 1994. Since September 2002 he has served as a Director of Integra Realty Advisors in Philadelphia. Between 1980 and 2002 he was employed with Cushman & Wakefield, Inc. From 1990 until 2002, Mr. Helbig served as President, Financial Services for Cushman & Wakefield, Inc. Prior to that and since 1984, Mr. Helbig was the Executive Managing Director of the Asset Services
58
and Financial Services Groups. He was a member of that firm's Board of Directors and Executive Committee. Mr. Helbig is a member of the Urban Land Institute, the Pension Real Estate Association and the International Council of Shopping Centers. Mr. Helbig is a graduate of LaSalle University and holds the MAI designation of the American Institute of Real Estate Appraisers.
Roger W. Kober has been a director of the Company since 1994. He was employed by Rochester Gas and Electric Corporation from 1965 until his retirement on January 1, 1998. From March 1996 until January 1, 1998, Mr. Kober served as Chairman and Chief Executive Officer of Rochester Gas and Electric Corporation. He is a Trustee Emeritas of Rochester Institute of Technology. Mr. Kober is a graduate of Clarkson College and holds a Masters Degree in Engineering from Rochester Institute of Technology.
Nelson B. Leenhouts has served as Board Co-Chair since his retirement as Co-Chief Executive Officer effective January 1, 2004. He had served as Co-Chief Executive Officer, President and a director of the Company since its inception in 1993. Since its formation, he has also served as a director of HPRS, for which he had also served in various officer capacities prior to his retirement. Mr. Leenhouts also served as a Senior Advisor to the Company pursuant to an Employment Agreement with a term that expired on December 31, 2006. In addition, Nelson Leenhouts was employed by the Company to fulfill additional responsibilities with respect to the Company’s development activities pursuant to a Development Agreement, the term of which also expired on December 31, 2006. Mr. Leenhouts subsequently entered into an Employment Agreement with a term that expires on December 31, 2007. Pursuant to the current Employment Agreement, Mr. Leenhouts will continue to lead the Company’s development activities. Nelson Leenhouts is the founder, and a co-owner, together with Norman Leenhouts, of Home Leasing, and has served as President of Home Leasing since 1967. He is a member of the Board of Directors of the Genesee Valley Trust Company. Nelson Leenhouts is a graduate of the University of Rochester. He is the twin brother of Norman Leenhouts.
Norman P. Leenhouts has served as Board Co-Chair since his retirement as Co-Chief Executive Officer effective January 1, 2004. He had served as Board Chair, Co-Chief Executive Officer and a director of the Company since its inception in 1993. Since its formation, he has also served as a director of HPRS. Mr. Leenhouts also served as a Senior Advisor to the Company pursuant to an Employment Agreement with a term that expired on December 31, 2006. Prior to January 1, 2006, Norman Leenhouts was a co-owner, together with Nelson Leenhouts, of Home Leasing, where he had served as Board Chair since 1971. He is currently the Chairman of Broadstone Ventures, LLC and Broadstone Real Estate, LLC, formed to contain the property management business of Home Leasing. He is a member of the Board of Trustees of the University of Rochester, Roberts Wesleyan College and The Charles E. Finney School. He is a graduate of the University of Rochester and is a certified public accountant. He is the twin brother of Nelson Leenhouts.
Edward J. Pettinella has served as President and Chief Executive Officer of the Company since January 1, 2004. He is also a director. He joined the Company in 2001 as an Executive Vice President and director. He is also the President and Chief Executive Officer of HPRS. From 1997 until February 2001, Mr. Pettinella served as President, Charter One Bank (NY Division) and Executive Vice President of Charter One Financial, Inc. From 1980 through 1997, Mr. Pettinella served in several managerial capacities for Rochester Community Savings Bank, Rochester, NY, including the positions of Chief Operating Officer and Chief Financial Officer. Mr. Pettinella serves on the Board of Directors of United Way of Greater Rochester, Rochester Business Alliance, The Lifetime Healthcare Companies, National Multi Housing Counsel, Syracuse University School of Business and the Geneseo Foundation Board. He is also on the Board of Governors of National Association of Real Estate Investment Trusts and is a member of Urban Land Institute. Mr. Pettinella is a graduate of the State University at Geneseo and holds an MBA Degree in finance from Syracuse University.
Clifford W. Smith, Jr. has been a director of the Company since 1994. Mr. Smith is the Epstein Professor of Finance of the William E. Simon Graduate School of Business Administration of the University of Rochester, where he has been on the faculty since 1974. He has written numerous books and articles on a variety of financial, capital markets and risk management topics and has held editorial positions for a variety of journals. Mr. Smith is a graduate of Emory University and has a PhD from the University of North Carolina at Chapel Hill.
Paul L. Smith has been a director of the Company since 1994. Mr. Smith was a director, Senior Vice President and the Chief Financial Officer of the Eastman Kodak Company from 1983 until he retired in 1993. He was a member

59
of the Financial Accounting Standards Advisory Council. He is currently a director of Constellation Brands, Inc. He is also a member of the Board of Trustees of the George Eastman House and Ohio Wesleyan University. Mr. Smith is a graduate of Ohio Wesleyan University and holds an MBA Degree in finance from Northwestern University.
Thomas S. Summer has been a director of the Company since August, 2004. Mr. Summer has been the Executive Vice President and Chief Financial Officer of Constellation Brands, Inc. since 1997. Mr. Summer and Constellation Brands have announced that Mr. Summer is retiring from that position on or about May 15, 2007. Prior to his employment by Constellation Brands, he held various positions in financial management with Cardinal Health, Inc., PepsiCo, Inc., and Inland Steel Industries. He is also a member of the Boards of Greatbatch, Inc. and AIDS Rochester, Inc. Mr. Summer is a graduate of Harvard University and holds an MBA degree in finance and accounting from the University of Chicago.
Amy L. Tait has served as a director of the Company since its inception in 1993. Effective February 15, 2001, Mrs. Tait resigned her full-time position as Executive Vice President of the Company and as a director of HP Management. She continued as a consultant to the Company pursuant to a consulting agreement that terminated on February 15, 2002. She is currently the Chief Executive Officer and a director of Broadstone Ventures, LLC and Broadstone Real Estate, LLC, where she also serves as Secretary. Mrs. Tait joined Home Leasing in 1983 and held several positions with the Company, including Senior and Executive Vice President and Chief Operating Officer. She currently serves on the M & T Bank Regional Advisory Board and the boards of the United Way of Rochester, Princeton Club of Rochester, Al Sigl Center, Center for Governmental Research, Allendale Columbia School, Monroe County Center for Civic Entrepreneurship and the Simon School Executive Advisory Committee. Mrs. Tait is a graduate of Princeton University and holds an MBA from the William E. Simon Graduate School of Business Administration of the University of Rochester. She is the daughter of Norman Leenhouts.
See Item 4A in Part I hereof for information regarding executive officers of the Company.
Section 16(a) Beneficial Ownership Reporting Compliance.
Section 16(a) of the Securities Exchange Act of 1934, as amended, (the "Exchange Act") requires the Company's executive officers and directors, and persons who own more than 10% of a registered class of the Company's equity securities, to file reports of ownership and changes in ownership with the Securities and Exchange Commission and the New York Stock Exchange. Officers, directors and greater than 10% shareholders are required to furnish the Company with copies of all Section 16(a) forms they file.
To the Company's knowledge, based solely on review of the copies of such reports furnished to the Company and written representations that no other reports were required during the fiscal year ended December 31, 2006, all Section 16(a) filing requirements applicable to its executive officers, directors and greater than 10% beneficial owners were satisfied on a timely basis, except that each of the following directors inadvertantly failed to report on a timely basis one transaction involving the sale of common shares as follows: William Balderston – sale of 666 shares of common stock; Norman Leenhouts – sale of 752 shares; and Amy L. Tait – sale of 4,759 shares. The three sales were subsequently reported on a Form 4.
Audit Committee, Audit Committee Independence and Financial Expert
The information required by this item is incorporated herein by reference to the Company’s proxy statement to be issued in connection with the Annual Meeting of Stockholders of the Company to be held on May 1, 2007 under “Audit Committee.” The proxy statement will be filed within 120 days after the end of the Company’s fiscal year.
Stockholder Nominations to Board
The information required by this item is incorporated herein by reference to the Company’s Proxy Statement to be issued in connection with the Annual Meeting of Stockholders of the Company to be held on May 1, 2007 under “Board of Directors.” The proxy statement will be filed within 120 days after the end of the Company’s fiscal year.

60
Code of Ethics
The Company has adopted a Code of Business Conduct and Ethics and a Code of Ethics for Senior Financial Officers, both which apply to the Company’s Chief Executive Officer, Chief Financial Officer, Chief Accounting Officer, Treasurer and Controller. Both codes are available on the Company’s Web site at www.homeproperties.com under the heading “Investors/Corporate Governance/Highlights.” In addition, the Company will provide a copy of the codes to anyone without charge, upon request addressed to the Corporate Secretary at Home Properties, Inc., 850 Clinton Square, Rochester, New York 14604.
The Company intends to disclose any amendment to its Code of Business Conduct and Ethics and its Code of Ethics for Senior Financial Officers on its Web site. In addition, in the event that the Company waives compliance by any of its directors and executive officers with the Code of Business Conduct and Ethics or compliance by any of the individuals subject to the Code of Ethics for Senior Financial Officers with that Code of Ethics, the Company will post on its Web site within four business days the nature of the waiver in satisfaction of its disclosure requirement under Item 5.05 of Form 8-K.
Corporate Guidelines and Committee Charters
The Board of Directors has adopted corporate Governance Guidelines and revised charters in compliance with applicable law and NYSE listing standards for the Company's Audit, Compensation, Corporate Governance/Nominating and Real Estate Investment Committees. The Guidelines and Charters are available on the Company's Web site, www.homeproperties.com, and by request addressed to the Corporate Secretary at Home Properties, Inc., 850 Clinton Square, Rochester, New York 14604.
Item 11. Executive Compensation
The information required by this Item is incorporated herein by reference to the Company's proxy statement to be issued in connection with the Annual Meeting of the Stockholders of the Company to be held on May 1, 2007 under "Executive Compensation." The proxy statement will be filed within 120 days after the end of the Company's fiscal year.
Item 12. Securities Ownership of Certain Beneficial Owners and Management and Related Stockholder Matters
The information required by this Item, including Equity Compensation Plan Information, is incorporated herein by reference to the Company's proxy statement to be issued in connection with the Annual Meeting of Stockholders of the Company to be held on May 1, 2007 under "Security Ownership of Certain Beneficial Owners and Management" and under "Equity Compensation Plan Information." The proxy statement will be filed within 120 days after the end of the Company's fiscal year.
Item 13. Certain Relationships and Related Transactions, and Director Independence
The information required by this Item is incorporated herein by reference to the Company's proxy statement to be issued in connection with the Annual Meeting of Stockholders of the Company to be held on May 1, 2007 under "Certain Relationships and Transactions." The proxy statement will be filed within 120 days after the end of the Company's fiscal year.
Item 14. Principal Accounting Fees and Services
The information required by this Item is incorporated herein by reference to the Company's proxy statement to be issued in connection with the Annual Meeting of Stockholders of the Company to be held on May 1, 2007 under “Report of the Audit Committee” and "Principal Accounting Fees and Services." The proxy statement will be filed within 120 days after the end of the Company's fiscal year.

61
PART IV
Item 15. Exhibits, Financial Statement Schedules
(a) 1 and 2. Financial Statements and Schedules
The financial statements and schedules listed below are filed as part of this annual report on the pages indicated.
HOME PROPERTIES, INC.
Consolidated Financial Statements Page Report of Independent Registered Public Accounting Firm F-2
Consolidated Balance Sheets as of December 31, 2006 and 2005 F-3
Consolidated Statements of Operations for the Years Ended December 31, 2006, 2005 and 2004 F-4
Consolidated Statements of Stockholders' Equity for the Years Ended December 31, 2006, 2005 and 2004 F-5
Consolidated Statements of Comprehensive Income for the Years Ended December 31, 2006, 2005 and 2004 F-6
Consolidated Statements of Cash Flows for the Years Ended December 31, 2006, 2005 and 2004 F-7
Notes to Consolidated Financial Statements F-8
Schedule II: Valuation and Qualifying Accounts F-38
Schedule III: Real Estate and Accumulated Depreciation
F-39
3. Exhibits Exhibit Number
Exhibit
1.0 Underwriting Agreement, dated May 9, 2006, between Home Properties, Inc., UBS Securities LLC and the selling shareholders named therein.
2.1 Agreement among Home Properties of New York, Inc. and Philip J. Solondz, Daniel Solondz and Julia Weinstein Relating to Royal Gardens I, together with Amendment No. 1
2.2 Agreement among Home Properties of New York, Inc and Philip Solondz and Daniel Solondz relating to Royal Gardens II, together with Amendment No. 1
2.24 Contribution Agreement dated March 2, 1998 among Home Properties of New York, L.P., Braddock Lee Limited Partnership and Tower Construction Group, LLC
2.25 Contribution Agreement dated March 2, 1998 among Home Properties of New York, L.P., Park Shirlington Limited Partnership and Tower Construction Group, LLC

62
Exhibit Number
Exhibit
2.27 Form of Contribution Agreement among Home Properties of New York, L.P. and Strawberry Hill Apartment Company LLLP, Country Village Limited Partnership, Morningside Six, LLLP, Morningside North Limited Partnership and Morningside Heights Apartment Company Limited Partnership with schedule setting forth material details in which documents differ from form
2.29 Form of Contribution Agreement dated June 7, 1999, relating to the CRC Portfolio with schedule setting forth material details in which documents differ from form
2.30 Form of Contribution Agreement relating to the Mid-Atlantic Portfolio with schedule setting forth material details in which documents differ from form
2.31 Contribution Agreement among Home Properties of New York, L.P., Leonard Klorfine, Ridley Brook Associates and the Greenacres Associates
2.33 Contribution Agreement among Home Properties of New York, L.P., Gateside-Bryn Mawr Company, L.P., Willgold Company, Gateside-Trexler Company, Gateside-Five Points Company, Stafford Arms, Gateside-Queensgate Company, Gateside Malvern Company, King Road Associates and Cottonwood Associates
2.34 Contribution Agreement between Old Friends Limited Partnership and Home Properties of New York, L.P. and Home Properties of New York, Inc., along with Amendments Number 1 and 2 thereto
2.35 Contribution Agreement between Deerfield Woods Venture Limited Partnership and Home Properties of New York, L.P.
2.36 Contribution Agreement between Macomb Apartments Limited Partnership and Home Properties of New York, L.P.
2.37 Contribution Agreement between Home Properties of New York, L.P. and Elmwood Venture Limited Partnership
2.38 Sale Purchase and Escrow Agreement between Bank of America as Trustee and Home Properties of New York, L.P.
2.39 Contribution Agreement between Home Properties of New York, L.P., Home Properties of New York, Inc. and S&S Realty, a New York General Partnership (South Bay)
2.40 Contribution Agreement between Hampton Glen Apartments Limited Partnership and Home Properties of New York, L.P.
2.41 Contribution Agreement between Home Properties of New York, L.P. and Axtell Road Limited Partnership
2.42 Contribution Agreement between Elk Grove Terrace II and III, L.P., Elk Grove Terrace, L.P. and Home Properties of New York, L.P.
2.43 Agreement for Purchase and Sale of Interests Southeast Michigan Portfolio, dated April 26, 2006, together with Second Amendment thereto (First Amendment superceded)
3.1 Articles of Amendment and Restatement of Articles of Incorporation of Home Properties of New York, Inc.
3.2 Articles of Amendment of the Articles of Incorporation of Home Properties of New York, Inc.
3.3 Articles of Amendment of the Articles of Incorporation of Home Properties of New York, Inc.
3.9 Amended and Restated By-Laws of Home Properties of New York, Inc. (Revised 12/30/96)
3.10 Series F Cumulative Redeemable Preferred Stock Articles Supplementary to the Amended and Restated Articles of Incorporation of Home Properties of New York, Inc.
3.11 Articles of Amendment to the Articles of Incorporation of Home Properties of New York, Inc.

63
Exhibit Number
Exhibit
3.12 Amendment Number One to Home Properties of New York, Inc. Amended and Restated Bylaws
4.1 Form of certificate representing Shares of Common Stock
4.2 Agreement of Home Properties of New York, Inc. to file instruments defining the rights of holders of long-term debt of it or its subsidiaries with the Commission upon request
4.8 Amended and Restated Stock Benefit Plan of Home Properties of New York, Inc.*
4.14 Directors' Stock Grant Plan*
4.16 Home Properties of New York, Inc., Home Properties of New York, L.P. Executive Retention Plan*
4.17 Home Properties of New York, Inc. Deferred Bonus Plan*
4.23 Home Properties of New York, Inc. Amendment Number One to the Amended and Restated Stock Benefit Plan*
4.26 Home Properties of New York, Inc. Amendment Number Two to the Amended and Restated Stock Benefit Plan*
4.27 Amendment No. One to Home Properties of New York, Inc. Deferred Bonus Plan*
4.29 Amendment No. Two to Deferred Bonus Plan*
4.31 Amended and Restated 2003 Stock Benefit Plan*
4.32 Second Amended and Restated Director Deferred Compensation Plan*
4.33 Seventh Amended and Restated Dividend Reinvestment and Direct Stock Purchase Plan
4.34 Indenture, dated October 24, 2006 between Home Properties, Inc., Home Properties, L.P. and Wells Fargo Bank, N.A., as trustee including the form of 4.125% Exchangeable Senior Notes due 2026 of Home Properties, L.P. and the Guarantee of Home Properties, Inc. with respect thereto
4.35 Registration Rights Agreement, dated October 24, 2006, between Home Properties, Inc., Home Properties, L.P. and Merrill Lynch & Co., Merrill Lynch, Pierce, Fenner & Smith Incorporated and Bear Stearns & Co., Inc.
10.1 Second Amended and Restated Agreement Limited Partnership of Home Properties of New York, L.P.
10.2 Amendments No. One through Eight to the Second Amended and Restated Agreement of Limited Partnership of Home Properties of New York, L.P.
10.3 Articles of Incorporation of Home Properties Management, Inc.
10.4 By-Laws of Home Properties Management, Inc.
10.5 Articles of Incorporation of Conifer Realty Corporation
10.6 Articles of Amendment to the Articles of Incorporation of Conifer Realty Corporation Changing the name to Home Properties Resident Services, Inc.
10.7 By-Laws of Conifer Realty Corporation (now, Home Properties Resident Services, Inc.)
10.8 Home Properties Trust Declaration of Trust, dated September 19, 1997
10.13 Indemnification Agreement between Home Properties of New York, Inc. and certain officers and directors*
10.15 Indemnification Agreement between Home Properties of New York, Inc. and Alan L. Gosule*
10.26 Amendment No. Nine to the Second Amended and Restated Agreement of Limited Partnership of the Operating Partnership

64
Exhibit Number
Exhibit
10.27 Master Credit Facility Agreement by and among Home Properties of New York, Inc., Home Properties of New York, L.P., Home Properties WMF I LLC and Home Properties of New York, L.P. and P-K Partnership doing business as Patricia Court and Karen Court and WMF Washington Mortgage Corp., dated as of August 28, 1998
10.28 First Amendment to Master Credit Facility Agreement, dated as of December 11, 1998 among Home Properties of New York, Inc., Home Properties of New York, L.P., Home Properties WMF I LLC and Home Properties of New York, L.P. and P-K Partnership doing business as Patricia Court and Karen Court and WMF Washington Mortgage Corp. and Fannie Mae
10.29 Second Amendment to Master Credit Facility Agreement, dated as of August 30, 1999 among Home Properties of New York, Inc., Home Properties of New York, L.P., Home Properties WMF I LLC and Home Properties of New York, L.P. and P-K Partnership doing business as Patricia Court and Karen Court and WMF Washington Mortgage Corp. and Fannie Mae
10.30 Amendments Nos. Ten through Seventeen to the Second Amended and Restated Limited Partnership Agreement
10.31 Amendments Nos. Eighteen through Twenty- Five to the Second Amended and Restated Limited Partnership Agreement
10.32 Credit Agreement, dated 8/23/99 between Home Properties of New York, L.P., certain lenders, and Manufacturers and Traders Trust Company as Administrative Agent
10.33 Amendment No. Twenty-Seven to the Second Amended and Restated Limited Partnership Agreement
10.34 Amendments Nos. Twenty-Six and Twenty-Eight through Thirty to the Second Amended and Restated Limited Partnership Agreement
10.37 2000 Stock Benefit Plan*
10.41 Home Properties of New York, L.P. Amendment Number One to Executive Retention Plan*
10.42 Amendments No. Thirty-One and Thirty-Two to the Second Amended and Restated Limited Partnership Agreement
10.49 Amendment No. Thirty Three to the Second Amended and Restated Limited Partnership Agreement
10.50 Amendment No. Thirty Five to the Second Amended and Restated Limited Partnership Agreement
10.51 Amendment No. Forty Two to the Second Amended and Restated Limited Partnership Agreement
10.52 Amendments Nos. Thirty Four, Thirty Six through Forty One, Forty Three and Forty Four to the Second Amended and Restated Limited Partnership Agreement
10.57 Amendment Nos. Forty-Five through Fifty-One to the Second Amendment and Restated Limited Partnership Agreement
10.58 Home Properties of New York, Inc. Amendment No. One to 2000 Stock Benefit Plan*
10.59 Home Properties of New York, Inc. Amendment No. Two to 2000 Stock Benefit Plan*
10.60 Amendment Nos. Fifty-Two to Fifty-Five to the Second Amended and Restated Limited Partnership Agreement
10.61 Amendment Nos. Fifty-Six to Fifty-Eight to the Second Amended and Restated Limited Partnership Agreement
10.62 Amendment No. Two to Credit Agreement
10.63 Purchase and Sale Agreement, dated as of January 1, 2004 among Home Properties of New York, L.P., Home Properties Management, Inc. and Home Leasing, LLC, dated January 1, 2004

65
Exhibit Number
Exhibit
10.64 Amendment Nos. Fifty-Nine through Sixty-Seven to the Second Amended and Restated Limited Partnership Agreement
10.65 Home Properties of New York, Inc. Amendment No. Three to 2000 Stock Benefit Plan*
10.68 Home Properties of New York, Inc. 2003 Stock Benefit Plan*
10.69 Amendment Number Two to Home Properties of New York, Inc. and Home Properties of New York, L.P. Executive Retention Plan*
10.70 Employment Agreement, dated as of May 17, 2004, between Home Properties, L.P., Home Properties, Inc. and Edward J. Pettinella*
10.71 Amendment Nos. Sixty-Eight through Seventy-Three to the Second Amended and Restated Limited Partnership Agreement
10.72 Summary of Non-Employee Director Compensation Effective January 1, 2007*
10.73 Summary of Named Executive Compensation for 2007
10.74 Amendment No. Three to Credit Agreement, dated April 1, 2004 between Home Properties, L.P., certain lenders, and Manufacturers and Traders Trust Company as Administrative Agent
10.76 Libor Grid Note, dated November 23, 2004 from Home Properties, L.P. to Manufacturers and Traders Trust Company
10.77 Mutual Release, dated January 24, 2005, given by Home Properties, L.P. and Home Properties, Inc. and Boston Capital Tax Credit Fund XIV, a Limited Partnership, Boston Capital Tax Credit Fund XV, a Limited Partnership and BCCC, Inc. relating to certain obligations pertaining to Green Meadows and related Letter Agreement.
10.78 Amendment No. Four to Credit Agreement, dated September 8, 2005 between Home Properties, L.P., certain Lenders, and Manufacturers and Traders Trust Company, as Administrative Agent
10.79 Agreement, dated September 30, 2005, between General Electric Credit Equities, Inc. and H.P. Knolls I Associates, L.P.
10.80 Agreement, dated September 30, 2005, between General Electric Credit Equities, Inc. and H.P. Knolls II Associates, L.P.
10.81 Amendments Nos. Seventy-Four to through Seventy-Nine to the Second Amended and Restated Limited Partnership
10.82 Amendment No. Eighty to the Second Amended and Restated Limited Partnership Agreement
10.83 Amendment Nos. Eighty-One and Eighty-Two to the Second Amended and Restated Limited Partnership Agreement
10.84 Amendment Nos. Eighty-Three and Eighty-Four to the Second Amended and Restated Limited Partnership Agreement
10.85 Amendment Nos. Eighty-Five through Eighty-Seven to the Second Amended and Restated Limited Partnership Agreement
10.86 Development Agreement, dated March 27, 2006 between Nelson B. Leenhouts and Home Properties, Inc.*
10.87 Amended and Restated Employment Agreement, dated November 20, 2006 between Edward J. Pettinella and Home Properties, Inc.*
10.88 Employment Agreement between Nelson B. Leenhouts and Home Properties, Inc.*
10.89 Second Amended and Restated Incentive Compensation Plan*

66
Exhibit Number
Exhibit
10.90 Articles of Merger of Home Properties Management, Inc. into Home Properties Resident Services, Inc.
10.91 Purchase Agreement, dated October 18, 2006 between Home Properties, Inc., Home Properties, L.P. and Merrill Lynch & Co., Merrill Lynch, Pierce, Fenner & Smith and Bear Stearns & Co., Inc.
11 Computation of Per Share Earnings Schedule
21 List of Subsidiaries of Home Properties, Inc.
23 Consent of PricewaterhouseCoopers LLP
31.1** Section 302 Certification of Chief Executive Officer
31.2** Section 302 Certification of Chief Financial Officer
32.1 Section 906 Certification of Chief Executive Officer (furnished)
32.2 Section 906 Certification of Chief Financial Officer (furnished)
99 Additional Exhibits - Debt Summary Schedule *Management contract or compensatory plan or arrangement required to be filed as an exhibit to this Form 10-K pursuant to Item 15(b) of Form 10-K.
**These exhibits are not incorporated by reference in any registration statement or report which incorporates this Annual Report on Form 10-K for the year ended December 31, 2006.

67
SIGNATURE
Pursuant to the requirements of Section 13 or 15(d) of the Securities Exchange Act of 1934, the registrant has duly caused this report to be signed on its behalf by the undersigned thereunto duly authorized.
HOME PROPERTIES, INC.
/s/ Edward J. Pettinella Edward J. Pettinella Director, President and Chief Executive Officer
Date: February 28, 2007 Pursuant to the requirements of the Securities Exchange Act of 1934, the report has been signed by the following persons on behalf of Home Properties, Inc. and in the capacities and on the dates indicated. Signature Title Date
/s/ Edward J. Pettinella Director, President and Chief Executive Officer February 28, 2007Edward J. Pettinella /s/ David P. Gardner Executive Vice President, Chief Financial Officer February 28, 2007David P. Gardner (Principal Financial Officer) /s/ Robert J. Luken Senior Vice President, Chief Accounting Officer February 28, 2007Robert J. Luken and Treasurer (Principal Accounting Officer) /s/ Kenneth O. Hall Vice President and Controller February 28, 2007Kenneth O. Hall /s/ Norman P. Leenhouts Director, Co-Chairman of the Board of Directors February 28, 2007Norman P. Leenhouts /s/ Nelson B. Leenhouts Director, Co-Chairman of the Board of Directors February 28, 2007Nelson B. Leenhouts /s/ William Balderston, III Director February 28, 2007William Balderston, III /s/ Josh E. Fidler Director February 28, 2007Josh E. Fidler /s/ Alan L. Gosule Director February 28, 2007Alan L. Gosule

68
Signature Title Date
/s/ Leonard F. Helbig, III Director February 28, 2007Leonard F. Helbig, III /s/ Roger W. Kober Director February 28, 2007Roger W. Kober /s/ Clifford W. Smith, Jr. Director February 28, 2007Clifford W. Smith, Jr. /s/ Paul L. Smith Director February 28, 2007Paul L. Smith /s/ Thomas S. Summer Director February 28, 2007Thomas S. Summer /s/ Amy L. Tait Director February 28, 2007Amy L. Tait

This page intentionally left blank.

This page intentionally left blank.
F-1
HOME PROPERTIES, INC.
INDEX TO FINANCIAL STATEMENTS AND FINANCIAL STATEMENT SCHEDULE
Page Report of Independent Registered Public Accounting Firm F-2 Consolidated Balance Sheets as of December 31, 2006 and 2005 F-3 Consolidated Statements of Operations for the Years Ended December 31, 2006, 2005 and 2004 F-4 Consolidated Statements of Stockholders' Equity for the Years Ended December 31, 2006, 2005 and 2004 F-5 Consolidated Statements of Comprehensive Income for the Years Ended December 31, 2006, 2005 and 2004 F-6 Consolidated Statements of Cash Flows for the Years Ended December 31, 2006, 2005 and 2004 F-7 Notes to Consolidated Financial Statements F-8 Schedule II: Valuation and Qualifying Accounts F-38 Schedule III: Real Estate and Accumulated Depreciation F-39 All other schedules are omitted because they are not applicable or the required information is shown in the financial statements or notes thereto.

F-2
Report of Independent Registered Public Accounting Firm
To the Board of Directors and Shareholders of Home Properties, Inc.:
We have completed integrated audits of Home Properties, Inc.’s consolidated financial statements and of its internal control over financial reporting as of December 31, 2006, in accordance with the standards of the Public Company Accounting Oversight Board (United States). Our opinions, based on our audits, are presented below.
Consolidated financial statements and financial statement schedules
In our opinion, the consolidated financial statements listed in the index appearing under Item 15(a)(1) present fairly, in all material respects, the financial position of Home Properties, Inc. and its subsidiaries at December 31, 2006 and 2005, and the results of their operations and their cash flows for each of the three years in the period ended December 31, 2006 in conformity with accounting principles generally accepted in the United States of America. In addition, in our opinion, the financial statement schedules listed in the index appearing under Item 15(a)(2) present fairly, in all material respects, the information set forth therein when read in conjunction with the related consolidated financial statements. These financial statements and financial statement schedules are the responsibility of the Company’s management. Our responsibility is to express an opinion on these financial statements and financial statement schedules based on our audits. We conducted our audits of these statements in accordance with the standards of the Public Company Accounting Oversight Board (United States). Those standards require that we plan and perform the audit to obtain reasonable assurance about whether the financial statements are free of material misstatement. An audit of financial statements includes examining, on a test basis, evidence supporting the amounts and disclosures in the financial statements, assessing the accounting principles used and significant estimates made by management, and evaluating the overall financial statement presentation. We believe that our audits provide a reasonable basis for our opinion.
Internal control over financial reporting
Also, in our opinion, management’s assessment, included in Management’s Report on Internal Control over Financial Reporting appearing under Item 9(a), that the Company maintained effective internal control over financial reporting as of December 31, 2006 based on criteria established in Internal Control - Integrated Framework issued by the Committee of Sponsoring Organizations of the Treadway Commission (COSO), is fairly stated, in all material respects, based on those criteria. Furthermore, in our opinion, the Company maintained, in all material respects, effective internal control over financial reporting as of December 31, 2006, based on criteria established in Internal Control - Integrated Framework issued by the COSO. The Company’s management is responsible for maintaining effective internal control over financial reporting and for its assessment of the effectiveness of internal control over financial reporting. Our responsibility is to express opinions on management’s assessment and on the effectiveness of the Company’s internal control over financial reporting based on our audit. We conducted our audit of internal control over financial reporting in accordance with the standards of the Public Company Accounting Oversight Board (United States). Those standards require that we plan and perform the audit to obtain reasonable assurance about whether effective internal control over financial reporting was maintained in all material respects. An audit of internal control over financial reporting includes obtaining an understanding of internal control over financial reporting, evaluating management’s assessment, testing and evaluating the design and operating effectiveness of internal control, and performing such other procedures as we consider necessary in the circumstances. We believe that our audit provides a reasonable basis for our opinions.
A company’s internal control over financial reporting is a process designed to provide reasonable assurance regarding the reliability of financial reporting and the preparation of financial statements for external purposes in accordance with generally accepted accounting principles. A company’s internal control over financial reporting includes those policies and procedures that (i) pertain to the maintenance of records that, in reasonable detail, accurately and fairly reflect the transactions and dispositions of the assets of the company; (ii) provide reasonable assurance that transactions are recorded as necessary to permit preparation of financial statements in accordance with generally accepted accounting principles, and that receipts and expenditures of the company are being made only in accordance with authorizations of management and directors of the company; and (iii) provide reasonable assurance regarding prevention or timely detection of unauthorized acquisition, use, or disposition of the company’s assets that could have a material effect on the financial statements.
Because of its inherent limitations, internal control over financial reporting may not prevent or detect misstatements. Also, projections of any evaluation of effectiveness to future periods are subject to the risk that controls may become inadequate because of changes in conditions, or that the degree of compliance with the policies or procedures may deteriorate.
PricewaterhouseCoopers LLP Boston, Massachusetts February 28, 2007
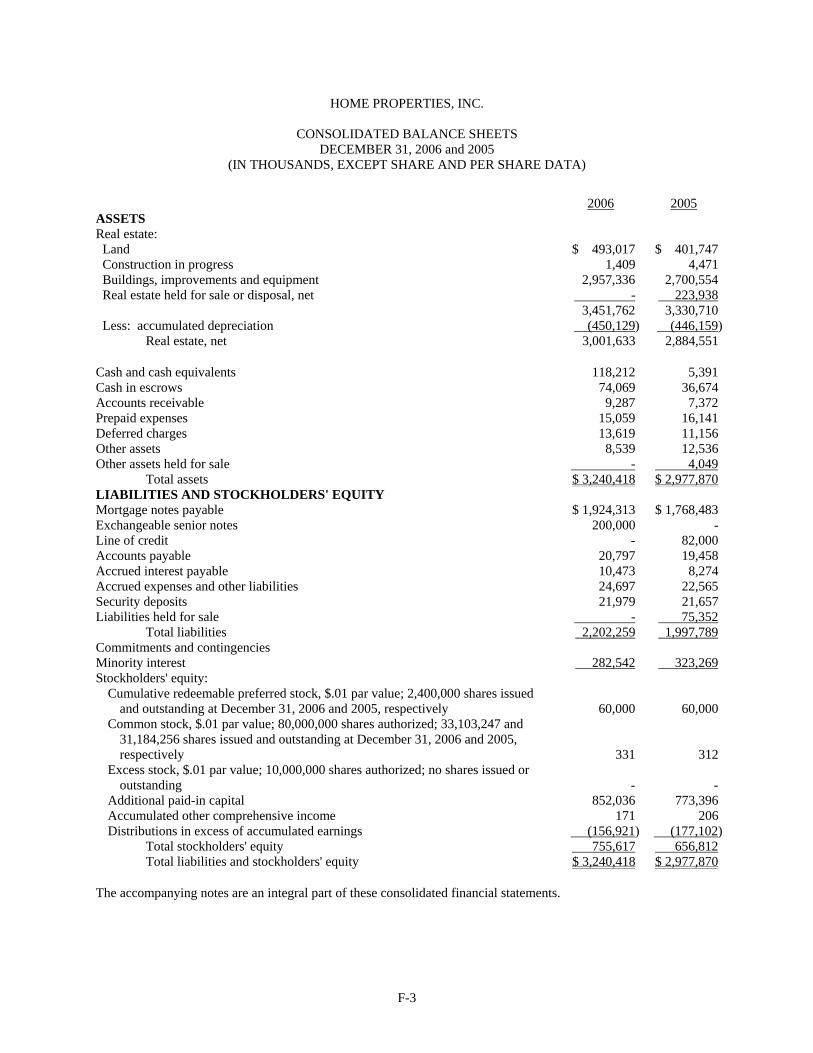
F-3
HOME PROPERTIES, INC.
CONSOLIDATED BALANCE SHEETS DECEMBER 31, 2006 and 2005
(IN THOUSANDS, EXCEPT SHARE AND PER SHARE DATA)
The accompanying notes are an integral part of these consolidated financial statements.
2006 2005 ASSETS Real estate: Land $ 493,017 $ 401,747 Construction in progress 1,409 4,471 Buildings, improvements and equipment 2,957,336 2,700,554 Real estate held for sale or disposal, net - 223,938 3,451,762 3,330,710 Less: accumulated depreciation (450,129) (446,159) Real estate, net 3,001,633 2,884,551
Cash and cash equivalents 118,212 5,391 Cash in escrows 74,069 36,674 Accounts receivable 9,287 7,372 Prepaid expenses 15,059 16,141 Deferred charges 13,619 11,156 Other assets 8,539 12,536 Other assets held for sale - 4,049 Total assets $ 3,240,418 $ 2,977,870 LIABILITIES AND STOCKHOLDERS' EQUITY Mortgage notes payable $ 1,924,313 $ 1,768,483 Exchangeable senior notes 200,000 - Line of credit - 82,000 Accounts payable 20,797 19,458 Accrued interest payable 10,473 8,274 Accrued expenses and other liabilities 24,697 22,565 Security deposits 21,979 21,657 Liabilities held for sale - 75,352 Total liabilities 2,202,259 1,997,789 Commitments and contingencies Minority interest 282,542 323,269 Stockholders' equity:
Cumulative redeemable preferred stock, $.01 par value; 2,400,000 shares issued and outstanding at December 31, 2006 and 2005, respectively 60,000 60,000
Common stock, $.01 par value; 80,000,000 shares authorized; 33,103,247 and 31,184,256 shares issued and outstanding at December 31, 2006 and 2005, respectively 331 312
Excess stock, $.01 par value; 10,000,000 shares authorized; no shares issued or outstanding - -
Additional paid-in capital 852,036 773,396 Accumulated other comprehensive income 171 206 Distributions in excess of accumulated earnings (156,921) (177,102)
Total stockholders' equity 755,617 656,812 Total liabilities and stockholders' equity $ 3,240,418 $ 2,977,870

F-4
HOME PROPERTIES, INC.
CONSOLIDATED STATEMENTS OF OPERATIONS FOR THE YEARS ENDED DECEMBER 31, 2006, 2005, AND 2004
(IN THOUSANDS, EXCEPT SHARE AND PER SHARE DATA)
2006 2005 2004 Revenues: Rental income $ 420,988 $ 378,506 $ 348,932 Property other income 27,775 19,415 14,937 Interest income 1,761 581 481 Other income 3,468 2,023 2,782 Total Revenues 453,992 400,525 367,132 Expenses: Operating and maintenance 190,845 174,906 157,802 General and administrative 22,626 19,652 23,978 Interest 106,773 92,178 77,145 Depreciation and amortization 96,142 80,944 70,710 Impairment of assets held as General Partner - 400 1,116 Total Expenses 416,386 368,080 330,751 Income from operations 37,606 32,445 36,381 Equity in losses of unconsolidated affiliates - - (538)Income before minority interest, discontinued operations and extraordinary item 37,606 32,445 35,843 Minority interest in limited partnership - - 441 Minority interest in operating partnership (9,614) (8,629) (9,204)Income from continuing operations 27,992 23,816 27,080 Discontinued operations:
Income from operations, net of $1,947, $1,828 and $4,354, in 2006, 2005 and 2004 allocated to minority interest, respectively 3,745 3,721 8,913
Gain on disposition of property, net of $31,766, $26,733 and $5,382 in 2006, 2005 and 2004 allocated to minority interest, respectively 78,748 53,975 11,417
Discontinued operations 82,493 57,696 20,330 Income before loss on sale of property and business and cumulative effect
of change in accounting principle 110,485 81,512 47,410 Loss on sale of property and business, net of $33 in 2004 allocated to minority interest - - (67)Income before cumulative effect of change in accounting principle 110,485 81,512 47,343 Cumulative effect of change in accounting principle net of $159 in 2004
allocated to minority interest - - (321)Net income 110,485 81,512 47,022 Preferred dividends (5,400) (6,279) (7,593) Net income available to common shareholders $ 105,085 $ 75,233 $ 39,429 Basic earnings per share data: Income from continuing operations $ 0.69 $ 0.55 $ 0.59 Discontinued operations 2.52 1.80 0.62 Cumulative effect of change in accounting principle - - (0.01)Net income available to common shareholders $ 3.21 $ 2.35 $ 1.20 Diluted earnings per share data: Income from continuing operations $ 0.68 $ 0.54 $ 0.58 Discontinued operations 2.47 1.79 0.61 Cumulative effect of change in accounting principle - - (0.01)Net income available to common shareholders $ 3.15 $ 2.33 $ 1.18 Weighted average number of shares outstanding: Basic 32,697,794 31,962,082 32,911,945 Diluted 33,337,557 32,328,105 33,314,038
The accompanying notes are an integral part of these consolidated financial statements.

F-5
HOME PROPERTIES, INC.
CONSOLIDATED STATEMENTS OF STOCKHOLDERS' EQUITY FOR THE YEARS ENDED DECEMBER 31, 2006, 2005 AND 2004
(IN THOUSANDS, EXCEPT SHARE AND PER SHARE DATA) Officer/ Preferred Distributions Accumulated Director Stock at Additional in Excess of Other Notes for Liquidation Common Stock Paid-In Accumulated Comprehensive Stock Preference Shares Amount Capital Earnings Income Purchase Totals
Balance, January 1, 2004 $ 85,000 31,966,240 $ 320 $ 785,710 $ (128,910) $ (542) $ (315) $741,263 Issuance of common stock, net 1,251,949 12 43,086 43,098 Repurchase of common stock (1,280,196) (13) (53,783) (53,796)Payments on notes for stock
purchase 307 307 Interest receivable on notes for
stock purchase 8 8 Net income 47,022 47,022 Change in fair value of hedge
instruments, net of minority interest 180 180
Conversion of UPREIT Units for stock 687,420 7 26,569 26,576
Adjustment of minority interest 5,630 5,630 Preferred dividends (7,593) (7,593)Dividends paid ($2.49 per share) ________ _________ _____ _______ (82,273) ______ ______ (82,273)Balance, December 31, 2004 85,000 32,625,413 326 807,212 (171,754) (362) - 720,422 Issuance of common stock, net 358,737 4 12,845 12,849 Repurchase of common stock (2,850,882) (28) (114,737) (114,765)Conversion of Series D preferred
stock for common stock (25,000) 833,333 8 24,992 - Net income 81,512 81,512 Change in fair value of hedge
instruments, net of minority interest 568 568
Conversion of UPREIT Units for stock 217,655 2 9,228 - 9,230
Adjustment of minority interest 33,856 33,856 Preferred dividends (6,279) (6,279)Dividends paid ($2.53 per share) _______ _________ _____ _________ (80,581) ______ ______ (80,581)Balance, December 31, 2005 60,000 31,184,256 312 773,396 (177,102) 206 - 656,812 Issuance of common stock, net 832,687 8 31,674 31,682 Repurchase of common stock (2,683,429) (26) (146,273) (146,299)Net income 110,485 110,485 Change in fair value of hedge
instruments, net of minority interest (35) (35)
Conversion of UPREIT Units for stock 3,769,733 37 195,750 195,787
Adjustment of minority interest (2,511) (2,511)Preferred dividends (5,400) (5,400)Dividends paid ($2.57 per share) - - - - (84,904) - - (84,904)Balance, December 31, 2006 $ 60,000 33,103,247 $ 331 $ 852,036 $ (156,921) $ 171 $ - $755,617
The accompanying notes are an integral part of these consolidated financial statements.

F-6
HOME PROPERTIES, INC.
CONSOLIDATED STATEMENTS OF COMPREHENSIVE INCOME FOR THE YEARS ENDED DECEMBER 31, 2006, 2005 AND 2004
(IN THOUSANDS)
2006 2005 2004 Net income $ 110,485 $ 81,512 $ 47,022
Other comprehensive income: Change in fair value of hedged instruments (35) 568 180
Net comprehensive income $ 110,450 $ 82,080 $ 47,202
The accompanying notes are an integral part of these consolidated financial statements.

F-7
HOME PROPERTIES, INC.
CONSOLIDATED STATEMENTS OF CASH FLOWS FOR THE YEARS ENDED DECEMBER 31, 2006, 2005 AND 2004
(IN THOUSANDS)
2006 2005 2004 Cash flows from operating activities: Net income $110,485 $ 81,512 $ 47,022 Adjustments to reconcile net income to net cash provided by
operating activities: Equity in losses of unconsolidated affiliates - - 538 Income allocated to minority interest 43,327 37,190 18,747 Depreciation and amortization 103,333 100,584 98,051 Impairment of assets held as General Partner - 400 1,116 Impairment of real property - 7,325 1,100 Gain on disposition of property and business (110,514) (81,679) (26,424) Issuance of restricted stock, compensation cost of stock options and deferred compensation 4,961 2,662 2,496 Changes in assets and liabilities: Cash held in escrows 1,863 3,519 (2,349) Other assets 4,969 (8,423) (1,431) Accounts payable and accrued liabilities 4,572 (6,624) 20,476 Total adjustments 52,511 54,954 112,320 Net cash provided by operating activities 162,996 136,466 159,342 Cash flows from investing activities:
Purchase of properties and other assets, net of mortgage notes assumed and UPREIT Units issued (188,004) (219,852) (153,535)
Additions to properties (101,839) (98,917) (102,700) Advances to affiliates - - (820) Payments on advances to affiliates - - 149 Proceeds from sale of affordable properties, net - - 2,412 Proceeds from sale of properties and business, net 488,457 139,073 89,028 Withdrawals from (additions to) funds held in escrow, net (38,961) (248) 4,812 Net cash provided by (used in) investing activities 159,653 (179,944) (160,654)Cash flows from financing activities: Proceeds from sale of exchangeable senior notes, net 195,779 - - Proceeds from sale of common stock, net 26,721 10,185 40,599 Repurchase of common stock (146,299) (114,765) (53,796) Proceeds from mortgage notes payable 202,894 370,752 191,772 Payments of mortgage notes payable (279,135) (119,939) (97,734) Proceeds from line of credit 379,800 376,370 291,600 Payments on line of credit (461,800) (352,370) (233,600) Payments of deferred loan costs (1,842) (2,991) (2,672) Withdrawals from (additions to) cash escrows, net 137 (159) (4,416) Repayment of officer and director loans - - 315 Dividends and distributions paid (126,083) (126,139) (128,784) Net cash provided by (used in) financing activities (209,828) 40,944 3,284 Net increase (decrease) in cash and cash equivalents 112,821 (2,534) 1,972 Cash and cash equivalents: Beginning of year 5,391 7,925 5,103 Cash assumed in connection with FIN 46 consolidation - - 850 End of year $118,212 $ 5,391 $ 7,925
The accompanying notes are an integral part of these consolidated financial statements.

F-8
HOME PROPERTIES, INC.
NOTES TO CONSOLIDATED FINANCIAL STATEMENTS (DOLLARS IN THOUSANDS, EXCEPT SHARE AND PER SHARE DATA)
1 ORGANIZATION AND BASIS OF PRESENTATION
Organization
Home Properties, Inc. (the "Company ") was formed in November 1993, as a Maryland corporation and is engaged primarily in the ownership, management, acquisition, rehabilitation and development of residential apartment communities primarily in select Northeast, Mid-Atlantic and Southeast Florida regions of the United States. The Company conducts its business through Home Properties, L.P. (the "Operating Partnership"), a New York limited partnership. As of December 31, 2006, the Company operated 127 apartment communities with 39,136 apartments. Of this total, the Company owned 123 communities, consisting of 36,954 apartments, managed as general partner one partnership that owned 868 apartments, and fee managed three communities, consisting of 1,314 apartments, for third parties.
Basis of Presentation
The accompanying consolidated financial statements include the accounts of the Company and its 71.4% (65.2% at December 31, 2005) interest in the Operating Partnership. Such interest has been calculated as the percentage of outstanding common shares divided by the total outstanding common shares and Operating Partnership Units ("UPREIT Units") outstanding. The remaining 28.6% (34.8% at December 31, 2005) is reflected as Minority Interest in these consolidated financial statements. The Company owns a 1.0% general partner interest in the Operating Partnership and the remainder indirectly as a limited partner through its wholly owned subsidiary, Home Properties I, LLC, which owns 100% of the limited partner, Home Properties Trust. Home Properties Trust was formed in September 1997, as a Maryland real estate trust and as a qualified REIT subsidiary ("QRS") and owns the Company's share of the limited partner interests in the Operating Partnership. For financing purposes, the Company has formed a limited liability company (the "LLC") and a partnership (the "Financing Partnership"), which beneficially own certain apartment communities encumbered by mortgage indebtedness. The LLC is wholly owned by the Operating Partnership. The Financing Partnership is owned 99.9% by the Operating Partnership and 0.1% by the QRS.
The accompanying consolidated financial statements include the accounts of Home Properties Management, Inc. and Home Properties Resident Services, Inc. (the “Management Companies”). The Management Companies are wholly owned subsidiaries of the Company. On November 21, 2006, Home Properties Management, Inc. was merged into Home Properties Resident Services, Inc., with Home Properties Resident Services, Inc. the surviving entity. All significant inter-company balances and transactions have been eliminated in these consolidated financial statements.
Through March 30, 2004, the Company accounted for its investment as managing general partner ("GP") in unconsolidated affordable housing limited partnerships ("LP") using the equity method of accounting. Effective March 31, 2004, the Company adopted FASB Interpretation No. 46R, Consolidation of Variable Interest Entities (“FIN 46R”). This interpretation addresses consolidation by business enterprises of variable interest entities in which the equity investment at risk is not sufficient to permit the entity to finance its activities without additional subordinated financial support from other parties or in which the equity investors do not have the characteristics of a controlling financial interest. This interpretation requires a variable interest entity to be consolidated by a company if that company is subject to a majority of the risk of loss from the variable interest entity's activities or entitled to receive a majority of the entity's residual returns or both. The interpretation also requires disclosures about variable interest entities that the company is not required to consolidate but in which it has a significant variable interest. As of March 31, 2004, the Company was the general partner in 41 limited partnerships in Upstate New York, Pennsylvania, Ohio and Maryland. The Company had made a determination that all 41 limited partnerships were Variable Interest Entities (“VIEs”). As of March 31, 2004, Home Properties determined that it was not the primary beneficiary in seven partnerships syndicated under U.S. Department of Housing and Urban Development subsidy programs, none of which remained as of December 31, 2006 and 2005. These investments continued to be

F-9
HOME PROPERTIES, INC.
NOTES TO CONSOLIDATED FINANCIAL STATEMENTS (DOLLARS IN THOUSANDS, EXCEPT SHARE AND PER SHARE DATA)
1 ORGANIZATION AND BASIS OF PRESENTATION (Continued)
accounted for under the equity method until their sale. For those investments, the Company continued to record its allocable share of the respective partnership's income or loss based on the terms of the agreement. To the extent it was determined that the LPs could not absorb their share of the losses, if any, the GP recorded the LPs share of such losses. The Company had further determined that it was the primary beneficiary in 34 of the VIEs and, therefore, consolidated these entities effective March 31, 2004. Beginning with the second quarter of 2004, the Company consolidated the results of operations of the VIEs. During 2004 and 2005, the Company sold most of these consolidated VIEs with only one partnership remaining as of December 31, 2006 and 2005. The results of operations for the VIEs sold during the years ended 2005 and 2004 are included in discontinued operations. The one remaining property is classified as held and used as of December 31, 2006 and 2005 and the results of operations are included in continuing operations.
Reclassifications
Certain reclassifications have been made to the 2005 and 2004 consolidated financial statements to conform to the 2006 presentation.
2 SUMMARY OF SIGNIFICANT ACCOUNTING POLICIES
Real Estate
Real estate is recorded at cost. Costs related to the acquisition, development, construction and improvement of properties are capitalized. Recurring capital replacements typically include carpeting and tile, appliances, HVAC equipment, new roofs, site improvements and various exterior building improvements. Non-recurring upgrades include, among other items, community centers, new appliances, new windows, kitchens and bathrooms. Interest costs are capitalized until construction is substantially complete. There was $1,087, $1,096 and $763 of interest capitalized in 2006, 2005 and 2004, respectively. Salaries and related costs capitalized for the years ended December 31, 2006, 2005 and 2004 were $2,097, $2,135 and $3,391, respectively. When retired or otherwise disposed of, the related asset cost and accumulated depreciation are cleared from the respective accounts and the net difference, less any amount realized from disposition, is reflected in income. Ordinary repairs and maintenance that do not extend the life of the asset are expensed as incurred.
Management reviews its long-lived assets used in operations for impairment when, in accordance with SFAS No. 144, Accounting for the Impairment or Disposal of Long Lived Assets (“SFAS 144”), there is an event or change in circumstances that indicates an impairment in value. An asset is considered impaired when the undiscounted future cash flows are not sufficient to recover the asset's carrying value. If such impairment is present, an impairment loss is recognized based on the excess of the carrying amount of the asset over its fair value. The Company records impairment losses and reduces the carrying amounts of assets held for sale when the carrying amounts exceed the estimated selling proceeds less the costs to sell.
The Company accounts for its acquisitions of investments in real estate in accordance with SFAS No. 141, Business Combinations (“SFAS 141”), which requires the fair value of the real estate acquired to be allocated to the acquired tangible assets, consisting of land, building, and personal property and identified intangible assets and liabilities, consisting of the value of above-market and below-market leases, value of in-place leases and value of resident relationships, based in each case on their fair values. The Company considers acquisitions of operating real estate assets to be businesses as that term is contemplated in Emerging Issues Task Force Issue No. 98-3, Determining Whether a Nonmonetary Transaction Involves Receipt of Productive Assets or of a Business.

F-10
HOME PROPERTIES, INC.
NOTES TO CONSOLIDATED FINANCIAL STATEMENTS (DOLLARS IN THOUSANDS, EXCEPT SHARE AND PER SHARE DATA)
2 SUMMARY OF SIGNIFICANT ACCOUNTING POLICIES (Continued)
Real Estate (Continued)
The Company allocates purchase price to the fair value of the tangible assets of an acquired property (which includes the land, building, and personal property) determined by valuing the property as if it were vacant. The as if-vacant value is allocated to land, buildings, and personal property based on management's determination of the relative fair values of these assets.
Above-market and below-market in-place lease values for acquired properties are recorded based on the present value (using an interest rate which reflects the risks associated with the leases acquired) of the difference between (i) the contractual amounts to be paid pursuant to the in-place leases and (ii) management's estimate of fair market lease rates for the corresponding in-place leases, measured over a period equal to the remaining non-cancelable term of the lease. The capitalized above-market lease values are included in other assets and are amortized as a reduction of rental income over the remaining non-cancelable terms of the respective leases. The capitalized below-market lease values are included in accrued expenses and other liabilities and are amortized as an increase to rental income over the initial term of the respective leases.
Other intangible assets acquired include amounts for in-place lease values that are based upon the Company's evaluation of the specific characteristics of the leases. Factors considered in these analyses include an estimate of carrying costs during hypothetical expected lease-up periods considering current market conditions, and costs to execute similar leases. The Company also considers information obtained about each property as a result of its pre-acquisition due diligence, marketing and leasing activities in estimating the fair value of the tangible and intangible assets acquired. In estimating carrying costs, management also includes real estate taxes, insurance and other operating expenses and estimates of lost rentals at market rates during the expected lease-up periods depending on the property acquired.
The total amount of other intangible assets acquired is further allocated to resident relationships, which includes intangible values based on management's evaluation of the specific characteristics of the residential leases and the Company's resident retention history.
The value of in-place leases and resident relationships are amortized and included in depreciation and amortization expense over the initial term of the respective leases.
The acquisitions of minority interests for shares of the Company's common stock are recorded under the purchase method with assets acquired reflected at the fair market value of the Company's common stock on the date of acquisition. The acquisition amounts are allocated to the underlying assets based on their estimated fair values. During 2006 and 2005, there were 3.8 million and 0.2 million shares of UPREIT Units converted to common stock, respectively. The Company made an adjustment in the amount of $124.6 million and $5.2 million, respectively, to record the fair market value of the conversions.

F-11
HOME PROPERTIES, INC.
NOTES TO CONSOLIDATED FINANCIAL STATEMENTS (DOLLARS IN THOUSANDS, EXCEPT SHARE AND PER SHARE DATA)
2 SUMMARY OF SIGNIFICANT ACCOUNTING POLICIES (Continued)
Depreciation
Properties are depreciated using a straight-line method over the estimated useful lives of the assets as follows: Land improvements 3-20 years Buildings and improvements 3-40 years Furniture, fixtures and equipment 5-10 years Computer software 5 years
Depreciation expense charged to operations was $94,164, $80,146, and $69,616 from continuing operations and $5,543, $19,165 and $24,493 from discontinued operations for the years ended December 31, 2006, 2005 and 2004, respectively.
Cash and Cash Equivalents
Cash and cash equivalents include all cash and highly liquid investments purchased with original maturities of three months or less. The Company estimates that the fair value of cash equivalents approximates the carrying value due to the relatively short maturity of these instruments.
Cash in Escrows
Cash in escrows consists of cash restricted under the terms of various loan agreements to be used for the payment of property taxes and insurance as well as required replacement reserves, resident security deposits for residential properties and funds held in escrow from tax-free exchanges.
Allowance for Doubtful Receivables
The allowance for doubtful receivables was $984, $513 and $567 as of December 31, 2006, 2005 and 2004, respectively.
Deferred Charges
Costs relating to the financing of properties are deferred and amortized over the life of the related financing agreement. The straight-line method, which approximates the effective interest method, is used to amortize all financing costs; such amortization is reflected as interest expense in the consolidated statement of operations. The financing agreement terms range from 1-18 years. Accumulated amortization was $7,421, $5,832 and $5,640, as of December 31, 2006, 2005 and 2004, respectively.
Intangible Assets
Intangible assets of $8,080, $5,080 and $3,281 at December 31, 2006, 2005 and 2004, respectively, included in Other Assets, consist primarily of property management contracts obtained through the acquisition of real estate management businesses, and intangible assets recorded in connection with SFAS 141. Intangible assets associated with SFAS 141 are amortized on the straight-line basis over their estimated useful lives of 5 months to 3 years. Accumulated amortization of intangible assets was $4,714, $2,797 and $2,005 as of December 31, 2006, 2005 and 2004, respectively. Amortization expense charged to operations was $1,978, $798, and $1,094 from continuing operations and $10, $7 and $26 from discontinued operations for the years ended December 31, 2006, 2005 and
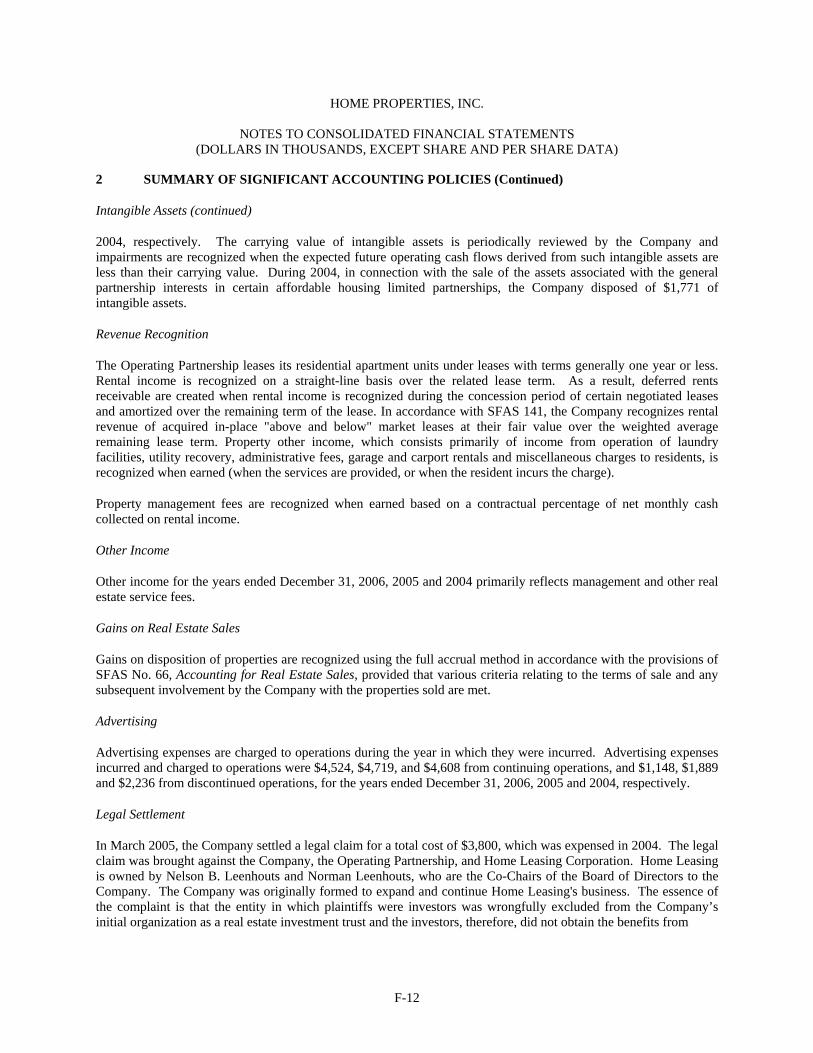
F-12
HOME PROPERTIES, INC.
NOTES TO CONSOLIDATED FINANCIAL STATEMENTS (DOLLARS IN THOUSANDS, EXCEPT SHARE AND PER SHARE DATA)
2 SUMMARY OF SIGNIFICANT ACCOUNTING POLICIES (Continued)
Intangible Assets (continued)
2004, respectively. The carrying value of intangible assets is periodically reviewed by the Company and impairments are recognized when the expected future operating cash flows derived from such intangible assets are less than their carrying value. During 2004, in connection with the sale of the assets associated with the general partnership interests in certain affordable housing limited partnerships, the Company disposed of $1,771 of intangible assets.
Revenue Recognition
The Operating Partnership leases its residential apartment units under leases with terms generally one year or less. Rental income is recognized on a straight-line basis over the related lease term. As a result, deferred rents receivable are created when rental income is recognized during the concession period of certain negotiated leases and amortized over the remaining term of the lease. In accordance with SFAS 141, the Company recognizes rental revenue of acquired in-place "above and below" market leases at their fair value over the weighted average remaining lease term. Property other income, which consists primarily of income from operation of laundry facilities, utility recovery, administrative fees, garage and carport rentals and miscellaneous charges to residents, is recognized when earned (when the services are provided, or when the resident incurs the charge).
Property management fees are recognized when earned based on a contractual percentage of net monthly cash collected on rental income.
Other Income
Other income for the years ended December 31, 2006, 2005 and 2004 primarily reflects management and other real estate service fees.
Gains on Real Estate Sales
Gains on disposition of properties are recognized using the full accrual method in accordance with the provisions of SFAS No. 66, Accounting for Real Estate Sales, provided that various criteria relating to the terms of sale and any subsequent involvement by the Company with the properties sold are met.
Advertising
Advertising expenses are charged to operations during the year in which they were incurred. Advertising expenses incurred and charged to operations were $4,524, $4,719, and $4,608 from continuing operations, and $1,148, $1,889 and $2,236 from discontinued operations, for the years ended December 31, 2006, 2005 and 2004, respectively.
Legal Settlement
In March 2005, the Company settled a legal claim for a total cost of $3,800, which was expensed in 2004. The legal claim was brought against the Company, the Operating Partnership, and Home Leasing Corporation. Home Leasing is owned by Nelson B. Leenhouts and Norman Leenhouts, who are the Co-Chairs of the Board of Directors to the Company. The Company was originally formed to expand and continue Home Leasing's business. The essence of the complaint is that the entity in which plaintiffs were investors was wrongfully excluded from the Company’s initial organization as a real estate investment trust and the investors, therefore, did not obtain the benefits from

F-13
HOME PROPERTIES, INC.
NOTES TO CONSOLIDATED FINANCIAL STATEMENTS (DOLLARS IN THOUSANDS, EXCEPT SHARE AND PER SHARE DATA)
2 SUMMARY OF SIGNIFICANT ACCOUNTING POLICIES (Continued)
Legal Settlements (continued)
exchanging their equity interests in that entity for equity in the Operating Partnership. In their original complaint, plaintiffs sought damages in the amount of $3,000. In the subsequent discovery process, plaintiffs increased the damages sought to $10,000. Included in general and administrative expenses for the year ended December 31, 2004 is the accrual for payment made during 2005 in settlement of $3,500 and for legal fees of $300 made on behalf of Home Leasing Corporation, as well as the Company and the Operating Partnership. Payment was made on behalf of Home Leasing in recognition of the fact that the matters alleged in the action against Home Leasing related directly and solely to the promotion and creation of the Company.
Federal Income Taxes
The Company has elected to be taxed as a real estate investment trust ("REIT") under the Internal Revenue Code of 1986, as amended, commencing with the taxable year ended December 31, 1994. As a result, the Company generally is not subject to Federal or State income taxation at the corporate level to the extent it distributes annually at least 90% of its REIT taxable income to its shareholders and satisfies certain other requirements. For the years ended December 31, 2006, 2005 and 2004, the Company distributed in excess of 100% of its taxable income; accordingly, no provision has been made for federal income taxes in the accompanying consolidated financial statements. Stockholders of the Company are taxed on dividends and must report distributions from the Company as either ordinary income, capital gains, or as return of capital. (See Note 8)
The tax basis of assets is less than the amounts reported in the accompanying consolidated financial statements by approximately $554,000 and $619,000 at December 31, 2006 and 2005, respectively.
The following table reconciles net income to taxable income for the years ended December 31, 2006, 2005 and 2004: 2006 2005 2004 Net income $110,485 $81,512 $47,022
Add back: Net loss of taxable REIT Subsidiaries included in net income above 243 172 987 Deduct: Net income of taxable REIT subsidiaries included in net income above (39) (27) -
Net income from REIT operations 110,689 81,657 48,009 Add: Book depreciation and amortization 75,151 68,814 64,886 Less: Tax depreciation and amortization (68,874) (68,426) (69,532)
Book/tax difference on gains/losses from capital transactions (49,691) (45,906) (8,128)Other book/tax differences, net (14,094) (6,450) (79)Adjusted taxable income subject to 90% REIT dividend requirement $ 53,181 $29,689 $35,156
The Company made actual distributions in excess of 100% of taxable income before capital gains. All adjustments to net income from REIT operations are net of amounts attributable to minority interest and taxable REIT subsidiaries.
Included in total assets on the Consolidated Balance Sheets are deferred tax assets of $10,079 and $8,496 as of December 31, 2006 and 2005, respectively. Management does not believe it is more likely than not that these deferred assets will be used, and accordingly has recorded a reserve against the deferred tax asset of $10,078 and $8,421 as of December 31, 2006 and 2005, respectively.

F-14
HOME PROPERTIES, INC.
NOTES TO CONSOLIDATED FINANCIAL STATEMENTS (DOLLARS IN THOUSANDS, EXCEPT SHARE AND PER SHARE DATA)
2 SUMMARY OF SIGNIFICANT ACCOUNTING POLICIES (Continued)
Earnings Per Share
Basic Earnings Per Share ("EPS") is computed as net income available to common shareholders divided by the weighted average number of common shares outstanding for the period. Diluted EPS reflects the potential dilution that could occur from common shares issuable through stock-based compensation including stock options (using the treasury stock method) and the conversion of any cumulative convertible preferred stock. The exchange of an UPREIT Unit for common stock will have no effect on diluted EPS as unitholders and stockholders effectively share equally in the net income of the Operating Partnership.
Income from continuing operations is the same for both the basic and diluted EPS calculation. The reconciliation of the basic and diluted earnings per share for the years ended December 31, 2006, 2005, and 2004, is as follows: 2006 2005 2004 Income from continuing operations $ 27,992 $ 23,816 $ 27,080
Add: Gain (loss) on sale of business, net of minority interest - - (67)Less: Preferred dividends (5,400) (6,279) (7,593)
Basic and Diluted – Income from continuing operations applicable to common shareholders 22,592 17,537 19,420
Basic weighted average number of shares outstanding 32,697,794 31,962,082 32,911,945 Effect of dilutive stock options 593,308 324,268 333,995 Effect of phantom and restricted shares 46,455 41,755 68,098
Diluted weighted average number of shares outstanding 33,337,557 32,328,105 33,314,038 Basic earnings per share data: Income from continuing operations $ 0.69 $ 0.55 $ 0.59 Discontinued operations 2.52 1.80 0.62 Cumulative effect of change in accounting principle - - (0.01)Net income available to common shareholders $ 3.21 $ 2.35 $ 1.20 Diluted earnings per share data: Income from continuing operations $ 0.68 $ 0.54 $ 0.58 Discontinued operations 2.47 1.79 0.61 Cumulative effect of change in accounting principle - - (0.01)Net income available to common shareholders $ 3.15 $ 2.33 $ 1.18
Unexercised stock options to purchase 18,900, 539,500 and zero shares of the Company's common stock were not included in the computations of diluted EPS because the options' exercise prices were greater than the average market price of the Company's stock during the years ended December 31, 2006, 2005 and 2004, respectively. For the years ended December 31, 2005 (until the date of the conversion) and 2004, the 833,333 common stock equivalents on an as-converted basis of the Series D Convertible Cumulative Preferred Stock have an antidilutive effect and are not included in the computation of diluted EPS. To the extent the preferred stock was converted, the common shares would be included in outstanding shares from the date of conversion. In conjunction with the issuance of the Exchangeable Senior Notes, there are 490,880 potential shares issuable under certain circumstances, of which none are considered dilutive as of December 31, 2006.
Use of Estimates
The preparation of financial statements in conformity with accounting principles generally accepted in the United States of America requires management to make estimates and assumptions that affect the reported amount of assets and liabilities and disclosures of contingent assets and liabilities at the date of the financial statements and the reported amounts of revenues and expenses during the reporting period. Actual results could differ from those estimates.

F-15
HOME PROPERTIES, INC.
NOTES TO CONSOLIDATED FINANCIAL STATEMENTS (DOLLARS IN THOUSANDS, EXCEPT SHARE AND PER SHARE DATA)
2 SUMMARY OF SIGNIFICANT ACCOUNTING POLICIES (Continued)
Recent Accounting Pronouncements
In July 2006, the FASB issued Interpretation No. 48, Accounting for Uncertainty in Income Taxes (“FIN 48”). FIN 48 addresses the recognition and measurement of assets and liabilities associated with tax positions taken or expected to be taken in a tax return. FIN 48 is effective January 1, 2007. The Company reviewed its current tax positions for any potential uncertain tax positions that would qualify under FIN 48. Based on its review, the Company does not anticipate that the adoption of FIN 48 in January 2007 will have a material impact on the Company’s cash flows, results of operations, financial position or liquidity.
In September 2006, the FASB issued SFAS No. 157, Fair Value Measurements ("SFAS 157"). SFAS 157 defines fair value, establishes a framework for measuring fair value in generally accepted accounting principles, and expands disclosures about fair value measurements. SFAS 157 applies under other accounting pronouncements that require or permit fair value measurements; the FASB having previously concluded in those accounting pronouncements that fair value is the relevant measurement attribute. Accordingly, SFAS 157 does not require any new fair value measurements. SFAS 157 is effective for financial statements issued for fiscal years beginning after November 15, 2007, and interim periods within those fiscal years. The Company is required to adopt SFAS 157 in the first quarter of 2008. The Company is currently evaluating the impact that SFAS 157 will have on its financial statements.

F-16
HOME PROPERTIES, INC.
NOTES TO CONSOLIDATED FINANCIAL STATEMENTS (DOLLARS IN THOUSANDS, EXCEPT SHARE AND PER SHARE DATA)
3 VARIABLE INTEREST ENTITIES
Effective March 31, 2004, the Company adopted FASB Interpretation No. 46R, Consolidation of Variable Interest Entities, an interpretation of ARB No. 51 – Consolidated Financial Statements. The Company had made the determination that all 41 of the remaining limited partnerships at the time were VIEs.
The Company determined that it was not the primary beneficiary in seven partnerships syndicated under U.S. Department of Housing and Urban Development subsidy programs, all of which had been sold as of December 31, 2005. These investments were accounted for under the equity method through their sale. The Company recorded its allocable share of the respective partnership's income or loss based on the terms of the agreements. To the extent it was determined that the LPs could not absorb their share of the losses, if any, the GP recorded the LPs share of such losses. The Company absorbed such losses to the extent the Company had outstanding loans or advances and the limited partner had no remaining capital account.
The Company had further determined that it was the primary beneficiary in 34 of the VIEs and, therefore, consolidated these entities effective March 31, 2004. In connection with the adoption of FIN 46R, the Company recorded a $321 charge of a cumulative effect, net of minority interest, of a change in accounting principle during the first quarter of 2004. This charge was a result of the negative capital accounts of minority interest partners that were absorbed by the Company. During the first quarter of 2004, prior to the adoption of FIN 46R, the Company recorded an impairment charge of $1,654 to reduce the value of the Company’s investment associated with the VIEs to management's estimate of fair market value. The impairment charge is classified in the financial statements as “Impairment of assets held as general partner” of $1,116 and “Equity in losses of unconsolidated affiliates” of $538. Beginning with the second quarter of 2004, the Company consolidated the results of operations of the VIEs. The results of operations of 33 of the VIEs are included in discontinued operations as of December 31, 2004, as all of the VIEs were considered held for sale. During 2005, the Company closed on the sale of all but one VIE. It was determined in the second quarter of 2005, that the one remaining VIE is not considered held for sale and is included in the Consolidated Statement of Operations for the years ended December 31, 2006, 2005 and 2004. The effect on the Consolidated Balance Sheets of including this VIE as of December 31, 2006 and 2005 includes total assets of $20,500 and $21,300, total liabilities of $17,900 and $17,900 and minority interest of $2,600 and $3,400, respectively.
As general partner, the Company manages the day-to-day operations of this partnership for a management fee. In addition, the Company has certain operating deficit and tax credit guarantees to its limited partner. The Company is responsible to fund operating deficits to the extent there are any and can receive operating incentive awards when cash flow reaches certain levels.
Based upon the final contract price established during final negotiations with the buyers for 38 of these partnerships, an additional $4,000 loss was recorded during 2004, included in “gain on disposition of property” as part of “discontinued operations.”

F-17
HOME PROPERTIES, INC.
NOTES TO CONSOLIDATED FINANCIAL STATEMENTS (DOLLARS IN THOUSANDS, EXCEPT SHARE AND PER SHARE DATA)
3 VARIABLE INTEREST ENTITIES (Continued)
In December, 2004, the Company recorded an obligation to repurchase the limited partner’s interests in two VIEs in satisfaction of any tax credit guarantees or other obligations to that partner for $5,700, resulting in a loss of $5,000 included in “gain on disposition of property” as part of “Discontinued operations.” The transfer of the partnership interests was effective in January, 2005. In connection with the Company’s decision to dispose of the property through a transfer of deed in lieu of foreclosure, the Company performed a valuation analysis on the underlying real estate, and as a result, recorded a $7,300 impairment of real estate during the first quarter of 2005 to adjust the net book value of the property to the Company’s estimated fair market value. This impairment is included as part of “Discontinued operations” in “Income from operations.” Finally, on September 30, 2005, the deed was transferred to the new mortgage holder in lieu of foreclosure resulting in a gain on sale of real estate of $7,700, included in “gain on disposition of property” as part of “Discontinued operations.”
Additionally, the Company is no longer marketing for sale the one remaining VIE. Based upon the Company’s estimate of fair market value, a $400 and $800 investment impairment charge was recorded in the periods ended December 31, 2005 and 2004, respectively, for this one remaining VIE, included as part of “Impairment of assets held as general partner.”
4 MORTGAGE NOTES PAYABLE
The Company's mortgage notes payable are summarized as follows:
2006 2005
Fixed rate mortgage notes payable $1,895,448 $1,749,127 Variable rate mortgage notes payable 28,865 92,959 Total mortgage notes payable 1,924,313 1,842,086 Less: Mortgage notes payable classified as held for sale - 73,603 Mortgage notes payable $1,924,313 $1,768,483
For 2006 and 2005, mortgage notes payable (including mortgage notes classified as held for sale) are collateralized by certain apartment communities. The mortgage notes payable outstanding as of December 31, 2006 mature at various dates from 2007 through 2042. The weighted average interest rate of the Company's fixed rate notes was 5.77% and 5.95% at December 31, 2006 and 2005, respectively. The weighted average interest rate of the Company's variable rate notes and line of credit facility was 4.95% and 4.82% at December 31, 2006 and 2005, respectively.
Principal payments on the mortgage notes payable for years subsequent to December 31, 2006 are as follows:
2007 $ 171,500 2008 137,153 2009 68,351 2010 307,989 2011 285,509
Thereafter 953,811
$1,924,313

F-18
HOME PROPERTIES, INC.
NOTES TO CONSOLIDATED FINANCIAL STATEMENTS (DOLLARS IN THOUSANDS, EXCEPT SHARE AND PER SHARE DATA)
4 MORTGAGE NOTES PAYABLE (Continued)
The Company determines the fair value of the mortgage notes payable based on the discounted future cash flows at a discount rate that approximates the Company's current effective borrowing rate for comparable loans. Based on this analysis, the Company has determined that the fair value of the mortgage notes payable approximates $1,930,555 and $1,890,232, at December 31, 2006 and 2005, respectively.
At December 31, 2006 and 2005, the consolidated mortgage balance (including mortgage notes payable classified as held for sale) of $1,924,313 and $1,842,086, respectively, included mortgage notes payable related to the Company’s VIE consolidated in connection with the Company’s adoption of FIN 46R, in the amount of $16,763 and $16,989, respectively.
Prepayment penalties of $8,621, $147 and $305 were incurred for the years ended December 31, 2006, 2005 and 2004, respectively. For 2006, the prepayment penalties were incurred in connection with the sale of property and are included in discontinued operations. For 2005, a prepayment penalty was incurred in connection with the repayment of a mortgage and is included in interest expense. For 2004, the prepayment penalties were incurred in connection with both debt restructurings and the sale of property and are included in interest expense and discontinued operations, respectively.
5 EXCHANGEABLE SENIOR NOTES On October 24, 2006, the Company issued $200 million of exchangeable senior notes under an Indenture Agreement (the “Indenture”). This offering generated net proceeds of $195.8 million. The coupon rate is 4.125%. The notes are exchangeable into cash equal to the principal amount of the notes and, at the Company’s option, cash or common stock for the exchange value (to the extent that the market price of common stock exceeds the initial exchange price of $73.34 per share) subject to adjustment. Upon an exchange of the notes, the Company will settle any amounts up to the principal amount of the notes in cash and the remaining exchange value, if any, will be settled, at the Company’s option, in cash, common stock or a combination of both. The notes are not redeemable at the option of the Company for five years, except to preserve the status of the Company as a REIT. Holders of the notes may require the Company to repurchase the notes upon the occurrence of certain designated events. In addition, prior to November 1, 2026, the holders may require the Company to repurchase the notes on November 1, 2011, 2016 and 2021. The notes will mature on November 1, 2026, unless previously redeemed, repurchased or exchanged in accordance with their terms prior to that date. Noteholders may also require an exchange of the notes subsequent to December 31, 2006 should the closing sale price of common stock exceed 130% of the exchange price for a certain period of time or should the trading price on the notes be less than 98% of the product of the closing sales price of common stock multiplied by the applicable exchange rate for a certain period of time.
The notes are structurally subordinated to the secured indebtedness of the Company. The Company is not subject to any financial covenants under the Indenture. In addition, the Indenture will not restrict the ability to pay distributions, incur debt or issue or repurchase securities.

F-19
HOME PROPERTIES, INC.
NOTES TO CONSOLIDATED FINANCIAL STATEMENTS (DOLLARS IN THOUSANDS, EXCEPT SHARE AND PER SHARE DATA)
6 LINE OF CREDIT
As of December 31, 2006, the Company had an unsecured line of credit of $140,000 of which there was no outstanding balance. Provided that no event of default under this agreement has occurred, the Company may request on or before September 1, 2007 that the lenders increase the line of credit to an amount not to exceed $190,000. The Company has had no occurrences of default as of December 31, 2006. The line of credit is led by Manufacturers and Traders Trust Company (“M&T Bank”), as Administrative Agent, with three other participants: Citizens Bank of Rhode Island, Chevy Chase Bank, F.S.B., and Comerica Bank. Borrowings under the line of credit bear interest at .75% over the one-month LIBOR. The one-month LIBOR was 5.32% at December 31, 2006. The LIBOR interest rate plus .75% was 6.07% at December 31, 2006.
Increases in interest rates will raise the Company's interest expense on any outstanding balances and as a result would affect the Company's results of operations and financial condition. The line of credit expires on September 1, 2008 and can be extended one year upon satisfaction of certain conditions. The credit agreement relating to this line of credit requires the Company to maintain certain financial ratios and measurements. The Company was in compliance with these financial covenants for the year ended December 31, 2006.
7 MINORITY INTEREST
Minority interest in the Company relates to the interest in the Operating Partnership and affordable limited partnerships not owned by Home Properties, Inc. Holders of UPREIT Units may redeem a unit for one share of the Company's common stock or cash equal to the fair market value at the time of the redemption, at the option of the Company.
For 2006 and 2005, the effect of consolidating the affordable limited partnership in connection with FIN 46R has been reflected in the change in minority interest for the year. The changes in minority interest for the years ended December 31, 2006 and 2005 are as follows:
2006 2005 Balance, beginning of year $ 323,269 $ 310,775 Issuance of UPREIT Units associated with property acquisitions 20,397 55,598 Adjustment between minority interest and stockholders' equity 2,511 (33,856)Exchange of UPREIT Units for Common Shares (71,157) (4,010)Net income 43,327 37,190 Accumulated other comprehensive loss (2) 278 Distributions (35,779) (39,279)Effect of consolidating affordable limited partnerships under FIN 46R (24) (3,427)Balance, end of year $ 282,542 $ 323,269

F-20
HOME PROPERTIES, INC.
NOTES TO CONSOLIDATED FINANCIAL STATEMENTS (DOLLARS IN THOUSANDS, EXCEPT SHARE AND PER SHARE DATA)
8 PREFERRED STOCK AND STOCKHOLDERS' EQUITY
Preferred Stock
In June 2000, the Company privately placed 250,000 of its 8.78% Series D convertible cumulative preferred stock ("Series D Preferred Shares"), $100 liquidation preference per share. This offering generated net proceeds of approximately $25,000. The net proceeds were used to fund Company acquisitions and property upgrades. The Series D Preferred Shares were convertible at any time by the holder into Common Shares at a conversion price of $30.00 per Common Share, equivalent to a conversion ratio of 3.333 Common Shares for each Series D Preferred share (equivalent to 833,333 Common Shares assuming 100% converted) and were non-callable for five years. Each Series D Preferred share received the greater of a quarterly distribution of $2.195 per share or the dividend paid on a share of common stock on an as-converted basis. On May 26, 2005, all 250,000 shares of the Series D Preferred Shares were converted into 833,333 shares of Common stock. The conversion of the Series D Preferred Shares to Common Shares did not have an effect on the reported results of operations. As of December 31, 2005, there were no Series D Preferred Shares outstanding.
In March 2002, the Company issued 2,400,000 shares of its 9.00% Series F Cumulative Redeemable Preferred Stock ("Series F Preferred Shares"), with a $25.00 liquidation preference per share. This offering generated net proceeds of approximately $58,000. The net proceeds were used to fund the repurchase of the Company's Series B preferred stock, property acquisitions, and property upgrades. The Series F Preferred Shares are redeemable by the Company at anytime on or after March 25, 2007 at a redemption price of $25.00 per share, plus any accumulated, accrued and unpaid dividends. Each Series F Preferred share will receive an annual dividend equal to 9.00% of the liquidation preference per share (equivalent to a fixed annual amount of $2.25 per share). The Company anticipates redeeming the Series F preferred shares in March 2007.
Common Stock
In 1997, the Company's Board of Directors approved a stock repurchase program under which the Company may repurchase shares of its outstanding common stock and UPREIT Units. The shares/units may be repurchased through open market or privately negotiated transactions at the discretion of Company management. The Board's action did not establish a target price or a specific timetable for repurchase. At December 31, 2004 the Company had authorization to repurchase 2,000,000 shares of common stock and UPREIT Units under the stock repurchase program. On each of February 16, and November 4, 2005, the Board of Directors approved 2,000,000-share increases in the stock repurchase program. During 2005, the Company repurchased 2,779,805 additional shares at a cost of $111,700. During 2006, the Company repurchased 2,613,747 shares at a cost of $142,533. On October 27, 2006 the Board of Directors of the Company authorized repurchase of up to 2,000,000 additional shares. The Company has authorization to repurchase 2,606,448 shares as of December 31, 2006.
Dividend Reinvestment Plan
The Company has a Dividend Reinvestment Plan (the "DRIP"). The DRIP provides the stockholders of the Company an opportunity to automatically invest their cash dividends in common stock. In addition, eligible participants may make monthly payments or other voluntary cash investments in shares of common stock. The maximum monthly investment without prior Company approval is currently $10. Effective December 10, 2004, the discount was reduced from 2% to 0%. In addition, in the fourth quarter of 2004 and during the years ended 2006 and 2005, the Company has met share demand in the program through share repurchase by the transfer agent in the open market on the Company's behalf instead of new share issuance. This removes essentially 100% of the dilution caused by issuing new shares at a price less than the net asset value in an economic and efficient manner. A total of $18,000 was raised through this program during 2004.
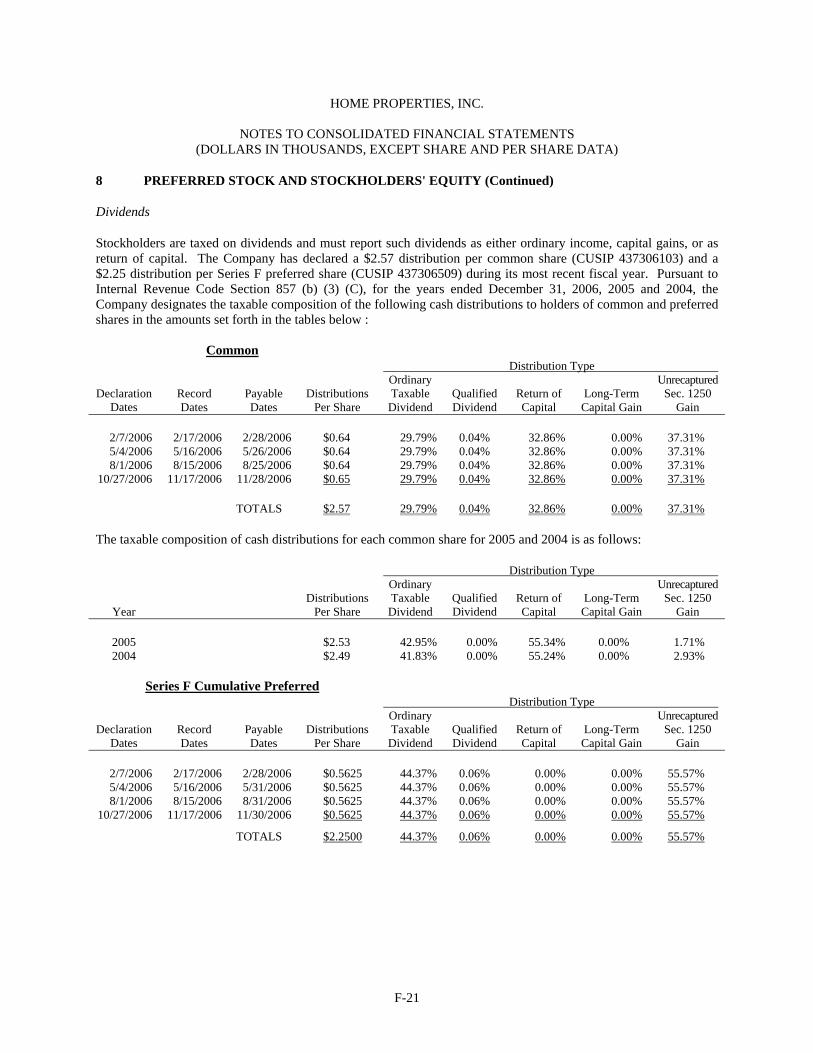
F-21
HOME PROPERTIES, INC.
NOTES TO CONSOLIDATED FINANCIAL STATEMENTS (DOLLARS IN THOUSANDS, EXCEPT SHARE AND PER SHARE DATA)
8 PREFERRED STOCK AND STOCKHOLDERS' EQUITY (Continued)
Dividends
Stockholders are taxed on dividends and must report such dividends as either ordinary income, capital gains, or as return of capital. The Company has declared a $2.57 distribution per common share (CUSIP 437306103) and a $2.25 distribution per Series F preferred share (CUSIP 437306509) during its most recent fiscal year. Pursuant to Internal Revenue Code Section 857 (b) (3) (C), for the years ended December 31, 2006, 2005 and 2004, the Company designates the taxable composition of the following cash distributions to holders of common and preferred shares in the amounts set forth in the tables below :
Common Distribution Type
Declaration Dates
Record Dates
Payable Dates
Distributions
Per Share
Ordinary Taxable
Dividend
Qualified Dividend
Return of Capital
Long-Term Capital Gain
Unrecaptured Sec. 1250
Gain
2/7/2006 2/17/2006 2/28/2006 $0.64 29.79% 0.04% 32.86% 0.00% 37.31% 5/4/2006 5/16/2006 5/26/2006 $0.64 29.79% 0.04% 32.86% 0.00% 37.31% 8/1/2006 8/15/2006 8/25/2006 $0.64 29.79% 0.04% 32.86% 0.00% 37.31%
10/27/2006 11/17/2006 11/28/2006 $0.65 29.79% 0.04% 32.86% 0.00% 37.31%
TOTALS $2.57 29.79% 0.04% 32.86% 0.00% 37.31%
The taxable composition of cash distributions for each common share for 2005 and 2004 is as follows:
Distribution Type
Year
Distributions
Per Share
Ordinary Taxable
Dividend Qualified Dividend
Return of Capital
Long-Term Capital Gain
Unrecaptured Sec. 1250
Gain
2005 $2.53 42.95% 0.00% 55.34% 0.00% 1.71% 2004 $2.49 41.83% 0.00% 55.24% 0.00% 2.93%
Series F Cumulative Preferred
Distribution Type
Declaration Dates
Record Dates
Payable Dates
Distributions
Per Share
Ordinary Taxable
Dividend
Qualified Dividend
Return of Capital
Long-Term Capital Gain
Unrecaptured Sec. 1250
Gain
2/7/2006 2/17/2006 2/28/2006 $0.5625 44.37% 0.06% 0.00% 0.00% 55.57% 5/4/2006 5/16/2006 5/31/2006 $0.5625 44.37% 0.06% 0.00% 0.00% 55.57% 8/1/2006 8/15/2006 8/31/2006 $0.5625 44.37% 0.06% 0.00% 0.00% 55.57%
10/27/2006 11/17/2006 11/30/2006 $0.5625 44.37% 0.06% 0.00% 0.00% 55.57%
TOTALS $2.2500 44.37% 0.06% 0.00% 0.00% 55.57%

F-22
HOME PROPERTIES, INC.
NOTES TO CONSOLIDATED FINANCIAL STATEMENTS (DOLLARS IN THOUSANDS, EXCEPT SHARE AND PER SHARE DATA)
8 PREFERRED STOCK AND STOCKHOLDERS' EQUITY (Continued)
The taxable composition of cash distributions for each preferred share for 2005 and 2004 is as follows:
Distribution Type
Year
Distributions
Per Share
Ordinary Taxable
Dividend Qualified Dividend
Return of Capital
Long-Term Capital Gain
Unrecaptured Sec. 1250
Gain
2005 $2.25 96.16% 0.00% 0.00% 0.00% 3.84% 2004 $2.25 93.44% 0.00% 0.00% 0.00% 6.56%
Total Shares/Units Outstanding
At December 31, 2006, 33,103,247 common shares, and 13,290,384 UPREIT Units were outstanding for a total of 46,393,631 common share equivalents.
In addition, 2,400,000 shares of Series F Cumulative Redeemable Preferred shares were outstanding as of December 31, 2006.
9 STOCK BENEFIT PLAN
The Company’s 1994 Stock Benefit Plan (the "1994 Plan") was adopted by the Company at the time of its initial public offering. On February 1, 2000, the Company adopted the 2000 Stock Benefit Plan, which was subsequently amended (the "2000 Plan"). On May 6, 2003, the Company adopted the 2003 Stock Benefit Plan and on May 6, 2005, the shareholders approved the Amended and Restated 2003 Stock Benefit Plan (the “2003 Plan”). No additional options will be issued under the 1994 Plan and the 2000 Plan. Participants in each of the above referenced plans (the “Stock Plans”) include officers, non-employee directors, and key employees of the Company. The 1994 Plan provided for the issuance of up to 1,596,000 options to officers and employees and 154,000 options to non-employee directors. The 2000 Plan limits the number of shares issuable under the plan to 2,755,000, of which 205,000 were to be available for issuance to the non-employee directors. The 2003 Plan limits the number of shares issuable under the plan to 2,859,475, of which 249,475 are to be available for issuance to the non-employee directors. Under the 1994 Plan, 1,542,381 shares have been granted to employees and 153,654 shares have been granted to non-employee directors. Awards for 2,451,922 shares have been granted to employees and awards for 166,460 shares have been granted to non-employee directors under the 2000 Plan. Under the 2003 Plan and as of December 31, 2006, 2,280,626 awards for shares have been issued to employees and 204,475 awards for shares have been issued to non-employee directors and 646,834 and 45,000 common shares are available for future grant of awards under the 2003 Plan for officers and employees and non-employee directors, respectively. Options granted under the Stock Plans vest 20% for each year of service until 100% vested on the fifth anniversary, except that options issued to certain officers (276,000) and all of the options issued to non-employee directors under the 1994 Plan and 2000 Plan vested immediately upon grant. The exercise price per share for stock options issued under all of the Stock Plans may not be less than 100% of the fair market value of a share of common stock on the date the stock option is granted. Options granted to non-employee directors under the 1994 Plan and the 2000 Plan expire after five years from the date of grant. All other options expire after ten years from the date of grant. The Stock Plans allow for the grant of options, stock appreciation rights and restricted stock awards. No stock appreciation rights have been granted. The Company has a policy of issuing new shares upon the exercise of stock options and upon the lapsing of restrictions with respect to restricted stock.
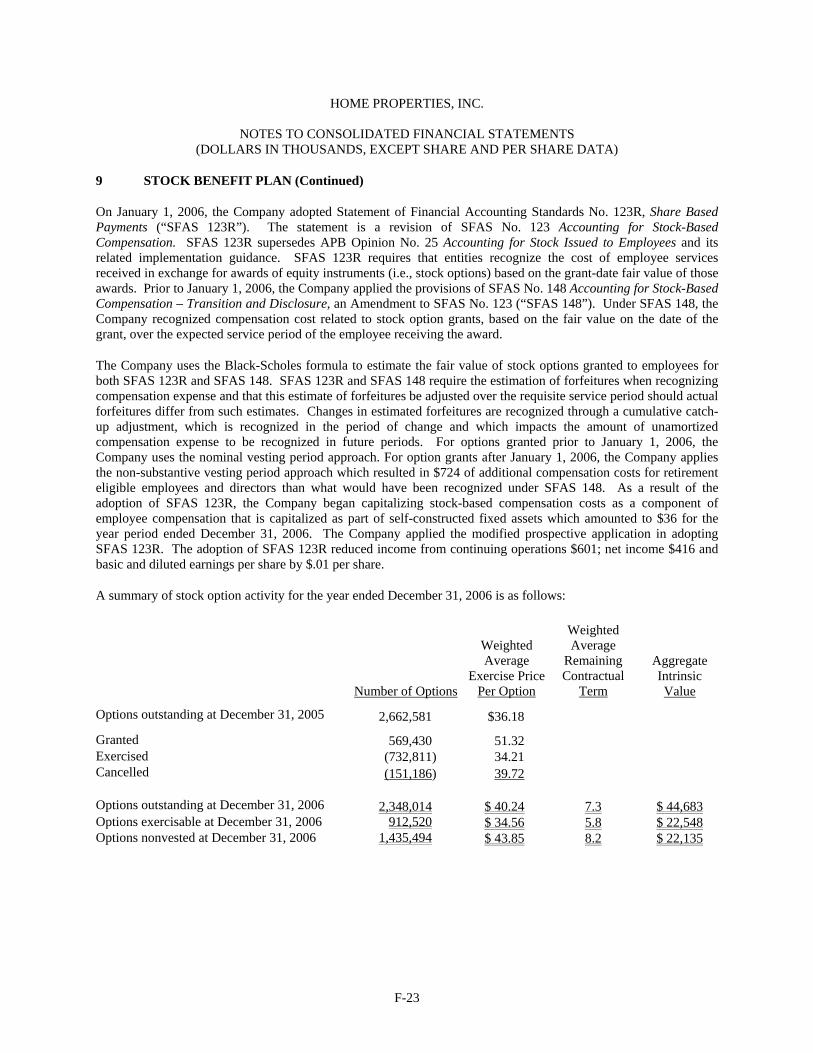
F-23
HOME PROPERTIES, INC.
NOTES TO CONSOLIDATED FINANCIAL STATEMENTS (DOLLARS IN THOUSANDS, EXCEPT SHARE AND PER SHARE DATA)
9 STOCK BENEFIT PLAN (Continued)
On January 1, 2006, the Company adopted Statement of Financial Accounting Standards No. 123R, Share Based Payments (“SFAS 123R”). The statement is a revision of SFAS No. 123 Accounting for Stock-Based Compensation. SFAS 123R supersedes APB Opinion No. 25 Accounting for Stock Issued to Employees and its related implementation guidance. SFAS 123R requires that entities recognize the cost of employee services received in exchange for awards of equity instruments (i.e., stock options) based on the grant-date fair value of those awards. Prior to January 1, 2006, the Company applied the provisions of SFAS No. 148 Accounting for Stock-Based Compensation – Transition and Disclosure, an Amendment to SFAS No. 123 (“SFAS 148”). Under SFAS 148, the Company recognized compensation cost related to stock option grants, based on the fair value on the date of the grant, over the expected service period of the employee receiving the award.
The Company uses the Black-Scholes formula to estimate the fair value of stock options granted to employees for both SFAS 123R and SFAS 148. SFAS 123R and SFAS 148 require the estimation of forfeitures when recognizing compensation expense and that this estimate of forfeitures be adjusted over the requisite service period should actual forfeitures differ from such estimates. Changes in estimated forfeitures are recognized through a cumulative catch-up adjustment, which is recognized in the period of change and which impacts the amount of unamortized compensation expense to be recognized in future periods. For options granted prior to January 1, 2006, the Company uses the nominal vesting period approach. For option grants after January 1, 2006, the Company applies the non-substantive vesting period approach which resulted in $724 of additional compensation costs for retirement eligible employees and directors than what would have been recognized under SFAS 148. As a result of the adoption of SFAS 123R, the Company began capitalizing stock-based compensation costs as a component of employee compensation that is capitalized as part of self-constructed fixed assets which amounted to $36 for the year period ended December 31, 2006. The Company applied the modified prospective application in adopting SFAS 123R. The adoption of SFAS 123R reduced income from continuing operations $601; net income $416 and basic and diluted earnings per share by $.01 per share.
A summary of stock option activity for the year ended December 31, 2006 is as follows:
Number of Options
Weighted Average
Exercise PricePer Option
Weighted Average
Remaining Contractual
Term
Aggregate Intrinsic Value
Options outstanding at December 31, 2005 2,662,581 $36.18
Granted 569,430 51.32 Exercised (732,811) 34.21 Cancelled (151,186) 39.72
Options outstanding at December 31, 2006 2,348,014 $ 40.24 7.3 $ 44,683 Options exercisable at December 31, 2006 912,520 $ 34.56 5.8 $ 22,548 Options nonvested at December 31, 2006 1,435,494 $ 43.85 8.2 $ 22,135

F-24
HOME PROPERTIES, INC.
NOTES TO CONSOLIDATED FINANCIAL STATEMENTS (DOLLARS IN THOUSANDS, EXCEPT SHARE AND PER SHARE DATA)
9 STOCK BENEFIT PLAN (Continued) The total cash received from the exercise of options was $25,070, $7,029 and $16,473 during the years ended December 31, 2006, 2005 and 2004, respectively. The weighted-average grant-date fair value of options granted during the years 2006, 2005 and 2004 was $6.69, $3.52 and $3.33, respectively. The total intrinsic value of options exercised was $14,419, $2,367and $6,867 during the years ended December 31, 2006, 2005 and 2004, respectively. A summary of nonvested stock option activity for the year ended December 31, 2006 is as follows:
Number of Options
Weighted Average Exercise Price
Per Option
Nonvested stock options at December 31, 2005 1,488,976 $38.67
Granted 569,430 51.32 Vested (471,726) 37.84 Cancelled (151,186) 39.72 Nonvested stock options at December 31, 2006 1,435,494 $ 43.85 As of December 31, 2006, there was $3,336 of total unrecognized compensation cost related to nonvested share-based compensation arrangements granted under the stock option plans; that cost is expected to be recognized over a weighted-average period of 2.22 years. The total fair value of options vested during the years ended December 31, 2006, 2005 and 2004 was $1,279, $987 and $890, respectively.
The fair value of each option grant is estimated on the date of grant using the Black-Scholes option-pricing model with the following weighted average assumptions for the years ended December 31, 2006, 2005 and 2004 as follows:
Assumption 2006 2005 2004
Expected dividend yields 5.26% 6.55% 6.74%
Expected volatility 18.73% 18.76% 19.79%
Expected lives of the options with a lifetime of ten years 6.5 Years 7.5 Years 7.5 Years
Expected lives of the options with a lifetime of five years N/A 5.0 Years 5.0 Years
Risk free interest rate 5.09% 4.10% 4.04%

F-25
HOME PROPERTIES, INC.
NOTES TO CONSOLIDATED FINANCIAL STATEMENTS (DOLLARS IN THOUSANDS, EXCEPT SHARE AND PER SHARE DATA)
9 STOCK BENEFIT PLAN (Continued) The computation of expected dividend yield is computed using an anticipated increase of the dividend by approximately 2% to 5% a year based on the annual dividend exercised each year over the Black-Scholes stock value. The expected volatility is based on the historical volatility of our stock over a time period from the initial public offering and ending on the grant date. Commencing in 2006, the expected lives of the options with a lifetime of ten years was determined by applying the “simplified method” approach (median between the average vesting term and the contractual term) for plain vanilla option grants made prior to January 1, 2008 as prescribed by Staff Accounting Bulletin No. 107, Share-Based Payment (“SAB 107”). Prior to 2006, the median point between the vesting date and expiration date was used. The risk-free interest rates are based on the U.S. Treasury yield curve in effect at the time of grant.
In 2006, 2005 and 2004, the Company recognized $1,793, $872 and $948, respectively, in stock compensation costs related to its outstanding stock options.
A summary of restricted stock activity for the year ended December 31, 2006 is as follows:
Number of Shares
Weighted Average
Grant Price Per Share
Weighted Average
Remaining Contractual
Term
Aggregate Outstanding
Value Restricted stock outstanding and nonvested at
December 31, 2005 277,822 $36.74
Granted 62,066 51.00 Vested and issued (65,833) 36.94 Cancelled (3,650) 38.35 Restricted stock outstanding and nonvested at
December 31, 2006 270,405 $39.94 1.4 $10,800
In 2006, 2005 and 2004, the Company granted a total of 62,066, 57,375 and 65,932 shares of restricted stock to both employees and directors, respectively. The directors’ grants included above for 2006, 2005 and 2004 were 9,000, 7,875 and 3,600 shares, respectively. All the directors’ shares vest 100% on the fifth anniversary of the date of grant. All of the 53,066, 49,500 and 62,332 shares of restricted stock granted to employees during 2006, 2005 and 2004 vest 25% on each anniversary of the date of grant for a period of four years. The restricted stock outstanding at December 31, 2006, 2005 and 2004 was 270,405, 277,822 and 267,928 shares, respectively.
Effective January 1, 2006, the Company began recognizing expense for the restricted stock grants based on the expected service period of the grantee. For grant recipients that have met or exceeded the retirement eligible age (59.5 for employees and 75 for directors), the expense is recognized upon grant. For recipients approaching retirement, the expense is recognized ratably over the lesser of the term between the grant date and the expected retirement date or the vesting period. All other grants are expensed ratably over the vesting period of 5 and 4 years for director and employee grants, respectively. Prior to 2006, grants were expensed ratably over the vesting period of 5 and 4 years for director and employee grants, respectively
The restricted shares were granted during 2006, 2005 and 2004 at a weighted average price of $51.00, $41.47 and $40.10 per share, respectively. The total fair value of restricted shares vested during the years ended December 31, 2006, 2005 and 2004 was $3,562, $1,629, and $1,208, respectively. Total compensation cost recorded for the years ended December 31, 2006, 2005 and 2004 for the restricted share grants was $2,656, $1,557, and $1,171, respectively.

F-26
HOME PROPERTIES, INC.
NOTES TO CONSOLIDATED FINANCIAL STATEMENTS (DOLLARS IN THOUSANDS, EXCEPT SHARE AND PER SHARE DATA)
10 SEGMENT REPORTING
The Company is engaged in the ownership and management of market rate apartment communities. Each apartment community is considered a separate operating segment. Each segment on a stand alone basis is less than 10% of the revenues, profit or loss, and assets of the combined reported operating segments and meets all of the aggregation criteria under SFAS 131. The operating segments are aggregated as Core and Non-core properties.
Non-segment revenue to reconcile to total revenue consists of interest and dividend income and other income. Non–segment assets to reconcile to total assets include cash and cash equivalents, cash in escrows, accounts receivable, prepaid expenses, deferred charges, other assets and other assets held for sale.
Core properties consist of all apartment communities owned throughout 2005 and 2006 where comparable operating results are available. Therefore, the Core Properties represent communities owned as of January 1, 2005. Non-core properties consist of apartment communities acquired during 2005 and 2006, such that full year comparable operating results are not available. In addition, the core properties segment does not include assets held for sale as of December 31, 2006, 2005 and 2004.
The Company assesses and measures segment operating results based on a performance measure referred to as net operating income. Net operating income is defined as total revenues less operating and maintenance expenses. The accounting policies of the segments are the same as those described in Notes 1 and 2.
The revenues and net operating income for each of the reportable segments are summarized as follows for the years ended December 31, 2006, 2005, and 2004.
2006 2005 2004 Revenues Apartments owned Core properties $ 404,322 $ 384,911 $ 363,869 Non-core properties 44,441 13,010 - Reconciling items 5,229 2,604 3,263 Total Revenue $ 453,992 $ 400,525 $ 367,132 Net operating income Apartments owned Core properties $ 231,930 $ 217,141 $ 206,067 Non-core properties 25,988 5,874 - Reconciling items 5,229 2,604 3,263 Net operating income 263,147 225,619 209,330 General & administrative expenses (22,626) (19,652) (23,978)Interest expense (106,773) (92,178) (77,145)Depreciation and amortization (96,142) (80,944) (70,710)Impairment of assets held as general partner - (400) (1,116)Equity in losses of unconsolidated affiliates - - (538)Minority interest in limited partnership - - 441 Minority interest in operating partnership (9,614) (8,629) (9,204)Income from continuing operations $ 27,992 $ 23,816 $ 27,080

F-27
HOME PROPERTIES, INC.
NOTES TO CONSOLIDATED FINANCIAL STATEMENTS (DOLLARS IN THOUSANDS, EXCEPT SHARE AND PER SHARE DATA)
10 SEGMENT REPORTING (Continued)
The assets for each of the reportable segments are summarized as follows as of December 31, 2006 and 2005:
Assets 2006 2005 Apartments owned Core properties $ 2,286,589 $ 2,193,661 Held for sale properties - 223,938 Non-core properties 715,044 466,952 Reconciling items 238,785 93,319 Total assets $ 3,240,418 $ 2,977,870
11 DERIVATIVE FINANCIAL INSTRUMENTS
The Company has entered into interest rate swaps to minimize significant unplanned fluctuations in earnings that are caused by interest rate volatility. The Company does not utilize these arrangements for trading or speculative purposes. The principal risk to the Company through its interest rate hedging strategy is the potential inability of the financial institutions from which the interest rate protection was purchased to cover all of their obligations. To mitigate this exposure, the Company purchases its interest rate swaps from either the institution that holds the debt or from institutions with a minimum A- credit rating.
All derivatives, which have historically been limited to interest rates swaps designated as cash flow hedges, are recognized on the balance sheet at their fair value. On the date that the Company enters into an interest rate swap, it designates the derivative as a hedge of the variability of cash flows that are to be received or paid in connection with a recognized liability. To the extent effective, subsequent changes in the fair value of a derivative designated as a cash flow hedge are recorded in other comprehensive income, until earnings are affected by the variability of cash flows of the hedged transaction. Any hedge ineffectiveness will be reported in interest expense in the consolidated statement of operations.
The Company formally documents all relationships between hedging instruments and hedged items, as well as its risk-management objective and strategy for undertaking various hedge transactions. The Company formally assesses (both at the hedge's inception and on an ongoing basis) whether the derivatives that are used in hedging transactions have been highly effective in offsetting changes in the cash flows of the hedged items and whether those derivatives may be expected to remain highly effective in future periods. Should it be determined that a derivative is not (or has ceased to be) highly effective as a hedge, the Company will discontinue hedge accounting prospectively.
The Company has four interest rate swaps that effectively convert variable rate debt to fixed rate debt. The notional amount amortizes in conjunction with the principal payments of the hedged items. The terms as follows:
Original Notional Amount
Fixed Interest Rate
Variable Interest Rate
Maturity Date
$16,384,396 5.35% LIBOR + 1.50% June 25, 2007 10,000,000 5.39% LIBOR + 1.50% June 25, 2007 3,000,000 8.22% LIBOR + 1.40% June 25, 2007 4,625,000 8.40% LIBOR + 1.40% June 25, 2007
On January 1, 2001, the Company adopted SFAS No. 133, Accounting for Derivative Instruments and Hedging Activities (“SFAS 133”). At that time, the Company designated all of its interest rate swaps as cash flow hedges in accordance with the requirements of SFAS 133.

F-28
HOME PROPERTIES, INC.
NOTES TO CONSOLIDATED FINANCIAL STATEMENTS (DOLLARS IN THOUSANDS, EXCEPT SHARE AND PER SHARE DATA)
11 DERIVATIVE FINANCIAL INSTRUMENTS (Continued)
As of December 31, 2006, the aggregate fair value of the Company's interest rate swaps was $149 prior to the allocation of minority interest, and is included in other assets in the Consolidated Balance Sheets. For the year ending December 31, 2006, as the critical terms of the interest rate swaps and the hedged items are the same, no ineffectiveness was recorded in the consolidated statements of operations. All components of the interest rate swaps were included in the assessment of hedge effectiveness. The Company expects that within the next twelve months it will reclassify as a charge to earnings $149, prior to the allocation of minority interest, of the amount recorded in accumulated other comprehensive income. The fair value of the interest rate swaps is based upon the estimate of amounts the Company would receive or pay to terminate the contract at the reporting date and is estimated using interest rate market pricing models.
12 TRANSACTIONS WITH AFFILIATES
The Company and the HPRS recognized management and development fee revenue, interest income and other miscellaneous income from affiliated entities of $59, $230 and $696 for the years ended December 31, 2006, 2005, and 2004, respectively. The Company had accounts receivable outstanding due from affiliated entities of $157, $157 and $12 at December 31, 2006, 2005 and 2004, respectively.
On January 1, 2004, the Company sold certain assets of its commercial property management division to Home Leasing, LLC, which was owned by Nelson and Norman Leenhouts and is now owned by Nelson Leenhouts. This division managed approximately 2.2 million square feet of gross leasable area, as well as certain planned communities. Subsequently, some of the assets were sold to Broadstone Real Estate LLC (“Broadstone”), which is owned in part by Norman Leenhouts, Amy L. Tait and Mrs. Tait's spouse. The initial amount received was $82. In addition to the initial amount, the Company was entitled to receive a percentage of the management fee received by Broadstone in connection with the management of one of the commercial properties for a period not to exceed 36 months. The expected monthly fee as outlined in the contract was approximately $4.6 or $55 per year and was adjusted to $3.4, or $40 per year after the first year. Broadstone continued to manage the property for three years, and accordingly, the Company received a total additional deferred purchase price of $139, of which $44 has been received for the year ended December 31, 2006. The cumulative gain recognized on the sale of these assets through December 31, 2006 amounted to $108.
On March 2, 2004, the Company acquired Wellington Trace Apartments for $27,100 from an entity owned in part by an individual who subsequently became one of the Company’s directors.
The Company leases its corporate office space from an affiliate. The lease requires an annual base rent of $895 for the years ended 2006 through 2009. The lease also requires the Company to pay a pro rata portion of property improvements, real estate taxes and common area maintenance. Rental expense was $1,699, $1,693 and $1,694 for the years ended December 31, 2006, 2005, and 2004, respectively.
During 2004, the loan balances aggregating $315, outstanding as of December 31, 2003, under the officer and director share purchase program were repaid in full. On August 5, 2002, the Board of Directors of the Company prohibited any further loans to officers and directors in accordance with the Sarbanes-Oxley Act of 2002.

F-29
HOME PROPERTIES, INC.
NOTES TO CONSOLIDATED FINANCIAL STATEMENTS (DOLLARS IN THOUSANDS, EXCEPT SHARE AND PER SHARE DATA)
13 COMMITMENTS AND CONTINGENCIES
Property Lease
On December 1, 2004 the Company entered in to a lease agreement with a third party owner to manage the operations of one of their communities with 1,387 apartment units. The lease had a term of five years, but after two years (from the 24th month to the 36th month), the owner could require the Company to buy the property. From the 36th month to the end of the lease term, the Company had the right to require the owner to sell the property to the Company. The agreement required an initial deposit of $5,000, a deposit in 2005 of $1,230, with an additional $2,081 deposit requirement during 2006, representing capital improvements paid by the owner. The net operating income of the property (as defined in the lease agreement) was remitted back to the owner as rent on a monthly basis. In exchange for services, the Company was entitled to receive monthly; a management fee equal to 5% of collected income, as defined in the lease, an incentive fee of $25, and interest payments equal to 3% annual interest on the outstanding deposit. Including interest, the total income recognized by the Company amounted to $1,451, $1,278 and $98, for the years ended December 31, 2006, 2005 and 2004, respectively. On December 27, 2006, the Company closed on the acquisition of the property. The acquisition price of the property was $144,768.
Ground Lease
The Company had a non-cancelable operating ground lease for one of its properties. The lease had an expiration date of May 1, 2020, with options to extend the term of the lease for two successive terms of twenty-five years each. The lease provided for contingent rental payments based on certain variable factors. The lease also required the Company to pay real estate taxes, insurance and certain other operating expenses applicable to the leased property. Ground lease expense was $194, $210 and $226, including contingent rents of $130, $140 and $156, for the years ended December 31, 2006, 2005 and 2004, respectively. Effective December 2006, the ground lease was sold to an unrelated party.
401(k) Savings Plan
The Company sponsors a contributory savings plan. Under the plan, the Company will match 75% of the first 4% of participant contributions. The matching expense under this plan was $832, $802 and $690 for the years ended December 31, 2006, 2005 and 2004, respectively.
Incentive Compensation Plan
The Incentive Compensation Plan for 2005 and 2006 provided that eligible officers and key employees may earn a cash bonus based upon two performance measures: the percentage of growth in the Company's funds from operations ("FFO") on a per share/unit diluted basis from the previous year and the percentage of growth in same store net operating income from the previous year as compared to industry peers. In 2004, the performance measure was based on the percentage growth in the Company's FFO per share/unit on the diluted basis as compared against the industry average growth. The bonus expense charged to operations was $4,983, $2,582 and $3,414 for the years ended December 31, 2006, 2005 and 2004, respectively.

F-30
HOME PROPERTIES, INC.
NOTES TO CONSOLIDATED FINANCIAL STATEMENTS (DOLLARS IN THOUSANDS, EXCEPT SHARE AND PER SHARE DATA)
13 COMMITMENTS AND CONTINGENCIES (Continued)
Contingencies
During April, 2004, the Company finalized negotiations with New York State settling a sales and use tax audit covering the period June 1, 1999 through May 31, 2002. The total cost to the Company as a result of the audit amounted to $861. This was included in the first quarter 2004 results and allocated $448 to expense and $413 capitalized to real estate assets for improvements.
As a result of this audit, during the second quarter of 2004, the Company examined its sales and use tax compliance in the other states in which the Company operates. Based upon its internal analysis, the Company estimated its liability as of June 30, 2004 in those states where it found non-compliance of $1,712. This was included in the second quarter of 2004 results and allocated $761 to expense and $951 capitalized to real estate assets for improvements. The liability recorded relates to the period beginning on the later of: (i) the date the Company first purchased property in the applicable state; or (ii) January 1, 1997 and ending on June 30, 2004. In addition, the Company increased the liability for sales tax exposure by $68 for the six-month period ended December 31, 2004. The Company had filed Voluntary Disclosure Agreements (“VDAs”) with the four states where it had significant financial exposure. During the first six months of 2005, the Company signed VDAs with these states limiting the VDA filing period back to January 1, 2001, and the Company has satisfied all financial obligations under the VDAs. For the three- and six-month periods ended June 30, 2005, the Company has recorded adjustments to the liability for both the effects of signing the VDAs as well as for the results of the Company’s additional testing for the first six months. The net impact of these adjustments resulted in a decrease in real estate assets of $175, interest expense of $115 and operating expenses of $108 for a net decrease to the accrued liability of $398. During the third quarter of 2005, the Company finalized negotiations with New York State settling a sales tax audit covering the period June 1, 2002 through November 30, 2004. The settlement was not materially different from what had been accrued. The result of the recent payments on the VDAs and this New York State audit is that the sales tax accrual which had been over $1,712 (as referenced above) has been fully paid as of December 31, 2005.
In connection with various UPREIT transactions, the Company has agreed to maintain certain levels of nonrecourse debt for a period of 5 to 10 years associated with the contributed properties acquired. In addition, the Company is restricted in its ability to sell certain contributed properties (52% of the owned portfolio) for a period of 7 to 15 years except through a tax deferred Internal Revenue Code Section 1031 like-kind exchange. The remaining terms on the sale restrictions range from 1 to 9 years.
Debt Covenants
The line of credit loan agreement contains restrictions which, among other things, require maintenance of certain financial ratios (See Note 6).
In connection with the issuance of the Series F Preferred Stock, the Company is required to maintain for each fiscal quarterly period a fixed charge coverage ratio, as defined in the Series F Cumulative Redeemable Preferred Stock Article Supplementary, of 1.75 to 1.0. For the year ended December 31, 2006, the Company maintained the required fixed charge coverage ratio.

F-31
HOME PROPERTIES, INC.
NOTES TO CONSOLIDATED FINANCIAL STATEMENTS (DOLLARS IN THOUSANDS, EXCEPT SHARE AND PER SHARE DATA)
13 COMMITMENTS AND CONTINGENCIES (Continued)
Guarantees
As of December 31, 2006, the Company, through its general partnership interest in an affordable property limited partnership, has guaranteed the Low Income Housing Tax Credits to limited partners totaling approximately $3,000. As of December 31, 2006, there were no known conditions that would make such payments necessary relating to these guarantees. In addition, the Company, acting as general partner in this partnership, is obligated to advance funds to meet partnership operating deficits.
Executive Retention Plan
Effective February 2, 1999, the Executive Retention Plan provides for severance benefits and other compensation to be received by certain employees in the event of a change in control of the Company and a subsequent termination of their employment without cause or voluntarily with good cause.
14 PROPERTY ACQUISITIONS
For the years ended December 31, 2006, 2005, and 2004, the Company has acquired the communities listed below: Cost of Market Date Year Number Cost of Acquisition
Apartment Community Area Acquired Constructed of Units Acquisition Per Unit Chatham Hill New Jersey 1/30/04 1967 308 $ 48,215 $157 Northwood New Jersey 1/30/04 1965 134 $ 15,186 $113 Fairmount New Jersey 1/30/04 1943 54 $ 2,256 $ 42 Kensington New Jersey 1/30/04 1943 38 $ 1,843 $ 49 Wellington Trace Northern VA 3/2/04 2002 240 $ 27,134 $113 Village at Marshfield Boston 3/17/04 1972 276 $ 31,695 $115 Woodleaf Northern VA 3/19/04 1985 228 $ 20,672 $ 91 The Hamptons Southeast Florida 7/7/04 1986-1987 668 $ 56,395 $ 84 Vinings Southeast Florida 7/7/04 1989 168 $ 13,986 $ 83 Regency Club New Jersey 9/24/04 1974 372 $ 37,610 $101 Ridgeview at Wakefield Valley Baltimore 1/13/05 1988 204 $ 19,407 $ 96 Hackensack Gardens New Jersey 3/1/05 1948 198 $ 13,292 $ 65 Barrington Gardens New Jersey 3/1/05 1973 148 $ 7,444 $ 50 Sayville Commons Long Island 7/15/05 2001-2003 342 $ 63,384 $186 The Brooke at Peachtree Philadelphia 8/15/05 1986-1989 146 $ 16,137 $110 Peppertree Farm Northern VA 12/28/05 1972-1978 881 $ 96,322 $110 Cinnamon Run Northern VA 12/28/05 1979-1982 511 $ 67,377 $133 Highland House Boston 5/31/06 1965-1969 172 $ 17,889 $104 Liberty Place Boston 6/6/06 1988 107 $ 14,892 $139 The Heights at Marlborough Boston 9/7/06 1973 348 $ 48,914 $141 The Meadows at Marlborough Boston 9/7/06 1969-1972 264 $ 34,162 $129 Heritage Woods Baltimore 10/4/06 1972-1973 164 $ 14,042 $ 86 Top Field Baltimore 10/4/06 1973 156 $ 18,391 $118 The Coves at Chesapeake Baltimore 11/20/06 1976 & 1982 469 $ 67,043 $143 Mount Vernon Square Northern VA 12/27/06 1968-1974 1,387 $144,768 $104
During 2006, the Company completed construction and placed into service a 120-unit apartment community located in Portland, ME (Liberty Commons) at a total cost of $14,598.

F-32
HOME PROPERTIES, INC.
NOTES TO CONSOLIDATED FINANCIAL STATEMENTS (DOLLARS IN THOUSANDS, EXCEPT SHARE AND PER SHARE DATA)
15 DISCONTINUED OPERATIONS
The Company reports its property dispositions as discontinued operations as prescribed by the provisions of SFAS No. 144, Accounting for the Impairment or Disposal of Long-Lived Assets (“SFAS 144”). Pursuant to the definition of a component of an entity in SFAS 144, assuming no significant continuing involvement by the former owner after the sale, the sale of an apartment community is considered a discontinued operation. In addition, apartment communities classified as held for sale are also considered a discontinued operation. The Company generally considers assets to be held for sale when all significant contingencies surrounding the closing have been resolved, which often corresponds with the actual closing date. As of December 31, 2005, the Company classified 21 properties as held for sale. These 21 properties were sold during 2006 and are included in discontinued operations for all periods presented and classified as held for sale as of December 31, 2005.
Included in discontinued operations for the three years ended December 31, 2006 are the operating results, net of minority interest, of 48 apartment community dispositions (39 sold in 2006, 4 sold in 2005 and 5 sold in 2004). In addition, discontinued operations for the years ended December 31, 2005 and 2004 includes the operating results of four VIEs sold during 2005. For purposes of the discontinued operations presentation, the Company only includes interest expense associated with specific mortgage indebtedness of the properties that are considered discontinued operations.
A summary of community dispositions is as follows:
Year
Number of Disposed
Communities
Number of Disposed
Units
Number of Related
Transactions Total Sales
Price Sales Price
Per Unit Total Gain
On Sale
2006 39 9,705 3 $495,300 $51 $110,500 2005 4 816 3 $142,600 $175 $73,200 2004 5 1,646 4 $92,500 $56 $26,600
The operating results of discontinued operations are summarized as follows for the years ended December 31, 2006, 2005, and 2004: 2006 2005 2004 Revenues: Rental income $ 56,142 $ 91,900 $ 114,652 Property other income 6,498 7,538 7,425 Total revenues 62,640 99,438 122,077
Operating and maintenance 34,317 54,155 64,573 Interest expense 17,078 13,215 19,451 Depreciation and amortization 5,553 19,171 24,519 Impairment of real property - 7,325 1,100 Total Expenses 56,948 93,866 109,643 Income from discontinued operations before minority interest and
gain on disposition of property 5,692 5,572 12,434 Minority interest in limited partnership - (23) 833 Minority interest in operating partnership (1,947) (1,828) (4,354)Income from discontinued operations $ 3,745 $ 3,721 $ 8,913

F-33
HOME PROPERTIES, INC.
NOTES TO CONSOLIDATED FINANCIAL STATEMENTS (DOLLARS IN THOUSANDS, EXCEPT SHARE AND PER SHARE DATA)
15 DISCONTINUED OPERATIONS (Continued)
The results of discontinued operations in the tables below have been presented for the years ended December 31, 2005 and 2004 only, as the discontinued operations for 2006 solely represents the results from owned communities. Year ended December 31, 2005 Owned Communities VIEs Total Revenues: Rental income $ 88,686 $ 3,214 $ 91,900 Property other income 7,397 141 7,538 Total revenues 96,083 3,355 99,438
Expenses: Operating and maintenance 51,534 2,621 54,155 Interest expense 13,204 11 13,215 Depreciation and amortization 19,171 - 19,171 Impairment of real property - 7,325 7,325 Total expenses 83,909 9,957 93,866 Income (loss) from discontinued operations before minority interest and
gain on disposition of property 12,174 (6,602)
5,572 Minority interest in limited partnership - (23) (23)Minority interest in operating partnership (4,021) 2,193 (1,828)Income (loss) from discontinued operations $ 8,153 $(4,432) $ 3,721
Year ended December 31, 2004 Owned Communities VIEs Total Revenues: Rental income $ 102,259 $ 12,393 $114,652 Property other income 7,143 282 7,425 Total revenues 109,402 12,675 122,077 Expenses: Operating and maintenance 55,288 9,285 64,573 Interest expense 16,370 3,081 19,451 Depreciation and amortization 21,966 2,553 24,519 Impairment of real property 1,100 - 1,100 Total expenses 94,724 14,919 109,643 Income (loss) from discontinued operations before minority interest and
gain on disposition of property 14,678 (2,244) 12,434 Minority interest in limited partnership - 833 833 Minority interest in operating partnership (4,751) 397 (4,354)Income (loss) from discontinued operations $ 9,927 $ (1,014) $ 8,913

F-34
HOME PROPERTIES, INC.
NOTES TO CONSOLIDATED FINANCIAL STATEMENTS (DOLLARS IN THOUSANDS, EXCEPT SHARE AND PER SHARE DATA)
15 DISCONTINUED OPERATIONS (Continued)
The major classes of assets and liabilities held for sale as of December 31, 2005 were as follows:
2005 Real estate: Land $ 28,372 Buildings, improvements and equipment 249,999 278,371 Less: accumulated depreciation (54,433) Real estate held for sale or disposal, net 223,938 Other assets: Cash in escrows 434 Accounts receivable 664 Prepaid expenses and other assets 2,951 Other assets held for sale 4,049 Liabilities: Mortgage notes payable 73,603 Accrued expenses and other liabilities 431 Security deposits 1,318 Liabilities held for sale 75,352
Net assets held for sale $152,635
16 PROFORMA CONDENSED FINANCIAL INFORMATION
The Company acquired eight apartment communities ("2006 Acquired Communities") with a combined 3,067 units in six unrelated transactions during the year ended December 31, 2006. The total combined purchase price (including closing costs) of $360,100 equates to approximately $117 per unit. Consideration for the communities was funded through the assumption or placement of new debt of $156,900 of debt, $182,800 from the Company’s line of credit and disposed property proceeds, and $20,400 of UPREIT Units.
The Company acquired seven apartment communities ("2005 Acquired Communities") with a combined 2,430 units in six unrelated transactions during the year ended December 31, 2005. The total combined purchase price (including closing costs) of $283,400 equates to approximately $117 per unit. Consideration for the communities was funded through the assumption or placement of new debt of $184,300 of debt, $43,500 from the Company’s line of credit and $55,600 of UPREIT Units.
The following unaudited proforma information was prepared as if: (i) the 2006 transactions related to the acquisition of the 2006 Acquired Communities occurred as of the beginning of each period, and (ii) the 2005 transactions related to the acquisition of the 2005 Acquired Communities had occurred as of the beginning of each period. The proforma financial information is based upon the historical consolidated financial statements and is not necessarily indicative of the consolidated results which actually would have occurred if the transactions had been consummated at January 1, 2004 or 2005, nor does it purport to represent the results of operations for future periods. Adjustments to the proforma condensed combined statement of operations for the years ended December 31, 2006, 2005, and 2004 consist principally of providing net operating activity and recording interest, depreciation and amortization from January 1, 2004 or 2005 to the acquisition date as appropriate.

F-35
HOME PROPERTIES, INC.
NOTES TO CONSOLIDATED FINANCIAL STATEMENTS (DOLLARS IN THOUSANDS, EXCEPT SHARE AND PER SHARE DATA)
16 PROFORMA CONDENSED FINANCIAL INFORMATION (Continued)
Proforma (i)
For the years ended December 31, (unaudited)
2006 2005 Total revenues $481,746 $456,184 Net income available to common shareholders 24,303 19,519 Per common share data: Net income available to common shareholders:
Basic $0.74 $0.61 Diluted $0.73 $0.60
Weighted average numbers of shares outstanding: Basic 32,697.794 31,962.082 Diluted 33,337.557 32,328.105
Proforma (ii)
For the years ended December 31, (unaudited)
2005 2004 Total revenues $421,869 $405,511 Net income available to common shareholders before cumulative effect of change in
accounting principle 17,139 19,990 Net income available to common shareholders 17,139 19,669 Per common share data: Net income available to common shareholders before cumulative effect of change in accounting principle
Basic $0.54 $0.61 Diluted $0.53 $0.60
Net income available to common shareholders: Basic $0.54 $0.60 Diluted $0.53 $0.59
Weighted average numbers of shares outstanding: Basic 31,962.082 32,911.945 Diluted 32,328.105 33,314.038

F-36
HOME PROPERTIES, INC.
NOTES TO CONSOLIDATED FINANCIAL STATEMENTS (DOLLARS IN THOUSANDS, EXCEPT SHARE AND PER SHARE DATA)
17 SUPPLEMENTAL CASH FLOW DISCLOSURES
Supplemental cash flow information including non cash financing and investing activities for the years ended December 31, 2006, 2005, and 2004 are as follows:
2006 2005 2004 Cash paid for interest $120,781 $104,674 $ 92,150 Mortgage loans assumed associated with property acquisitions 159,782 7,916 90,568 Issuance of UPREIT Units associated with property and other acquisitions 20,397 55,598 12,105 Increase in real estate associated with the purchase of UPREIT Units 124,631 5,220 12,470 Exchange of UPREIT Units for common shares 71,157 4,010 14,106 Fair value of hedge instruments (35) 845 659 Net real estate assumed in connection with FIN 46R consolidation - - 152,319 Other assets assumed in connection with FIN 46R consolidation - - 11,916 Mortgage debt assumed in connection with FIN 46R consolidation - - 129,149 Other liabilities assumed in connection with FIN 46R consolidation - - 5,363 Net real estate disposed in connection with FIN 46R consolidation - (50,467) (69,743) Other assets disposed in connection with FIN 46R consolidation - (6,940) (3,054) Mortgage debt disposed in connection with FIN 46R consolidation - (59,339) (48,611) Other liabilities disposed in connection with FIN 46R consolidation - (1,187) (2,759)
18 QUARTERLY FINANCIAL STATEMENT INFORMATION (UNAUDITED)
Quarterly financial information for the years ended December 31, 2006 and 2005 are as follows: 2006 First Second Third Fourth
Total revenue $108,789 $111,200 $115,255 $118,748
Net income available to common shareholders 4,138 11,003 10,361 79,583
Basic earnings per share data: Net income (loss) available to common shareholders $0.13 $0.33 $0.31 $2.39
Diluted earnings per share data: Net income (loss) available to common shareholders $0.13 $0.33 $0.30 $2.33 2005 First Second Third Fourth Total revenue $ 95,731 $ 98,252 $102,520 $104,022
Net income available to common shareholders (1,870) 8,038 15,353 53,712
Basic earnings per share data: Net income available to common shareholders $(0.06) $0.25 $0.47 $1.70
Diluted earnings per share data: Net income available to common shareholders $(0.06) $0.25 $0.47 $1.68
Full year per share data does not equal the sum of the quarterly data due to the impact of the convertible securities on the quarterly results and not the year to date amounts. The quarterly reports for the years ended December 31, 2006 and 2005 have been reclassified to reflect discontinued operations in accordance with SFAS 144.

F-37
HOME PROPERTIES, INC.
NOTES TO CONSOLIDATED FINANCIAL STATEMENTS (DOLLARS IN THOUSANDS, EXCEPT SHARE AND PER SHARE DATA)
19 SUBSEQUENT EVENTS
On February 2, 2007, the Company acquired two land parcels located in Silver Spring, MD and Alexandria, VA from a single seller for total consideration of $46.5 million. The transaction was funded in cash. Both parcels are entitled for development. The projects are fully designed and have obtained all discretionary approvals. While several administrative approvals are still necessary, construction on both projects should start in 2007, with completion anticipated in 2009.
On February 7, 2007, the Board of Directors declared a dividend of $0.65 per share for the quarter ended December 31, 2006. This is the equivalent of an annual distribution of $2.60 per share. The dividend is payable February 28, 2007 to shareholders of record on February 16, 2007.
On February 7, 2007, the Board of Directors declared a regular dividend of $0.5625 per share on its Series F Cumulative Redeemable Preferred Stock, for the quarter ending February 28, 2007. The dividend on the preferred shares is payable on February 28, 2007 to shareholders of record on February 16, 2007. This dividend is equivalent to an annualized rate of $2.25 per share.
On February 15, 2007, the Company acquired two communities in unrelated transactions: The Townhomes of Beverly (204 units) in Beverly, MA for $36.4 million and Jacob Ford Village (270 units) in Morristown, NJ for $26.7 million. Consideration for Jacob Ford Village included $22.3 million of Operating Partnership UPREIT Units with the balance paid in cash. The Townhomes of Beverly were purchased with cash.

F-38
SCHEDULE II
HOME PROPERTIES, INC.
VALUATION AND QUALIFYING ACCOUNTS FOR THE YEARS ENDED DECEMBER 31:
(IN THOUSANDS)
Balance at Charged to Adjustments/ Beginning Costs and Amounts Balance at of Year Expenses Written Off End of Year Allowance for Doubtful Receivables
December 31, 2006: $ 513 $4,289 ($3,818) $ 984
December 31, 2005: 567 3,472 (3,526) 513
December 31, 2004: 241 3,527 (3,201) 567
Deferred Tax Asset Valuation Allowance
December 31, 2006: 8,421 - 1,657 10,078
December 31, 2005: 8,680 - (259) 8,421
December 31, 2004: 8,185 495 - 8,680

F-39
SCHEDULE IIIHOME PROPERTIES, INC.
REAL ESTATE AND ACCUMULATED DEPRECIATION DECEMBER 31, 2006
(IN THOUSANDS)
Initial Cost Costs Total Cost Total Cost, Buildings, Capitalized Buildings, Net of Encum- Improvements Subsequent to Improvements Accumulated Accumulated Year of
Community brances Land & Equipment Acquisition Land & Equipment Total(a) Depreciation Depreciation Acquisition
Barrington Gardens 4,170 914 6,556 2,559 914 9,115 10,029 466 9,563 2005 Bayview & Colonial 11,487 1,652 8,471 4,726 1,652 13,197 14,849 2,416 12,433 2000 Beechwood Gardens - 591 3,442 3,097 591 6,539 7,130 1,695 5,435 1998 Blackhawk Apartments 13,267 3,026 14,568 5,892 3,026 20,460 23,486 3,942 19,544 2000 Bonnie Ridge Apartments 33,996 5,129 42,769 29,919 5,129 72,688 77,817 15,424 62,393 1999 Braddock Lee Apartments 21,232 3,923 8,842 6,486 3,923 15,328 19,251 4,353 14,898 1998 Brittany Place 17,323 4,929 39,608 14,060 4,929 53,668 58,597 6,624 51,973 2002 Cambridge Village Associates 3,061 2,502 3,188 2,374 2,502 5,562 8,064 764 7,300 2002 Canterbury Apartments 29,067 5,117 21,384 9,194 5,117 30,578 35,695 5,830 29,865 1999 Carriage Hill Apartment 5,688 615 3,827 4,059 615 7,886 8,501 2,497 6,004 1996 Castle Club Apartments 6,630 990 8,909 3,699 990 12,608 13,598 2,312 11,286 2000 Chatham Hill Apartments 45,000 2,067 46,150 7,291 2,067 53,441 55,508 4,013 51,495 2004 Chesterfield Apartments 9,735 1,547 8,206 5,700 1,547 13,906 15,453 3,841 11,612 1997 Cider Mill 61,199 15,920 65,938 10,758 15,920 76,696 92,616 8,701 83,915 2002 Cinnamon Run Apartments 52,300 7,923 59,646 2,605 7,923 62,251 70,174 1,738 68,436 2005 Cornwall Park 5,497 469 2,947 4,827 469 7,774 8,243 2,408 5,835 1996 Country Village Apartments 19,885 2,318 11,149 9,249 2,318 20,398 22,716 4,964 17,752 1998 Courtyards Village 4,711 3,397 9,824 3,358 3,397 13,182 16,579 2,076 14,503 2001 Coventry Village Apartments - 819 2,328 3,242 819 5,570 6,389 1,472 4,917 1998 Curren Terrace 14,537 1,989 10,957 7,333 1,989 18,290 20,279 5,118 15,161 1997 Cypress Place 5,991 2,335 7,861 3,785 2,335 11,646 13,981 2,243 11,738 2000 Devonshire Hills 44,257 15,099 32,934 7,315 15,099 40,249 55,348 5,761 49,587 2001 East Hill Gardens - 249 1,560 1,283 249 2,843 3,092 716 2,376 1998 East Meadow Apartments 7,140 2,315 10,803 1,780 2,315 12,583 14,898 2,078 12,820 2000 East Winds Apartments 6,523 989 5,079 2,919 989 7,998 8,987 1,503 7,484 2000 Elmwood Terrace 21,050 6,161 14,680 7,790 6,161 22,470 28,631 3,995 24,636 2000 Executive House Apartments 3,903 628 3,420 3,040 628 6,460 7,088 1,845 5,243 1997 Falcon Crest Townhomes 18,279 2,891 11,116 8,669 2,891 19,785 22,676 4,148 18,528 1999 Falkland Chase Apartments 38,909 9,251 49,705 5,562 9,251 55,267 64,518 4,635 59,883 2003 Fenland Field 11,874 3,604 11,050 4,976 3,604 16,026 19,630 2,405 17,225 2001 Gardencrest Apartments - 25,071 61,525 18,695 25,071 80,220 105,291 10,006 95,285 2002 Gateway Village Apartments 6,872 1,373 6,621 2,341 1,373 8,962 10,335 1,752 8,583 1999 Glen Brook Apartments - 1,447 4,816 2,870 1,447 7,686 9,133 1,638 7,495 1999 Glen Manor Apartments 5,796 1,076 4,564 2,537 1,076 7,101 8,177 1,813 6,364 1997 Golf Club Apartments 15,363 4,127 21,236 12,426 4,127 33,662 37,789 6,881 30,908 2000 Hackensack Gardens 9,286 2,417 10,916 2,647 2,417 13,563 15,980 678 15,302 2005 Hawthorne Court 37,197 9,147 23,447 16,368 9,147 39,815 48,962 5,520 43,442 2002

F-40
Initial Cost Costs Total Cost Total Cost, Buildings, Capitalized Buildings, Net of Encum- Improvements Subsequent to Improvements Accumulated Accumulated Year of
Community brances Land & Equipment Acquisition Land & Equipment Total(a) Depreciation Depreciation Acquisition
Heritage Square 6,285 2,046 4,805 2,321 2,046 7,126 9,172 917 8,255 2002 Heritage Woods Apartments 5,138 1,640 12,455 32 1,640 12,487 14,127 81 14,046 2006 Highland House 6,543 3,414 14,761 82 3,414 14,843 18,257 257 18,000 2006 Hill Brook Place Apartments 11,185 2,253 9,118 5,552 2,253 14,670 16,923 2,880 14,043 1999 Holiday Square 3,387 3,635 6,109 1,894 3,635 8,003 11,638 949 10,689 2002 Home Properties of Bryn Mawr 14,939 3,275 17,907 10,309 3,275 28,216 31,491 5,633 25,858 2000 Home Properties of Devon 28,892 6,524 35,545 22,682 6,524 58,227 64,751 11,333 53,418 2000 Home Properties of Newark 16,261 2,694 12,713 13,048 2,694 25,761 28,455 5,858 22,597 1999 Lake Grove Apartments 37,057 7,555 11,952 14,631 7,555 26,583 34,138 7,854 26,284 1997 Lakeshore Villa Apartments 4,915 615 3,849 4,886 615 8,735 9,350 2,579 6,771 1996 Lakeview Apartments 8,639 679 4,552 3,193 679 7,745 8,424 2,011 6,413 1998 Liberty Commons - 1,344 - 13,394 1,344 13,394 14,738 590 14,148 2005 Liberty Place Apartments 6,467 2,033 13,125 76 2,033 13,201 15,234 199 15,035 2006 Maple Tree - 866 4,445 2,368 866 6,813 7,679 1,260 6,419 2000 Mid-Island Apartments 19,913 4,256 6,567 5,853 4,256 12,420 16,676 3,702 12,974 1997 Mill Company Gardens 2,592 406 1,671 1,306 406 2,977 3,383 785 2,598 1982 Mill Towne Village 24,239 3,958 13,747 10,495 3,958 24,242 28,200 3,948 24,252 2001 Morningside Heights Apartments 17,019 6,450 28,699 25,518 6,450 54,217 60,667 14,229 46,438 1998 Mount Vernon Square Apartments 89,724 56,300 86,923 43 56,300 86,966 143,266 207 143,059 2006 New Orleans Park Apartments 19,169 3,008 13,215 9,574 3,008 22,789 25,797 5,877 19,920 1997 Northwood Apartments 10,675 858 14,286 1,282 858 15,568 16,426 1,164 15,262 2004 Oak Manor Apartments 6,932 668 4,111 2,963 668 7,074 7,742 1,868 5,874 1998 Orleans Village 65,993 8,822 58,912 18,625 8,822 77,537 86,359 13,709 72,650 2000 Owings Run Consolidation 43,081 5,722 32,622 5,483 5,722 38,105 43,827 7,334 36,493 1999 Park Shirlington Apartments 18,537 4,524 10,180 8,405 4,524 18,585 23,109 5,232 17,877 1998 Patricia Apartments 5,213 637 4,196 3,055 637 7,251 7,888 1,822 6,066 1998 Peppertree Farm Apartments 80,500 12,843 83,751 5,150 12,843 88,901 101,744 2,505 99,239 2005 Pleasant View Gardens 51,824 6,067 47,816 23,321 6,067 71,137 77,204 17,507 59,697 1998 Pleasure Bay Apartments 15,019 1,711 6,234 7,681 1,711 13,915 15,626 3,115 12,511 1998 Racquet Club East Apartments 31,690 2,035 23,107 8,101 2,035 31,208 33,243 7,272 25,971 1998 Racquet Club South 2,786 335 3,891 2,172 335 6,063 6,398 1,498 4,900 1999 Redbank Village Apartments 15,925 2,126 14,030 9,465 2,126 23,495 25,621 5,600 20,021 1998 Regency Club Apartments 26,126 2,761 34,825 3,581 2,761 38,406 41,167 2,356 38,811 2004 Rider Terrace - 248 1,270 607 248 1,877 2,125 330 1,795 2000 Ridgeview at Wakefield Valley - 2,360 17,107 2,906 2,360 20,013 22,373 1,080 21,293 2005 Ridley Brook Apartments 9,661 2,006 7,719 3,537 2,006 11,256 13,262 2,446 10,816 1999 Royal Gardens Apartment 31,774 5,690 14,067 14,952 5,690 29,019 34,709 8,554 26,155 1997 Sayville Commons 42,735 8,163 55,379 1,537 8,163 56,916 65,079 2,158 62,921 2005 Selford Townhomes 3,960 1,266 4,200 2,636 1,266 6,836 8,102 1,465 6,637 1999 Seminary Hill Apartments 9,900 3,059 10,194 8,979 3,059 19,173 22,232 3,817 18,415 1999 Seminary Towers Apartments 27,715 5,695 19,348 16,879 5,695 36,227 41,922 7,148 34,774 1999 Shakespeare Park Apartments 2,275 514 3,433 1,026 514 4,459 4,973 840 4,133 1999 Sherry Lake Apartments 19,450 2,548 15,618 9,496 2,548 25,114 27,662 5,642 22,020 1998 Sherwood Consolidation 7,324 3,330 10,735 5,063 3,330 15,798 19,128 1,825 17,303 2002 South Bay Manor 8,000 1,133 1,958 4,567 1,133 6,525 7,658 1,218 6,440 2000

F-41
Initial Cost Costs Total Cost Total Cost, Buildings, Capitalized Buildings, Net of Encum- Improvements Subsequent to Improvements Accumulated Accumulated Year of
Community brances Land & Equipment Acquisition Land & Equipment Total(a) Depreciation Depreciation Acquisition
Southern Meadows 18,691 9,317 31,874 8,131 9,317 40,005 49,322 5,796 43,526 2001 Stone Ends Apartments 22,812 5,729 28,428 2,851 5,729 31,279 37,008 3,163 33,845 2003 Stratford Greens Associates 33,078 12,764 33,779 7,783 12,764 41,562 54,326 5,133 49,193 2002 Sunset Gardens Apartments 8,561 753 4,663 4,959 753 9,622 10,375 2,814 7,561 1996 Tamarron Apartments 5,200 1,387 8,474 2,190 1,387 10,664 12,051 2,054 9,997 1999 Terry Apartments - 668 3,439 1,142 668 4,581 5,249 774 4,475 2000 The Apts at Wellington Trace 25,603 3,188 23,904 3,664 3,188 27,568 30,756 1,938 28,818 2004 The Brooke at Peachtree - 1,033 15,145 1,113 1,033 16,258 17,291 602 16,689 2005 The Colony - 7,967 34,121 11,851 7,967 45,972 53,939 9,334 44,605 1999 The Coves at Chesapeake - 8,915 57,953 21 8,915 57,974 66,889 248 66,641 2006 The Hamptons 54,201 5,984 50,647 6,997 5,984 57,644 63,628 3,706 59,922 2004 The Heights at Marlborough 23,523 6,253 44,264 87 6,253 44,351 50,604 380 50,224 2006 The Landings 12,488 2,579 16,753 8,978 2,579 25,731 28,310 7,035 21,275 1996 The Manor Apartments (MD) 24,448 8,900 27,703 9,656 8,900 37,359 46,259 5,353 40,906 2001 The Manor Apartments (VA) 5,600 1,450 5,738 4,465 1,450 10,203 11,653 2,582 9,071 1999 The Meadows at Marlborough 21,553 6,598 28,736 118 6,598 28,854 35,452 250 35,202 2006 The New Colonies 20,353 1,788 21,350 10,934 1,788 32,284 34,072 8,999 25,073 1998 The Sycamores - 4,729 15,725 2,623 4,729 18,348 23,077 1,995 21,082 2002 The Village at Marshfield 24,076 3,263 28,351 2,400 3,263 30,751 34,014 2,241 31,773 2004 Timbercroft Consolidation 5,875 1,774 6,826 4,258 1,774 11,084 12,858 2,130 10,728 1999 Top Field 6,352 1,635 16,684 29 1,635 16,713 18,348 108 18,240 2006 Trexler Park Apartments 10,140 2,574 13,802 6,286 2,574 20,088 22,662 3,895 18,767 2000 Trexler Park West Phase - 2,669 9,373 2,669 9,373 12,042 198 11,844 2006 Valley View Apartments 5,231 1,090 4,960 4,484 1,090 9,444 10,534 2,726 7,808 1997 Village Square 4,651 799 13,306 (6,072) 799 7,234 8,033 2,151 5,882 1997 Village Square Apartments 20,699 2,732 3,582 17,967 2,732 21,549 24,281 4,038 20,243 1999 Vinings at Hampton Village - 1,830 12,214 1,799 1,830 14,013 15,843 924 14,919 2004 Virginia Village 8,771 5,322 21,918 8,618 5,322 30,536 35,858 4,983 30,875 2001 Wayne Village - 2,057 12,895 7,305 2,057 20,200 22,257 5,085 17,172 1998 West Springfield Terrace 23,004 2,589 31,758 3,593 2,589 35,351 37,940 3,795 34,145 2002 Westwood Village Apts 33,520 7,471 22,757 10,235 7,471 32,992 40,463 4,449 36,014 2002 William Henry Apartments 22,548 4,804 22,220 10,090 4,804 32,310 37,114 6,071 31,043 2000 Windsor Realty Company 4,650 427 3,300 1,993 427 5,293 5,720 1,367 4,353 1998 Woodholme Manor Apartments 3,697 1,278 4,599 4,386 1,278 8,985 10,263 1,532 8,731 2001 Woodleaf Apartments - 2,955 17,716 2,143 2,955 19,859 22,814 1,466 21,348 2004 Woodmont Village Apartments - 2,930 5,699 2,551 2,930 8,250 11,180 1,083 10,097 2002 Yorkshire Village Apartments 1,443 1,221 2,016 1,040 1,221 3,056 4,277 405 3,872 2002 Other Assets 6,098 303 5,915 21,977 303 27,892 28,195 12,899 15,296 Various Limited Partnerships 16,763 1,203 9,963 18,204 1,203 28,167 29,370 9,502 19,868 1995 $ 1,924,313 $ 493,017 $2,174,366 $ 784,379 $ 493,017 $ 2,958,745 $ 3,451,762 $ 450,129 $ 3,001,633
(a) The aggregate cost for Federal Income Tax purposes was approximately $2,868,000.

F-42
SCHEDULE III
HOME PROPERTIES, INC.
REAL ESTATE AND ACCUMULATED DEPRECIATION DECEMBER 31, 2006
(IN THOUSANDS) Depreciation and amortization of the Company's investments in buildings and improvements reflected in the consolidated statements of operations are calculated over the estimated useful lives of the assets as follows: Land improvements 3-20 years Buildings and improvements 3-40 years Furniture, fixtures and equipment 5-10 years Computer software 5 years The changes in total real estate assets are as follows: 2006 2005(a) 2004 Balance, beginning of year $3,385,143 $3,123,901 $2,752,992 New property acquisition 368,301 283,363 256,208 Additions 101,723 100,013 102,700 Increase in real estate associated with the conversion of UPREIT Units 124,292 5,220 11,864 Assets held for sale associated with consolidated affordable limited partnerships - - 78,711 Disposals of assets held for sale associated with consolidated affordable limited partnerships - (50,627) - Disposals, retirements and impairments (527,697) (76,727) (78,574)Balance, end of year $3,451,762 $3,385,143 $3,123,901
The changes in accumulated depreciation are as follows: 2006 2005(a) 2004 Balance, beginning of year $ 500,592 $ 405,919 $ 330,062 Properties previously held for sale, changed to held and used - 6,999 - Depreciation for the year 99,694 99,322 90,787 Disposals and retirements (150,157) (11,648) (14,930)Balance, end of year $ 450,129 $ 500,592 $ 405,919 (a) $54,433 of accumulated depreciation was included in assets held for sale as of December 31, 2005.

This page intentionally left blank.
Exhibit 31.1
CERTIFICATION OF CHIEF EXECUTIVE OFFICER PURSUANT TO RULE 13a-14 PROMULGATED BY THE SECURITIES AND EXCHANGE COMMISSION
(Pursuant to Section 302 of the Sarbanes-Oxley Act of 2002)
I, Edward J Pettinella, certify that:
1. I have reviewed this annual report on Form 10-K of Home Properties, Inc.;
2. Based on my knowledge, this report does not contain any untrue statement of a material fact or omit to state a material fact necessary to make the statements made, in light of the circumstances under which such statements were made, not misleading with respect to the period covered by this report;
3. Based on my knowledge, the financial statements, and other financial information included in this report, fairly present in all material respects the financial condition, results of operations and cash flows of the registrant as of, and for, the periods presented in this report;
4. The registrant's other certifying officer and I are responsible for establishing and maintaining disclosure controls and procedures (as defined in Exchange Act Rules 13a-15(e) and 15d-15(e)) and internal control over financial reporting (as defined in Exchange Act Rules 13a-15(f) and 15d-15(f) for the registrant and have:
(a) designed such disclosure controls and procedures, or caused such disclosure controls and procedures to be designed under our supervision, to ensure that material information relating to the registrant, including its consolidated subsidiaries, is made known to us by others within those entities, particularly during the period in which this report is being prepared;
(b) designed such internal control over financial reporting, or caused such internal control over financial reporting to be designed under our supervision, to provide reasonable assurance regarding the reliability of financial reporting and the preparation of financial statements for external purposes in accordance with generally accepted accounting principles;
(c) evaluated the effectiveness of the registrant's disclosure controls and procedures and presented in this report our conclusions about the effectiveness of the disclosure controls and procedures, as of the end of the period covered by this report based on such evaluation; and
(d) disclosed in this report any change in the registrant’s internal control over financial reporting that occurred during the registrant’s most recent fiscal quarter (the registrant’s fourth fiscal quarter in the case of an annual report) that has materially affected, or is reasonably likely to materially affect, the registrant’s internal control over financial reporting; and
5. The registrant's other certifying officers and I have disclosed, based on our most recent evaluation of internal control over financial reporting, to the registrant's auditors and the audit committee of registrant's board of directors (or persons performing the equivalent functions):
(a) all significant deficiencies and material weaknesses in the design or operation of internal control over financial reporting which are reasonably likely to adversely affect the registrant’s ability to record, process, summarize and report financial information; and
(b) any fraud, whether or not material, that involves management or other employees who have a significant role in the registrant's internal control over financial reporting.
/s/ Edward J. Pettinella Edward J. Pettinella President and Chief Executive Officer February 28, 2007

Exhibit 31.2
CERTIFICATION OF CHIEF FINANCIAL OFFICER PURSUANT TO RULE 13a-14 PROMULGATED BY THE SECURITIES AND EXCHANGE COMMISSION
(Pursuant to Section 302 of the Sarbanes-Oxley Act of 2002)
I, David P. Gardner, certify that:
1. I have reviewed this annual report on Form 10-K of Home Properties, Inc.;
2. Based on my knowledge, this report does not contain any untrue statement of a material fact or omit to state a material fact necessary to make the statements made, in light of the circumstances under which such statements were made, not misleading with respect to the period covered by this report;
3. Based on my knowledge, the financial statements, and other financial information included in this report, fairly present in all material respects the financial condition, results of operations and cash flows of the registrant as of, and for, the periods presented in this report;
4. The registrant's other certifying officer and I are responsible for establishing and maintaining disclosure controls and procedures (as defined in Exchange Act Rules 13a-15(e) and 15d-15(e)) and internal control over financial reporting (as defined in Exchange Act Rules 13a-15(f) and 15d-15(f) for the registrant and have:
(a) designed such disclosure controls and procedures, or caused such disclosure controls and procedures to be designed under our supervision, to ensure that material information relating to the registrant, including its consolidated subsidiaries, is made known to us by others within those entities, particularly during the period in which this report is being prepared;
(b) designed such internal control over financial reporting, or caused such internal control over financial reporting to be designed under our supervision, to provide reasonable assurance regarding the reliability of financial reporting and the preparation of financial statements for external purposes in accordance with generally accepted accounting principles;
(c) evaluated the effectiveness of the registrant's disclosure controls and procedures and presented in this report our conclusions about the effectiveness of the disclosure controls and procedures, as of the end of the period covered by this report based on such evaluation; and
(d) disclosed in this report any change in the registrant’s internal control over financial reporting that occurred during the registrant’s most recent fiscal quarter (the registrant’s fourth fiscal quarter in the case of an annual report) that has materially affected, or is reasonably likely to materially affect, the registrant’s internal control over financial reporting; and
5. The registrant's other certifying officers and I have disclosed, based on our most recent evaluation of internal control over financial reporting, to the registrant's auditors and the audit committee of registrant's board of directors (or persons performing the equivalent functions):
(a) all significant deficiencies and material weaknesses in the design or operation of internal control over financial reporting which are reasonably likely to adversely affect the registrant’s ability to record, process, summarize and report financial information; and
(b) any fraud, whether or not material, that involves management or other employees who have a significant role in the registrant's internal control over financial reporting.
/s/ David P. Gardner David P. Gardner Executive Vice President and Chief Financial Officer February 28, 2007

Nelson B. LeenhoutsCo-Chair of the Board
Norman LeenhoutsCo-Chair of the Board
Edward J. PettinellaPresident and Chief Executive Officer, Home Properties, Inc.
William Balderston, IIIRetired Executive Vice President,Chase Manhattan Bank
Josh E. FidlerGeneral Partner, Boulder Ventures, Ltd.
Alan L. GosulePartner, Clifford Chance US LLP
Leonard F. HelbigDirector, Integra Realty Advisors
Roger W. KoberRetired Chairman of the Board and Chief Executive Officer,Rochester Gas & Electric
Clifford W. Smith, Jr.Professor of Finance, William E. Simon Graduate School of Business Administration of the University of Rochester
Paul L. SmithRetired Director and Chief Financial Officer, Eastman Kodak Company
Thomas S. SummerExecutive Vice President and Chief Financial Officer,Constellation Brands, Inc.
Amy L. TaitChief Executive Officer,Broadstone Real Estate
Directors
Edward J. PettinellaPresident and Chief Executive Officer
David P. GardnerExecutive Vice President and Chief Financial Officer
Ann M. McCormickExecutive Vice President,General Counsel and Secretary
Scott A. DoyleSenior Vice President, Property Management
Jodi A. FalkSenior Vice President,Chief Administrative/Information Officer
Robert J. LukenSenior Vice President, Chief Accounting Officer and Treasurer
John E. SmithSenior Vice President, Chief Investment Officer
Christopher J. BersonVice President, Information Systems
William L. BrownVice President, Construction and Engineering
Cynthia BurrellVice President, Regional Property Management
Kristen A. DucklesVice President, Internal Audit
Les EisenbergVice President,Pricing and Revenue Management
Peter FeboVice President, Regional Property Management
Donald R. HagueVice President, Development
Kenneth O. HallVice President and Controller
Kerri L. HaltomVice President,Regional Property Management
Keith E. KnightVice President, Capital Improvements and National Accounts
Gerald B. KornVice President, Mortgage Finance
Susan E. KrouthVice President, Payroll,Benefits and HRIS
Rick W. LeithVice President,Regional Property Management
Karen A. LejmanVice President, Financial Process Improvements
Paul H. O’LearyVice President,Acquisitions and Due Diligence
Kimberly M. PepeVice President, Tax
Bernard J. QuinnVice President, Property Management
John C. ScharlockVice President, Acquisitions and Dispositions
Robin L. SteinVice President, Assistant Counsel
Kathleen K. SuherVice President, Assistant Counsel and Assistant Secretary
Charis W. WarshofVice President,Investor Relations
Michele (Miki) WilsonVice President,Regional Property Management
Officers
Central OfficeHome Properties, Inc.850 Clinton SquareRochester, NY 14604-1795 585 546-4900
Transfer Agent and Dividend Disbursing AgentMellon Investor Services LLC 480 Washington BoulevardJersey City, NJ 07310-1900 888 245-0458www.melloninvestor.com/isd
To keep securities information current and ensure prompt receipt of dividends and financial information, shareholders of record should advise the transfer agent of any change in name or address.
Legal CounselNixon Peabody LLP900 Clinton SquareRochester, NY 14604-1730
Independent Registered Public Accounting FirmPricewaterhouseCoopers LLP125 High StreetBoston, MA 02110-1707
Home Properties Investor ContactsShareholder information and requests: 877 305-4111Institutional Investor/Analyst/Media Inquiries: 585 295-4237
Annual Meeting The thirteenth annual meeting of shareholders will be held May 1, 2007 at 2:30 p.m. at the Dryden Theatre, George Eastman House, Rochester, NY.
Additional Information Apartment community information, quarterly financial results and other announcements are available on our website at www.homeproperties.com and by e-mail, fax or mail. To receive company information contact Shareholder Services at 877 305-4111.
Certifications In 2006, Home Properties’ Chief Executive Officer provided to the New York Stock Exchange the Annual CEO Certification regarding the Company’s compli-ance with the New York Stock Exchange’s corporate governance listing standards. In addition, Home Properties’ CEO and CFO filed with the Securities and Exchange Commission the Certification required by Section 302 of the Sarbanes-Oxley Act of 2002 regarding the quality of the Company’s public disclosures in its 2006 annual report on Form 10-K.
Stock ListingThe shares of Home Properties trade on the New York Stock Exchange under the symbol HME.
Forward-looking Statements This annual report contains forward-looking statements which the company believes reflect expectations based on reasonable assumptions. However, it can give no assur-ance that its expectations will be achieved. Factors that may cause actual results to differ include general economic and local real estate condi tions, the weather and other condi-tions that might affect operating expenses, the timely comple-tion of repositioning and new development activities within anticipated budgets, the actual pace of future acquisitions and sales, and continued access to capital to fund growth.
Shareholder Information
Corporate Information

The Home Properties Pledge to residents is the foundation of our reputation and reinforces our commitment to
exceptional customer care. The quality and dedication of the Home Properties team of 1,200 employees enables
us to offer this unique and powerful guarantee to our residents. Our money-back guarantee assures residents that
we will perform to their satisfaction and has proven to be an effective marketing tool.
At Home Properties, resident satisfaction is our top priority. To show how much WE CARE, we pledge the following:
If we fail to live up to our Pledge to your complete satisfaction, please let us know and we will refund your rent for a day.
■ You will be treated fairly, honestly, and courteously by a team of caringprofessionals.
■ We will promptly respond to your service requests and will correct anyroutine service items within 24 hours or on the next business day.
■ We will help you feel at home in your community by providing welcomepackages to introduce you to area services and social activities to help youget acquainted with your neighbors.
■ Your apartment will be prepared to your satisfaction when you move in.
■ If you’re not satisfi ed with your new Home Properties apartment for any reason, you may cancel your lease any time during the fi rst 30 days without penalty.
■ You may transfer to another available apartment in your community, or any other Home Properties community, at any time with a new 12-month lease.A transfer fee will apply.
■ If you lose your job, experience a job transfer to a location more than30 miles from your apartment, or fi nd it necessary to move due to health reasons, you may cancel your lease by giving a 60-day written notice andsigning a release agreement. A turnover fee will apply if you have beena resident for less than one year.
850 Clinton Square, Rochester, NY 14604585-546-4900
www.homeproperties.com

H O M E D E L I V E R SHome Properties ▲ 850 Clinton Square, Rochester, NY 14604 ▲ 585 546-4900 ▲ www.homeproperties.com