home energy efficiency - extension · voluntary/mixed building codes. #1: annual electric savings...
TRANSCRIPT

Home Energy Efficiency
Cary WeinerColorado State University Extension

Class Outline
• Residential energy use overview
• Whole house approach
• Considerations for moving forward

Energy Use - Nationwide
22 quads
6.6 quads
2 billion MWh
30%
500 power plants
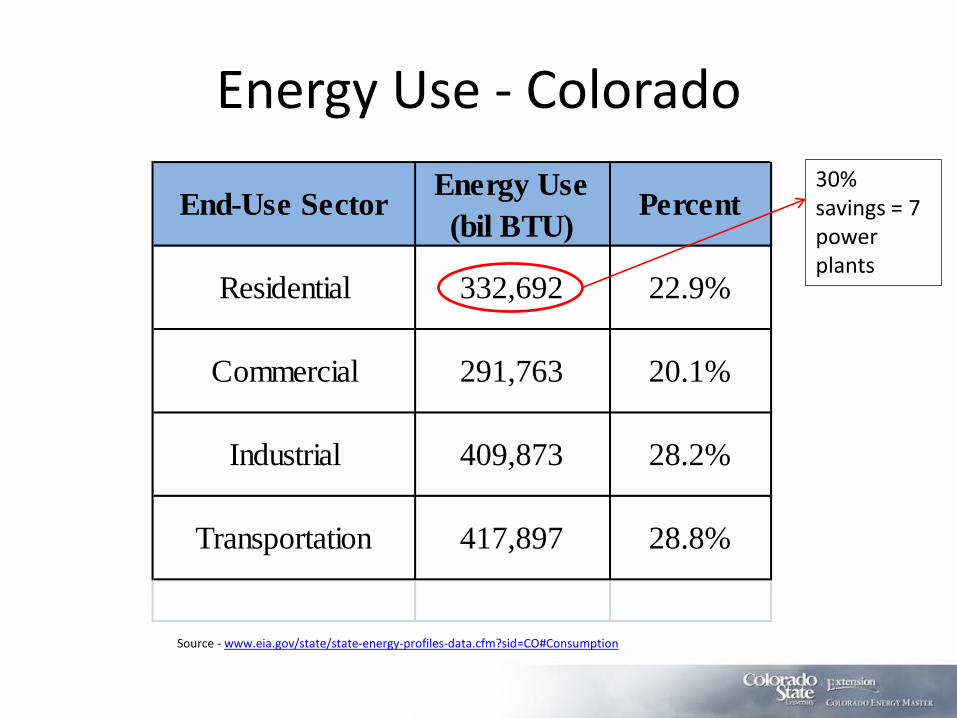
Energy Use - Colorado
End-Use Sector Energy Use (bil BTU)
Percent
Residential 332,692 22.9%
Commercial 291,763 20.1%
Industrial 409,873 28.2%
Transportation 417,897 28.8%
Source - www.eia.gov/state/state-energy-profiles-data.cfm?sid=CO#Consumption
30% savings = 7 power plants

Reinventing Fire: Vision
TOU rates?

#16: 5% electric savings and peak demand reduction from 2006 levels by 2018. Gas utilities - 0.5% of previous year revenue. Integrated Resource Planning.Voluntary/mixed building codes.
#1: Annual electric savings from 2.5% to 2.6% from 2013-2015. Gas savings - 1.1% of retail sales annually. DECOUPLING for all utilities. 2012 IECC and voluntary stretch codes.
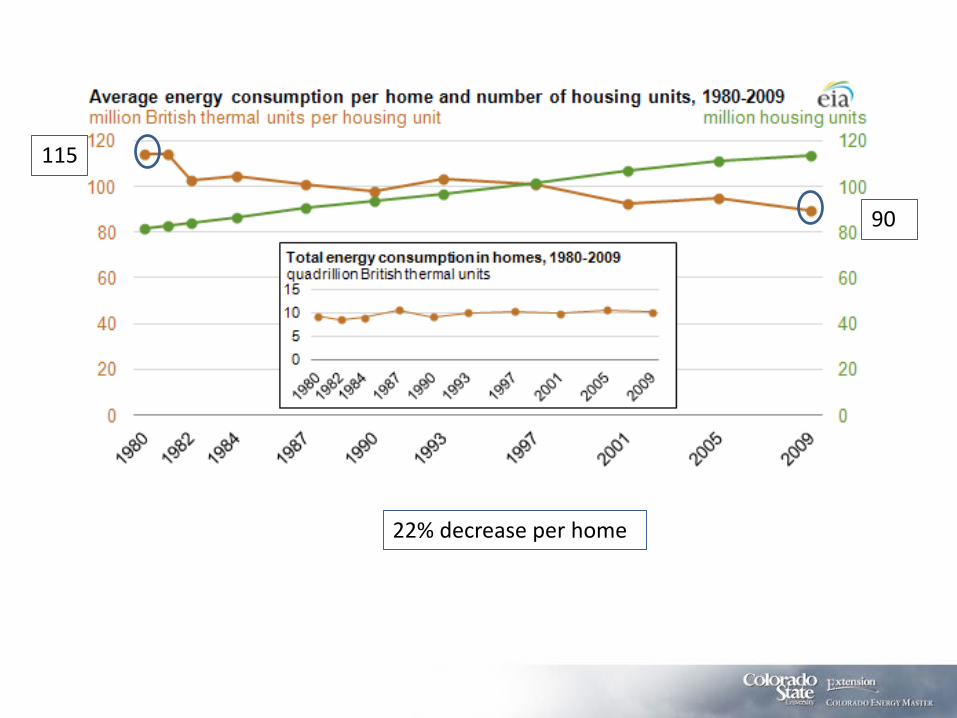
115
90
22% decrease per home


0
2
4
6
8
10
12
14
1619
6719
6919
7119
7319
7519
7719
7919
8119
8319
8519
8719
8919
9119
9319
9519
9719
9920
0120
0320
0520
0720
0920
1120
13
Price of Natural Gas Delivered to Residential Customers ($/mcf)
Colorado U.S.

2001: $.0747
2014: $.12182011:
$.1104
4.9% avg. annual 3.4% avg. annual


Heating Fuel Comparison
Electricity 3,412 BTU per kWh $ 0.12 per kWh $ 35.17 per MMBTU
Natural Gas 1,000,000 BTU per Mcf $ 7.82 per Mcf $ 7.82 per MMBTU
Propane 91,500 BTU per gallon $ 2.50 per gallon $ 27.32 per MMBTU
Wood 22,000,000 BTU per cord $ 200.00 per cord $ 9.09 per MMBTU
Pellets 16,200,000 BTU per ton $ 250.00 per ton $ 15.43 per MMBTU

Read Your Bills

Determining a Baseload
Base load
1000
900
800
600
550
750
950
850
650 600
800
1100
0
200
400
600
800
1000
1200
J F M A M J J A S O N D
Baseload
580

Energy Audits

Whole House Approach
REDUCE ENERGY
DEMAND
• Behavior changes• Air sealing• Insulation• Landscaping and windows
Use energy efficiently
• Heating and cooling equipment• Transport• Lighting and appliances
Use clean sources
• Solar• Wind

The 7 Habits of Highly Efficient Homeowners
1.
7.
6.
5.
4.
2.
3.

What Affects Behavior?
Reiss & White 2008

What Affects Behavior II?
Schultz & Cialdini (OPOWER Scientists)Hewlett Foundation San Marcos Study
$$$
Turn off AC &Turn on Fan
Environment
Turn off AC &Turn on Fan
Citizenship
Turn off AC &Turn on Fan
Zero Impact on Consumption
Neighbors
Turn off AC &Turn on Fan
6% Drop inConsumption
Slide courtesy Jeff LyngComfort? “Home performance”?

Lutz et. al:47% in program mode
Bouchelle et. al:Habits more important than technology

Smart Homes
GE Z-WaveNexia
VIDEO: http://insynctive.pella.com/motorized-blinds

Comfort and the Building Shell
Solar heat Air Leakage
Internal Heat
Trans-mission
Heat Removed by Cooling System
Ceiling Transmission
Wall and Fenestration Transmission
Air Leakage
Heat Supplied by Heating System Internal and Solar Heat
Source: Residential Energy, 5th Edition

Variations in Load
0
10
20
30
40
50
60
Cold climatehomes with
major airleakage orinsulationproblems
Average coldclimate homes
Averagetemperate
climate homes
Well insulatedhomes with
low airleakage
Very wellinsulated andairtight homes
with heat-recovery
ventilators
BTUs per Hour per Square Foot
0
200
400
600
800
1000
1200
1400
Homes with effectiveair barriers, high R-values, good sun-
blocking, well installedA/C
Average homes Poorly insulated, leaky,sun-blasted somes with
poorly installed A/C
Square Feet Cooled per Ton
Source: Residential Energy, 5th Edition

Air Leaks: Diagnosis
Source: www.energysavers.gov http://www.infraredimagingservices.com/residential-energyscan

Stack Effect
Source: National Park Service

Air Leaks - Other
Source: www.bbc.co.uk
Source: www.greenhomelogic.com

Too Tight?
• .35 air changes/hour
• Moisture, VOCs, CO, Particulates
• Spot ventilation

Insulation
•Density•Installation•DIY?•Air sealer?•Cost
Environmental Building News
3.2
4-8
2.5
4-8
3.2

Greenwashing?
Environmental Building News

Recommended R-Values for Colorado
Source: Colorado Governor’s Energy Office
Space Recommended R-Value
Attic 49
Wall 18
Floor 25
Crawlspace 19
Basement 11

Which is better?
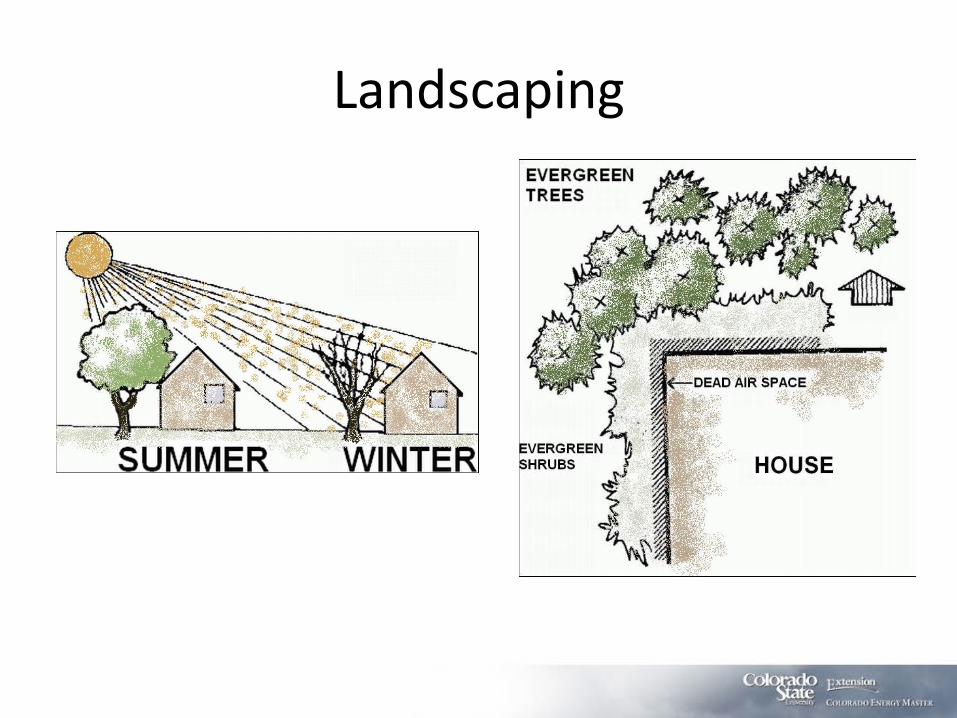
Landscaping

US DOE Chicago study:
• 13-20% reduction in heating load
• 5-10 year simple payback
Existing Windows – Adding Storms

Treatment Heat Gain/Loss Potential Other Comments
awnings 65-77% gain reduction
no heat loss potential
interior blinds 45% if highly reflective
draperiesheat loss by 25% if sealed and heat
gain by 33%
highly variable based on fabric
and color
shades variable
some shades can insulate and control air infiltration
shutters variable
reduce heat gain/loss and offer storm protection
(exterior)
Existing Windows – Adding Treatments
Source: US DOE

• U-factorrate of heat loss through an assembly
• Solar Heat Gain Coefficientsolar radiation admitted through a window
• Visible Transmittancethe higher the number the more light let in
New Windows?
http://www.alpenhpp.com

Window Basics II
Frames Glazing
Glazing Feature Performance Characteristics
Gas fills Enhance thermal resistance
Tints Reduce SHGC, VT
Insulated Reduce U-factor, SHGC
Low-E Coating
Reduce U-factor; significant cost and energy
savings potential; can reduce VT
Frame Type Thermal Resistance Other Comments
Aluminum/Metal Poor Strong and low maintenance
Composite Good
Better moisture/decay resistance than
conventional wood
Fiberglass Good-Excellent
Can fill cavities with insulation for
excellent thermal resistance
Vinyl Good - Excellent
Vulnerable to warping/cracking at
extreme temperatures; color
fading
Wood Good Maintenance intensive
Source: US DOE

BREAK

Whole House Approach
Reduce energy demand
• Behavior changes• Air sealing• Insulation• Landscaping and windows
USE ENERGY EFFICIENTLY
• Heating and cooling equipment• Transport• Lighting and appliances
Use clean sources
• Solar• Geothermal• Wind


Furnaces and BoilersTable 1. Annual Estimated Savings for Every $100 of Fuel Costs by Increasing Your
Heating Equipment Efficiency*
Existing System AFUE
New/Upgraded System AFUE
55% 60% 65% 70% 75% 80% 85% 90% 95%
50% $9.09 $16.76 $23.07 $28.57 $33.33 $37.50 $41.24 $44.24 $47.36
55% ---- $8.33 $15.38 $21.42 $26.66 $31.20 $35.29 $38.88 $42.10
60% ---- ---- $7.69 $14.28 $20.00 $25.00 $29.41 $33.33 $37.80
65% ---- ---- ---- $7.14 $13.33 $18.75 $23.52 $27.77 $31.57
70% ---- ---- ---- ---- $6.66 $12.50 $17.64 $22.22 $26.32
75% ---- ---- ---- ---- ---- $6.50 $11.76 $16.66 $21.10
80% ---- ---- ---- ---- ---- ---- $5.88 $11.11 $15.80
85% ---- ---- ---- ---- ---- ---- ---- $5.55 $10.50
90% ---- ---- ---- ---- ---- ---- ---- ---- $5.30
*Assuming the same heat output
Source: US DOE
70% = $11.17

Sizing and Efficiency• Square footage• Climate• Heat loss and gain• Occupant comfort
Manual J from ACContractors of America
Concepts• U*A*∆T = Transmissive load
• 0.018*F*∆T = Exchange load
• TL + EL = Output rating
• Output/Efficiency = Input

No Air Sealing/Insulation, Low
Efficiency
Air Sealed & Insulated, Low Efficiency
Air Sealed & Insulated, High Efficiency
Furnace size 60,000 BTU 50,000 BTU 40,000 BTU
AFUE 82% 82% 95%
Installed furnace cost $1,500 $1,300 $2,200Insulation and air sealing
cost $0 $1,000 $1,000
Utility rebates $0 $150 $300
Net cost $1,500 $2,150 $2,900
Incremental cost - $650 $1,400
Therms per year 1,112 623 538
Annual operating cost $890 $499 $430
Annual savings - $391 $459
Payback period (years) - 1.7 3.0
ROI 60.2% 32.8%
Lifetime operating cost $17,795 $9,975 $8,610
Lifetime savings - $7,820 $9,185
Payback Time
Plus motor electrical savings…
Divided by

Name that heating system!Which is most efficient?Which is least expensive to operate?

Heating Fuel Comparison
Cost per Unit Fuel Price per MMBTU Efficiency
Cost per Delivered MMBTU
Natural Gas 1,000,000 BTU per Mcf $7.82 $7.82 90% $8.69
GSHP 3,412 BTU per kWh $0.12 $35.17 300% $11.72
Wood 22,000,000 BTU per cord $200 $9.09 72% $12.63
Pellets 16,200,000 BTU per ton $250 $15.43 78% $19.78
Propane 91,500 BTU per gallon $2.50 $27.32 90% $30.36
Electric Furnace 3,412 BTU per kWh $0.12 $35.17 98% $35.89
70% = $11.17
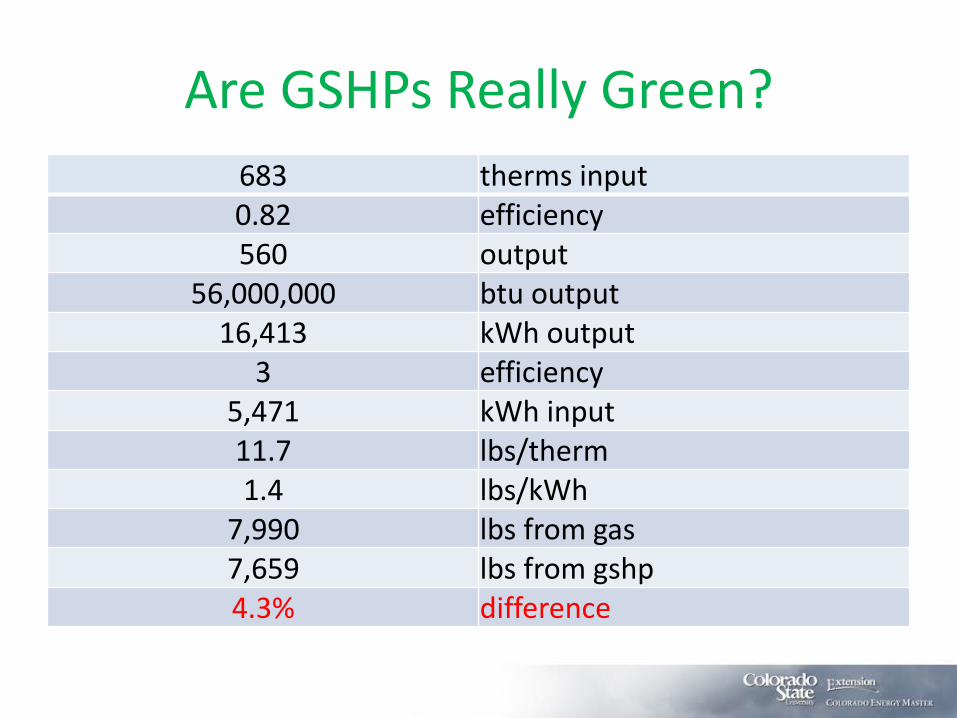
683 therms input0.82 efficiency560 output
56,000,000 btu output16,413 kWh output
3 efficiency5,471 kWh input11.7 lbs/therm1.4 lbs/kWh
7,990 lbs from gas7,659 lbs from gshp4.3% difference
Are GSHPs Really Green?

Retrofitting Wood Stoves
http://firecatcombustors.blogspot.com/2010/03/where-is-catalytic-combustor-in-my.html

Population growth + capacity

Cooling Systems

Swamp Cooler Performance
Source: California Energy Commission

Domestic Hot Water: which one is different?

Vs.

Transport – Ducts and Pipes
Insulate room as well?
Lighting

Lighting Costs and Bennys
Bulb Lumens WattsLumens
per watt
Initial cost
kWh per year
Cost per year
Lifetime (years)
# of bulbs
needed over
LED life
Cost of bulbs
over LED life
kWh over
LED life
Cost of kWh
over LED life
Total costs
over LED life
Incan. 630 60 10.5 $1.50 66 $7.23 1 23 $34.50 1,511 $166.22 $200.72
Hal. 750 43 17.4 $1.25 47 $5.18 1 23 $28.75 1,083 $119.13 $147.88
CFL 900 13 69.2 $2.00 14 $1.57 11 2 $4.00 327 $36.01 $40.01
LED 815 11 74.1 $7.00 12 $1.32 23 1 $7.00 277 $30.47 $37.47
Assumes 3 hours/day and $0.11/kWh

CFL vs. LED
CFL LED

The Myth of Mercury22.68 grams per Gwh*
0.02268 milligrams per kWh
77watts saved from 100 watt incandescent to
23 watt CFL4 hours/day
365 days/year112 kWh/year
2.5 milligrams saved per CFL per year5 milligrams in average CFL
2.0 mercury "payback" period(2,920 hours)
From: Focus on Energy Public Benefits Evaluation Estimating Seasonal and Peak Environmental Emissions Factors—Final Report May 21, 2004


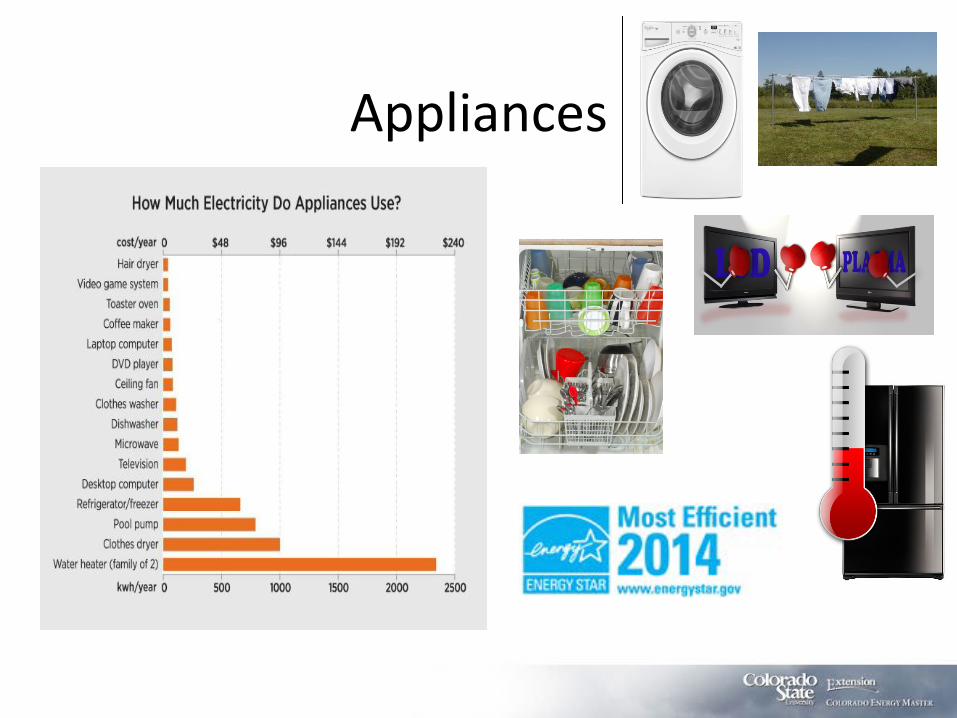
Appliances

Book readin’, meat lovin’, front loaders

Phantom Loss

Radon Fans
• Typical radon fan = 60 watts vs. high efficiency fan = 20 watts
• Need 4” pipe• $130• Payback period at
$0.10/kWh?


Colorado Energy Savings MortgageHERS Index Rating 50-40 $2,000 benefit (State Max
$1,500)
HERS Index Rating 39-25 $3,000 benefit (State Max $2,000)
HERS Index Rating 24-11 $4,000 benefit (State Max $3,000)
HERS Index Rating 10 and below
$8,000 benefit (State Max $6,000)
HERS Index Rating Improvement of 10 to 20 points** $2,000 benefit (State Max: $1,500)
HERS Index Rating Improvement of 21-35** $3,000 benefit (State Max: $2,500)
HERS Index Rating Improvement of 36-50** $4,000 benefit (State Max: $3,500)
HERS Index Rating Improvement of 51-65** $5,000 benefit (State Max: $4,000)
HERS Index Rating Improvement of 66 or greater** $6,000 benefit (State Max: $5,000)
New homes
Existing homes

Green MLS

Green Features Addendum

Mixed Results• 2009 study in WA (Griffin et. al):
– Value Increased When Descriptions for Sustainable/Green Features Are Added to an MLS Listing
– Referencing Third Party Verification in the MLS is Important– Consumers are Willing to Pay More for Environmentally
Friendly / Cost Saving Homes
• Appraisers need comparables• Only 1/3 of eligible green features entered properly
into CO MLS• Green MLS fields optional in CO
David W. Scott, Colorado Landmark, Realtors
69

Closing Thoughts
• Challenges –– low energy prices– peer chicken and egg– where to start?– impact?
• Opportunities –– audit/HERS a reference doc/score– some sexy techs– financing, rebates, and adding value– low-hanging fruit and the conservation identity

What’s Right for You?
DER Low hanging fruit