home care re-ablement services: investigating the longer-term
TRANSCRIPT

Home Care Re-ablement Services:
Investigating the longer-term impacts (prospective
longitudinal study)
Caroline Glendinning, Karen Jones, Kate Baxter,
Parvaneh Rabiee, Lesley A. Curtis, Alison Wilde, Hilary Arksey,
Julien E. Forder
November 2010
Working Paper No.
DHR 2438

© Social Policy Research Unit, University of York 2010 All rights reserved. Reproduction of this report by photocopying or electronic means for non-commercial purposes is permitted. Otherwise, no part of this report may be reproduced, adapted, stored in a retrieval system or transmitted by any means, electronic, mechanical, photocopying, or otherwise without prior written permission of the Social Policy Research Unit, University of York. ISBN 978-1-907265-08-2 A CIP catalogue record for this report is available from the British Library. Further copies of this report or any other Social Policy Research Unit publication can be freely obtained by visiting our website: www.york.ac.uk/spru Paper copies can be obtained from: The Publications Office Social Policy Research Unit University of York Heslington York YO10 5DD

Contents
Page
List of figures and tables ........................................................................................... i
Acknowledgements ................................................................................................... v
Executive summary ................................................................................................. vii
Background ....................................................................................... viii
The impact of re-ablement on quality of life and social care
outcomes .................................................................................. ix
The costs of re-ablement services ....................................................... ix
The impact of re-ablement on the use and costs of social care and
health services ........................................................................... x
The cost-effectiveness of home care re-ablement ................................ x
The organisation and content of home care re-ablement services ...... xi
User and carer perspectives on re-ablement services ....................... xii
Recommendations for policy and practice ......................................... xiii
Study design and methods ................................................................ xiii
Chapter 1 Introduction ........................................................................................ 1
Summary .............................................................................................. 1
1.1 Background - what is home care re-ablement? ......................... 1
1.2 Policy background to the study .................................................. 2
1.3 Research background ................................................................ 5
1.4 Overarching aims of the study ................................................... 7
1.5 Structure of this report ............................................................... 8
Chapter 2 Methods............................................................................................... 9
Summary .............................................................................................. 9
2.1 Overall research design ............................................................. 9
2.2 Quantitative data collection and analysis ................................. 10
2.2.1 Individual outcome data for re-ablement and
conventional home care service users .......................... 10
2.2.2 Data on early and longer-term use of social care
services ......................................................................... 12
2.2.3 Data on early and longer-term use of NHS and other
services ......................................................................... 12
2.2.4 Unit costs of re-ablement services ................................ 13
2.2.5 Statistical analyses of outcome data ............................. 13
2.3 Qualitative data collection and analysis ................................... 14

2.3.1 Interviews with re-ablement service managers ............. 14
2.3.2 Observations of re-ablement activities .......................... 14
2.3.3 Focus group discussions with re-ablement front-line
staff ............................................................................... 14
2.3.4 Interviews with re-ablement service users .................... 15
2.3.5 Interviews with informal carers of re-ablement
service users ................................................................. 15
2.3.6 Analysis of qualitative data ............................................ 15
2.4 Research ethics and reference group ...................................... 16
Chapter 3 Characteristics of study samples ................................................... 17
Summary ............................................................................................ 17
3.1 Introduction .............................................................................. 17
3.2 Re-ablement and comparison groups ...................................... 18
3.2.1 Response rates ............................................................. 18
3.2.2 Demographics and household characteristics ............... 19
3.2.3 Level of need at baseline and 12 month follow-up ........ 20
3.2.4 Typical re-ablement support for study participants ........ 24
3.3 Service managers and front-line staff ...................................... 27
3.3.1 Interviews with managers .............................................. 27
3.3.2 Observation of re-ablement activities ............................ 27
3.3.3 Focus groups with front-line staff .................................. 27
3.4 Re-ablement service users and carers .................................... 28
Chapter 4 The organisation and content of home care re-ablement
services ............................................................................................. 31
Summary ............................................................................................ 31
4.1 Introduction .............................................................................. 31
4.2 Key features of re-ablement services in the study sites ........... 32
4.2.1 Description of services .................................................. 32
4.2.2 Re-training staff ............................................................. 32
4.2.3 Skill mix ......................................................................... 33
4.2.4 Roles and responsibilities ............................................. 33
4.2.5 Duration of intervention ................................................. 34
4.2.6 Charging policy ............................................................. 34
4.3 Day-to-day organisation of the services ................................... 34
4.3.1 Assessments and referral arrangements ...................... 34
4.3.2 Flexibility over the duration of visits ............................... 35
4.3.3 Staff rotas ...................................................................... 36
4.3.4 Case recording .............................................................. 36
4.3.5 Communication within and between the teams ............. 37
4.3.6 Discharge and onward referral arrangements ............... 38
4.4 Types of intervention ............................................................... 38

4.5 Factors perceived to enhance the success of re-ablement
services ................................................................................... 40
4.5.1 Service user characteristics .......................................... 41
4.5.2 The internal organisation and delivery of services ........ 41
4.5.3 Expectations of services ............................................... 43
4.5.4 Wider environment ........................................................ 43
4.6 Discussion and conclusions ..................................................... 44
Chapter 5 The experiences of re-ablement service users and informal
carers ................................................................................................ 47
Summary ............................................................................................ 47
5.1 Introduction .............................................................................. 48
5.2 Understandings and expectations of re-ablement ................... 48
5.3 Relationships with re-ablement workers .................................. 52
5.4 Negotiating re-ablement care and re-ablement goals .............. 54
5.5 Re-ablement activities and interventions ................................. 56
5.6 The balance between care and re-ablement ........................... 57
5.7 Factors influencing progress during re-ablement ..................... 58
5.8 The experiences of informal carers ......................................... 60
5.9 Ending re-ablement ................................................................. 61
5.10 Charging for re-ablement services ........................................... 62
5.11 Attitudes towards re-ablement, felt benefits and perceived
limitations ................................................................................. 62
5.12 Discussion and conclusions ..................................................... 63
Chapter 6 Quantitative outcomes ..................................................................... 67
Summary ............................................................................................ 67
6.1 Introduction .............................................................................. 67
6.2 Global outcome measures ....................................................... 67
6.3 Analyses of responses ............................................................. 68
6.4 The impact of re-ablement on outcomes ................................. 69
6.4.1 Perceived health ........................................................... 70
6.4.2 Perceived quality of life ................................................. 71
6.4.3 Health-related quality of life (EQ-5D) ............................ 73
6.4.4 Social care-related quality of life (ASCOT) .................... 76
6.5 Variation in outcomes .............................................................. 79
6.5.1 Health-related quality of life (EQ-5D) ............................ 80
6.5.2 Social care-related quality of life (ASCOT) .................... 82
6.6 Discussion and conclusions ..................................................... 85
Chapter 7 The unit costs of re-ablement services .......................................... 87
Summary ............................................................................................ 87
7.1 Introduction .............................................................................. 87

7.2 Costs of services ..................................................................... 87
7.2.1 Description of costs associated with the service ........... 87
7.2.2 The costs broken down ................................................. 89
7.2.3 Care staff costs ............................................................. 89
7.2.4 Overheads .................................................................... 89
7.2.5 Capital costs ................................................................. 90
7.3 Discussion and conclusions ..................................................... 90
Chapter 8 Costs and cost-effectiveness of home care re-ablement ............. 95
Summary ............................................................................................ 95
8.1 Introduction .............................................................................. 96
8.2 Method ..................................................................................... 96
8.3 Social care costs ..................................................................... 97
8.4 Health care costs ..................................................................... 99
8.5 Overall impact on costs ......................................................... 100
8.6 Predictors and sources of cost variation ................................ 102
8.6.1 Hospital cost analysis .................................................. 103
8.7 Cost-effectiveness analyses .................................................. 106
8.7.1 Calculating and visualising cost-effectiveness
ratios ........................................................................... 106
8.7.2 EQ-5D cost-effectiveness ........................................... 109
8.7.3 Sensitivity analysis ...................................................... 111
8.7.4 ASCOT cost-effectiveness .......................................... 112
8.8 Discussion and conclusions ................................................... 114
Chapter 9 Discussion and conclusions ......................................................... 117
Summary .......................................................................................... 117
9.1 Aims and design of the study ................................................. 118
9.2 Main findings of the study ...................................................... 120
9.2.1 The costs of home care re-ablement services
and other service use .................................................. 120
9.2.2 The benefits and cost-effectiveness of home
care re-ablement ......................................................... 122
9.2.3 Users‟ experiences and satisfaction with home
care re-ablement services ........................................... 123
9.2.4 The organisation and delivery of home care
re-ablement services ................................................... 124
9.3 Strengths and limitations of the study .................................... 125
9.3.1 Strengths of the study ................................................. 125
9.3.2 Limitations of the study ............................................... 127
9.4 Recommendations for policy and practice ............................. 130
References ......................................................................................................... 135

Appendix A Site selection .................................................................................. 139
Appendix B Profiles of five re-ablement services (spring 2009) ..................... 141
Site R1 ............................................................................................. 141
Site R2 ............................................................................................. 143
Site R3 ............................................................................................. 144
Site R4 ............................................................................................. 146
Site R5 ............................................................................................. 147
Appendix C Recruitment and follow-up of study participants ........................ 149
C.1 Size of study sample.............................................................. 149
C.2 T1 and T1+R interviews ......................................................... 149
C.3 Changes to original research design ..................................... 150
C.4 T2 interviews ......................................................................... 151
Appendix D Standardised outcome measures ................................................. 155
Appendix E Calculating the unit and average costs of home care
re-ablement services ...................................................................... 167
Site R1 ............................................................................................. 168
Site R2 ............................................................................................. 169
Site R3 ............................................................................................. 170
Site R4 ............................................................................................. 172
Site R5 ............................................................................................. 173
Calculating re-ablement costs for study participants ........................ 174
Appendix F Statistical analysis ......................................................................... 175
F.1 Estimating social and health care services ............................ 175
F.2 Sample sizes and missing data ............................................. 177
F.3 Missing data imputations ....................................................... 180
F.4 Death rates ............................................................................ 182
F.5 Statistical techniques ............................................................. 183
F.5.1 Univariate analysis ...................................................... 183
F.5.2 Difference-in-difference analysis ................................. 183
F.5.3 Multivariate analysis .................................................... 184
F.6 The impact of service user related variables on outcomes .... 184
Appendix G The organisation and content of re-ablement services .............. 185
G.1 Interviews with re-ablement service managers ...................... 185
G.2 Observation of visits to a sample of home care re-ablement
service users ......................................................................... 190
G.3 Focus groups with front-line re-ablement staff ....................... 192
G.4 Data analysis ......................................................................... 194
Appendix H Interviews with re-ablement service users and informal
carers .............................................................................................. 197
H.1 Interviews with re-ablement service users ............................. 197
H.2 Interviews with informal carers of re-ablement service
users ...................................................................................... 203
H.3 Data analysis ......................................................................... 210
H.4 Confidentiality ........................................................................ 210
Appendix I Supplementary outcome data ....................................................... 211
I.1 The impact of re-ablement on outcomes immediately
post-re-ablement ................................................................... 211
I.1.1 Perceived health ......................................................... 211
I.1.2 Perceived quality of life ............................................... 212
I.1.3 Health-related quality of life (EQ-5D) .......................... 213
I.1.4 Social care outcomes (ASCOT) .................................. 215
I.1.5 Ways in which participants felt re-ablement services
had helped .................................................................. 219
I.2 Factors independently associated with outcomes at
baseline and 12 month follow-up ........................................... 220
I.2.1 Perceived health ......................................................... 220
I.2.2 Perceived quality of life ............................................... 223
I.2.3 Health-related quality of life (EQ-5D) .......................... 225
1.2.4 Social care needs (ASCOT) ........................................ 227


i
List of figures and tables
Page
List of figures
Figure 2.1 Overall design of study and data sources ............................................. 11
Figure 3.1 Percentage of study participants referred on discharge from
hospital, by site ..................................................................................... 26
Figure 3.2 Percentage of study participants referred from the community,
by site ................................................................................................... 26
Figure 8.1 The cost-effectiveness plane .............................................................. 107
Figure 8.2 EQ-5D cost-effectiveness scatter plot – total costs ............................ 109
Figure 8.3 EQ-5D cost-effectiveness scatter plot – social care costs .................. 110
Figure 8.4 Cost-effectiveness acceptability curves – EQ-5D ............................... 110
Figure 8.5 ASCOT cost-effectiveness scatter plot – total costs ........................... 112
Figure 8.6 ASCOT cost-effectiveness scatter plot – social care costs ................. 113
Figure 8.7 Cost-effectiveness acceptability curves – ASCOT ............................. 113
List of tables
Table 1.1 CSSR FACS level and application.......................................................... 4
Table 3.1 Completed questionnaires at baseline, post-intervention and
follow-up, by local authority .................................................................. 18
Table 3.2 Participants who completed questionnaires with the help of other
people ................................................................................................... 19
Table 3.3 Demographic characteristics and household composition at
baseline ................................................................................................ 19
Table 3.4 Level of need at baseline and 12 month follow-up ............................... 20
Table 3.5 Direction of change in receipt of informal care within the household
from baseline to follow-up ..................................................................... 22
Table 3.6 Direction of change in receipt of informal care outside the
household from baseline to follow-up ................................................... 22
Table 3.7 Direction of change in activities of daily living from baseline to
follow-up ............................................................................................... 23
Table 3.8 Professionals involved during re-ablement ........................................... 24
Table 3.9 Reasons for referral .............................................................................. 25
Table 3.10 Study samples for the interviews, focus groups and observations ....... 28
Table 3.11 Re-ablement service users and carers by site ...................................... 28

Home care re-ablement services: Investigating the longer-term impacts
ii
Table 3.12 Main characteristics of re-ablement service users and informal
carers ................................................................................................... 29
Table 6.1 Perceived health at baseline and follow-up .......................................... 70
Table 6.2 Direction of change in perceived health from baseline to follow-up ...... 71
Table 6.3 Perceived quality of life at baseline and follow-up ................................ 72
Table 6.4 Direction of change in perceived quality of life from baseline to
follow-up ............................................................................................... 72
Table 6.5 Health-related quality of life at baseline and follow-up.......................... 74
Table 6.6 Direction of change in health-related quality of life from baseline
to follow-up ........................................................................................... 75
Table 6.7 Social care-related quality of life outcomes at baseline and
follow-up ............................................................................................... 77
Table 6.8 Direction of change in social care outcomes between baseline and
follow-up ............................................................................................... 78
Table 6.9 EQ-5D scores, by group and time ........................................................ 80
Table 6.10 EQ-5D scores estimation – difference-in-difference model .................. 81
Table 6.11 EQ-5D scores estimation – baseline difference model ......................... 82
Table 6.12 ASCOT scores, by group and time ....................................................... 83
Table 6.13 ASCOT scores estimation – difference-in-difference model ................. 84
Table 6.14 ASCOT scores estimation – baseline difference model........................ 85
Table 7.1 Costs associated with the service ........................................................ 88
Table 7.2 Costs and unit estimation ..................................................................... 89
Table 8.1 Social care service costs by intervention groups .................................. 98
Table 8.2 Health service use and costs by intervention groups............................ 99
Table 8.3 Health service use and costs by referral route ................................... 100
Table 8.4 Costs (£s), with imputed missing values ............................................. 101
Table 8.5 Total service expenditure ................................................................... 102
Table 8.6 Social care expenditure ...................................................................... 103
Table 8.7 Hospital day categorisation ................................................................ 104
Table 8.8 Hospital day categorisation by referral route ...................................... 104
Table 8.9 Hospital day category estimation – baseline difference model ........... 106
Table 8.10 The effects of health care cost under-estimation on the
probability of cost effectiveness .......................................................... 112
Table A.1 Summary of ten study sites ................................................................ 140
Table C.1 Fieldwork calendar – site selection and quantitative key
milestones .......................................................................................... 152
Table D.1 Options provided for each ASCOT domain to reflect each
need level ........................................................................................... 157
Table D.2 Preference weights for attributes and levels ....................................... 158
Table E.1 Breakdown of costs for site R1 ........................................................... 169

List of figures and tables
iii
Table E.2 Breakdown of costs for site R2 ........................................................... 170
Table E.3 Breakdown of costs for site R3 ........................................................... 171
Table E.4 Breakdown of costs for site R4 ........................................................... 172
Table E.5 Breakdown of costs for site R5 ........................................................... 173
Table F.1 Summary of main service resources and unit costs ........................... 175
Table F.2 Average social care costs ................................................................... 176
Table F.3 Summary of equipment costs ............................................................. 177
Table F.4 Sample sizes – with T2 cost and/or interview data (outcomes) .......... 178
Table F.5 Sample sizes – with T2 interview data (outcomes) ............................. 178
Table F.6 Significant difference in lost to follow-up rates .................................... 179
Table F.7 Estimation of probability that case lost to follow-upa ........................... 180
Table F.8 Missing data ....................................................................................... 181
Table F.9 Significant difference in rate at which people died at T2 ..................... 182
Table F.10 Probability that people died at T2a (mean probability = 0.11) ............. 182
Table F.11 Service user related variables tested for their impact on
outcomes ............................................................................................ 184
Table I.1 Perceived health at baseline and post-re-ablement............................ 211
Table I.2 Direction of change in perceived health from baseline to post-re-
ablement ............................................................................................. 212
Table I.3 Perceived quality of life at baseline and post-re-ablement ................. 212
Table I.4 Direction of change in perceived quality of life from baseline to
post-re-ablement ................................................................................ 213
Table I.5 Health-related quality of life at baseline and post-re-ablement ........... 213
Table I.6 Direction of change in health-related quality of life from baseline
to post-re-ablement ............................................................................ 214
Table I.7 Social care outcomes at baseline and post-re-ablement .................... 216
Table I.8 Direction of change in social care outcomes between baseline
and post-re-ablement ......................................................................... 218
Table I.9 Ways in which re-ablement services helped ....................................... 219
Table I.10 Perceived health by sample characteristics and dependency at
baseline .............................................................................................. 221
Table I.11 Perceived health by sample characteristics and dependency at
follow-up ............................................................................................. 222
Table I.12 Perceived quality of life by sample characteristics and
dependency at baseline ...................................................................... 223
Table I.13 Perceived quality of life by sample characteristics and
dependency at follow-up ..................................................................... 224
Table I.14 Health-related quality of life by sample characteristics and
dependency at baseline ...................................................................... 225

Home care re-ablement services: Investigating the longer-term impacts
iv
Table I.15 Health-related quality of life by sample characteristics and
dependency at follow-up ..................................................................... 226
Table I.16 Social care needs by sample characteristics and dependency at
baseline .............................................................................................. 227
Table I.17 Social care needs by sample characteristics and dependency
at follow-up ......................................................................................... 229

v
Acknowledgements
We would like to thank Gerald Pilkington (Care Services Efficiency Delivery) for his
important role in helping to set up the study, Inna Kotchetkova who helped with the
focus groups, and members of the Advisory Group for their encouragement and
contribution. Michelle Maynard and Sally Pulleyn provided invaluable administrative
and secretarial support.
Above all, we are grateful to all the study participants and local authority staff who
have collaborated with us, and without whose support the study would not have been
possible. Participating local authorities were: Brighton and Hove City Council,
Calderdale Council, London Borough of Croydon, Hampshire County Council,
Haringey Council, Leicestershire County Council, Lincolnshire Council, North East
Lincolnshire Council, Nottinghamshire County Council and Wirral Borough Council.
The research was funded by the Department of Health. However, any views
expressed in the report are those of the research team alone.


vii
Executive summary
Re-ablement is a new, short-term intervention in English home care. It helps users to
regain confidence and relearn self-care skills and aims to reduce needs for longer-
term support. Home care re-ablement services are usually provided or
commissioned by local authorities responsible for adult social care. Some services
are selective, prioritising people discharged from hospital or recovering from illness
and accidents; others are more inclusive, accepting almost all those referred for
home care. In autumn 2010, £70 million was allocated to NHS Primary Care Trusts
for further development of re-ablement services. Further funding to the NHS for re-
ablement is being made available as a result of the government's spending review;
£150 million in 2011/12, rising to £300 million per annum over the period 2012-15.
Research by the Social Policy Research Unit, University of York and the Personal
Social Services Research Unit, University of Kent examined the immediate and
longer-term impacts of home care re-ablement; the cost-effectiveness of the service;
and the content and organisation of re-ablement services. People who received
home care re-ablement were compared with a group receiving conventional home
care services; both groups were followed for up to one year.
According to data supplied by local authorities, the unit cost of a typical re-
ablement episode is £2,088. The mean cost per hour is £20 and the mean cost
per hour of service user contact time is £40.
Re-ablement was associated with a significant decrease in subsequent social
care service use. The costs of the social care services used by people in the re-
ablement group during the 12 months of the study (excluding the costs of the re-
ablement intervention itself) were 60 per cent less than the costs of the social
care services used by people using conventional home care services.
However, this reduction in social care costs was almost entirely offset by the
initial cost of the re-ablement intervention. The total (including re-ablement)
mean cost of the social care services used by the re-ablement group was £380
lower than the total mean cost of the social care services used by the comparison
group.
The re-ablement group had significantly higher healthcare costs than the
comparison group during the first eight weeks of the study. However, more
people in the re-ablement group had been referred to the service following
discharge from hospital. These people had significantly higher healthcare costs
(mainly arising from further hospital in-patient episodes) during the first eight
weeks of the study than people who had been referred to re-ablement from the
community. However, there was no significant difference between the re-
ablement and comparison group in the costs of the health services used during
the subsequent ten months of the study. When baseline differences were taken

Home care re-ablement services: Investigating the longer-term impacts
viii
into account, there were also no significant differences in the duration of inpatient
stays or the total costs of healthcare service use when averaged across the two
groups over the full 12 months of the study.
Taking total healthcare, social care and re-ablement costs together, there was no
statistically significant difference in the costs of all the services used by the re-
ablement and comparison group over the 12 month study period.
Re-ablement had positive impacts on users‟ health-related quality of life and
social care-related quality of life up to ten months after re-ablement, again in
comparison with users of conventional home care services.
At a „willingness to pay‟ threshold of £30,000 for each increase in health-related
quality of life, there is a very high probability (99 per cent) that re-ablement is
cost-effective if health and social care costs are taken into account, and just
under 100 per cent probability if social care costs alone are included. At a more
stringent threshold of £20,000 per health-related outcome gain, the probability of
cost-effectiveness is still very high, at 98 per cent for health and social care costs
and 99 per cent for social care costs only.
For social care-related outcomes, at a „willingness to pay‟ threshold of £30,000
per outcome gain, there is a 78 per cent probability that re-ablement is cost-
effective if both health and social care costs are included and a 98 per cent
probability that re-ablement is cost-effective if just social care costs are included.
At the more stringent threshold of £20,000 per social care-related outcome gain,
the probability of cost-effectiveness is 68 per cent for combined health and social
care costs, but still 98 per cent for social care costs only.
Effective re-ablement services require good initial staff training and on-going
supervision; clear outcomes for users and flexibility to adapt these as needs
change; and prompt supply of equipment. Prompt transfer to home care for
those who need it at the end of re-ablement is essential to maintain capacity in
re-ablement services.
Users and carers were positive about the impact of re-ablement on their
independence and confidence, although some would have liked more help to
improve their mobility and undertake activities outside the home.
Background
English adult social care departments are developing short-term, specialist home
care re-ablement services. Re-ablement is a particular approach within home care; it
supports users in developing confidence and relearning self-care skills, thereby
increasing their independence. Providing equipment for use at home is an important
part of re-ablement. Many re-ablement services started as selective schemes,
primarily for people discharged home from hospital or recovering from an illness or
accident. However, the approach is increasingly being extended to most people

Executive summary
ix
eligible for adult social care and referred for home care support. Re-ablement is
usually offered for up to six weeks; after this, some people may require no further
support while others will be referred for conventional home care.
This study aimed to:
Provide robust evidence on the immediate and longer-term benefits of home care
re-ablement, by comparing outcomes for users of home care re-ablement with
outcomes for people using conventional home care services.
Identify factors affecting the level and duration of benefits for service users.
Estimate the unit costs of home care re-ablement services
Identify impacts on and savings in the use of social care and other services that
could offset the costs of re-ablement.
Describe the content of home care re-ablement services.
The impact of re-ablement on quality of life and social care
outcomes
Home care re-ablement appears to have positive impacts on individuals‟ health-
related quality of life and social care outcomes. Overall, re-ablement was associated
with significantly greater improvements in health-related quality of life, compared with
people using conventional home care services. People who had used re-ablement
also had greater improvements in social care outcomes compared to users of
conventional home care services, although the effect was not as strong. These
results took account of any differences in the characteristics of the re-ablement and
comparison groups.
The costs of re-ablement services
Established methodologies were used to estimate the typical unit costs of home care
re-ablement. A typical re-ablement episode in the five study sites cost £2,088, with a
range of £1,609 to £3,575. The mean cost per hour is £20 and the mean cost per
hour of service user contact time is £40. These costs are higher than for typical
conventional home care services of the same duration. Although based on limited
evidence, re-ablement services that employ occupational therapists as members of
the team appear no more expensive than those employing only social care staff.

Home care re-ablement services: Investigating the longer-term impacts
x
The impact of re-ablement on the use and costs of social care and
health services
The mean cost of the re-ablement (and any other social care) services used by study
participants during the first few weeks of the study was £1,640. This was significantly
higher than the mean cost of the conventional home care and other social care
services used by the comparison group during the same period, at £570. However,
people who had had home care re-ablement used less social care services in the ten
months following the re-ablement episode than the comparison group that had used
conventional home care services. The mean cost of the social care services used by
the re-ablement group over the following ten months was only £790, compared to
£2,240 in the comparison group. These lower social care services costs following
the completion of re-ablement cancelled out the higher cost of the initial re-ablement
intervention. Over the course of a year, the mean total (re-ablement plus other social
care services) cost of the social care services used by the re-ablement group was
only £380 lower than mean total cost of the social care services used by the
comparison group during the same period. This difference was not statistically
significant. After accounting for differences in baseline characteristics, the costs of
the social care services (excluding re-ablement) used by people in the re-ablement
group were 60 per cent lower than the costs of the social care services used by the
comparison group over the year (mean £1,130 compared with £2,850).
People in the re-ablement group had significantly higher mean health services costs
during the first eight weeks than those who had been referred to conventional home
care. This was particularly the case for people who had been referred to re-ablement
following discharge from hospital; the mean cost of the health services used during
the first eight weeks by those who had been discharged from hospital was £1,850,
compared to a mean cost of £1,020 for those referred from the community. These
higher health service costs were largely caused by greater use of expensive hospital
inpatient services. However, there were no significant differences in the mean costs
of the health services used by the re-ablement and comparison groups, whether
referred from hospital or the community, over the subsequent ten months, and
therefore over the duration of the study as a whole.
The cost-effectiveness of home care re-ablement
Cost-effectiveness is measured by comparing improvements in health-related quality
of life and/or social care outcomes against the costs of those improvements. When
assessing the cost-effectiveness of treatments, the National Institute for Health and
Clinical Excellence (NICE) generally assumes that £20,000 to £30,000 (at the top of
its threshold) is an acceptable cost for each increase in health-related quality of life
outcome.

Executive summary
xi
On the basis of this study, home care re-ablement is cost-effective in relation to
health-related quality of life outcomes and may also be cost-effective in relation to
social care outcomes. Assuming a willingness to fund an intervention if it costs no
more than £30,000 for each increase in health-related quality of life outcome, the
study found a 99 per cent probability of re-ablement being cost-effective if both health
and social care costs were included and just under 100 per cent if social care costs
only were included. At a more stringent willingness-to-fund threshold of £20,000 per
unit improvement in health-related quality of life, the probability of cost-effectiveness
was 98 per cent if health and social care costs were taken into account but was still
over 99 per cent if just social care costs were considered. These minor differences in
probability arose because, as noted above, some of the re-ablement service users
had higher health care costs than people who used conventional home care.
Similarly, the study found re-ablement was cost-effective in relation to social care
outcomes. Assuming a willingness-to-fund threshold of £30,000 for each unit gain in
social care outcomes, there was 78 per cent probability of re-ablement being cost-
effective when total health and social care costs were taken into account.
When just social care costs were included, the probability of cost-effectiveness rose
to 98 per cent, again because of greater health service use by some of the re-
ablement group. At a threshold of £20,000 per unit improvement in social care
outcomes, the probability of cost-effectiveness was 68 per cent for health and social
care costs and 98 per cent for social care costs only.
These findings have important caveats. Fewer participants than expected remained
in the study for follow-up interviews nine to 12 months after referral to re-ablement (or
conventional home care); this may be a source of bias. Data on use of health
services during the study relied on participants‟ recall and may be inaccurate. Data
supplied by local authorities on social care service use excluded services and/or
equipment purchased privately or supplied by voluntary organisations, thus
potentially underestimating the use and costs of such services. Finally, as with any
statistical analyses, „statistically significant‟ results mean that a very high probability
can be assumed, but not absolute certainty.
The organisation and content of home care re-ablement services
According to service managers and front-line staff, factors contributing to the
effectiveness of home care re-ablement fell into two clusters: internal organisation
and management; and the wider service environment. The most important internal
organisational factors were:
Commitment, enthusiasm, knowledge and skills of front-line staff. This requires
thorough initial training and regular on-going supervision and peer support.

Home care re-ablement services: Investigating the longer-term impacts
xii
Training was particularly important for staff recruited from conventional home
care services.
High quality initial assessments by senior re-ablement staff; clear goals
negotiated with users; regular reassessment throughout the re-ablement process;
and flexibility to adapt the timing, duration and content of visits as users‟ needs
and capabilities altered.
Rapid assessment and delivery of equipment. Having quick access to
occupational therapy skills and equipment may be more important than having
occupational therapists employed as members of the re-ablement team.
Wider environmental factors were:
Clarity among all relevant staff (including hospital discharge planning staff and
adult social care managers) about the aims, potential and limitations of home
care re-ablement.
Access to specialist training and skills, especially if re-ablement services are less
selective and accept users with a wide range of health problems and
impairments. Access to occupational and physiotherapists was particularly
important; other relevant professionals to whom easy access was important
included continence advisors, community matrons and specialist workers for
visually impaired people. Training and advice on working with people with
dementia or other mental health problems could also extend the effectiveness of
home care re-ablement.
Prompt transfer to long-term home care services at the end of re-ablement for
those needing continuing help. Without adequate capacity in long-term home
care, re-ablement services risked becoming „blocked‟ by clients awaiting transfer
and their efficiency correspondingly reduced.
User attitudes and motivation were also considered important success factors.
User and carer perspectives on re-ablement services
Service users and carers initially knew very little about the nature and aims of home
care re-ablement. Nevertheless, they reported improved independence, greater
confidence and increased motivation to make further gains in self-care skills. The
most commonly reported achievements related to personal care and preparing
simple meals/snacks. Knowing they were being regularly and frequently monitored,
and the routines created by regular re-ablement visits, boosted users‟ confidence,
especially after illness or hospitalisation. The quality of relationships with front-line
re-ablement workers was an important source of motivation to achieve agreed goals.
Executive summary
xiii
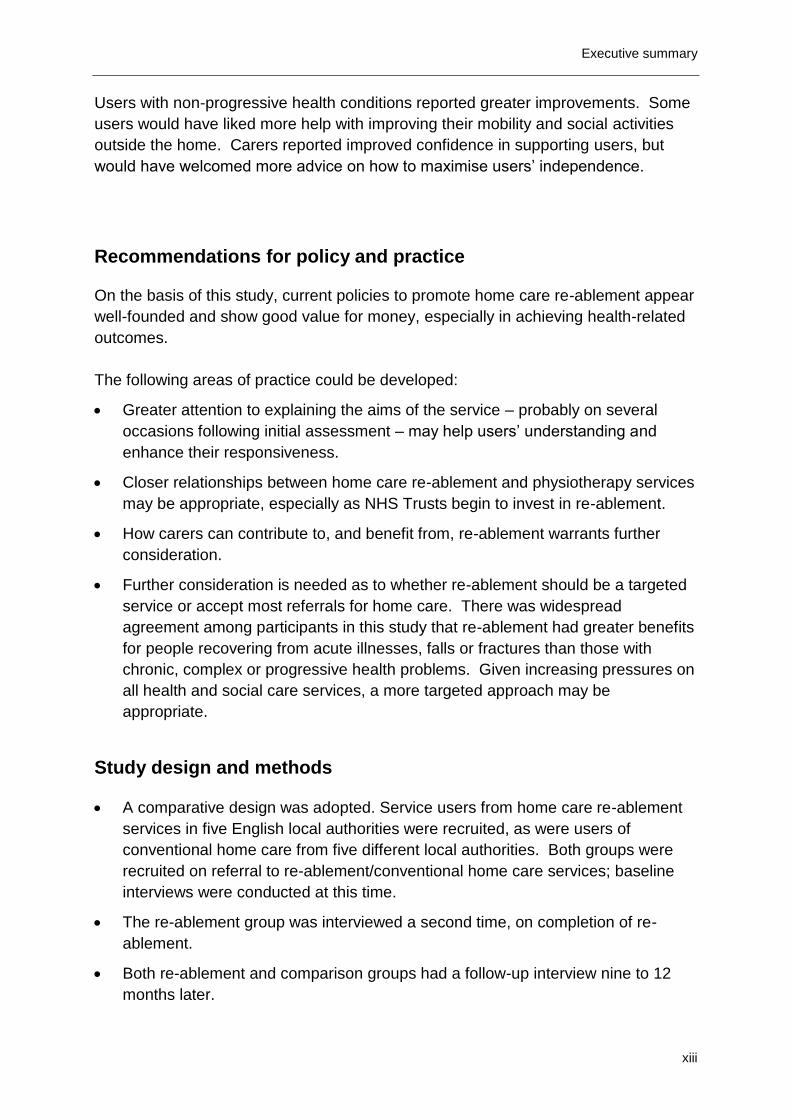
Users with non-progressive health conditions reported greater improvements. Some
users would have liked more help with improving their mobility and social activities
outside the home. Carers reported improved confidence in supporting users, but
would have welcomed more advice on how to maximise users‟ independence.
Recommendations for policy and practice
On the basis of this study, current policies to promote home care re-ablement appear
well-founded and show good value for money, especially in achieving health-related
outcomes.
The following areas of practice could be developed:
Greater attention to explaining the aims of the service – probably on several
occasions following initial assessment – may help users‟ understanding and
enhance their responsiveness.
Closer relationships between home care re-ablement and physiotherapy services
may be appropriate, especially as NHS Trusts begin to invest in re-ablement.
How carers can contribute to, and benefit from, re-ablement warrants further
consideration.
Further consideration is needed as to whether re-ablement should be a targeted
service or accept most referrals for home care. There was widespread
agreement among participants in this study that re-ablement had greater benefits
for people recovering from acute illnesses, falls or fractures than those with
chronic, complex or progressive health problems. Given increasing pressures on
all health and social care services, a more targeted approach may be
appropriate.
Study design and methods
A comparative design was adopted. Service users from home care re-ablement
services in five English local authorities were recruited, as were users of
conventional home care from five different local authorities. Both groups were
recruited on referral to re-ablement/conventional home care services; baseline
interviews were conducted at this time.
The re-ablement group was interviewed a second time, on completion of re-
ablement.
Both re-ablement and comparison groups had a follow-up interview nine to 12
months later.

Home care re-ablement services: Investigating the longer-term impacts
xiv
Initially 1,015 people were recruited to the study, 654 to the re-ablement group
and 361 to the comparison group. Between recruitment and follow up nine to 12
months later, a total of 633 participants were lost to the study because of death,
illness, (re)hospitalisation or refusal to participate in the follow-up interview.
Allocation of service users to the re-ablement group and comparison group was
not random, although equivalent selection criteria were used for each group. The
potential for selection bias was mitigated by adjusting for a comprehensive range
of baseline characteristics in the data analysis and by the follow-up study design.
This design allowed us to measure any differences between the groups in how
their experiences differed over the nine to 12 month follow-up. The size of the
difference in any outcome over time is less sensitive to baseline characteristics
than the (absolute) scale of the outcome at any given time.
The recruitment rates to the study were lower than expected and the follow-up
drop-out rates higher than expected, leading to smaller sample sizes than
anticipated. The potential for statistical error is higher in smaller samples.
At each interview, standardised, validated outcome measures were used to
assess:
o Self-perceived health
o Perceived quality of life
o Health-related quality of life (EQ-5D)
o Social care-related quality of life (ASCOT).
Local authorities supplied data on the volume and costs of services used by
study participants. Study participants provided details of the health and voluntary
organisation services and equipment they received.
Sites provided detailed information on the unit costs of their home care re-
ablement services.
The organisation, management and delivery of re-ablement services were
investigated through:
o Interviews with senior and operational managers
o Focus groups with front-line staff
o Observations of re-ablement visits.
In-depth, semi-structured interviews were conducted with small samples of re-
ablement users and carers.

Executive summary
xv


1
Chapter 1 Introduction
Summary
Home care re-ablement is an „approach‟ or a „philosophy‟ within home care
services. The aim is to help people „do things for themselves‟, rather than
„having things done for them‟.
The Government is increasingly emphasising its support for home care re-
ablement as one way to help individuals maintain their independence.
There is a small but growing evidence base for home care re-ablement services,
which suggests that positive impacts on users‟ functional status and subsequent
use of services are likely.
The results of the present study provide further evidence on the immediate and
longer-term benefits of home care re-ablement services, as well as detailed
information on the structure, content and first hand experiences of re-ablement.
1.1 Background - what is home care re-ablement?
English local authorities with responsibility for adult services are increasingly
developing short-term, specialist home care re-ablement services. Re-ablement is
often described as an „approach‟ or a „philosophy‟ within home care services – one
which aims to help people „do things for themselves‟, rather than „having things done
for them‟. A definition of home care re-ablement, proposed ten years ago, but which
has been generally accepted is: „Services for people with poor physical or mental
health to help them accommodate their illness by learning or re-learning the skills
necessary for daily living‟ (Kent et al., 2000).
Home care re-ablement services provide personal care, help with activities of daily
living and other practical tasks for a time-limited period, in such a way as to enable
users to develop both the confidence and practical skills to carry out these activities
themselves. The provision of items of equipment is also an important feature of
home care re-ablement services. Overall, the aim is to maximise long-term
independence and quality of life (Petch, 2008). However, as Petch (2008) has
pointed out, this may not always be consistent with the wishes of some service users
(and/or carers) who may welcome the support of, and regular social contact with,
home care workers and who may be wary of losing these relationships.
Home care re-ablement services can take different organisational forms. In some
localities, home care re-ablement services are funded and operated jointly with NHS
partners. Latest (August 2010) details returned to the Department of Health suggest

Home care re-ablement services: Investigating the longer-term impacts
2
that around a quarter have some NHS funding, whilst the remainder are local
authority-only funded. In many local authorities, adult services departments have
taken a lead themselves, often as part of the reconfiguration of the authority‟s
remaining in-house home care services. Existing home care staff receive training in
re-ablement approaches, and teams are often strengthened by the appointment of
occupational therapists (OTs), OT aides and other specialist staff (Petch, 2008). In
any case, easy and quick access to equipment for re-ablement service users is
considered important.
Home care re-ablement services fall into two broad groups. In some localities, home
care re-ablement acts as an „intake‟ service for a wide range of users who meet local
Fair Access to Care Services (FACS) eligibility criteria and are referred for home care
services. Only people thought unlikely to benefit, such as those with end-stage
terminal illness or advanced dementia, are likely to be screened out from an „intake‟
service. In comparison, in „discharge support‟ services, re-ablement services work
predominantly or exclusively with people who have been discharged from hospital or
intermediate care. Discharge support services are often selective, accepting only
those individuals certain to benefit from a re-ablement approach. Many local
services were initially established as small, selective discharge support services and
have gradually extended their scope to accept a wider range of users as their
capacity has increased.
Home care re-ablement services are normally offered for up to six weeks, with some
flexibility to continue for longer if the user would benefit from this or if appropriate
longer-term home care services are not immediately available. Re-assessments and
referrals for on-going home care and other services are made at the end of the
period of re-ablement. Re-ablement services are usually available to adults of all
ages, although most will work predominantly with older people.
1.2 Policy background to the study
The need for greater investment in preventive and rehabilitation services was
recognised a decade ago (Kings Fund, 1999; Nocon and Baldwin 1998). At that
time, there were relatively few alternatives to extended hospital stays or services that
could avert admission to institutional care. The Audit Commission (1997) described
this as a „vicious circle‟ of spiralling costs, inefficient use of scarce resources and a
failure to enable older people to live as they preferred – independently in the
community.
The NHS Plan (Secretary of State for Health, 2000) announced significant
investment in new intermediate care services, which were developed in the context of
policy concerns about inappropriate extended hospital bed use by older people.
„Intermediate care‟ is a generic term covering a wide range of services to help

Chapter 1 Introduction
3
prevent unnecessary admission to hospital, support early discharge, and reduce or
delay the need for long-term residential care. A large variety of intermediate care
services was established, based variously in acute, community and day hospitals;
community-based teams working in people‟s own homes; and residential services in
purpose-built units, sheltered housing or care homes. Some intermediate care
services are entirely hospital-based; others are funded and delivered jointly by local
NHS and social services organisations. They are generally free of charge at the
point of delivery and offered for up to six weeks.
Early initiatives to develop home care re-ablement services were often prompted by
the need to continue encouraging and consolidating skills in personal and domestic
tasks once users returned home following a period of intermediate care. More
recently, the development of home care re-ablement services has been driven by
local authorities‟ concerns over the future role of their remaining in-house home help
services, and by the prospect of generating savings on longer-term home care
support. Many councils with social services responsibilities (CSSRs) are now
providing home care re-ablement services. Care Services Efficiency Delivery
(CSED) are about to publish an update report which shows that 149 councils, of the
152 councils with social care responsibility, either have a service; are extending or
enhancing their service; or are in various stages of implementation. On the basis of
information available to CSED, councils are currently more likely to provide intake
and assessment re-ablement services than hospital discharge support. The latest
information from 130 councils of the 152 is that 108 are „intake‟ and 22 are hospital
discharge – of the latter, this is because they have started with a hospital discharge
service as a stepping stone to intended „intake‟, although a few are, and will remain,
hospital discharge only. There is diversity in both FACS levels and when they are
applied, as can be seen in Table 1.1 below.

Home care re-ablement services: Investigating the longer-term impacts
4
Table 1.1 CSSR FACS level and application1
FACS Level FACS applied at
entry to service
FACS applied on
exit from service Total
Low and above 4 1 5
Moderate and above 24 4 28
Substantial and above 58 27 85
Critical and above 3 - 3
Total 89 32 121
Source: CSED, 2010.
Local authority home care re-ablement services have quickly come to occupy an
important place in policies aimed at enabling older people, in particular, to remain
living independently in their own homes for as long as possible. They are a
cornerstone of current preventive service initiatives and as such have the potential to
be cost-effective, if the costs of the service are outweighed by reductions in the use
of home care services over time. Current Government support for home care re-
ablement is reflected in the following report:
We must place renewed emphasis on keeping people as independent as possible for as long as they feel able, not least by providing earlier support. People need to feel help is there as soon as problems occur. We have to maximise the potential of re-ablement, telecare and other innovations which can dramatically improve people‟s lives while also being highly efficient. Some local authorities have picked up this challenge, others have not. We need to accelerate this change so that these services and this approach is the norm.
(Lansley, 2010)
1 There are four bands to the FACS eligibility criteria for social services:
Critical – serious risks to someone‟s independence, which are likely to occur within 72 hours. Substantial – significant risks to someone‟s independence, which are likely to occur between 72 hours and six weeks. Moderate – significant risks to someone‟s independence, which are likely to occur between six weeks and six months. Low – significant risks to someone‟s independence, which are likely to occur after six months.

Chapter 1 Introduction
5
1.3 Research background
The following overview of the research background on home care re-ablement
services draws on Ryburn and colleagues‟ (2009) review of the literature, together
with more recently published studies (e.g. McLeod and Mair, 2009).
Ryburn et al.‟s (2009) review of the current evidence across the UK, the USA and
Australia on the effectiveness of re-ablement or „restorative‟ approaches, as they are
known in other countries, suggests that positive impacts on users‟ functional status
and subsequent use of services are likely. The provision of aids, equipment and
home adaptations appears particularly likely to improve functional status and result in
longer-term cost savings.
In metropolitan Perth, Western Australia, a study of the Home Independence
Program (HIP) was conducted between 2001 and 2003, when HIP was being trialled
in just one area (Lewin and Vandermeulen, 2010). HIP is a short-term restorative
programme targeted at older home care service users. The study compared the
outcomes for individuals who participated in HIP with those of individuals who
received conventional or „usual‟ home care services. One hundred service users
were recruited to each group; standardised outcome measures and service outcome
data were collected at baseline, three months and one year. The HIP group showed
improvements on all personal outcome measures compared with the control group.
The odds of still receiving home care services at both three and 12 months for the
HIP group were significantly reduced when compared with individuals in the usual
care group.
These results are similar to Tinetti and colleagues‟ (2002) findings in a large-scale
controlled trial undertaken in the USA, which evaluated restorative care vs usual care
for older adults. This study revealed that individuals in receipt of restorative home
care showed greater improvement in self-care, home management and mobility
functioning scores at discharge than recipients in the usual care group. Compared
with usual care, the restorative care model was associated with a greater likelihood
of remaining at home following a period of restorative home care. In addition, Tinetti
et al. (2002) found that restorative care recipients had shorter and less intensive
home care episodes, suggesting that the restorative model was cost-effective.
Further evidence of the effectiveness of re-ablement or restorative approaches
comes from the ASPIRE (Assessment of Services Promoting Independence and
Recovery in Elders) project in New Zealand (Parsons et al., 2007). ASPIRE
evaluated the effectiveness of three ageing-in-place programmes, one of which was
called Community FIRST (Flexible Integrated Restorative Support Team),
established in Hamilton in 2002. Community FIRST aimed to support older people
with high and complex needs. A multi-disciplinary team provided an in-depth support
plan, which was delivered by well-trained support workers/therapy aids closely

Home care re-ablement services: Investigating the longer-term impacts
6
supervised by the multi-disciplinary team. Some 113 people participated from the
Hamilton region, of whom 56 received Community FIRST and the remainder received
usual care. The results showed mortality risk and the risk of admission to residential
care were reduced for the Community FIRST group compared with individuals in
receipt of usual care. Moreover, a trend for improvement in activities of daily living
was observed in older people in the Community FIRST service compared to the
usual care group.
As noted above, England has witnessed a growth in home care re-ablement services
in recent years. A key challenge in investigating the effectiveness and cost-
effectiveness of such services to date has been the technical ability to link routine
data on re-ablement service use with data on subsequent social care and other
service use. Nevertheless, the UK is beginning to develop an evidence base on the
impact of home care re-ablement.
An early study investigated the impact of Leicestershire‟s pilot home care re-
ablement service (Kent et al., 2000). When the pilot started it was highly selective;
however, it was later extended to become an „intake‟ service for everyone assessed
as needing home care. Users‟ subsequent use of home care services (as measured
at the time of first review) was compared with that of a matched group of service
users from another part of the county which at the time did not have a re-ablement
service. Initially, people referred to the home care re-ablement service (both
selective and „intake‟ versions) had more hours of home care each week than those
in the comparison group in receipt of conventional services. However, when service
use at the time of first review was compared, the re-ablement group was far more
likely to have discontinued home care service use than the comparison group. The
results were particularly dramatic for users of the selective service. Among those re-
ablement service users who did continue to use home care services, their level of
service use was more likely to have decreased and less likely to have increased at
the time of the first review than those who had not had re-ablement.
Although showing dramatic reductions in the use of home care services, the
Leicestershire study was only able to demonstrate the impact of home care re-
ablement at the time of first review, around three months after re-ablement. A further
study examined the longer-term impact of home care re-ablement (Newbronner et
al., 2007). This study used data from two local authority „discharge support‟ re-
ablement services and two further „intake‟ re-ablement services and examined
routine service data on the use of social care services at three, six, 12, 18 and 24
months after discharge from re-ablement. In three of the four sites, between a third
and a half of re-ablement service users used no other home care services, either
before re-ablement or up to 24 months after re-ablement. Among some of those who
did use conventional home care services following an episode of re-ablement,
starting to use these services appeared to be delayed for a year or more; moreover

Chapter 1 Introduction
7
in two of the four sites the percentages using less home care, compared with their
use at discharge from re-ablement, actually increased over time.
This latter study was small and exploratory. It lacked robust baseline data on re-
ablement service users and, crucially, it also lacked a comparison group of people
who received only conventional home care services. It was therefore not possible to
conclude with certainty that any reduction in the use of home care services, in either
the shorter or longer-terms, was due to the impact of re-ablement; such reductions in
service use might have occurred anyway as part of normal fluctuations in the health
and support needs of older and disabled people.
Further evidence of the impact of home care re-ablement comes from a recent
evaluation of a pilot service established in south-east Edinburgh (McLeod and Mair
2009). Data on the hours of care received at the start and end of the re-ablement
period by the first 90 service users of the service were compared with a matched
control group in another part of the city who received conventional home care
services. Both groups were also tracked for a further three months. The total hours
of care received by the re-ablement service users was reduced by 41 per cent over
the six week re-ablement period; 60 per cent reduced their care requirements; and
just over one-third required no further home care services at the end of the re-
ablement period. Service users referred to the re-ablement service via community
routes showed a greater reduction (46 per cent) in terms of hours of care required
compared to those from the hospital route (37 per cent), possibly because the latter
required a longer period of support to recover. However, the costs - particularly the
management costs - of the re-ablement service were greater than those of
conventional home care; one worker described it as a „Rolls-Royce service‟ (McLeod
and Mair, 2009). The evaluation nevertheless concluded that re-ablement had the
potential to increase capacity and support more home care service users.
Whilst the current evidence base on home care re-ablement services is growing,
questions remain about the most effective types of approaches; about what groups
are likely to benefit most; and about the most effective timing and duration of re-
ablement interventions (Ryburn et al., 2009). Furthermore, there is limited evidence
about longer-term outcomes and benefits (McLeod and Mair, 2009). The present
study, which takes a longitudinal approach, aims to fill some of the evidence gaps
relating to the provision of home care re-ablement services in England.
1.4 Overarching aims of the study
The study aims to:
1. Provide robust research evidence on the immediate and longer-term benefits of
home care re-ablement, including:

Home care re-ablement services: Investigating the longer-term impacts
8
a) User-level benefits (health related, quality of life, and social care-related
quality of life)
b) Service-level benefits (reduced demand for services, less use of expensive
services).
2. Identify the factors that affect the level and duration of benefits for service users
of a period of re-ablement (e.g. features of the service; user group
characteristics; type and level of services used after re-ablement).
3. Identify any impact on and savings in the use of social care and other services
that can be set against the costs of re-ablement services.
4. Describe the content and the costs of home care re-ablement services.
1.5 Structure of this report
The following chapter (Chapter 2) gives an overview of the research design and data
collection methods. Chapter 3 describes study sample characteristics from both the
quantitative and qualitative elements of the research. The following two chapters
present the qualitative findings: the organisation and content of home care re-
ablement services (Chapter 4) and the experiences of re-ablement service users and
informal carers (Chapter 5). Chapters 6, 7 and 8 report the quantitative findings.
Chapter 6 documents outcomes for service users of both re-ablement and
conventional home care services. The next chapter, Chapter 7, considers the unit
costs of re-ablement services, while Chapter 8 looks at cost-effectiveness. The final
chapter, Chapter 9, discusses the findings and presents concluding comments and
recommendations for policy, practice and further research.

9
Chapter 2 Methods
Summary
The research design comprised a comparison of home care re-ablement
services with conventional home care service use.
The different strands of quantitative data collection and analysis are outlined.
These relate to outcome data for service users; use of health and social care
services; cost data.
Information about the qualitative data collection and analysis is presented. This
covers data intended to shed light on the content, structure and delivery of home
care re-ablement, as well as the first-hand experiences of re-ablement service
users and their (informal) carers.
2.1 Overall research design
The research design aimed to generate data to facilitate a robust comparison of the
impact and outcomes of the use of home care re-ablement services with
conventional home care service use. A randomised design to assess the impact of
the re-ablement intervention was not feasible given that, in any given local authority,
only home care re-ablement services or only conventional home care services were
likely to be available. A comparative design was therefore adopted. Study
participants were recruited from five councils that offered home care re-ablement
services and five comparison group sites where conventional home care services
were available. Full information about site selection is given in Appendix A; detailed
information about the five re-ablement services can be found in Appendix B.
As well as the comparative before-and-after study, there were three complementary
strands to the overall project including an examination of the costs of providing re-
ablement services. In addition, qualitative work was undertaken which focussed on
gaining insights into the structure, operation and content of re-ablement, together
with service users‟ and carers‟ first hand experiences of service provision. Figure
2.1 overleaf shows the full range of data sources and data collection points.
Recruitment of service users commenced in November 2008 and lasted until July
2009. Eligibility criteria for participation in the study is included in Appendix C;
Chapter 3 shows similarities and differences in terms of participants‟ base line
characteristics. The recruitment period was four months longer than was originally
planned. This was because recruitment was far slower than expected and the
additional time was an attempt to reach the target of 1,600 services users – 800
people in each of the two study groups. Despite the extension, there was still a

Home care re-ablement services: Investigating the longer-term impacts
10
shortfall in the final number of participants. Follow-up interviews were held with
participants up to 12 months following their first interview for the study.
During the recruitment period, a number of changes were made to the research
design with a view to improving recruitment rates. These included: changes in the
numbers of sites involved; changes in the number of outcome measures included in
the data collection instruments; and a reduction in the follow-up period between pre-
and post-intervention data collection. Fuller information about recruitment and
follow-up of study participants, and changes in the study design, are detailed in
Appendix C.
Both quantitative and qualitative data were collected from service users, carers and
local authority staff in the participating sites. Data collection and analysis
approaches are outlined below; fuller information can be found in Appendices D to H.
2.2 Quantitative data collection and analysis
The quantitative work involved four different types of data collection, described
below.
2.2.1 Individual outcome data for re-ablement and conventional home care
service users
Outcome data from both re-ablement and conventional care service users were
collected on two occasions: service commencement (T1) and between nine and 12
months later (T2). In addition, post-intervention interviews (T1+R) were conducted
with individuals in the re-ablement group on discharge from re-ablement. T1 and
T1+R data collection took place between November 2008 and July 2009; interviews
were conducted by local authority staff. The T2 interviews began 12 months later, in
November 2009, and continued until May 2010; these interviews were conducted by
a research agency specialising in social and market research.
The questionnaires included the following outcome measures:
Self-perceived health (a five point scale)
Perceived quality of life (a seven point scale)
Health-related quality of life (EQ-5D – Euro-QoL)
Social care outcomes (ASCOT – Adult Social Care Outcomes Toolkit).
Further details of these outcome measures can be found in Appendix D. In addition,
administrative information (client group, FACS level) was collected, together with
basic demographic information (ethnicity, age and gender), and information about

Chapter 2 Methods
11
Figure 2.1 Overall design of study and data sources
Costs, operation and views of Comparison of re-ablement and conventional services
re-ablement services
NB: Numbers in brackets relate to Chapter 2 sub-sections where there is more detailed information on data sources.
Re-ablement group (2.2.1)
T1 questionnaire on entry
to re-ablement service
Post re-ablement assessment
T1+R questionnaire on discharge from re-ablement (2.2.1)
Service use information from LA records (2.2.2)
Postal questionnaire on NHS/other service use (2.2.3)
T1 follow up after entry to study (2.2.1)
T2 questionnaire Service use information from LA records
Unit costs of re-ablement
service (2.2.4)
Resources and cost information
from participating LAs
Users’ and carers’ views of re-
ablement services (2.3.4/2.3.5)
Interviews with re-ablement
service users and carers
Eight weeks after entry to
study
Service use information from LA
records (2.2.2)
Postal questionnaire on
NHS/other service use (2.2.3)
Comparison group (2.2.1)
T1 questionnaire on entry to
conventional home care
services
Structures, operation and content
of re-ablement services
(2.3.1/2.3.2/2.3.3)
Interviews and focus groups with
LA staff
Observation of re-ablement clients
T1 follow up after entry to study (2.2.1)
T2 questionnaire
Service use information from LA records
Repeated monthly questionnaire
(2.2.3)
Postal questionnaires on NHS/other
service use

Home care re-ablement services: Investigating the longer-term impacts
12
current circumstances (household composition, employment status, activities of daily
living, tenure, presence of carer at the interview).
2.2.2 Data on early and longer-term use of social care services
Information was collected on all participants‟ use of social care services during the
first few weeks of entry to the study in order to compare resource use and costs
during the intervention period. The methods of data collection differed between the
re-ablement and comparison groups.
At the beginning of each month, each site in the re-ablement group was sent a list of
the identification numbers of all participants for whom a completed T1+R
questionnaire had been received during the previous month. Each re-ablement site
was asked to send details of all re-ablement and any other social care services
received during the re-ablement period by each participant. Sites were asked to
provide a description and the frequency of each service received (for example the
hours of re-ablement home care provided during the re-ablement period) and, if
available, the costs of the services used.
Also at the beginning of each month, each site in the comparison group was sent a
list of the identification numbers of all participants who had completed a T1
questionnaire approximately eight weeks earlier. Each comparison site was asked to
send details of all social care services received during the first week of the previous
month by each participant. This timeframe aimed to ensure that the data on services
used during that specific week were likely to be an accurate reflection of the services
received during the full eight week period. Again, sites were asked to provide a
description and the frequency of each service received (for example, home care,
meals on wheels or day care). The eight week time period was chosen prior to the
start of the study to be consistent with the collection of NHS and other resource use
(see below).
Data on long-term use of social care services over the ten month follow-up period
were collected around 12 months from the date of consent. Local authorities in both
groups were asked to send information on the services received from each
participant during a specified week at the time of follow-up. This information was
used to cost services for the previous ten months.
2.2.3 Data on early and longer-term use of NHS and other services
The study aimed to determine the impact of re-ablement on the use of NHS services
and services provided by voluntary organisations or other bodies; it is possible that
any reductions in the use of home care services by the re-ablement group may be
offset by the increased use of other services. Eight weeks after recruitment to the
study, a postal questionnaire was sent to each participant asking for information

Chapter 2 Methods
13
about receipt over the past two months of health care, equipment and social care
services not arranged or provided by their local authority. The time frame of eight
weeks was chosen because, at the time the study was designed, this was felt to be
an appropriate period to cover the majority of re-ablement episodes given that some
were likely to be longer than six weeks. Questions on resource use during the ten
month follow-up period were included in the T2 questionnaire (see Appendix D). The
data collection was supplemented by sending identical questionnaires on a monthly
basis to a sub-sample of service users to ascertain service use throughout the period
between recruitment and the T2 follow-up interview.
2.2.4 Unit costs of re-ablement services
For each re-ablement site participating in the study, we have endeavoured to provide
a bottom-up costing. This is an approach that identifies the different resources tied up
in the delivery of the service and assigns a value for each of these resources. The
sum of these values is the total cost. Unit costs are then calculated by linking these
costs to different units of activity.
To facilitate data collection, a short questionnaire was devised and sent to the
appropriate contacts in each site and they were asked to provide the latest
information available. When costs were given for the year 2007/08, they were
uprated to 2008/09 using the standard Personal Social Services inflators.
Details of annual caseload were also collected so that the average annual cost per
service user (average cost) could be calculated by dividing the total cost by the
annual number of clients who used the service. The cost per hour and the cost per
hour of service user contact were calculated by dividing the total cost by the total
number of hours worked by care staff and the number of hours care staff spent with
service users. Details of the information that was requested can be found in
Appendix E.
2.2.5 Statistical analyses of outcome data
Univariate analysis relied on paired t-tests, chi-squared tests and binomial tests,
while the multivariate analyses relied on xtreg estimator in Stata 10. Initially the
analysis explored whether there were significant differences between the re-
ablement and comparison groups in terms of demographic characteristics at
baseline. The analyses went on to explore the relationship between service users‟
characteristics and changes in outcome responses between baseline and at 12
month follow-up.
Taking advantage of the panel nature of the data, multivariate regression analyses
were performed employing both a fixed and random-effects model to explore
outcome changes between baseline and the 12 month follow-up. Following the

Home care re-ablement services: Investigating the longer-term impacts
14
estimation procedures adopted by Netten et al. (2007) the statistical models were
constructed with local authority dummy variables to explore the impact of area on
outcomes. The Hausman specification test was carried out on all models to evaluate
whether each model corresponded to the data sufficiently (Hausman, 1978).
Further details of the statistical analyses used in the study are contained in Appendix
F, as well as a list of all predictors that were included in each model.
2.3 Qualitative data collection and analysis
The qualitative research involved five strands of data collection, offering opportunities
for cross checking, triangulation and exploring issues in depth between the different
types of data.
2.3.1 Interviews with re-ablement service managers
Semi-structured interviews were conducted with the senior service manager for home
care re-ablement in each of the five re-ablement sites. In three of the sites, senior
managers were joined by an operational manager. The interviews aimed to find out
about the delivery and content of re-ablement, and covered: the background to the
establishment of the re-ablement service; how the service was established; the
professional skills represented among front-line staff; the content of the re-ablement
service; assessment, monitoring and discharge arrangements; and views on the
factors promoting and hindering the impact of re-ablement. Further information about
this set of interviews is included in Appendix G.
2.3.2 Observations of re-ablement activities
The interviews with service managers were followed by observation of re-ablement
visits to service users across the five re-ablement sites. Service users were
observed at different stages in a re-ablement period to see if and how the
intervention differed over time. The aims of the observation component of the study
were: to obtain a first-hand picture of the practice and processes of re-ablement; to
examine issues raised by the interviews with service managers; to gain (further)
insights into differences in the front-line operation of re-ablement services that might
affect outcomes for service users.
2.3.3 Focus group discussions with re-ablement front-line staff
In each of the five sites, one focus group discussion was conducted with up to eight
front-line staff. The aim of the focus group discussions was to explore staff views on
the factors perceived to promote or constrain the benefits of re-ablement, in the
shorter and longer-terms. Discussions also picked up and further explored issues

Chapter 2 Methods
15
covered in the interviews with managers and which had arisen from the observations
of re-ablement visits.
More detailed information about the service manager interviews, observation
exercise and focus group discussions (including topic guides) can be found in
Appendix G.
2.3.4 Interviews with re-ablement service users
Semi-structured interviews were conducted with service users in each of the five re-
ablement sites. The original intention was to select a sub-sample of the main re-
ablement study cohort, but that was not possible because of time pressures within
the study team and the local re-ablement sites who were helping with recruitment
and collection of T1 and T1+R data. Consequently, a different sample had to be
selected. It was important to recruit study participants as they were coming to the
end of the period of re-ablement, otherwise the collection of the T1+R could have
been compromised.
The interviews sought to explore the factors which influenced re-ablement progress
and outcomes for service users themselves and informal carers (if any). They drew
on themes identified in the interviews with service managers, focus group
discussions with front-line staff and observations of re-ablement activities conducted
at earlier stages of the study.
2.3.5 Interviews with informal carers of re-ablement service users
Across the five re-ablement sites, carers of service users who had taken part in the
interviews described above were interviewed. The overall aim of the interviews was
to explore informal carers‟ experiences of helping service users and the impact of
home care re-ablement service on the care-giving role. Matching the approach taken
in the service user interviews, specific themes for discussion were generated from
the interviews with service managers, focus group discussions with front-line staff
and observations of re-ablement activities.
See Appendix H for fuller information, including the topic guides used, about the
interviews with re-ablement service users and carers.
2.3.6 Analysis of qualitative data
The data generated from the semi-structured interviews with managers, service
users and carers, focus group discussions and observation visits were analysed
using the framework approach and by a process of data reduction, data display, and
conclusion drawing and verifying (Miles and Huberman, 1994).
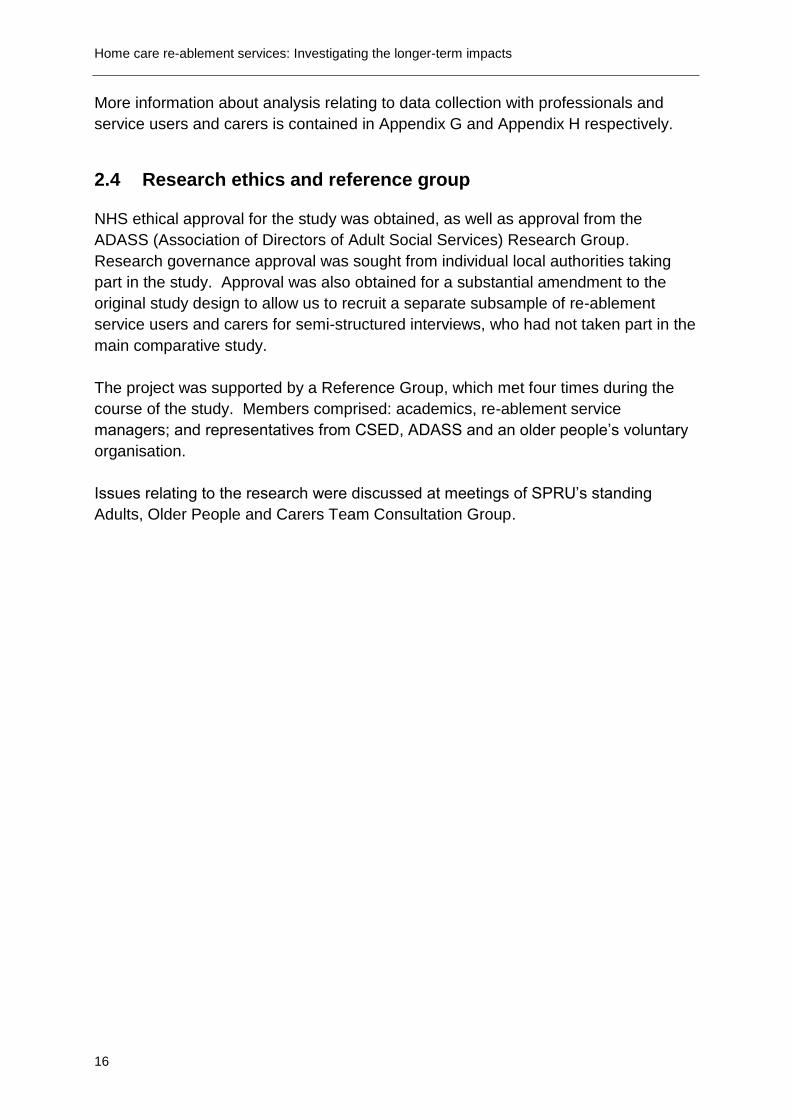
Home care re-ablement services: Investigating the longer-term impacts
16
More information about analysis relating to data collection with professionals and
service users and carers is contained in Appendix G and Appendix H respectively.
2.4 Research ethics and reference group
NHS ethical approval for the study was obtained, as well as approval from the
ADASS (Association of Directors of Adult Social Services) Research Group.
Research governance approval was sought from individual local authorities taking
part in the study. Approval was also obtained for a substantial amendment to the
original study design to allow us to recruit a separate subsample of re-ablement
service users and carers for semi-structured interviews, who had not taken part in the
main comparative study.
The project was supported by a Reference Group, which met four times during the
course of the study. Members comprised: academics, re-ablement service
managers; and representatives from CSED, ADASS and an older people‟s voluntary
organisation.
Issues relating to the research were discussed at meetings of SPRU‟s standing
Adults, Older People and Carers Team Consultation Group.

17
Chapter 3 Characteristics of study samples
Summary
One thousand and fifteen people were recruited to the comparison of re-ablement
and conventional services. The number of people who completed follow-up at 12
months was 241 in the re-ablement group and 141 in the comparison group.
Over 90 per cent in each group were aged over 65 years and were White British
or Irish; approximately 70 per cent in each group were female.
A greater proportion of people in the comparison group had critical or substantial
levels of need than those in the re-ablement group, and a higher proportion was
unable to perform some activities of daily living independently.
The typical period of re-ablement for study participants was about five weeks.
OTs were involved in providing re-ablement support for just under one-third of re-
ablement service users.
Data on the organisation and content of re-ablement services were drawn from
interviews, focus groups and observations in the five re-ablement group sites. In
two sites, senior managers were interviewed alone; in the other three sites, they
were interviewed jointly with an operational manager. Focus groups comprised
37 front-line staff and three OTs; 26 re-ablement visits were observed.
Thirty-four re-ablement service users and ten of their informal carers were
interviewed in-depth about their views of the re-ablement service they received.
The majority of service users had been discharged from hospital, were female,
aged over 65 years, were White British or Irish, and lived alone. The majority of
informal carers were also female, aged over 65 years, and White British or Irish.
None, however, lived alone. Service users had a range of health conditions.
3.1 Introduction
This chapter describes the characteristics of the samples of participants involved in
each part of the study. It begins with response rates and characteristics of
participants in the re-ablement and comparison groups. These study samples form
the basis of the comparative analyses presented in Chapters 6, 7 and 8. This is
followed by a description of the participants in the interviews, focus groups and
observations that provided data for the organisation and content of re-ablement
services described in Chapter 4. The final section describes the samples of service
users and carers who were interviewed about their views of re-ablement services; the
findings from this part of the study are presented in Chapter 5.

Home care re-ablement services: Investigating the longer-term impacts
18
3.2 Re-ablement and comparison groups
This section describes the response rates and characteristics of the re-ablement and
comparison group participants, and the typical re-ablement services they received.
3.2.1 Response rates
One thousand and fifteen people were recruited to the study. Table 3.1 shows the
number of participants completing questionnaires at each stage of data collection, by
study group and individual local authority. Re-ablement study sites are labelled R1 to
R5, and comparison group study sites are labelled C1 to C5.
Table 3.1 Completed questionnaires at baseline, post-intervention and follow-up, by local authority
Baseline (T1) Post-intervention
(T1+R)
Follow-up (T2)
Total in re-ablement group 654 461 241
Local authority R1 132 66 64
Local authority R2 148 118 19
Local authority R3 150 109 81
Local authority R4 41 23 27*
Local authority R5 183 145 50
Total in comparison group 361 n/a 141
Local authority C1 124 n/a 45
Local authority C2 142 n/a 67
Local authority C3 84 n/a 23
Local authority C4 2 n/a 0
Local authority C5 9 n/a 6
* Missing questionnaires at T1+R account for the greater number of T2 than T1+R questionnaires in
local authority R4.
Between recruitment and follow-up at nine to 12 months, 633 participants withdrew
from the study. Of these, there were 74 deaths in the re-ablement group and 44 in
the comparison group. The remainder withdrew for other reasons, such as
(re)hospitalisation or participants‟ deciding they no longer wished to take part.
In terms of client groups, of the information that was supplied by local authorities, the
majority of service users were older (94 per cent; n=677).
All questionnaires were administered by interviewers. The majority were completed
face-to-face, however, 16 participants from local authority R2 completed baseline
(T1) questionnaires by telephone and five completed post-intervention (T1+R)
questionnaires by telephone. All of the follow-up (T2) questionnaires were completed

Chapter 3 Characteristics of study samples
19
face-to-face. Table 3.2 shows the percentage and number of participants who
received help from a carer or other person in completing the questionnaires.
Table 3.2 Participants who completed questionnaires with the help of other people
Baseline (T1)
% (n)
Post-intervention (T1+R)
% (n)
Follow-up (T2)
% (n)
Re-ablement group 28 (154) 26 (117) 15 (36)
Comparison group 33 (114) n/a 21 (30)
Total 30 (268) 26 (117) 17 (66)
3.2.2 Demographics and household characteristics
The mean age at baseline was 80 years in both the re-ablement and comparison
groups. The age of participants in the re-ablement group ranged from 29 to 101
years; in the comparison group, ages ranged from 24 to 101 years. Table 3.3 gives
demographic characteristics and composition of participants‟ households at baseline
for the re-ablement and comparison groups.
Table 3.3 Demographic characteristics and household composition at baseline
Re-ablement group Comparison group
% (n) % (n)
Over 65 years of age 93 (589) 92 (329)
Female 71 (455) 69 (248)
Black or minority ethnic 6 (40) 6 (22)
Widowed 52 (336) 53 (190)
Married/cohabiting 25 (161) 25 (92)
Retired 97 (617) 94 (339)
Lives alone 68 (438) 65 (233)
Lives in privately owned
household
55 (354) 51 (183)
Although there were no statistically significant differences between the re-ablement
and comparison group in any of the characteristics given in Table 3.3, differences
within the re-ablement group were significant for gender (ranging from 82 per cent
females in R5 to 60 per cent in R2).

Home care re-ablement services: Investigating the longer-term impacts
20
3.2.3 Level of need at baseline and 12 month follow-up
Table 3.4 compares levels of need between the re-ablement and comparison groups
at baseline (T1) and 12 month follow-up (T2). Need is an indicator of how dependent
participants are on support. It has been measured in three separate ways: local
authority FACS eligibility criteria; participants‟ inability to undertake certain activities
of daily living (ADLs); and participants‟ reliance on informal carers (living either within
the same household or elsewhere).
As noted in Chapter 1, there are four bands to the FACS eligibility criteria for social
services; critical, substantial, moderate and low. Table 3.4 shows that service users
in the comparison group were statistically significantly more likely to have been
classified as having critical or substantial levels of need than those in the re-ablement
group. This result indicates that people in the comparison group were more
dependent than those in the re-ablement group at baseline (T1). However, this
difference should be treated with caution, as FACS information at baseline was
missing for 52 per cent (n=337) of participants in the re-ablement group compared
with ten per cent (n=35) for the comparison group. FACS level was not available at
12 month follow-up.
Table 3.4 Level of need at baseline and 12 month follow-up
Baseline 12 month follow-up
Re-ablement Comparison Re-ablement Comparison
% (n) % (n) % (n) % (n)
FACS*** n=314 n=326
Critical or substantial 37 (117) 77 (251) n/a n/a n/a n/a
Moderate or low 63 (197) 23 (75) n/a n/a n/a n/a
ADLsa
n=639 n=360 n=241 n=141
Unable to get up or down stairs
57 (358) 62 (221) 45* (106) 58 (80)
Unable to get outdoors/walk down road
76 (477) 73 (257) 42*** (100) 65 (92)
Unable to get around indoors
11* (70) 16 (57) 12 (29) 19 (27)
Unable to get in/out of bed or chair
10*** (63) 19 (69) 11 (26) 14 (20)
Unable to use WC/toilet
11*** (68) 17 (60) 11 (26) 14 (20)
Unable to wash face and hands
8*** (53) 16 (56) 11 (26) 13 (18)
Unable to bath, shower or wash all over
71 (453) 73 (262) 38*** (91) 65 (91)

Chapter 3 Characteristics of study samples
21
Baseline 12 month follow-up
Re-ablement Comparison Re-ablement Comparison
% (n) % (n) % (n) % (n)
Unable to get dressed/undressed
41 (261) 46 (165) 21* (51) 33 (46)
Unable to feed self 4* (23) 7 (25) 6 (15) 6 (8)
Unable to control bladder
35** (223) 44 (156) 30** (72) 47 (63)
Unable to control bowel
17* (109) 23 (83) 18 (44) 27 (35)
Informal carers
n=645 n=356 n=241 n=141
Received informal care from someone in same household
27 (173) 30 (106) 29 (71) 27 (38)
Received informal care from someone outside household
64 (413) 63 (224) 56 (134) 54 (76)
Did not receive any informal care
15 (98) 15 (54) 22 (53) 22 (31)
*p<0.05, **p<0.01, ***p<0.001 a Sample size varies slightly by domain. Largest sample size is presented.
Higher dependency level at baseline among people in the comparison group was
also reflected in the significantly higher proportion unable to perform some activities
of daily living independently compared with those in the re-ablement group. A
greater percentage of people in the comparison group than the re-ablement group
was unable at baseline to undertake all activities except being able to get outdoors
and walk down the road. The greatest statistically significant differences were the
higher percentages of people in the comparison group unable to get in or out of a
bed or chair, and unable to wash their hands and face. By the time of the 12 month
follow-up, people in the comparison group were still less able than the re-ablement
group to undertake all activities of daily living; the greatest statistically significant
differences between the groups had changed to being unable to get outdoors and
walk down the road, and unable to bath, shower or wash all over. The multivariate
analyses presented in Chapter 6 adjust for the higher dependency level among
service users in the comparison group.
There were no statistically significant differences in the level of informal care people
received at either baseline or 12 month follow-up.
Tables 3.5 and 3.6 compare whether people in the re-ablement and comparison
groups began to receive or stopped receiving informal care from within the same or
another household respectively, between baseline and follow-up. There is little
difference in the percentages or direction of change between the groups. The largest

Home care re-ablement services: Investigating the longer-term impacts
22
change was that almost a quarter of people in each group had stopped receiving
informal care from outside their household by the time of follow-up.
Table 3.5 Direction of change in receipt of informal care within the household from baseline to follow-up
Re-ablement
n=236
Comparison
n=139
% (n) % (n)
Started receiving informal care
by 12 month follow-up
10 (24) 9 (11)
Remained the same 81 (192) 85 (118)
Stopped receiving informal
care by 12 month follow-up
8 (20) 7 (10)
Table 3.6 Direction of change in receipt of informal care outside the household from baseline to follow-up
Re-ablement
n=236
Comparison
n=139
% (n) % (n)
Started receiving informal care
by 12 month follow-up
13 (30) 10 (14)
Remained the same 64 (152) 65 (90)
Stopped receiving informal
care by 12 month follow-up
23 (54) 25 (35)
Table 3.7 shows whether people in the re-ablement and comparison groups gained
or lost their ability to undertake activities of daily living between baseline and 12
month follow-up, or whether their abilities remained unchanged. A larger percentage
of people in the re-ablement group than the comparison group gained the ability to
get outdoors and walk down the road; bath, shower or wash all over; and get dressed
or undressed. However, there was little difference in the percentages of people
losing abilities in these domains; the differences arose from greater percentages of
people in the comparison group remaining unchanged in their abilities to perform
these activities. A greater proportion of people in the comparison group gained the
ability to get in and out of bed or a chair between baseline and 12 month follow-up,
and a greater proportion in the re-ablement group lost this ability. Higher proportions
in the re-ablement group both gained or lost the ability to get up or down the stairs.
The multivariate analyses presented in Chapter 6 take account of the higher
dependency level among service users in the comparison group.

Chapter 3 Characteristics of study samples
23
Table 3.7 Direction of change in activities of daily living from baseline to follow-up
Re-ablement
n=234
Comparison
n=140
% (n) % (n)
Ability to get up or down stairs (n=224) (n=139)
Became able by 12 month follow-up 22 (50) 12 (16)
Ability unchanged by 12 month follow-up 63 (142) 78 (108)
Became unable by 12 month follow-up 14 (32) 11 (15)
Ability to get outdoors and walk down the road (n=225) (n=140)
Became able by 12 month follow-up 34 (76) 10 (14)
Ability unchanged by 12 month follow-up 61 (137) 86 (120)
Became unable by 12 month follow-up 5 (12) 4 (6)
Ability to get around indoors (n=228) (n=136)
Became able by 12 month follow-up 6 (13) 4 (5)
Ability unchanged by 12 month follow-up 86 (196) 88 (119)
Became unable by 12 month follow-up 8 (19) 9 (12)
Ability to get in or out of bed or chair (n=231) (n=140)
Became able by 12 month follow-up 3 (6) 7 (10)
Ability unchanged by 12 month follow-up 88 (204) 91 (127)
Became unable by 12 month follow-up 9 (21) 2 (3)
Ability to use the WC (n=234) (n=138)
Became able by 12 month follow-up 3 (8) 3 (4)
Ability unchanged by 12 month follow-up 91 (212) 93 (129)
Became unable by 12 month follow-up 6 (14) 4 (5)
Ability to wash face and hands (n=233) (n=140)
Became able by 12 month follow-up 6 (15) 6 (8)
Ability unchanged by 12 month follow-up 85 (198) 88 (123)
Became unable by 12 month follow-up 9 (20) 6 (9)
Ability to bath, shower or wash all over (n=230) (n=139)
Became able by 12 month follow-up 39 (90) 10 (14)
Ability unchanged by 12 month follow-up 54 (124) 81 (112)
Became unable by 12 month follow-up 7 (16) 9 (13)
Ability to get dressed/undressed (n=230) (n=140)
Became able by 12 month follow-up 24 (55) 11 (15)
Ability unchanged by 12 month follow-up 68 (157) 84 (117)
Became unable by 12 month follow-up 8 (18) 6 (8)
Ability to feed self (n=230) (n=140)
Became able by 12 month follow-up 3 (8) 5 (7)
Ability unchanged by 12 month follow-up 91 (210) 92 (129)
Became unable by 12 month follow-up 5 (12) 3 (4)

Home care re-ablement services: Investigating the longer-term impacts
24
3.2.4 Typical re-ablement support for study participants
The typical period of re-ablement for participants in the re-ablement group who
completed baseline (T1) and post-intervention (T1+R) questionnaires was between
five and six weeks (mean 39 days, 95% confidence interval 36 to 41 days). However,
the minimum duration was less than a week and the maximum 23 weeks. A mean of
38 hours of re-ablement support was received.
Information on the types of professionals involved with the service users during re-
ablement was available for 432 participants. Table 3.8 shows the percentage and
number of participants who received support from each of the main types of
professionals during their re-ablement.
Table 3.8 Professionals involved during re-ablement
% (n)
Re-ablement home care staff 93 (403)
Home care manager 35 (150)
OT 29 (127)
Nurse 19 (84)
Care manager 11 (46)
Psychotherapist 10 (43)
Social worker 8 (35)
Other type of therapist 3 (13)
Other professional* 5 (23)
*Other categories of professional included: physiotherapist; GP; consultant; intermediate care team;
and podiatrist, community response team and “safe and sound man”
Table 3.9 presents the reasons people were referred to the re-ablement services
alongside the reasons people in the comparison group were referred to social care
services. The most common reason for referral in both groups was after discharge
from hospital; however, in the comparison group the percentage of people
discharged from hospital was lower but the percentage referred from the community
was higher than in the re-ablement group.

Chapter 3 Characteristics of study samples
25
Table 3.9 Reasons for referral
Re-ablement group
n=589
Comparison group
n=354
% (n) % (n)
Hospital discharge 75 (442) 55 (193)
First time referral from the community 15 (91) 29 (102)
Discharge from intermediate care 4 (26) 4 (13)
Service user review 1 (5) 5 (19)
Hospital avoidance 1 (7) 2 (7)
Other* 3 (18) 6 (20)
* Other reasons for referrals included: referral from the GP; self or family referral; referral from another
professional; discharge from residential care; and an increase in needs or a crisis such as a broken
arm.
Figures 3.1 and 3.2 show, by site, the percentage of people recruited to the study
after discharge from hospital and referral from the community, respectively. The
figures show some variation between sites within the re-ablement group and within
the comparison group. However, it is important to remember that these figures show
people recruited to the study and do not necessarily reflect all referrals to re-
ablement or conventional home care services in these local authorities. In particular,
sites were asked to try to recruit no more than 50 per cent of participants who were
referred after discharge from hospital; it is impossible to know how far the
percentages actually recruited in each site reflect more or less success in achieving
this aim. In addition, sites C4 and C5 each recruited less than 10 people to the study,
thus the percentage of referrals from hospital or the community are less informative
for these sites than for the others.
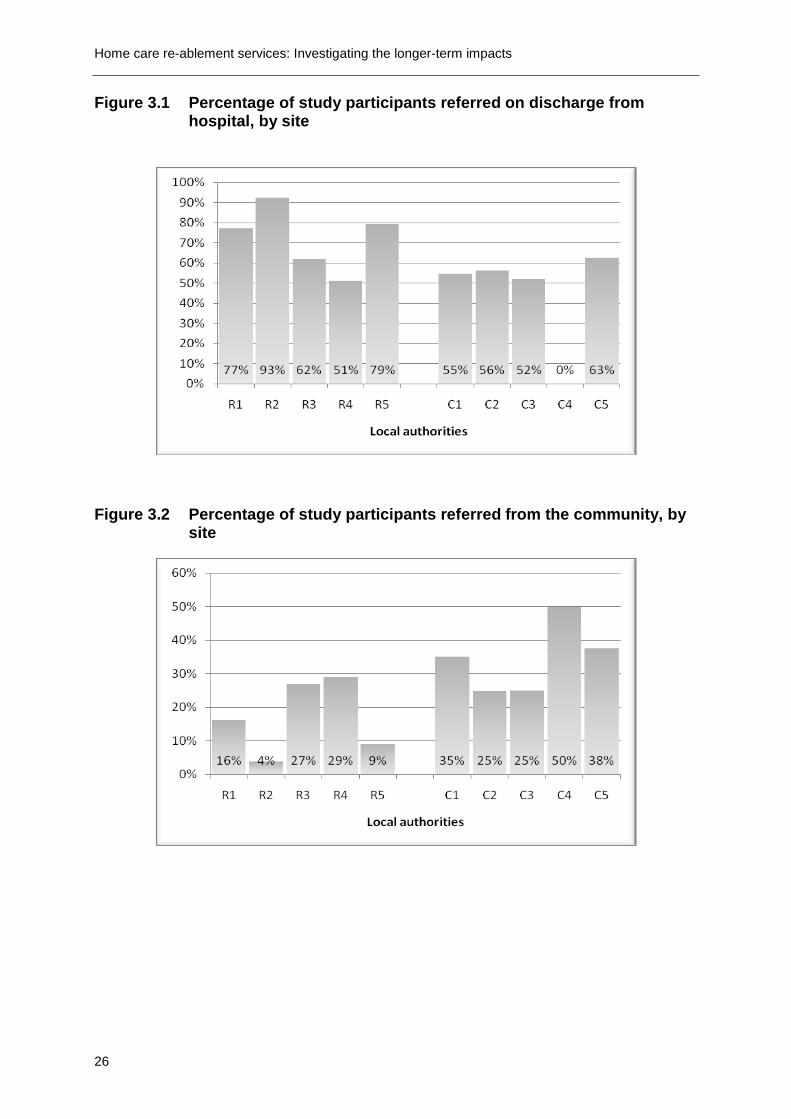
Home care re-ablement services: Investigating the longer-term impacts
26
Figure 3.1 Percentage of study participants referred on discharge from hospital, by site
Figure 3.2 Percentage of study participants referred from the community, by site
Chapter 3 Characteristics of study samples
27
3.3 Service managers and front-line staff
This section describes the characteristics of participants in the interviews, focus
groups and observations that provided data about the organisation and content of re-
ablement services.
3.3.1 Interviews with managers
In each of the re-ablement study sites, the senior service manager was asked to
identify a manager who could be interviewed about the establishment, operation and
outcomes of the re-ablement service. In all five sites, the senior managers opted to
take part in these interviews. In three of the sites, they were joined by an operational
manager.
3.3.2 Observation of re-ablement activities
In total, 26 re-ablement visits were observed across the five sites. Service users
whose visits were observed included: 12 men and 14 women, 25 were aged over 65
years (including five who were over 90 years old); 20 people referred following
hospital discharge and six referred to the service from the community. None of the
service users whose visits were observed were from ethnic minority populations. In
each site, the researcher observed the activities of two different workers - one
experienced and one with less experience of working in the re-ablement service.
3.3.3 Focus groups with front-line staff
Each re-ablement site was asked to organise focus group discussions with up to
eight front-line staff with different levels of experience in the re-ablement service and
one OT, if possible. In total, 37 front-line staff, with between two weeks and eight
years of experience in the re-ablement service, drawn from different teams, and three
OTs (from different sites), took part in these discussions.
Table 3.10 summarises, by local authority, the number of interviews with managers,
the number of observations and the number of front-line staff who participated in
focus groups. Appendix G gives further information.

Home care re-ablement services: Investigating the longer-term impacts
28
Table 3.10 Study samples for the interviews, focus groups and observations
Interviews
n=8
Observation visits
n=26
Focus groups
front-line staff
n=37
Local authority R1 2 6 8
Local authority R2 1 6 6
Local authority R3 2 5 9
Local authority R4 1 4 6
Local authority R5 2 5 8
3.4 Re-ablement service users and carers
This section describes the characteristics of the small samples of service users and
informal carers who were interviewed in depth about their views of the re-ablement
services they received.
Thirty-four service users and ten informal carers were interviewed between April and
June 2010. Table 3.11 summarises the numbers of service users and carers in each
site.
Table 3.11 Re-ablement service users and carers by site
Service users
n=34
Informal carers
n=10
Male Female (Total) Husband Wife Daughter (Total)
Local authority R1 2 5 (7) - 1 - (1)
Local authority R2 3 4 (7) 1 1 - (2)
Local authority R3 2 5 (7) - 1 1 (2)
Local authority R4 3 3 (6) - 3 - (3)
Local authority R5 2 5 (7) 2 - - (2)
Each informal carer cared for one of the service users taking part in the in-depth
interviews. Minor contributions were also made by other carers who helped service
users during interviews, especially those experiencing cognitive difficulties. In one
case, the carer was involved in translating the interview.
The majority of service users had been discharged from hospital. Information on
routes into re-ablement was not provided by the re-ablement teams for all
participants and this was not always clear or consistent in answers received in
interviews. However, approximately 23 had been discharged from hospital, three
from rehabilitation centres and three from respite centres. Two participants reported
that they had referred themselves for re-ablement and one person had been

Chapter 3 Characteristics of study samples
29
discharged from a residential home. Two other referrals were made through a social
worker and a community matron.
Participants had a wide range of health experiences. Many had difficulties related to
multiple health conditions. Specific conditions included stroke, Parkinson‟s disease,
gout and diabetes. Other people had non-diagnosed illnesses of varying severity.
Several people were recovering from medical operations or amputations, and a
number had injuries to limbs due to falls and other accidents.
The sample also included seven people who began re-ablement with specific access
needs; there were three people who were registered as blind, three people with
hearing impairments and one person who had a very limited understanding of the
English language.
The majority of service users were White British or Irish. One participant was
Turkish, one Italian and there was one Black participant. Of the 20 service users
who lived alone, 15 were female and five male.
Table 3.12 shows the main characteristics of re-ablement service users and carers
who took part in the in-depth interviews.
Table 3.12 Main characteristics of re-ablement service users and informal carers
Service users
n=34
Informal carers
n=10
% (n) % (n)
Over 65 years of age 74 (25) 60 (6)
Female 65 (22) 70 (7)
Black or minority ethnic 9 (3) 0 (0)
Lives alone 59 (20) 0 (0)


31
Chapter 4 The organisation and content of home care
re-ablement services
Summary
All five re-ablement services had developed from in-house home care services
and had multiple roles.
Managers/practitioners believed that the greatest benefits of re-ablement are
seen among people recovering from falls or fractures.
User motivation and/or previous receipt of conventional home care services were
thought to create expectations and resistance to change.
A number of other factors were considered important to the success of the
service:
Staff commitment, attitude and skills to encourage and motivate service
users.
A strong and shared vision of the service to ensure appropriate referrals and
discharges.
Flexibility, prompt intervention and quick access to specialist skills to prevent
any delays.
Adequate capacity within long-term home care services to maintain the level
of turnover required by re-ablement services.
4.1 Introduction
This chapter is an abridged version of a much larger interim report published in
autumn 2009 (Rabiee et al., 2009). It presents data collected during January to June
2009 from interviews with senior managers, focus group discussions with front-line
staff and observations of front-line practice in the five re-ablement sites. The
interviews with senior managers focused on the delivery and content of re-ablement
and explored managers‟ views on the factors promoting and hindering the impact of
re-ablement. The focus group discussions with front-line staff focused on staff views
on the factors perceived to promote or constrain the benefits of re-ablement, while
the observation of front-line practice focused on obtaining a first-hand picture of the
practice and process of re-ablement.
Chapters 2 and 3 and Appendix G contain more detailed information about the
research methods and analysis.

Home care re-ablement services: Investigating the longer-term impacts
32
4.2 Key features of re-ablement services in the study sites
4.2.1 Description of services
All five re-ablement services were developed from in-house home care services.
Four sites (all except R2) now operated purely as re-ablement services; in the other
site (R2), re-ablement remained part of the in-house home care service. This
resulted in the home care workers having mixed roles. They worked with service
users who were receiving long-term home care support, and also used the re-
ablement approach for those they identified as having potential to be re-abled. For
additional details of the features of each service see Appendix B.
All five services had started as relatively selective pilot projects, with referrals from
intermediate care, discharge schemes or the community, and gradually broadened
their criteria to become more inclusive and act as „intake‟ services for almost all
adults over 18 years who were newly referred for home care services and who met
local FACS eligibility criteria. The only exceptions were service users who were at
the last stages of their lives or those with severe dementia. In addition, two of the
sites (R1 and R4) did not take people with learning disabilities. However, while all
the services were officially stated to be non-selective, in practice, they all operated a
degree of selectivity. For example, managers in sites R3 and R5 said that they
offered the service to all people, even if re-ablement could only help them achieve
small improvements and (re)learn small skills for themselves (like making a drink).
Managers in R1 reported accepting people for whom they believed they could make
bigger improvements, who would have, after intervention, no further care needs, or
who needed help to settle back at home after hospital discharge. In R2, the manager
said that re-ablement was only offered to service users who were perceived to have
the potential and motivation to be re-abled.
As services developed a more inclusive „intake‟ role, they also adopted multiple
functions with different emphases on individual functions in different sites. In addition
to re-ablement, they provided intensive short-term interventions following hospital
discharge, short-term home care support and extended assessments so that
appropriate levels of long-term home care services could be commissioned.
4.2.2 Re-training staff
All five services had retrained their existing in-house home carers. From the
managers‟ point of view, retraining existing staff had the advantage of minimising
training costs and avoiding delays arising from recruitment or Criminal Records
Bureau (CRB) checks for new staff. The disadvantage was some resistance from
staff who were not receptive to the new way of working.

Chapter 4 The organisation and content of home care re-ablement services
33
The initial re-ablement training took between half-a-day (R5) and two weeks (R4). In
addition, the sites offered various on-going specialist training courses such as
supporting with dementia or visual impairments. In two of the sites, the managers
and more senior re-ablement assistants also received training on how to assess for
minor adaption‟s such as grab rails. The importance of on-going supervision and
mentoring for all re-ablement workers was highlighted by managers and front line
staff in all re-ablement sites. While formal training was important to all workers, staff
who had experience of shadowing more experienced workers found this particularly
helpful in understanding re-ablement and coping with the biggest challenge of
„standing and watching‟.
4.2.3 Skill mix
Managers in all five sites reported that all re-ablement staff had or were working
towards NVQ Level 2 or 3 training and the standard core training skills required by
the Commission for Social Care Inspection (CSCI) for domiciliary care agencies.
They also reported having some staff who had received specialist training in the
delivery of re-ablement to people with dementia. None of the sites offered any other
mental health training. Staff in some sites also had additional training in how to
support people with specific conditions such as visual impairments, MS and cancer.
The role of OTs was highlighted by managers and front-line staff across all five sites.
All the sites required specialist OT assessments for more complex equipment;
however, in a lot of instances the re-ablement workers were able to obtain small
pieces of equipment such as back sponges and gadgets to help put stockings on.
The two sites that operated in partnership with the NHS (R4 and R5) had OTs
embedded in the re-ablement team (R4 also had direct access to physiotherapists
and district nurses); a third site (R3) had negotiated rapid response by OTs to re-
ablement referrals. However, at the time of the interviews, a shortage of OTs was
reported in all sites except R5. This meant that sometimes an OT could not visit until
four weeks after re-ablement had started. This affected the timeliness of service
responses.
Some re-ablement team managers reported tensions, particularly in the initial stages
of service development, between them and professional colleagues within social care
and health teams who questioned the re-ablement teams‟ ability to conduct
assessments which had traditionally been carried out by care managers and health
professionals.
4.2.4 Roles and responsibilities
The majority of teams comprised a home care manager, an organiser/team leader
and home care assistants/workers/re-ablers. All sites except R2 also had a senior

Home care re-ablement services: Investigating the longer-term impacts
34
position between the home care assistants and the organiser/team leader, who was
responsible for monitoring front-line staff and taking on any complicated cases.
4.2.5 Duration of intervention
All five sites offered home care re-ablement services for up to six weeks, with some
flexibility to continue for longer if the user was considered likely to benefit or if
appropriate longer-term services were not immediately available. In general,
managers and front-line staff felt this was adequate time for the intervention. Some
people needed a shorter time to regain confidence; other service users would end
the service themselves when they felt they no longer needed it.
4.2.6 Charging policy
At the time the interviews were conducted, there was uncertainty about whether
home care re-ablement could be charged for. Guidance clarifying the position was
issued by Department of Health on 28 October 2010 (DH, 2010a).
Two sites did not charge for re-ablement at the time the interviews were conducted.
The managers in the other sites noted that although a charge was payable, in
practice people rarely paid because there were often delays in conducting financial
assessments.
In two sites, managers were considering changing their charging policy. In R3,
managers felt that for many people the prospect of paying for something was helpful
in motivating them; on the other hand, not knowing whether charges would be made
for the service could cause unnecessary anxiety. To help avoid unnecessary
distress, managers were thinking of telling new users the maximum amount of money
they might have to pay at the start of the service. The manager in R4 was
considering charging people who had already had six weeks of free intermediate
care.
4.3 Day-to-day organisation of the services
4.3.1 Assessments and referral arrangements
In all sites, assessments were carried out to establish service users‟ eligibility for
home care before referral to re-ablement. On referral, each site carried out further
assessments to identify what the service user wanted to achieve and the areas of
activity for the re-ablement team to focus on. Care/task plans were then prepared.
Setting re-ablement goals in all the sites was said to be a managerial decision
involving one or two senior carers, the service user and occasionally an OT. Informal

Chapter 4 The organisation and content of home care re-ablement services
35
or informal carers could also be involved. All managers highlighted the importance of
service users being involved in goal setting. While front-line staff were not involved in
those initial goal setting tasks, all the managers said the service relied on regular
staff feedback. In addition, all managers noted that more formal reviews took place
at different points within the re-ablement period to further assess the service user‟s
progress. In R1 and R2, there were two reviews within the six week re-ablement
period. R3, R4 and R5 carried out one formal review, between weeks four and six.
The importance of the assessment on first referral to re-ablement was highlighted by
managers in R3 and R5 as a means of accurately capturing changing needs,
particularly in the transition from hospital to home. Once back in the home
environment, it was possible that people may be able to do some things they could
not do in hospital, but may identify other areas where they need support to live
independently, such as help with shopping and/or social activities. Assessment
could be as much about reducing the level of support as about increasing it.
Two managers were particularly concerned about the poor quality of assessments
carried out prior to discharge from hospital: hospital staff made no home visits and
relied on self-reports from service users. This created difficulties for the re-ablement
team as they were under pressure to get people out of hospital and set up
appropriate support arrangements. Managers in R2 and R4 mentioned that referrals
made by hospital and intermediate care on Fridays and late in the day did not give
the care management team sufficient time to assess those service users before
referral to re-ablement. However, the situation was different in R1 as the more senior
(Level 2) front-line practitioners (senior practitioners) were able to carry out
assessments over the weekends. Several senior practitioners said that their
assessments could result in re-hospitalisations, for example when service users were
unable to walk and had not been given any equipment on discharge.
4.3.2 Flexibility over the duration of visits
Unlike conventional home care services, all managers reported greater flexibility in
the length of time for individual visits, which they thought was crucial to the
effectiveness of re-ablement. If a client needed a longer visit than planned, the
worker could call the office to rearrange their next call. Staff in R1 were able to add
value by offering flexibility within afternoon visits, outside core service times. Full
time staff undertook additional „well-being‟ visits – building confidence by walking with
the client to a local shop or consolidating daily living skills by practising making a
drink or sandwich.
The focus group in R3 revealed some apparent inconsistencies in the flexibility the
re-ablement teams were given; in one team, a 30 minute margin was allowed with
each client before staff had to call the office, in another team this was only ten
minutes. In R2 (where re-ablement was part of the in-house home care service)

Home care re-ablement services: Investigating the longer-term impacts
36
almost all front-line staff were critical of the limited time allocated to individual service
users, because this did not take into account re-ablement and motivational work. For
instance, it might take 15 minutes just to encourage a client to get to the bathroom,
but this could be all that was allocated for having a bath. Moreover, although re-
ablement took more time, there was no difference in the time allocated between re-
ablement and conventional home care cases.
4.3.3 Staff rotas
Re-ablement staff worked in small teams so that any one service user saw a limited
number of workers. Minimising the number of carers working with one person was
important both for the quality of the service and for effective communication about
changes in support needs, goals and abilities as users‟ abilities improved. The
number of carers visiting individual service users depended on the frequency and
length of visits, the overall support package and how staff rotas were arranged in the
site.
Some managers reported difficulties in organising staff rotas because most people
wanted to work days and not evenings. In R5, this meant that they had to refuse
some referrals; consequently, that site was introducing a five week rota system
where staff would work four weeks on days and one week of evening shifts.
Managers thought this would be fairer on the staff, give service users more
continuity, and increase service capacity. R4 had introduced a rota system whereby
a team of eight staff supported a group of service users on a four week rota; a worker
would stay with one person for a week and would see him or her again three weeks
later. This rota enabled staff to see the user throughout the day (rather than just
mornings or evenings) and gain a better understanding of how their behaviour and
abilities might change as the day progressed.
Discussions with front-line staff raised queries about whether rota systems worked
equally well for people with mental health problems. Two workers from R2 worked
primarily with mental health service users where each service user saw the same
worker day after day. Both workers said they enjoyed the challenge of such
specialisation and felt this continuity was necessary for people with dementia to
develop trust and confidence in an individual worker; once this was established, they
felt it was possible to achieve significant results. However, they acknowledged the
risk of creating dependency on an individual worker, so that service users became
reluctant to change care provider at the end of the re-ablement period.
4.3.4 Case recording
At the end of each visit, workers were expected to record, in service users‟ folders,
what happened during the visit. All managers said that it was essential for these
records to indicate service users‟ progress in achieving their objectives, what worked

Chapter 4 The organisation and content of home care re-ablement services
37
for them and any staff concerns. All the managers reported anxiety and scepticism
among staff about case recording. They noted that frequent changes in staff rotas,
mainly because of delays in hospital discharges and emergency admissions, made it
more difficult for service users to see the same worker/s every day/week. This
highlighted the importance of having a consistent and thorough recording system to
ensure continuity.
The absence of continuity between workers was apparent in the observation visits.
Many workers appeared to be seeing some service users for the first time, even
though they had been receiving re-ablement services for a few weeks. A number of
service users mentioned that they had no idea which worker they would be seeing
the following day.
While all focus group participants said that they appreciated why it was important to
write notes in service users‟ folders, the observation visits showed some
inconsistencies in the way case recording was done in different sites. Workers
tended to mention what had been done, but not how it was done. Typical examples
of the notes made were: „assisted to dress‟, „assisted to shower‟, „bed made‟, „made
a drink‟, „made a sandwich‟ and „bin emptied‟. In some cases, the notes were no
more than a couple of lines; in others they took a whole page, which could be difficult
for someone new to the case to follow. Sometimes what was recorded did not
include the right information to enable the next worker to build on the progress being
made by the service user.
4.3.5 Communication within and between the teams
Interviews with managers in all five sites revealed that workers and their senior
carers had opportunities to discuss the progress of individual service users on a daily
basis. Regular team meetings were said to be the platform for the managers or
senior practitioners to continue to challenge and embed a re-ablement approach in
workers‟ day-to-day practice. The frequency of team meetings differed, ranging from
weekly (R5) to every six weeks (R2).
All focus group participants spoke very highly about the benefit of team meetings in
helping them learn from each other and keeping them motivated. Most felt effective
communication was particularly important in the early stages of re-ablement, when
they were more engaged in motivation work. Several workers complained about
colleagues who were not using a re-ablement approach and this impacted on the
work of those who were committed to re-ablement. Some staff mentioned that they
had practical difficulties in attending meetings because the timing clashed with their
rotas or they were held outside their usual working hours.

Home care re-ablement services: Investigating the longer-term impacts
38
4.3.6 Discharge and onward referral arrangements
Towards the end of the re-ablement period, all managers reported undertaking a
formal review to decide whether service users needed on-going home care. This
often involved a manager or a senior home care assistant, the service user and
possibly family members. If no further care was needed, they agreed a closure date
and the service user was discharged. Where the service user needed on-going care,
the review identified the appropriate level of support before transferring them to
independent home care providers.
Two issues were reported to affect the discharge process. One was the ability of the
re-ablement team to commission on-going home care services and other support
themselves, rather than having to refer service users back to care managers.
Managers in R3 and R5 reported that they could commission services themselves,
while managers in R2 and R4 referred cases back to care managers to commission
on-going services. In R1, only complex cases (e.g. involving safeguarding) were
referred back to care managers to commission services. The second factor affecting
discharge was under-capacity within independent home care services. In at least
three sites, difficulties in finding appropriate home care agencies to provide support
had led to some service users remaining in re-ablement unnecessarily for several
weeks after completing a period of re-ablement. The handover period in all the sites
was reported to be usually one or two days, but sometimes longer for complex cases.
In terms of referral to other services, managers did not know whether these were
organised through personal budgets or direct payments. Managers felt that their
involvement with service users ended as soon as they were discharged and any
handover period was completed.
4.4 Types of intervention
All the managers said they aimed to achieve similar objectives - to support service
users to achieve their maximum potential for independence and rebuild their
confidence. They aimed to do that by moving away from time - and task - specified
services to flexible services with short-term interventions with the focus on helping
service users to do more for themselves rather than doing tasks for them.
The range of interventions offered was more or less the same across all the sites:
personal care – e.g. assisting with washing, dressing
practical support – e.g. assisting with meal preparation, household duties
prompting medication
information and „signposting‟ – e.g. about library delivery service, Dial-a-Ride
psychological, emotional and personal support – e.g. taking people out for a walk

Chapter 4 The organisation and content of home care re-ablement services
39
increasing social engagements/contacts – e.g. referrals to luncheon clubs, day
centres
advice to reduce the risk of falls.
The observation visits clearly showed that providing equipment such as grab rails,
walkers and trolleys to carry food played a vital role in helping people become more
independent.
There was a consensus among all managers that re-ablement for older people who
had had a fall or fracture focused more on personal care and confidence building; for
younger people, who were considered more motivated to become independent, it
was more about social interaction. Managers in R3 and R5 explained that a lot of
their work was creative problem-solving (sometimes with the help of OTs): trying to
devise different ways of doing things, for example, using a stick to open curtains or a
long handled sponge for back washing.
Managers in four sites noted that re-ablement staff would take people out for a walk
or shopping; this was particularly important for people who had had a fall or fracture
and lost confidence to go out on their own. In one example, a woman who had
fractured her hip wanted to be able to go out on her own again. Over the six week
re-ablement period, she progressed from having two carers accompany her to going
on the bus alone. However, some front-line staff participating in focus group
discussions said they did not know they were allowed to take service users out.
All interviewees agreed that people with dementia or other mental health problems
required different patterns of engagement, where re-ablement mainly focused on
establishing routines while making sure that the care offered was safe and effective.
Some workers mentioned that they expected much smaller achievements for these
service users but once service users got a sense of routine, their self-esteem would
improve and eventually they would need less long-term support.
Front-line staff participating in the focus group in R1 referred to a pilot project in a
local town, involving the re-ablement service. This involved six residential care home
beds for people who had been discharged from hospital but who had such low self-
care capacity that they needed to be admitted to residential care. During the six
week re-ablement period they were looked after by the care home staff, but re-
ablement staff visited to undertake re-ablement activities - this could be in support of
daily living tasks, or confidence building/exercise programmes. Some service users
were said to have returned home within the first two weeks of being discharged from
hospital.
Sites had been asked to try and include service users with a wide range of
experiences in the observation visits. Whilst there was a good variation in the

Home care re-ablement services: Investigating the longer-term impacts
40
sample across all the sites, the characteristics of the service users observed in each
site were not consistent which made comparison between the sites difficult.
Overall, the observation visits showed no noticeable differences between the sites in
terms of what re-ablement workers did. In general, it was surprising to see how
much home care appeared to be done for people in all the sites. While it was not
possible, given the one-off observation visits, to identify any pattern in the service
over the course of the re-ablement episode, the visits revealed no marked
differences between sites in the way service users‟ involvement changed through the
re-ablement „journey‟. Many instances were observed of re-ablement workers asking
„What can I do for you today?‟, „Does your bed need making?‟, and „Are you sure
there is nothing we can do for you?‟. Judging by what had been recorded on service
users‟ files, in a number of cases where the service user was approaching discharge
from re-ablement, the worker was still doing tasks which they or their colleagues had
done since the service had started. This may well have indicated that those service
users may have on-going needs.
However, there were some apparent differences in the extent to which individual
workers involved service users in the tasks they were carrying out. Workers who had
previously spent less time working within conventional home care services appeared
to involve service users a lot more than those with more experience of conventional
home care. This involvement was both in terms of decision-making (e.g. asking
people what they wanted to do today) and hands on, „doing with‟ involvement in
practical activities. For example, they would ask people to wash the parts of their
body that they could manage; or to help with washing up and drying the dishes. In a
couple of cases workers helped service users to use the microwave and watched to
make sure they were doing it correctly. Workers with greater experience of
conventional home care tended to focus on how to improve physical access (such as
suggesting a ramp to remove a high step at a kitchen door and a hydraulic seat in the
bath) and ensuring safety.
A number of the observations conducted in R1 and R5 revealed that the re-ablement
service also provided short-term support to keep the family together. For example, in
one case re-ablement supported a wife who had Alzheimer‟s disease while the
husband, who was her main informal carer, recovered from a broken leg.
4.5 Factors perceived to enhance the success of re-ablement
services
The interviews with re-ablement service managers and the front-line staff focus group
discussions identified a number of factors that participants considered enhanced the
impact and effectiveness of the re-ablement service. While the emphasis on different
factors sometimes varied between sites, and also between managers and front-line

Chapter 4 The organisation and content of home care re-ablement services
41
staff within a site, this section reports the key common themes raised by all those
involved in the discussions.
4.5.1 Service user characteristics
One factor impacting on the effectiveness of re-ablement was who the service was
offered to. Managers and front-line staff agreed that service users likely to show
greatest benefit were those recovering from falls or fractures. Unlike conventional
home care, re-ablement reduced the likelihood of this group of people becoming
used to having tasks done for them and thus helped avoid creating dependency. Re-
ablement was considered less likely to produce significant results for service users
such as people with dementia or other mental health problems who tended to need
on-going support. This did not mean that no benefits could be achieved for these
latter service users; rather, that it was much harder to achieve major improvements in
a short period of time. However, re-ablement could more accurately identify the
scale and nature of the long-term support they needed. Moreover, by focusing on
small targets and establishing a sense of routine, re-ablement could raise their
confidence and perhaps eventually reduce their use of services.
Service users‟ motivation was considered to be another factor influencing
effectiveness. Most participants agreed that „people have got to want to do it‟. The
age of service users was not considered significant. However, some study
participants felt that younger people were more likely to be motivated to maximise
their independence.
4.5.2 The internal organisation and delivery of services
Staff commitment, attitude, knowledge and skills
The commitment, enthusiasm, knowledge and skills of re-ablement front-line staff
were highlighted by both managers and other staff as the most important factors in
the success of home care re-ablement. The ideal re-ablement worker had a good
understanding of the concept and practice of re-ablement, with the skills to motivate
and encourage service users to become as independent as possible. These skills
included observational skills and the ability to stand back and assess service users‟
potential in various aspects of their lives. Other essential skills included working
closely with the service users to identify the support they needed to reach their
potential, building up service users‟ confidence and convincing them that they could
achieve more independence.
All participants emphasised the importance of training and on-going supervision to
reinforce the re-ablement approach in day-to-day practice. Most managers felt that
staff with less experience of working in conventional home care services were easier
to train and found the new approach less challenging. Observations of re-ablement
visits confirmed that newly recruited workers were more likely than retrained staff

Home care re-ablement services: Investigating the longer-term impacts
42
actively to involve users in both decisions and activities. The focus groups with front-
line staff also confirmed managers‟ concerns that nostalgia for the traditional role of
home carer and difficulties in adjusting to a new role were more pronounced among
people with extensive experience in conventional home care services. However,
those who had been working in a re-ablement team for longer said that seeing the
differences the service had made to the quality of some people‟s lives had increased
their job satisfaction and made them realise how disabling their previous practice had
been. A few managers confirmed the increased job satisfaction experienced by
some front-line staff. In one site, a decrease in sickness absences among re-
ablement workers was reported.
The staff focus groups revealed that retraining activities were not always adequate.
Many workers referred to their job as „standing and watching‟ and it was not clear
whether they all appreciated that observation was part of the assessment process
and an important job in itself; while „standing and watching‟, staff were expected to try
and identify service users‟ capabilities as well as motivating and encouraging them to
take more control of their lives where they could.
Flexibility and prompt intervention
All study participants agreed that re-ablement was a more dynamic process than
conventional home care services. Because re-ablement is intended to be a short
and focused programme, any delays could constrain its impact and duration.
High quality assessment at the start of re-ablement was considered essential in
setting up appropriate support arrangements. On-going assessment during the
period of re-ablement was also important to enable the team to identify new targets
as people‟s abilities improved.
The importance of flexibility over the timing, duration and content of home visits and
the ability to adjust inputs quickly in response to improvements in users‟ abilities, was
highlighted by all participants. In site R2, workers reported that they did not know
which service users were receiving conventional home care and which had been
referred for re-ablement. Because front-line staff were working with two approaches
in that site, with very little time for flexibility over visits, staff were more likely to take a
conventional approach, which took less time, with all their service users.
Access to equipment and specialist skills in the team
Rapid provision of equipment such as grab rails or walking frames was considered a
major part of re-ablement services. Having quick access to OTs to ensure
equipment could be obtained promptly was considered to be more important than
having OTs embedded in the team. Training for front-line re-ablement workers on
how to assess for minor pieces of equipment was said to help prevent some
unnecessary delays. Having access to a variety of specialist skills in the team could

Chapter 4 The organisation and content of home care re-ablement services
43
enable the service to extend its capacity to work more effectively with a wider range
of users, for example people with dementia and other mental health problems.
4.5.3 Expectations of services
There was a consensus among front-line staff across all sites that re-ablement
worked better for people newly referred to adult social care. Previous receipt of
conventional home care services could create unhelpful expectations and resistance
to change. Service users who were considered least responsive to re-ablement were
those with a long history of using conventional home care (either from local authority
in-house social services or the independent sector), because they were more likely to
expect things to be done for them. Some staff felt that service users‟ resistance to
re-ablement could be linked to the charges users thought they had to pay for the
service, reporting consumerist attitudes of „I pay your wages, you do that for me‟.
Family members were also sometimes considered resistant to re-ablement,
preferring styles of intervention that minimised risk to older relatives. They wanted
the reassurance of knowing their elderly parents were being looked after, sometimes
despite the wishes of the older person to retain their independence. Most front-line
staff thought that explaining the aims of the re-ablement service to both service users
and carers prior to their first visit could significantly help manage service users‟
expectations and overcome informal carers‟ perceptions of risk.
4.5.4 Wider environment
There was widespread agreement among all participants that the success or failure
of re-ablement also depended on several factors external to re-ablement services.
A strong and shared vision of the service
One of the most important success factors for re-ablement services was thought to
be the extent to which everyone in the wider environment - re-ablement team, social
services care managers and NHS staff - had a shared understanding of the aims and
objectives of the service. Some managers felt that there was a danger for the
service to be misused. Pressures came from care managers who used the service
as a way of supporting people who could not benefit from re-ablement, because no
other services were available. Managers in R5 noted that at the end of the re-
ablement period about ten per cent of service users returned to hospital and this
indicated the inappropriate nature of some referrals.
Access to specialist skills
Having close relationships with, and quick access to, professionals and skills outside
the re-ablement team was considered another factor affecting success. It enabled
re-ablement services to accept a wider range of people and sometimes also
discharge people more effectively. Of particular importance was quick access to OTs

Home care re-ablement services: Investigating the longer-term impacts
44
and physiotherapists. Other professionals outside the team to whom rapid access
was said to be crucial included care managers, hospital social workers, district
nurses, continence advisors, community matrons and specialists for visually impaired
service users.
Capacity within long-term home care services
In order to maintain the level of turnover required by re-ablement services, all
managers and front-line staff thought it essential that service users requiring on-
going support should be discharged promptly so that capacity to accept new referrals
was maintained. However, all five sites reported shortages of capacity within the
independent home care sector that significantly limited the speed of service users‟
discharge from re-ablement.
In R3, measures had been taken to stimulate capacity within independent providers
in rural areas to prevent delays in referral for on-going home care services. These
guaranteed provision in those areas where travel times might be as much as, or
greater than, the call time. Managers in R3 had also decided to re-categorise those
service users who were technically discharged from re-ablement as „awaiting
transfer‟ and continue their involvement until an agency was found. This not only
signalled to senior managers within the department the shortage of independent
sector home care services, but also prevented users who were ready for discharge
from remaining „hidden‟ within the service. In addition to shortages in capacity within
long-term home care services, there was widespread concern among most
managers that as soon as service users were handed over, long-term care services
could „undo‟ the work of re-ablement by doing things for people again.
4.6 Discussion and conclusions
This chapter reports findings generated from interviews with managers; observations
of front-line practice; and focus group discussions with front-line staff, in five
established re-ablement services.
A common feature of the five re-ablement services was their multiple roles, with
different levels of emphasis on short-term intake and assessment functions; re-
ablement; short-term home care support; and short-term intervention following
hospital discharge. While all these functions are legitimate and reasonable, given the
ways in which services have developed, some may have less visible or measurable
impacts than others. For example, where the intervention is primarily assessment, or
the provision of emergency short-term home care, it is likely that some service users
will leave the service with the same level of care needs as on entry.
Furthermore, as services have developed a more inclusive, 'intake' role, accepting
most or all new referrals for home care support, they have come to accept an

Chapter 4 The organisation and content of home care re-ablement services
45
increasing proportion of service users with more limited potential to become
independent. There was consensus among all participants that the greatest benefits
of re-ablement are seen among people who are recovering from falls or fractures. In
comparison, people needing on-going support are less likely to demonstrate
significant improvements in independence. Similarly, study participants believed
there was less chance of re-ablement showing increased effects for people who are
not motivated to become independent or who have long experience of conventional
home care services, as their expectations of having tasks done for them could thwart
the efforts of re-ablement workers. All these factors suggest that the outcomes of re-
ablement services are likely to be considerably diluted for certain service users.
Most participants agreed that small changes could nevertheless be achieved even for
people with dementia or who need on-going care and those changes may mean a lot
to them. In addition, re-ablement could have more far reaching impacts on those
people‟s lives, by raising their confidence and giving them a sense of routine, which
could eventually reduce their use of services.
Given that re-ablement is a short, focused intervention, flexibility and prompt
responses to service users‟ capabilities as they change are crucial in ensuring that
valuable time is not wasted. Organising work in teams, frequent team meetings,
regular supervision continually to review service users‟ progress and opportunities for
specialist training of workers were among the steps taken, to different degrees, by all
sites in organising re-ablement services. However, in practice there were certain
restrictions on the five services that made it difficult for those services to work more
flexibly. One of the biggest challenges for sites was having quick access to
equipment and a range of professional expertise, in particular OTs. Difficulties with
accessing OTs could seriously delay service delivery and service users‟ progress.
While there was some evidence to suggest that services organised in partnership
with the NHS gave re-ablement services better access to a range of professional
skills, in practice what was considered to be more important was having adequate
and rapid access to OTs and other specialists rather than having those professionals
necessarily embedded in the re-ablement team.
The importance of re-ablement being an 'attitude' or an 'approach' came through very
strongly in the managers‟ interviews; staff needed skills to motivate and encourage
service users to become as independent as possible. However, observation visits
revealed that time pressures on front-line staff sometimes made it difficult for them to
be creative and motivating. This was particularly the case where re-ablement was
not a separate service (R2) and where the time allocated for visits did not take into
account the motivating element of workers‟ roles. This highlights the significant role
of re-ablement training/retraining, supervision and team/peer support to reinforce the
re-ablement approach and ensure staff are kept well informed and motivated.
While all managers interviewed demonstrated commitment and enthusiasm to take
forward the development of the re-ablement service in their sites, it was clear that

Home care re-ablement services: Investigating the longer-term impacts
46
they could not do this in isolation. Achieving the potential of re-ablement depended
not only on the internal organisation and delivery of those services but also external
factors, including access to specialist skills; strong vision and leadership among all
professionals; and capacity within independent sector home care providers.

47
Chapter 5 The experiences of re-ablement service
users and informal carers
Summary
Many service users did not start the service fully understanding the principles of
re-ablement, creating uncertainty about what the service could provide and what
would be expected of them. This was especially true for those living alone. Given
common experiences of pain and/or confusion at the start of re-ablement, there is
a need to remind service users and their carers of re-ablement principles and the
likely duration of the service. There is also a need to remind service users and
carers of the goals of person-centred planning throughout the service, particularly
as many interviewees believed that the content of the re-ablement service was
not open to negotiation.
In support of the findings from managers and staff interviews, interviews with
service users reveal that, across the sample, service users with non-progressive
health conditions and optimal opportunities for recovery reported greater progress
towards independence.
One of the greatest reported benefits of re-ablement was the company provided
by workers during re-ablement visits, with many service users feeling motivated
by their relationships with re-ablement workers and the encouragement provided
by the workers.
Boosted by the re-ablement workers‟ capacities to provide encouragement,
service users were frequently aware of the improvements in their self-care skills
and mobility, and these had benefits for their morale and confidence.
The experiences of informal carers varied, but most believed they had gained
from the service users‟ re-ablement. Benefits included reductions in stress;
increased (if temporary) opportunities for time that could be spent on non-caring
activities; and advice and information, including learning about new ways of
managing care.
People with sensory impairments and limited fluency in English lacked basic
information and seemed to gain few benefits from re-ablement.
Service users who lived alone appeared to experience re-ablement differently,
with significant unmet needs for social contact, fewer opportunities for emotional
support, increased needs for help with housekeeping and shopping and greater
anxieties about coping on their own after re-ablement. Where it was provided,
help with shopping and housework was highly valued by people living alone.

Home care re-ablement services: Investigating the longer-term impacts
48
Despite the fact that increasing social engagement and contact was said, by the
managers, to be one of the key interventions of re-ablement increasing users‟
social contacts outside the home was rarely addressed by re-ablement services.
Assistance towards meeting service users‟ needs for social contact was a highly
valued means of increasing independence, particularly for those living alone
Supporting the opinions of managers and staff, the views of service users and
carers demonstrate that re-ablement would be enhanced by an extension of
support in several areas including stronger links with physiotherapy and
occupational therapy. This will help with improving mobility outside the home and
increasing social contact, and the provision of advice/information for meeting
these needs. Service users could work towards goals of increased mobility more
easily with greater input from physiotherapists, and encouragement and
supervision from re-ablement workers for physiotherapy exercises.
5.1 Introduction
This chapter report‟s findings from semi-structured interviews with 34 service users
and ten informal carers in the five re-ablement services that took part in this study.
Details of the selection and characteristics of the sample are included in Chapters 2
and 3, and Appendix H. As reported there, these individuals did not participate in the
comparative study. It is possible that re-ablement practice may have further
developed since the observation work (reported in Chapter 4) was undertaken.
The interviews were conducted towards the end of the service users‟ period of re-
ablement, after they had had sufficient time to experience the service but before they
were discharged from re-ablement and/or started to receive any longer-term support
from conventional home care services. The timing of service user interviews was
important, in order to avoid any confusion on the part of interviewees between former
care provision, re-ablement and any on-going home care services they may
subsequently receive.
The interviews explored service users‟ expectations, experiences and felt benefits of
home care re-ablement and identified any outstanding unmet needs. Interviews with
informal carers, some of whom were related to the service user interviewees,
focused on their role in the re-ablement process and any changes in the level of help
they gave the service user.
5.2 Understandings and expectations of re-ablement
Knowledge of re-ablement services, goals and processes varied considerably among
service users and their carers. In some cases, service users knew nothing about re-
ablement until after they were discharged from hospital or rehabilitation services and

Chapter 5 The experiences of re-ablement service users and informal carers
49
referred to adult social care for post-discharge support. Several service users
reported learning about the service from their visiting re-ablement workers; one
person was informed by letter after hospital discharge.
Whilst many service users had received written information about re-ablement,
several commented that they had not read it. A few service users and carers said
they had learned about re-ablement from friends who had received it. This seemed
to be a useful source of information and a valuable and trusted form of advice,
particularly where initial communications had been overlooked, mislaid or forgotten.
Few service users had any previous experience of home care – re-ablement or
conventional - except for those who had cared for relatives in the past. A number of
interviewees had had more than one experience of re-ablement services, following
different periods of hospitalisation. Although some service users and carers would
have liked more help with personal care and practical tasks there were no
unfavourable comparisons made between re-ablement and conventional home care
services, despite the identification of several areas of unmet need.
All the service user interviewees knew which tasks and activities they would receive
help with from their re-ablement service and how many visits they would receive
each day or week, although three service users (from different sites) were not clear
that re-ablement was a time-limited intervention. Many participants referred to the re-
ablement workers as „carers‟; two service users, in different sites, referred to them as
„nurses‟, implying a general expectation of care rather than re-ablement.
Only a few service users knew what re-ablement meant, reflecting a limited
understanding of re-ablement goals. Although most service users expressed distress
or frustration at the loss of their former independence and seemed highly motivated
to regain more autonomy, only a small proportion of people linked their motivations
towards independence to the processes and goals of re-ablement. In one site,
knowledge of re-ablement goals was disproportionately higher, with five of the six
service user interviewees reporting having being told that they were expected to
progress and become more independent (R1). Conversely, in another site (R5), a
disproportionately low number of people knew about the goals of re-ablement; here,
service users tended to learn about re-ablement indirectly in the course of receiving
the service.
For many of the service users who were told about re-ablement while they were still
in hospital, confusion about their initial referral to re-ablement was common. Many of
these people were unsure who had spoken to them and what had been said. This
was especially true when they were preoccupied with the traumas and anxieties of
pain and illness, resulting in limited memory of the referral and an incomplete picture
of the service. Several service users were also confused by the large numbers of
health and social care professionals who had visited them over recent weeks. Where

Home care re-ablement services: Investigating the longer-term impacts
50
informal carers were closely involved in the planning and delivery of the re-ablement
service, these uncertainties were occasionally resolved by information passed on by
relatives. Otherwise, carers‟ knowledge of re-ablement was largely determined by
how much the service user knew.
In many cases, the timing and delivery of initial information about re-ablement
resulted in a lack of clarity for service users. Although many service users were not
in a receptive state when they were told about re-ablement, there were instances
where the information reportedly received was insufficient. One service user said
that she did not take up an initial offer of re-ablement, as it was communicated to her
as a „glancing comment‟ (R5). She contacted the service a few weeks later and
received re-ablement for the remainder of the six weeks following her discharge from
hospital.
Where the aims of re-ablement had been effectively communicated and understood,
service users often expressed enthusiasm for the opportunity to be involved in
improving their health and independence. One service user who had herself retired
from a career in home care was delighted at the emphasis placed on rehabilitation.
Her knowledge of, and enthusiasm for, re-ablement prompted her to join a patient‟s
panel to influence local health and social care services, since she believed that the
promotion of re-ablement options was inadequate and failing to reach many people
who could benefit from it (R4).
Enthusiastic dispositions towards the principles of re-ablement were more commonly
found in those with short-term difficulties such as broken bones or non-progressive
health conditions, where opportunities for recovery were optimal. Although
awareness of re-ablement principles was varied, most interviewees spoke of care
packages and of OTs‟ needs assessments being focused on their capacities for
„management at home‟, rather than holistic concepts of independence or social
inclusion.
Some interviewees had begun their re-ablement expecting more conventional home
care support, but gradually became aware of a shift in emphasis to doing more for
themselves. Some service users reported initial reluctance, one woman saying she
had „feebly given in‟ (R2) to re-ablement workers‟ requests that she should try things
for herself. Such service users often went on to appreciate the benefits of progress
and this mitigated initial disappointments or fears. Some users remained confused
about the reasons for the re-ablement visits, despite the reassurance they expressed
for feeling „checked in on‟ on a regular basis. One such man, living alone and aware
that re-ablement included on-going assessment, seemed bemused by the daily
record keeping. He questioned the value of entries in his care records such as „Mr X
opened the door and let me in‟ saying „and I thought to myself, well I‟ve got to open
the door to let you in, but she couldn‟t see that‟ (R5).

Chapter 5 The experiences of re-ablement service users and informal carers
51
Interviewees with more debilitating conditions such as Parkinson‟s disease, and
some people recovering from strokes, tended to know less about the principles of re-
ablement and were more likely to expect the service to meet their personal care
needs. One woman who had been referred from a stroke rehabilitation centre said,
somewhat typically: „I didn‟t understand all of it. I don‟t suppose anybody - I was just
told I‟d get a carer coming in, in the morning, to come and help me get washed and
dressed‟ (R4).
The majority of interviewees expected that they would receive assistance with
personal care and basic food preparation (such as making tea, toast or sandwiches)
where necessary. Most people believed help with shopping and cleaning was
beyond the remit of re-ablement workers, though this was a clear source of concern
for many service users, particularly those living alone. Some interviewees reported
having read information which was at odds with the re-ablement help they were
given; one man had read that shopping was „on offer‟ but was told that the re-
ablement workers were not allowed to do this for him (R5).
Overall, most interviewees were aware of the aims of the service. They understood
that the service was to help them recover from recent or long-term health conditions
and reduce the need for further hospital stays or residential care. Some people
regarded re-ablement primarily as a source of respite and practical and emotional
support for informal carers. A few people experiencing distress due to pain or
loneliness seemed more confused about the reasons for their re-ablement. One
woman did not know why she had been referred and she guessed that her care may
have been precipitated by complaints from other people in her local community; she
expressed strong feelings of stigma which she linked to a series of social or domestic
occasions where she had been excluded or humiliated on the basis of her
incontinence problems (R5).
Six interviewees had not been referred from hospitals or rehabilitation centres and
their knowledge of re-ablement was varied but low, not extending beyond their
expectations of conventional home care, despite the expression of any personal
aspirations for greater independence.
However, knowledge of re-ablement services was particularly poor on the part of
service users who did not speak fluent English, or who had visual or hearing
impairments. This lack of accessible information compounded problems common to
all participants. The puzzling array of staff involved in delivering services before and
after hospital and intermediate care discharges led to confused understandings about
the roles of different providers and their services, occasionally leading to uncertainty
about the differences between re-ablement workers and other visiting professionals.

Home care re-ablement services: Investigating the longer-term impacts
52
5.3 Relationships with re-ablement workers
Across the five sites, there was widespread praise from service users and carers for
the front-line re-ablement workers; criticisms were rare. Many positive references
were made to the skills, attitudes and commitment of re-ablement workers, and these
often contrasted with interviewees‟ initial expectations. For example, a few people
referred to the skills of workers in blending care, practical skills and appropriate
emotional support. Some service users expressed surprise that they were entitled to
any form of home care and welcomed opportunities for recovery in their own homes.
This was especially true where people were recovering from injuries and operations,
where optimal recovery was expected. Several service users expressed gratitude for
the service when they would otherwise have had no option but to remain in hospital-
based intermediate care.
At the end of each interview, service users and carers were asked to summarise their
experiences of the re-ablement service. Most people replied with direct references to
the front-line staff, describing them as „Excellent‟, „Very helpful‟, and „Brilliant‟. One
man, who had previously observed the nursing care provided for his wife in their
home (before her death), commented „I was prepared for the worst and I got the
best‟. (R4)
Most service users and carers said that there were few differences in the quality of
different re-ablement workers. Some service users expressed a preference for
particular workers as they had built up good relationships with them and found their
cheerful and encouraging dispositions especially motivating. One woman pointed out
that a re-ablement worker who had a particularly „jolly‟ disposition took „the steam out
of it a little‟ and was the one member of the team who persisted with her efforts to
help her walk. Her husband/carer agreed that this re-ablement worker‟s assistance
had been particularly helpful to them both (R1).
Other service users commented on the helpfulness of proactive workers, several of
whom had recognised areas of unmet need and offered extra help or information
which had made valuable differences to their lives. Examples included a re-ablement
worker who had offered to help a man who was proud of his self-sufficiency to wash
himself in the bath when he recognised that he had difficulties in bathing, whereas
the other workers had followed clearer re-ablement practices of observation and
encouragement (R5). Although few re-ablement workers were reported to have been
involved in the provision of equipment, one front-line worker (in R1) alleviated
considerable discomfort and extra domestic work by recommending the use of a
Conveen (incontinence sheath).
Nearly all service users and carers said that their re-ablement workers worked
together well as a team and passed on information between them. Interviewees
appreciated that the workers kept them informed about who would be visiting on

Chapter 5 The experiences of re-ablement service users and informal carers
53
subsequent visits. Where possible, interviewees appreciated a small number of
familiar people visiting them, as this meant they did not have to keep repeating the
same information to different workers.
Where negative comparisons were made between team members, these usually
related to differences in levels of friendliness and emotional support, or to the
reluctance of some re-ablement workers to do tasks which others were happy to
undertake. A few service users reported being perplexed by decisions about the
tasks that re-ablement workers would and would not undertake, such as being willing
to make tea and toast but not boil an egg (R3). A few service users, from different
sites, indicated that there were some discrepancies in the application of re-ablement-
centred approaches. One service user said that some workers would push him a
little further but others would say „No, no, don‟t do it yet” and so that breaks down
and we‟re back to square one‟ (R2).
Complaints about re-ablement workers were rare and usually restricted to individual
styles of personal care-giving, e.g. washing someone too roughly or ineffectively
through „cat licks‟. However, the few reports of poor quality care could cause
considerable distress. One woman needed help with making her bed (which she
could not do for herself) and felt uncomfortable asking some workers, causing her
anxiety and some sleepless nights (R5). On the infrequent occasions that people had
made complaints about a re-ablement worker, this had usually been dealt with
sensitively by sending different workers.
However, many service users and carers expressed frustrations about waiting
several hours after the scheduled time, especially for morning visits that delayed their
„start to the day‟. There were also a few complaints about evening visits being
scheduled too early, especially from those who needed help to get into bed. Most
people who complained of delays were aware that this was an organisational issue
and expressed sympathy for the pressures of re-ablement workers‟ workloads.
Some interviewees expressed worries about re-ablement workers‟ welfare, as they
believed them to be working in adverse circumstances with insufficient support and
information. Chief amongst their concerns were the numbers of hours they worked;
their personal safety in the evenings; and the number of tasks they had to undertake
in short spaces of time. Linked to these concerns, some service users were critical
of the management of re-ablement workers. Although people appreciated being able
to contact staff at „unsocial‟ hours, several believed that managers‟ responsiveness
should be improved to enhance re-ablement workers‟ conditions and service users‟
welfare. A few people complained that re-ablement workers had been sent on
unnecessary „wild goose chases‟, visiting people who had been readmitted to
hospital and that managers were slow to reinstate services when they were
subsequently discharged.

Home care re-ablement services: Investigating the longer-term impacts
54
Some service users made comparisons between re-ablement services and the
independent home care agencies that provided longer-term domiciliary care. They
included two former re-ablement service users who had moved on to independent
home care agencies at the end of their period of re-ablement, and two who had
received both re-ablement and conventional home care from an independent agency
in the past, or who were aware of the differences between them from friends. With
one exception, strong preferences were expressed for local authority re-ablement
teams. It was believed that local authority re-ablement teams were less overworked
and that independent agency workers had less time for engagement with service
users‟ needs.
One woman, with limited English, was critical of the re-ablement team and framed
her complaints in terms of cultural insensitivity (R2). She had been referred to re-
ablement services a number of times in the previous year and had cancelled them on
every occasion due to difficulties in communication and cultural difficulties in
approaches to personal care. She reported that there was only one worker in the re-
ablement team who had any understanding of her cultural needs. Clearly frustrated
with the service she had received, she had requested a referral for help from her
local community centre a number of times, believing it to be more appropriate in
meeting her needs, but was told she had to complete a period of re-ablement before
this could happen.
Such experiences were rare, however. Most service users enjoyed the re-ablement
workers‟ visits. They were valued as a reassuring presence and helped service
users feel safer; many people said that they would miss their workers‟ visits. There
were clear links between the friendly relationships between workers and service
users and users‟ motivation to make progress. However, the quality of the
relationships that developed could also cause additional anxieties about the end of
re-ablement.
5.4 Negotiating re-ablement care and re-ablement goals
Most service users said that they remembered little or no input into determining the
content of their re-ablement service, other than assessments of their physical
capacity and home environments. Few people recalled any active involvement in
setting re-ablement goals. This may have been exacerbated by the common
occurrence of pain or trauma and consequent confusion at the beginning of re-
ablement in some cases. Many interviewees believed that the content of the re-
ablement service was not open to formal negotiation. On a few occasions, people
complained that they received negative responses to requests for changes in the
content of their care. Only two service users, both of whom had previously had
careers in social care, spoke about collaborating in decisions about the content of

Chapter 5 The experiences of re-ablement service users and informal carers
55
their re-ablement service; their requests being met (e.g. for extra time); and their
subsequent satisfaction with what was provided (R2 and R4).
When asked whether and how they had been involved in negotiating the content of
their re-ablement intervention, service users and carers tended to interpret
involvement in terms of daily tasks or needs and their relationships with re-ablement
workers, rather than preliminary or on-going reviews of re-ablement needs. On a
day-to-day basis, most people felt they could ask for help with additional tasks, over
and above the agreed re-ablement plan. They had plenty of opportunities to make
requests for extra support, but most people said they did not feel the need to do so.
Where changes to the agreed care plan were sought, this was usually for supervision
of tasks which they felt were hazardous; direct help to perform tasks on a service
user‟s „bad days‟; or the cancellation of a visit when it was considered unnecessary.
Although many service users and carers reported negligible amounts of formal
participation in the establishment of re-ablement care or goals, some of them
commented that „chatting‟ to re-ablement workers on a daily basis provided valuable
opportunities to address areas of unmet need in a relaxed manner, reinforcing the re-
ablement process.
Most service users believed that activities aimed at increasing their social contacts or
ability to get out of the home were beyond the remit of the re-ablement service,
despite the fact that some people experienced considerable difficulties in these
areas. There were several examples of carers‟ involvement in the re-ablement
process, both in the initial decisions about the content of the service and in daily
interactions with re-ablement workers. In two instances, the content of the re-
ablement intervention was designed with the carer‟s needs as a crucial factor. In two
other examples, from different sites, the re-ablement service was provided for both
husband and wife. Where they were actively involved in their parents‟ care,
daughters and sons were sometimes consulted. This helped communications with
service users and enabled relatives to provide on-going assistance with re-ablement,
especially where service users had limited capacity to act beyond the satisfaction of
their immediate needs for personal care and nourishment. Common examples
included the carer‟s roles in continuing re-ablement routines, liaison with other
services and the resolution of barriers or conflicts.
A few service users said that they had been encouraged to set re-ablement goals by
physiotherapists or OTs before re-ablement started. Three people, two in R1 and
one in R4, talked enthusiastically of progress made with aims to walk further,
objectives which had been set at the beginning of re-ablement, aided by re-ablement
workers. Whilst re-ablement goals gave service users clear aims and enhanced
some people‟s motivations to become more independent, they could cause
frustration if a lack of help or other resources obstructed opportunities to progress.
Occasionally goals were set which were not acted upon by re-ablement workers.
Two service users and their carers complained that their primary re-ablement goal, to

Home care re-ablement services: Investigating the longer-term impacts
56
walk, was thwarted by the lack of regular physiotherapy since discharge from hospital
(R1). Another person‟s goal of increasing his self-reliance and personal dignity in
using the toilet was obstructed by access problems in his own home and uncertainty
about whether he would receive adaptations (R4).
Where service users recalled involvement in setting their own goals, these appeared
to be highly motivational in encouraging people to attempt to do more for themselves.
Despite his fears of falling, one man set himself the goal of improving his walking so
that he could make a journey of emotional significance to a place which held fond
memories for him (R1). Crucial to his progress, the re-ablement workers
accompanied him on these walks. Several service users said they found feedback on
their progress very motivating. Conversely, another service user (R2) was very
frustrated that she had not left the house since her discharge from hospital,
especially as her main priority was to begin walking outside her home. She reported
a meeting with a physiotherapist where she has been asked „What do you want to
aim for that we can help you do?. Her reply was „Go out. Go outside‟ (R2). When
she asked for help from re-ablement workers in pursuit of this goal she was refused,
which led her to think this was outside the remit of the service.
Evidence of re-ablement services being unable to help users achieve desired goals
seemed particularly common for those who wanted to improve their walking ability
outside the home. Commonly, users assumed that the re-ablement service could not
help with re-establishing or increasing social contacts or in realising desires to get out
of the house. A few instances were reported, where a goal of increasing social
contact had featured in the re-ablement service agreement, but there was little
evidence of help in this area. People who lived alone with limited or no informal
support experienced a considerable degree of loneliness without these social outlets.
This was likely to affect their reliance on re-ablement workers as a crucial source of
company and exacerbate feelings of loss and uncertainty at the end of the re-
ablement period.
5.5 Re-ablement activities and interventions
Some service users and carers preferred re-ablement workers to provide a more
conventional home care service, particularly in the early stages of re-ablement when
physical difficulties or pain were more acute. Where the principles of re-ablement
were understood, the majority of interviewees welcomed or accepted a more
observational and encouraging approach, despite some initial reluctance. Most
service users, regardless of their health condition, emphasised how important their
independence was to them.
Many people had help with personal care and, with few exceptions, this was
gratefully received as a crucial start to the day. Most service users thought they had

Chapter 5 The experiences of re-ablement service users and informal carers
57
made excellent progress with washing and dressing, which often motivated them to
try and do more in other areas. Some people needed help with getting up and going
to bed, a service which was seen as invaluable to both service users and carers.
Several carers expressed concern about their inability to help with these tasks,
especially when a hoist was necessary.
Service users were often disappointed about the changes to their eating habits that
were required when they became less able to cook for themselves. Help with food
preparation was provided for some people, but this was usually limited to making
toast and tea for breakfast or a sandwich for lunch. Several people were shown how
to use microwaves as they were no longer able to use a conventional oven, and a
few people were observed while they prepared food, occasionally receiving advice on
new ways to approach food preparation. Several service users said they saw Meals
on Wheels as a last resort, preferring to rely on help from family members for the
provision of food.
Many people living alone expressed their frustration about unmet needs for help with
housework or shopping; it was widely understood that this was simply not available.
However, a small minority of service users said that they had received occasional
assistance with housework or shopping. One woman reported that a re-ablement
worker had vacuumed for her when she was in extreme pain and distressed about
her inability to clean her carpet (R2). A number of service users (both living alone
and with family members) had received help with shopping for specific items. Only
one person (a wife/carer with limited capacities) had received help with cleaning as
part of her husband‟s re-ablement service (R4). Two people who lived alone but
could not leave their homes had time allocated for shopping to be undertaken by their
re-ablement workers and this help was valued, especially as they were reluctant to
„put upon‟ friends or neighbours.
5.6 The balance between care and re-ablement
Some service users and carers were more interested in receiving help and care than
re-ablement at the start of the re-ablement intervention, but most accepted a re-
ablement approach as their health improved. A reluctance to accept a re-ablement
approach was most common among those with progressive conditions or reduced
capacity to recover former skills. Although the potential for re-ablement was very
limited in some cases, the emotional support provided by the service seemed to be
important for those who expected further deteriorations in their condition. Some
people felt that emotional support had helped to alleviate stress for them and any
carers, aiding the recovery of confidence and reducing pressure on relationships.
For many service users, the supportive attitudes of re-ablement staff played a key
role in their own motivations towards re-ablement. Several service users reported

Home care re-ablement services: Investigating the longer-term impacts
58
that they were unaware that they were being encouraged and had made progress
without realising it, a process described by one man as „gentle persuasion‟.
Few service users said that they felt pushed beyond their abilities. On the rare
occasions where people said they were asked to undertake tasks that they felt were
outside their capability, the re-ablement workers were reported to have been gentle
and reassuring, offering further encouragement to progress when they felt ready.
Only two women complained that they were occasionally pushed to do things that
they did not feel ready for (R2 and R5). Another woman said she was „taken aback‟
by a sudden switch of emphasis from care to re-ablement, half way through her
receipt of the service (R2). Conversely, several service users said that re-ablement
workers had discouraged them from attempting to do too much too soon. Nearly all
of the carers concurred with the service user‟s view of their own abilities; only two
disagreed. One service user‟s wife suggested that she believed her husband to be
capable of more (R2). Conversely, another wife was very worried about the
husband‟s optimism and the levels of care she would have to provide after re-
ablement (R1).
There appeared to be a greater emphasis on re-ablement than care for people who
lived alone. Where service users had carers who lived with them or had substantial
help from other family members, more emphasis was placed on providing personal
care and less on regaining skills in housework or food preparation. This was
particularly noticeable in the case of one man, who was being re-abled in his current
home where he lived with his former wife who was providing care despite their
intention to divorce. He had requested a deferral of part of his re-ablement until he
moved to a smaller bungalow where he would be learning to live alone with his new
(permanent) impairment. This request had been refused, which caused him some
uncertainty in knowing how he would cope with limited abilities, no carer, and little
preparation for life on his own (R5).
5.7 Factors influencing progress during re-ablement
Many service users reported changes in their abilities over the course of the re-
ablement period. There were wide variations in outcomes, which reflected
differences in users‟ initial abilities.
For example, most people recovering from accidents or operations reported
substantial progress, reflected in reductions in the duration or frequency of visits and
considerable gains in doing things for themselves. Only one service user in this
situation said that she had made little progress and had had her re-ablement service
terminated abruptly (R5). She was left with a number of fears about getting around
and doing things for herself. She reported that she had only received two hours of
re-ablement a week, giving her little opportunity to learn new skills or regain

Chapter 5 The experiences of re-ablement service users and informal carers
59
confidence. Emotional and practical support for this woman seemed scant; when
she commented that she would miss the carers she was told „They‟re not coming to
keep you company, they‟re coming to help you‟.
Service users who had few personal care needs at the start of re-ablement usually
grew more confident as time went on, although some expressed disappointment in
their reduced capacity to cook and the limited help they were given with this. Most of
these people received help with activities such as showering on the first visit, and
were subsequently watched and encouraged while they did tasks for themselves.
They were happy to finish re-ablement on or before the expected date, though some
wanted to know that the service would be there if they deteriorated.
A third group of re-ablement users had greater care needs and these people reported
minimal benefits from re-ablement. They included people with Parkinson‟s disease
and one person recovering from a stroke. In these cases, the most obvious benefits
of re-ablement were being able to walk further and reductions in the time taken to
perform personal care tasks (with assistance). Emotional support also seemed
valuable, particularly where the prognosis was uncertain. In one case, a carer
expressed distress at the demotivating consequences of information which a re-
ablement worker had given his wife (R5). He said he had to provide his wife with
weeks of additional emotional support when a re-ablement worker told her that she
had no prospect of recovery, describing such predictions as a „medical menace‟.
Another service user who lived alone ended her period of re-ablement feeling
unprepared, not properly assessed and nervous about doing things for herself (R2).
In a small number of cases, service users and carers felt that re-ablement goals
which they had identified were thwarted by restrictions on the service, including
limitations of the re-ablement workers‟ roles; the limited time they were allocated; and
the restricted access to external expertise such as physiotherapy or equipment.
Several service users felt their progress was hindered or delayed by a lack of
equipment or adaptations. The most common difficulties related to showering or
bathing. One woman with incontinence problems reported that she had not had
either a bath or a shower for several months; other service users continued to need
supervision from carers until adaptations to bathrooms were made (R5). Another
man, who had made progress in several aspects of his personal care and household
activities, felt that further independence was impeded by the lack of a power
wheelchair, making him dependent on his family to get out of the house (R3). Several
of those who could afford it purchased wheelchairs and bathroom adaptations
privately.
Despite these occasional problems, most service users said they had received useful
equipment promptly. The most significant problems with equipment involved waiting
for larger items such as stair lifts, wheelchairs and bathroom adaptations. These
delays caused considerable frustration for several service users and their carers.

Home care re-ablement services: Investigating the longer-term impacts
60
Several people also complained that equipment was not taken away when it was no
longer needed. Although there were instances where re-ablement workers advised
on or helped people to obtain equipment, most service users and their carers did not
expect re-ablement users to deal with equipment issues.
Several service users experienced delays in starting re-ablement. One man was
offered intermediate care after hospitalisation until re-ablement care could be
provided. He refused this option, believing that he would be „stuck in there forever‟,
and his son fought to keep him in hospital until re-ablement could be provided (R3).
5.8 The experiences of informal carers
The knowledge, experiences and involvement of informal carers in the re-ablement
process were varied. Many informal carers had onerous care responsibilities and
few had opportunities to pursue other activities. Whilst most carers said that the time
they spent on caring had not diminished during re-ablement, several did report other
benefits. Some felt that they had learned more structured ways of approaching
service users‟ needs and new skills in helping with practical tasks. Only one carer
did not live in the service user‟s home. For her and her sister, the re-ablement help
given to their mother in the mornings was particularly valuable in giving them a
temporary break from their caring responsibilities, notwithstanding uncertainties
about their mother‟s future care (R3).
Sons, daughters, nephews and nieces were involved in the care of some service
users, and many service users were pleased because they believed the re-ablement
support gave their carers „peace of mind‟, knowing that their elderly relative was safe.
Several carers felt more confident about their caring responsibilities after re-
ablement, especially where information about managing daily routines was passed
on from the re-ablement team or advice relating to their own needs was given.
However, some carers were disappointed that they received no support or advice.
One carer did not think that it was the duty of the re-ablement team to support her,
despite the large amount of time she spent caring for her mother.
Where emotional support was given to carers, it was highly valued and helped relieve
pressure on care-giving relationships. Women in particular found re-ablement
workers a valuable source of information and support in providing care for their
partners and in encouraging them to take a break. Two men who were caring for
their wives spoke of the pressures of the emotional and practical help they gave.
However, neither of these carers reported receiving any emotional support or help to
address their (acknowledged) lack of practice and confidence in domestic tasks and
thus the ensuing frustrations regarding the standards of meals and housework (R1).
A third man reported that he felt much more confident in his abilities to provide care

Chapter 5 The experiences of re-ablement service users and informal carers
61
for his wife and safeguard his own welfare after being advised on how to carry out
their morning routine after re-ablement finished (R5).
Some carers expressed concerns about the impacts of caring on their own health,
which was often described as „coming second‟. This caused worries about the long-
term impact of caring for their partners. In several cases, carers had significant
health problems of their own, such as asthma, emphysema and cancer. Re-
ablement was seen as invaluable by some of these carers, particularly where help
with lifting or hoists was provided. One man was also providing care for his disabled
(adult) child, a factor which did not seem to have been taken into account in the
design of his wife‟s re-ablement service (R1) On the other hand, re-ablement
interventions were designed to meet the dual needs of two married couples (in
different sites) which seemed to satisfy both care and re-ablement needs.
Carers were relieved to see service users making progress, but two carers believed
that their partner‟s progress would be much faster if they received appropriate
physiotherapy alongside re-ablement (R1). Although several carers expressed
concerns about service users‟ safety, none of these were linked to risks taken during
re-ablement and several carers welcomed receiving advice on safer ways of doing
things. Most carers said they would appreciate more advice on how to maximise
service users‟ independence. Several carers wanted more involvement in processes
of re-ablement and decision-making and one woman believed that this would help to
reduce service costs.
5.9 Ending re-ablement
Apart from those who cancelled their re-ablement service or who felt they had
achieved maximum independence, most service users and carers expressed
disappointment at the end of re-ablement. They had built relationships with the re-
ablement workers and felt secure knowing they would be visiting. Several people
were worried about the risk of falls after re-ablement finished.
Most service users reported that they had been given an indication of the likely
duration of their re-ablement packages at the start of the service. However, where
this was unknown, there was potential for distress. One woman described becoming
upset when her „discharge‟ from re-ablement was discussed (R3). Another reported
that she was told that she would receive no further visits on the final day of re-
ablement. This news was provided by a re-ablement worker, followed up by a letter
of confirmation sent with a list of independent home care agencies (R5).
Although some people felt they had sufficient information about the options for on-
going support after the re-ablement service stopped, there were few examples of re-
ablement „signposting‟ users to other services beyond information about conventional

Home care re-ablement services: Investigating the longer-term impacts
62
home care provided by independent agencies. Most people felt apprehensive about
such a transfer, expecting lower or different standards of care. Several service users
and carers commented that older people tended to be averse to change.
For those individuals ineligible for local authority funded home care and considering a
transfer to privately purchased care services after their re-ablement period finished,
progress in re-ablement was crucial to their subsequent choices. Several people had
already decided that they did not want, or could not afford, to pay for further
conventional home care support. However, those with greater care needs said they
felt that they had little option but to move on to privately purchased provision where
they were ineligible for local authority funding.
5.10 Charging for re-ablement services
At the time the interviews were conducted there was uncertainty about whether home
care re-ablement could be charged for.
There were a number of service users, from across the five re-ablement sites, who
were uncertain whether or not the local authority charged for the service; if they
would have to pay; how much they would be charged; and when this would happen.
In only one site (R4) did every service user interviewed believe the service was free
of charge.
Some people who could afford payment said they did not object to being charged for
re-ablement; indeed one person who expected to achieve a complete recovery
believed she should have to pay. A few people said they would probably have to go
without the service if they had to pay. Not surprisingly, most people said they
preferred not to pay but were prepared to do so for as long as they could, as they
valued re-ablement services. Several people expressed concern about the costs and
quality of services to people with greater needs for care and support, especially for
people with no informal care. The position of most service users and carers to
payment was one of resignation.
5.11 Attitudes towards re-ablement, felt benefits and perceived
limitations
Most service users reported that re-ablement had improved their independence;
increased their motivation to make further gains; and boosted their confidence. The
most common gains described related to personal care and preparing simple meals
such as breakfast or sandwiches. Most people who relied on networks of family or
friends felt that it was important to both themselves and their informal carers to
receive professional support, encouragement and advice that helped them achieve

Chapter 5 The experiences of re-ablement service users and informal carers
63
yet further independence. For some carers, the work of re-ablement teams was
indispensable in providing physical help which was otherwise beyond their own
ability.
For many service users (and carers), one of the most valuable aspects of re-
ablement was the security of knowing that they were being monitored regularly and
frequently. Several people, including carers, valued the routine and „self-discipline‟
which re-ablement visits brought.
Nearly all service users valued continuity, and expressed a preference for support
from a small team of re-ablement workers, with whom they could build good
relationships. Several people felt fortunate to have had a main or core carer for
much of the time. Although several service users said that they had no need for
emotional support, many people expressed appreciation for the re-ablement workers‟
company as a significant source of emotional sustenance.
For many service users who lived alone, primary benefits were feelings of safety and
the company of other people. One man said that the re-ablement workers had made
his recuperation „bearable and possible‟ (R3). Although many service users saw
increased social contact as outside the remit of the re-ablement service, those living
alone were distressed that they could not leave their homes or see other people.
Even where this was possible, people often experienced obstacles such as not
having enough information about appropriate transport facilities. One person said
„I‟m deaf, not dead‟ (R1) another said they felt „desperate‟ to see other people (R2)
and several others reported „not having a life‟.
Complaints about the short amount of time allowed for visits, and time spent waiting
for overdue visits, were quite common.
5.12 Discussion and conclusions
This chapter has discussed the main findings drawn from service users‟ and carers‟
experiences of re-ablement services. It has focussed specifically on the expectations,
felt benefits and experiences of the participants during their re-ablement processes.
These accounts were firmly embedded within discussions of the central features of
service provision, as discussed above and in Chapter 4.
The interviews with service users reflect some of the findings of interviews with
managers (see Chapter 4) in respect of the benefits afforded to different groups of
service users. Those who reported the greatest benefits tended to be the service
users recovering from fractures and falls. For those with less capacity or motivation
to become more independent, the advantages of re-ablement were less apparent
although it has been suggested that benefits of routine and small changes in capacity

Home care re-ablement services: Investigating the longer-term impacts
64
may accrue to people with dementia or on-going care needs. However, the interviews
with service users and carers have also highlighted the need for sensitivity and fine-
tuning in providing interventions which are appropriate to service users‟ self-defined
goals.
An emphasis placed on particular dimensions of independence created some fear,
confusion and anxiety for a few service users. This was especially true for those who
expressed unmet cultural or impairment related needs. The importance of walking
seemed crucial to several participants, their carers and their re-ablement workers,
and several participants complained about inadequate links to physiotherapy
services.
Supporting the findings of interviews with managers and staff, interviews with service
users and carers suggest that improved and timely access to physiotherapists.
occupational therapists and other specialist skills is likely to improve re-ablement
services. All service users could experience further improvements if greater attention
is paid to the ways people experience disabling barriers to their independence,
particularly if these are considered in service planning. For some, this would involve
time spent on supporting service users walking outside their homes. For others, it
would necessitate better access to adaptations and equipment, re-ablement
information and advice on new ways to do things, for example as a new wheelchair
user. Additionally, greater attention paid to the social dimensions of service users‟
and carers‟ lives would enhance motivations for independence.
Informal carers who received direct support or guidance from the re-ablement
workers found this very helpful. Conversely, informal carers who were unsupported
expressed significant worries about their own welfare and their diminishing capacities
to provide for the service user or other family members and would have welcomed
more advice on how to maximise users‟ independence and meet their own needs.
Most people indicated that they found the approaches of the re-ablement workers
motivating and encouraging. Many people said that the re-ablement workers did a
considerable amount of work in a short time and several people commented on their
valuable mix of skills and the ways they combined medical knowledge with care,
support, encouragement and information. However, it is likely that the gratitude
expressed by service users and carers, for the assistance they have been provided,
may prevent them from voicing criticisms or requests. The small number of
complaints which were expressed about the re-ablement service were focussed
mainly on management concerns and the inadequate provision of information on re-
ablement.
The overall attitude of service users and their carers towards payment for re-
ablement services was one of ambivalent reluctance, where interviewees often
expressed appreciation for the high quality of the service despite any disinclinations

Chapter 5 The experiences of re-ablement service users and informal carers
65
or worries about paying. Again, the provision of clear information about any costs to
service users was inconsistent and may have contributed to feelings of uncertainty
about re-ablement progress.
Generally, service users who lived alone with greater re-ablement requirements
reported a number of unmet needs and consequently had some of the least
productive re-ablement experiences. In these cases, continuing improvement
seemed largely dependent on the maintenance of substantial support and provision
of information from informal carers. Several of these service users spoke of a
considerable reliance on their sons and daughters. These carers are less likely to be
receiving support from re-ablement workers or advice on how to maximise their
parents‟ independence, responsibilities which are often managed alongside other
family and work obligations. For safeguarding purposes, it seems essential to build
accessible feedback mechanisms into re-ablement processes, particularly where
service users live alone, with or without carers, and are likely to experience
confusion, apprehension or restrictions to providing their opinions. Questionnaires
are unlikely to work for all, particularly as several service users said they felt
overwhelmed or unable to complete forms.


67
Chapter 6 Quantitative outcomes
Summary
Four outcome measures were used to examine changes in outcomes: perceived
health; perceived quality of life; health-related quality of life (EQ-5D); and social
care outcomes (ASCOT).
The use of re-ablement was significantly associated with better health-related
quality of life and social care outcomes over time compared with the use of
conventional services. The effect was stronger for EQ-5D which was not
surprising given the nature of the home care re-ablement service.
People in the re-ablement group had significantly better relative improvements in
their EQ-5D and ASCOT scores between baseline and follow-up. From baseline,
the change in EQ-5D was around 0.08 points higher in the re-ablement group
than in the comparison group. For ASCOT, the change in scores was around
0.03 points higher in the re-ablement group compared with the comparison
group.
A key question in the evaluation is whether home care re-ablement services
could improve outcomes without increasing the overall costs of the social and
health care system. Chapter 8 attempts to answer this question.
6.1 Introduction
A key objective of the study was to identify whether home care re-ablement improved
outcomes for people by giving them greater independence. The purpose of this
chapter is to describe the outcomes for individuals in the re-ablement and
comparison groups at two time points (baseline and 12 months after date of
consent), to explore whether there is evidence to suggest that home care re-
ablement leads to better outcomes and the factors that are associated with changes
in outcomes. Appendix I shows comparisons between people in the re-ablement
group at two time points: baseline and immediately after discharge from re-ablement.
6.2 Global outcome measures
We compared people on a variety of measures designed to reflect the intentions of
home care re-ablement. We sought to capture some over-arching aspects of well-
being by using well-validated global indicators, and also using measures that picked
up key areas of people‟s lives that are specifically relevant to social care. Appendix
D describes the measures used in more detail, and here we briefly summarise them
and their objectives.

Home care re-ablement services: Investigating the longer-term impacts
68
First, while better health was not a core objective of re-ablement, we measured
whether there was any difference in health status. Self-perceived health has been
found in previous work (Ferraro, 1980) to be a reliable predictor of objective health,
and has been found to be closely associated with overall well-being (e.g. Palmore
and Luikart, 1972). The perceived health question was based on the five point scale
suggested by Robine and colleagues (2003). It asks respondents to rate their health
in general according to five categories ranging from „very good‟ to „very bad‟.
Second, perceived quality of life was measured on a seven point scale developed by
Bowling et al. (1995, 2002), with categories ranging from „so good, it could not be
better‟ to „so bad, it could not be worse‟. Both scales have been reversed for this
study so that higher scores indicate better perceived health or quality of life
respectively.
Third, the Euro-QoL (EQ-5D) measure was used to explore service users‟ reported
changes in health-related quality of life (HRQOL). This measure asks people to rate
their health in five domains: mobility, self-care, ability to undertake usual activities,
pain, and anxiety/depression. A further component of the EQ-5D measure asks
respondents to rate whether they feel that their „general level‟ of health has changed
compared to the previous 12 months, whether it has got better, is much the same, or
worse. In the third part, they are asked to indicate how good or bad their heath state
is on a „thermometer‟ that runs from 0 (worst imaginable health state) to 100 (best
imaginable health state).
Fourth, social-care related quality of life (SCRQOL) was measured by the Adult
Social Care Outcome Toolkit (ASCOT), a preference weighted indicator that reflects
need for help and outcome gain from services across nine domains.2 The domains
range from basic areas of need such as personal care, or food and nutrition, to social
participation and involvement, or control over daily life (Burge et al., 2010; Netten et
al., 2010).
6.3 Analyses of responses
We begin by comparing the re-ablement and comparison groups at baseline and
follow-up on each of our outcome indicators using parametric statistical tests.3 This
is followed by multilevel regression analyses which included difference-in-difference
models to explore whether the home care re-ablement service had a positive impact
on outcomes. A „difference-in-difference‟ approach exploits our study design where
2 The caring domain has now been removed from the initial ASCOT toolkit.
3 A chi-square test of association was used to explore the relationship between two discrete variables.
When the outcome measure was based on a Likert scale (e.g. running from one to seven), a t-test was used to explore mean differences between groups (for example, quality of life and satisfaction).

Chapter 6 Quantitative outcomes
69
we have a re-ablement group and a comparison group with both groups assessed at
baseline and then at a follow-up time. This approach minimises so-called selection
bias i.e. that improvements in outcomes result not (only) from the intervention but
also because people receiving the intervention have different characteristics than the
control group. As the name suggests, we compare the difference between re-
ablement and comparison groups of the change (or difference) in their outcomes
between baseline and follow-up. This has the effect of removing any differences in
outcomes that existed at baseline.
Analyses were undertaken in Stata 10 with the „mim‟ application used for analysis of
multiple-imputed datasets. Multi-level models were estimated using GLLAMM;
otherwise OLS, probit and random-effects models were used (as indicated in the
main text). A full description of the statistical techniques can be found in Appendix F.
Missing data, even at baseline, are inevitable in a study of this nature. Minimising
this problem is particularly important given the relatively small initial sample size
available and the scale of loss to follow-up. It is often the case that only part of the
data for an individual is missing. As an alternative to dropping the whole case in the
analysis, we instead used an „imputation‟ approach to fill in the missing data. In
particular, we used a multiple-imputation approach. This technique uses information
inherent in the whole data set to predict what the missing values would have been.
Intuitively we expect there to be relationship patterns between outcomes and
explanatory variables, which we can use to fill in data that are believed to be missing
at random. The multivariate analyses undertaken in this study use multiple
regression methods with multiple-imputation of missing data.
6.4 The impact of re-ablement on outcomes
This section presents changes in outcomes for the re-ablement and comparison
groups between baseline and follow-up. There are four outcome measures:
perceived health; perceived quality of life; health-related quality of life; and social
care outcomes. For all four outcomes, the following changes are presented:
overall change between baseline and 12 month follow-up4
direction of change between baseline and 12 month follow-up
factors independently associated with outcomes at baseline and 12 month follow-
up.
4 The term „12 month follow-up‟ has been used as a shorthand to cover the follow-up period which, as
noted in Chapters 2 and 3, ranged from nine to 12 months.

Home care re-ablement services: Investigating the longer-term impacts
70
For health-related quality of life and social care outcomes only, the following is also
presented:
factors associated with changes in individual outcome measures over time.
6.4.1 Perceived health
Table 6.1 shows the perceived health of people in each group at baseline and follow-
up. Perceived health ranges from very good to very bad. There were no significant
differences between the groups at either baseline or follow-up. However, the figures
suggest that the percentage of people in the re-ablement group perceiving their
health as good or very good declined by the time of follow-up approximately 12
months after receiving re-ablement (baseline 31 per cent and follow-up 23 per cent).
Similarly, the percentage of people in the re-ablement group perceiving their health to
be bad or very bad increased (baseline 22 per cent and follow-up 31 per cent). In the
comparison group, the percentage of people perceiving their health to be good or
very good remained stable (27 per cent at both baseline and follow-up) but more
people felt their health was bad or very bad at follow-up (25 per cent at baseline
compared to 28 per cent at follow-up).
Table 6.1 Perceived health at baseline and follow-up
Baseline 12 month follow-up
Re-ablement
n=641
Comparison
n=360
Re-ablement
n=241
Comparison
n=140
% (n) % (n) % (n) % (n)
Very good 9 (57) 4 (14) 6 (14) 6 (9)
Good 22 (139) 23 (84) 17 (40) 21 (30)
Fair 47 (304) 48 (173) 47 (114) 44 (62)
Bad 16 (104) 18 (65) 24 (57) 17 (24)
Very bad 6 (37) 7 (24) 7 (16) 11 (15)
Table 6.2 shows the direction of change in perceived health for people in the re-
ablement and comparison groups between baseline and follow-up. A smaller
percentage of people in the re-ablement group than in the comparison group
perceived their health to have improved and a greater percentage felt it had declined.

Chapter 6 Quantitative outcomes
71
Table 6.2 Direction of change in perceived health from baseline to follow-up
Re-ablement
n=235
Comparison
n=139
% (n) % (n)
Perceived health improved 19 (44) 27 (38)
Remained the same 40 (94) 42 (58)
Perceived health declined 41 (97) 31 (43)
Perceived health can also be presented as an overall score. Possible scores range
from one to five. A higher score indicates better perceived health. In the re-
ablement group, there was a statistically significant deterioration in the mean score
for perceived health by the time of 12 month follow-up (baseline mean 3.24 (sd 0.91);
follow-up mean 2.94 (sd 0.99); p<0.001). In the comparison group, there was no
change in mean perceived health from a baseline score of 2.99 (standard deviation
0.99) to a 12 month follow-up score of 2.96 (sd 1.04).
Mean scores for perceived health at baseline and follow-up were also tested for
associations with sample characteristics such as age or gender, and dependency.
Each characteristic or measure of dependency was treated independently of all
others. Tables giving the full results are presented in Appendix I. For many of the
characteristics, the sample sizes were unequal and in some cases quite small.
Therefore differences that appear to be statistically significant should be treated with
caution.
However, the results suggest that better perceived health at baseline in both re-
ablement and comparison groups was associated with being over 65 years of age,
female, living alone, not having an informal carer within the same household, and
having a lower FACS level. In the re-ablement group only, perceived level of health
at baseline was positively associated with being White British or Irish and being a
home owner. Perceived health at 12 month follow-up was statistically significantly
positively associated only with older age and only in the comparison group.
6.4.2 Perceived quality of life
Table 6.3 shows the perceived quality of life for people in each group at baseline and
follow-up. The perceived quality of life score ranges from „so good it could not be
better‟ to „so bad it could not be worse‟. The table shows no difference in the scores
at baseline between the re-ablement and comparison groups but statistically
significantly better perceived quality of life at follow-up in the re-ablement group; 47
per cent of people in the re-ablement group rated their quality of life as good or better
compared to 36 per cent in the comparison group.

Home care re-ablement services: Investigating the longer-term impacts
72
Table 6.3 Perceived quality of life at baseline and follow-up5
Baseline Follow-up*
Re-ablement Comparison Re-ablement Comparison
% (n) % (n) % (n) % (n)
So good it could not be better 1 (7) 1 (3) 1 (2) 0 (0)
Very good 17 (107) 13 (44) 14 (34) 6 (9)
Good 26 (165) 26 (88) 32 (76) 30 (42)
Alright 39 (248) 41 (139) 31 (73) 38 (53)
Bad 12 (73) 13 (45) 19 (45) 18 (25)
Very bad 4 (23) 3 (10) 4 (10) 5 (7)
So bad it could not be worse 2 (11) 3 (10) 0 (0) 4 (5)
* p<0.05
Table 6.4 shows the direction of change in perceived quality of life for both groups
between baseline and follow-up. A slightly higher percentage of people in the re-
ablement group felt their quality of life had improved, and slightly fewer felt that it had
declined, than in the comparison group.
Table 6.4 Direction of change in perceived quality of life from baseline to follow-up
Re-ablement
n=231
Comparison
n=132
% (n) % (n)
Perceived quality of life improved 27 (63) 25 (33)
Remained the same 37 (86) 36 (47)
Perceived quality of life declined 35 (82) 39 (52)
When presented as an overall score, perceived quality of life has a possible range
from one to seven. A higher score indicates better perceived quality of life. In the re-
ablement group, there was no statistically significant change in the mean perceived
quality of life score between baseline (mean 4.48, sd 1.07) and 12 month follow-up
(mean 4.35, sd 1.10). In the comparison group, there was a statistically significant
but slight deterioration from a baseline mean score of 4.28 (sd 1.19) to a follow-up
score of 4.05 (sd 1.10, p<0.05).
Mean scores for perceived quality of life were tested for associations with sample
characteristics and dependency. Each characteristic or measure of dependency was
5 Due to small sample sizes, the results need to be treated with caution.

Chapter 6 Quantitative outcomes
73
treated independently of all others. Unequal and very small sample sizes in some
cases mean that differences that appear to be statistically significant should be
treated with caution. Tables giving the full results are presented in Appendix I.
Perceived quality of life at baseline in both re-ablement and comparison groups was
statistically significantly associated with gender, whether or not the participant lived
alone, and whether they had an informal carer. Older age and having a lower FACS
level were associated with better perceived quality of life for the comparison group
only. Age group was the only characteristic associated with perceived quality of life
at the time of 12 month follow-up. The differences in the mean scores for perceived
quality of life by age were statistically significant in both groups, but the sample sizes
for those participants aged under 65 years were particularly small; the results should
therefore be treated with caution.
6.4.3 Health-related quality of life (EQ-5D)
Table 6.5 shows health-related quality of life measured by the EQ-5D at baseline and
12 month follow-up for each group. The table shows the re-ablement group had
statistically significantly better mobility than the comparison group at baseline; a
lower percentage of people unable to self-care but also fewer with no self-care
problems; fewer people with moderate or extreme anxiety; but more people who felt
their general health was worse than a year ago. At follow-up, the re-ablement group
had statistically significantly better health-related quality of life on all five dimensions
and general health compared with the comparison group. The greatest difference
was in the ability to perform usual activities where 23 per cent in the re-ablement
group were unable to perform usual activities compared to 43 per cent in the
comparison group.

Home care re-ablement services: Investigating the longer-term impacts
74
Table 6.5 Health-related quality of life at baseline and follow-up6
Baseline 12 month follow-up
Re-ablement Comparison Re-ablement Comparison
% (n) % (n) % (n) % (n)
Mobility
No problems 12*** (80) 8 (29) 14* (33) 6 (9)
Some problems 85 (545) 82 (293) 83 (198) 86 (120)
Confined to bed 3 (16) 10 (37) 4 (9) 7 (10)
Self-care
No problems 20*** (131) 27 (97) 49** (117) 39 (55)
Some problems 65 (419) 46 (165) 41 (100) 38 (53)
Unable 14 (91) 27 (99) 10 (24) 23 (32)
Usual activities
No problems 8 (51) 12 (43) 22*** (53) 14 (20)
Some problems 44 (280) 45 (162) 55 (131) 43 (60)
Unable 48 (310) 43 (156) 23 (56) 43 (60)
Pain/discomfort
None 22 (137) 23 (83) 31** (73) 16 (23)
Moderate 59 (372) 54 (191) 48 (114) 59 (82)
Extreme 20 (124) 23 (83) 22 (52) 25 (35)
Anxiety/depression
None 57*** (363) 43 (157) 57* (136) 41 (58)
Moderate 38 (242) 48 (174) 36 (86) 49 (69)
Extreme 6 (37) 8 (30) 6 (15) 9 (13)
General health
today
Better than
previous 12 months
9*** (58) 13 (47) 25* (60) 13 (18)
Much the same 29 (188) 38 (138) 40 (95) 51 (71)
Worse than
previous 12 months
62 (398) 49 (176) 35 (84) 36 (49)
* p<0.05; ** p<0.01, *** p<0.001
Table 6.6 shows whether health-related quality of life improved or declined between
baseline and follow-up for both groups. There was little change in mobility with over
80 per cent in each group remaining the same as measured at baseline. However,
the re-ablement group generally showed either higher percentages improving or
6 Due to the small sample sizes, the results need to be treated with caution.

Chapter 6 Quantitative outcomes
75
lower percentages declining than the comparison group on all other dimensions. For
example, 40 per cent in the re-ablement group had fewer problems with undertaking
usual activities compared with 23 per cent in the comparison group.
Table 6.6 Direction of change in health-related quality of life from baseline to follow-up
Re-ablement Comparison
% (n) % (n)
Mobility (n=233) (n=138)
Fewer problems at 12 month follow-up 8 (18) 8 (11)
No change at 12 month follow-up 81 (189) 84 (116)
More problems at 12 month follow-up 11 (26) 8 (11)
Self-care (n=234) (n=140)
Fewer problems at 12 month follow-up 38 (90) 21 (30)
No change at 12 month follow-up 50 (116) 62 (87)
More problems at 12 month follow-up 12 (28) 16 (23)
Usual activities (n=233) (n=140)
Fewer problems at 12 month follow-up 40 (94) 23 (32)
No change at 12 month follow-up 44 (103) 56 (78)
More problems at 12 month follow-up 16 (36) 21 (30)
Pain/discomfort (n=232) (n=140)
Fewer problems at 12 month follow-up 26 (61) 18 (25)
No change at 12 month follow-up 56 (130) 66 (93)
More problems at 12 month follow-up 18 (41) 16 (22)
Anxiety/depression (n=231) (n=140)
Fewer problems at 12 month follow-up 19 (45) 12 (17)
No change at 12 month follow-up 60 (139) 66 (93)
More problems at 12 month follow-up 20 (47) 21 (30)
General health today (n=233) (n=138)
Improved general health today 38 (89) 23 (32)
No change 47 (110) 55 (76)
Decline in general health today 15 (34) 22 (30)
Health-related quality of life can also be presented as an overall score. Scores can
range from less than zero to one. A higher score indicates a better health-related
quality of life. In the re-ablement group, there was a statistically significant
improvement in health-related quality of life between baseline (mean 0.38, sd 0.30)
and 12 month follow-up (mean 0.47, sd 0.35, p<0.001). There was no change in the
comparison group (baseline mean 0.33 compared to follow-up mean 0.32).

Home care re-ablement services: Investigating the longer-term impacts
76
Tables presenting the mean scores for health-related quality of life by sample
characteristics and dependency are given in Appendix I. Each characteristic is
treated independently of all others. Once again, unequal and very small sample
sizes in some cases mean that differences that appear to be statistically significant
should be treated with caution.
Statistically significant findings are that age group, whether or not a person lived
alone, and FACS level were each independently associated with health-related
quality of life at baseline in both the re-ablement and the comparison group. Being
White British or Irish and having an informal carer from another household were both
positively associated with health-related quality of life in the re-ablement group alone;
having an informal carer living in the same household was negatively associated with
health-related quality of life in the comparison group alone.
At the time of 12 month follow-up, not having an informal carer living in the same
household was independently associated with better health-related quality of life in
both re-ablement and comparison groups. Age group and whether or not a person
lived alone remained associated with health-related quality of life for people in the
comparison group; having an informal carer living in another household became
positively associated with health-related quality of life for people in the comparison
group. Age group and ethnicity were no longer factors associated with health-related
quality of life for people in the re-ablement group.
6.4.4 Social care-related quality of life (ASCOT)
Table 6.7 shows social care-related quality of life as measured by ASCOT at
baseline and 12 month follow-up for each group. The table shows that, at baseline,
the re-ablement group had statistically significantly higher needs in undertaking usual
activities than the comparison group, but had fewer needs in relation to safety, social
situations and relationships, and dignity and respect. At 12 month follow-up, there
were no statistically significant differences in social care-related quality of life
between the re-ablement and comparison groups.
Table 6.8 shows whether people‟s levels of social care needs decreased, stayed the
same or increased between baseline and follow-up. The biggest difference between
the groups was in people‟s ability to undertake usual activities (39 per cent of the re-
ablement group had lower levels of need compared to 21 per cent in the comparison
group).

Chapter 6 Quantitative outcomes
77
Table 6.7 Social care-related quality of life outcomes at baseline and follow-up
Baseline 12 month follow-up
Re-ablement Comparison Re-ablement Comparison
% (n) % (n) % (n) % (n)
Control over daily life
No needs 44 (281) 48 (173) 53 (128) 52 (74)
Low needs 44 (283) 39 (141) 35 (840 40 (56)
High needs 12 (77) 13 (46) 12 (28) 8 (110
Personal care/comfort
No needs 83 (532) 84 (303) 88 (211) 84 (118)
Low needs 15 (96) 13 (46) 11 (26) 14 (20)
High needs 2 (13) 3 (12) 2 (4) 1 (2)
Meals and nutrition
No needs 78 (496) 72 (258) 88 (212) 84 (117)
Some needs 23 (142) 29 (102) 11 (28) 15 (22)
Safety
No needs 68** (434) 57 (204) 75 (180) 78 (109)
Low needs 29 (185) 38 (138) 21 (50) 17 (24)
High needs 4 (23) 5 (19) 5 (11) 5 (7)
Social situation and
relationships
No needs 47** (303) 48 (173) 43 (104) 36 (50)
Low needs 41 (265) 33 (120) 36 (87) 45 (63)
High needs 11 (73) 19 (67) 21 (50) 19 (27)
Usual activities
No needs 16*** (99) 20 (72) 26 (63) 19 (26)
Low needs 29 (187) 43 (157) 42 (102) 41 (58)
High needs 55 (352) 37 (132) 32 (76) 40 (56)
Accommodation
cleanliness/comfort
No needs 86 (546) 85 (308) 84 (203) 86 (120)
Low needs 13 (80) 12 (45) 12 (28) 10 (14)
High needs 2 (12) 2 (8) 4 (10) 4 (6)
Worries and concerns
No needs 37 (240) 35 (125) 45 (107) 34 (48)
Low needs 51 (330) 51 (182) 38 (92) 50 (70)
High needs 11 (72) 15 (53) 17 (41) 16 (23)
Dignity and respecta
No needs 92*** (590) 85 (308) 88 (213) 86 (121)
Low needs 8 (48) 15 (53) 12 (28) 14 (19)
*p<0.05, **p<0.01, ***p<0.001.
a Low needs and high needs merged due to low numbers in each category.

Home care re-ablement services: Investigating the longer-term impacts
78
Table 6.8 Direction of change in social care outcomes between baseline and follow-up
Re-ablement Comparison
% (n) % (n)
Control over daily life (n=235) (n=141)
Lower level of need at 12 month follow-up 24 (56) 22 (31)
Same level of need at 12 month follow-up 52 (122) 57 (80)
Higher level of need at 12 month follow-up 24 (57) 21 (30)
Personal care/comfort (n=236) (n=140)
Lower level of need at 12 month follow-up 13 (30) 10 (14)
Same level of need at 12 month follow-up 78 (183) 79 (111)
Higher level of need at 12 month follow-up 10 (23) 11 (15)
Meals and nutrition (n=234) (n=139)
Lower level of need at 12 month follow-up 19 (44) 22 (30)
Same level of need at 12 month follow-up 72 (168) 70 (97)
Higher level of need at 12 month follow-up 9 (22) 9 (12)
Safety (n=236) (n=140)
Lower level of need at 12 month follow-up 25 (58) 29 (41)
Same level of need at 12 month follow-up 59 (140) 60 (84)
Higher level of need at 12 month follow-up 16 (38) 11 (15)
Social situation and relationships (n=234) (n=139)
Lower level of need at 12 month follow-up 25 (58) 15 (21)
Same level of need at 12 month follow-up 44 (102) 57 (79)
Higher level of need at 12 month follow-up 32 (74) 28 (39)
Usual activities (n=234) (n=140)
Lower level of need at 12 month follow-up 39 (92) 21 (30)
Same level of need at 12 month follow-up 39 (91) 49 (69)
Higher level of need at 12 month follow-up 22 (51) 29 (41)
Accommodation cleanliness/comfort (n=233) (n=140)
Lower level of need at 12 month follow-up 11 (26) 6 (9)
Same level of need at 12 month follow-up 77 (179) 84 (117)
Higher level of need at 12 month follow-up 12 (28) 10 (14)
Worries and concerns (n=233) (n=141)
Lower level of need at 12 month follow-up 28 (65) 14 (20)
Same level of need at 12 month follow-up 46 (107) 66 (93)
Higher level of need at 12 month follow-up 26 (61) 20 (28)
Dignity and respect (n=233) (n=140)
Lower level of need at 12 month follow-up 5 (11) 4 (6)
Same level of need at 12 month follow-up 85 (198) 86 (120)
Higher level of need at 12 month follow-up 10 (24) 10 (14)

Chapter 6 Quantitative outcomes
79
Overall social care needs are calculated by applying a weight to the selected attribute
for each domain and summing to give an overall score. Full details are given in
Appendix D. Scores can range from 0.26 to one. A higher score indicates a better
outcome, that is, that social care needs are being met. There was no change in
mean social care need scores between baseline and 12 month follow-up in either the
re-ablement or comparison groups. In the re-ablement group, the mean score rose
slightly (but not statistically significantly) from 0.777 at baseline to 0.78 at follow-up.
In the comparison group, the mean score was 0.80 at baseline and 0.76 at 12 month
follow-up. The difference between the re-ablement and comparison groups at
baseline and at 12 month follow-up did not reach statistical significance.
Tables in Appendix I present mean scores for social care needs by sample
characteristics and dependency. As described in earlier sections, each characteristic
or measure of dependency is treated independently of all others. Once again,
unequal and very small sample sizes in some cases mean that differences that
appear to be statistically significant should be treated with caution.
The tables show that being aged over 65 years, living alone and having an informal
carer living in another household were each statistically significantly associated with
fewer social care needs at baseline in both re-ablement and comparison groups.
Being female and White British or Irish were associated with fewer needs in the re-
ablement group only; lower FACS level and not having an informal carer living in the
same household were associated with fewer current needs in the comparison group
only. At 12 month follow-up, only age remained statistically significantly associated
with social care needs; this was in the comparison group only. However, the number
of people aged less than 65 was very small, meaning this result should be treated
with caution.
6.5 Variation in outcomes
As mentioned above, we used statistical models to explore the implications of the
receipt of the home care re-ablement service and to explore a series of potential
influences on two outcomes: health-related quality of life measured by the EQ-5D
and social care-related quality of life as measured by ASCOT. The multivariate
analysis was based on the imputed data and therefore we report the mean values of
the imputed outcome data and then the regression equation that best fits the data,
taking into account statistical significance, various diagnostic tests of model
specification and interpretation. These equations show the influences of the included
factors, after taking into account the effects of all other included variables. This
7 The highest ASCOT score was 1 and the lowest was 0.29. For the follow-up ASCOT score, highest
score was 1 and the lowest was 0.35.

Home care re-ablement services: Investigating the longer-term impacts
80
analysis is followed by a regression equation that explores the difference between
baseline and follow-up outcome responses while controlling for confounding
variables (the „difference-in-difference‟ approach – see Appendix F).
6.5.1 Health-related quality of life (EQ-5D)
Table 6.9 shows EQ-5D scores for the re-ablement and comparison groups at
baseline (T1) and at (12-month) follow-up (T2). Similar to the non-imputed data
outlined previously, the re-ablement group have slightly higher EQ-5D scores than
the comparison group at baseline. The difference did not reach statistical
significance.
Table 6.9 EQ-5D scores, by group and time
Baseline (T1) 12 month follow-up (T2)
Group mean (n) mean (n)
Comparison Group 0.30 (355) 0.32 (135)
Re-ablement Group 0.35 (619) 0.47 (233)
Table 6.10 reports the results of the difference-in-difference analysis. For
completeness, we included the results where all variables are imputed (1,397) and
also where any record with incomplete data on EQ-5D was dropped (1,342). The
small number of missing values made almost no difference to the overall result.
In order to reflect the potentially complex relationship between the use of re-ablement
services and outcomes, we model the impact of re-ablement services directly and
also as being mediated by relevant service user characteristics, namely, people‟s
baseline ADL need and whether they were referred from hospital or not. These
proved to be statistically significant mediating factors.
Overall, use of re-ablement was statistically significantly associated with better EQ-
5D outcomes than the use of conventional home care services. The net effect of
using re-ablement services in this analysis was around 0.1 on the EQ-5D scale
(which runs from a score of 1 for full health to -0.5, with 0 anchored to be a health
state that is no better than being dead). This result is significant at better than the 95
per cent confidence level with a range of 0.02 to 0.18.
Another noteworthy result is the very strong correlation between the ability to perform
activities of daily living (ADL ability) at baseline and the EQ-5D score. On average,
on the nine point ADL scale, an additional one point improvement in ADL ability is
associated with a 0.08 improvement in EQ-5D score. Furthermore, after accounting
for other factors (especially ADL need), older people had slightly better EQ-5D
scores.

Chapter 6 Quantitative outcomes
81
Table 6.10 EQ-5D scores estimation – difference-in-difference model
Imputed Imputed independent variable
Coefficient/
Marginal
effect
SE Prob Coefficient/
Marginal
effect
SE Prob
T1 ADL ability 0.041 0.018 0.023 0.037 0.019 0.056
T1 ADL ability (sqrd) 0.003 0.002 0.033 0.004 0.002 0.032
Female -0.008 0.018 0.674 -0.008 0.019 0.662
Alone 0.016 0.019 0.414 0.011 0.020 0.590
Owns home 0.001 0.018 0.964 0.001 0.018 0.961
Age 0.007 0.001 <0.001 0.007 0.001 <0.001
Referred from hospital -0.050 0.028 0.081 -0.050 0.029 0.086
Re-ablement Group at T1 0.161 0.065 0.014 0.158 0.066 0.018
Re-ablement Group at T2 0.275 0.107 0.013 0.260 0.106 0.017
Re-ablement Group at T1 x T1
ADL -0.025 0.009 0.005 -0.025 0.009 0.009
Re-ablement Group at T2 x T1
ADL -0.035 0.014 0.015 -0.032 0.014 0.024
Re-ablement Group at T1 x
hospital referral 0.038 0.038 0.324 0.035 0.040 0.380
Re-ablement Group at T2 x
hospital referral 0.113 0.051 0.027 0.127 0.052 0.016
T2 0.002 0.030 0.943 -0.003 0.030 0.922
Constant -0.588 0.081 <0.001 -0.576 0.080 <0.001
Re-ablement marginal effect 0.107 0.117
N 1397 1342
Imputations 5 5
Dependent variable: EQ-5D score (mean: 0.35)
N = 1397 and 1342
OLS regression with untransformed dependent variable
Marginal effect: the coefficients in the table represent the predicted effect of the listed factor on the
EQ-5D score (conditional on other factors being constant) e.g. people referred from hospital have EQ-
5D scores that are on average 0.054 lower than the overall mean.
In addition to a difference-in-difference model that estimates factors associated with
the level of EQ-5D score at T1 and T2, we can instead look directly at the difference
in EQ-5D score at T2 by subtracting the T1 score and using the result as our
dependent variable. In theory, this estimate should produce very similar results to

Home care re-ablement services: Investigating the longer-term impacts
82
the levels models. In this case, nonetheless, we are limited to using records where
outcomes data are available at T1 and T2 i.e. 382 repeated records.
Table 6.11 shows these results. In this case, baseline factors are included to
account for changes in outcome score, not levels at given time points. These
correlations were found to be far less strong. Nonetheless, we still see that people in
the re-ablement group had significantly better relative improvement in their EQ-5D
score than people in the comparison group. From baseline, the change in EQ-5D
was around 0.09 points higher in the re-ablement group than the comparison group.
This result is very similar to the above result from the difference-in-difference model.
Subject to the limitations of the data, we can conclude that re-ablement services
produce statistically significantly better outcomes for people on the EQ-5D scale than
the conventional home care services comparator.
Table 6.11 EQ-5D scores estimation – baseline difference model
Marginal effect SE Prob
ADL ability at baseline -0.004 0.036 0.906
ADL ability (sqrd) at baseline 0.000 0.003 0.905
Referred from hospital 0.031 0.041 0.445
Age -0.002 0.002 0.273
Alone 0.041 0.046 0.373
Female 0.049 0.042 0.254
Owns home 0.034 0.040 0.395
Re-ablement group 0.089 0.036 0.015
Constant 0.098 0.199 0.625
Re-ablement marginal effect 0.089
n 382
Imputations 5
Dependent variable: T2 EQ-5D score – T1 EQ-5D score (mean: 0.05).
OLS estimation, untransformed dependant variable.
6.5.2 Social care-related quality of life (ASCOT)
As mentioned above, the social care-related quality of life indicator reflects level of
need along nine dimensions: personal care/comfort; social participation and
involvement; control over daily life; meals and nutrition; safety; accommodation
cleanliness and comfort; occupation and usual activities; anxiety; and dignity and

Chapter 6 Quantitative outcomes
83
respect. Similar to the findings outlined for EQ-5D, the re-ablement group have
slightly higher ASCOT un-adjusted scores than the comparison group.
Table 6.12 gives mean ASCOT scores for the people in the re-ablement and
comparison groups at the baseline and follow-up. These results point to a very small
improvement for the re-ablement group over the comparison group, before
adjustment for baseline differences and time effects.
Table 6.12 ASCOT scores, by group and time
Group Baseline (T1) 12 month follow-up (T2)
mean (n) mean (n)
Comparison Group 0.76 (357) 0.78 (138)
Re-ablement Group 0.77 (621) 0.80 (238)
Table 6.13 shows that social care outcomes were significantly affected by health
problems as measured by perceived health and health-related quality of life. Better
social care outcomes were also associated with being older, lower FACS level and
participants not owning their own home. The area cost adjustment which reflects the
varying cost of service delivery in different areas (at baseline) also had a positive
impact on ASCOT. After all confounding factors were accounted for, people in the
re-ablement group did report statistically significantly better social care outcomes at
follow-up than people in the comparison group, at the ten per cent level indicating a
90 per cent confidence level. There is a good probability that re-ablement improves
ASCOT outcomes, although this possibility is not quite as high as in the EQ-5D
outcomes case.
Table 6.14 presents the baseline difference model for ASCOT i.e. where the
difference in the ASCOT score for individuals is used as the dependent variable.
These results show that people in the re-ablement group had greater relative
improvement in their ASCOT scores than people in the comparison group. Again,
the result was significant at the ten per cent level. From baseline, the change in
ASCOT scores was around 0.03 points higher in the re-ablement group than the
comparison group. This effect-size can be interpreted as the improvement in ASCOT
due to the use of re-ablement services.

Home care re-ablement services: Investigating the longer-term impacts
84
Table 6.13 ASCOT scores estimation – difference-in-difference model
Coeff
Marginal
effect SE Prob
ADL ability (log) 0.029 0.003 0.018 0.115 NS
Female -0.051 0.014 0.100 0.612 NS
Female x age 0.001
0.001 0.488 NS
Age 0.010 0.003 0.003 <0.001
Age (cubed) -3.20E-07
1.40E-07 0.019
Alone -0.003 -0.002 0.013 0.825 NS
In good health at T1 0.073 0.056 0.011 <0.001
EQ-5D score at T1 (sqrd) 0.226 0.117 0.023 <0.001
Referred from hospital 0.018 0.014 0.011 0.108 NS
Critical FACs band -0.064 -0.049 0.030 0.051
Owns home -0.025 -0.019 0.011 0.021
Area cost adj. (+1%) 0.337 0.003 0.139 0.015
Re-ablement Group at T1 -0.004 -0.003 0.012 0.771 NS
Re-ablement Group at T2 0.198 0.023 0.107 0.065
Re-ablement Group at T2 x
Age -0.002
0.001 0.109
T2 -5.77E-04 <0.001 0.015 0.97 NS
Constant -1.368 -1.057 0.207 <0.001
Re-ablement group 0.034 0.026 0.019 1.779
n 1,397
Imputations 5
Dependent variable: ASCOT score (mean: 0.77)
GLM (xtgee) regression with log transformed dependent variable and Gaussian distribution

Chapter 6 Quantitative outcomes
85
Table 6.14 ASCOT scores estimation – baseline difference model
Coeff SE Prob
Female 0.015 0.019 0.450 NS
Age -0.001 0.001 0.369 NS
ADL at T1 -0.013 0.015 0.376 NS
ADL at T1 (sqrd) 0.002 0.001 0.281 NS
EQ-5D score at T1 (sqrrt) -0.166 0.050 0.001
Good health at T1 0.044 0.018 0.017
Low FACs band -0.009 0.031 0.786 NS
Re-ablement group 0.032 0.018 0.073
Constant 0.210 0.070 0.003
Re-ablement marginal effect 0.03
n 382
Imputations 5
Dependent variable: T2 ASCOT score – T1 ASCOT score (mean: 0.02)
OLS estimation, untransformed dependent variable
6.6 Discussion and conclusions
Overall, we found that the use of re-ablement was significantly associated with better
EQ-5D and ASCOT outcomes than the use of conventional home care services in
the analysis. In other words, the analysis indicates that with a probability of over 95
per cent the use of re-ablement leads to improved outcomes for service users in
terms of health–related quality of life (EQ-5D). While the use of re-ablement was
associated with better social care-related quality of life (ASCOT), the impact was not
as strong as for the EQ-5D outcome measure.
When interpreting the outcome findings, we need to be somewhat cautious as the
sample size was smaller than hoped for, and there was a significant level of missing
data. A smaller sample size generally means a greater error range for our estimates,
or, put another way, gives us a lower probability that the true effect is positive and
falls in the range that is estimated. This consequence of a lower sample size applied
in particular in the ASCOT outcome estimation, where borderline statistical
significance was achieved.
Well-estimated „imputation‟ techniques were used to minimise the problems of
missing data, but the chance of possible bias cannot be completely removed.
However, to ignore the missing data could have also led to biases if they were not

Home care re-ablement services: Investigating the longer-term impacts
86
completely at random and a large amount of data would have been eliminated when
one data point was missing within the composite outcome measures.
The effect was stronger for the EQ-5D outcome measure which is not surprising,
given the nature of re-ablement services and the focus of these two outcome
measures. EQ-5D primarily measures the extent of an individual‟s personal
impairment to function. It then assumes, non-contentiously, that greater impairment
produces poorer quality of life. The ASCOT instrument focuses on whether quality of
life relevant activities can be achieved overall, not specifically on whether the
individual him or herself is personally impaired in trying to achieve them. It allows for
the possibility that an impaired person could be helped to achieve quality of life
relevant activities, such as by informal carers or conventional social care services.
For example, a person who is unable to dress themselves would have a low EQ-5D
score. But ASCOT allows that if that person was helped to dress by another person,
then being dressed, albeit with assistance from others, is a better outcome than not
being dressed. The availability of help to overcome impairments would then register
on the ASCOT measure but it would not necessarily register on the EQ-5D measure.
Arguably, this is a more appropriate way to consider the impact of social care
services. In particular, the impact of conventional home care services might be
under-measured using EQ-5D, which could make re-ablement outcomes appear
better in relative terms than they actually are.
A potential weakness with ASCOT is in being able to differentiate the value of the
personal achievement of some activity or state, rather than being helped to achieve
it. Most people would agree, for example, that being able to dress oneself is better
than being helped to dress (where both these cases are better than not being
dressed). Potentially, therefore, ASCOT might under-measure the benefits of re-
ablement services relative to conventional home care services.
In summary, the use of re-ablement was significantly associated with better health-
related quality of life and social care outcomes over time compared with the use of
conventional services. A key question in this evaluation is whether the home care re-
ablement service could improve outcomes without increasing the overall cost of the
social and health care system. Chapter 8 attempts to answer this question when it
considers the results of both the EQ-5D and ASCOT based cost-effectiveness
analyses.

87
Chapter 7 The unit costs of re-ablement services
Summary
A typical re-ablement episode costs around £2,000. Although these costs are
higher than for a typical home care package of the same duration, it is likely that
costs savings are made in the longer term.
Based on this research, it appears that the unit costs for services providing
therapists are no higher than those which provide social care only. This result
should be treated with caution, however, given that only one re-ablement service
in the evaluation had therapists embedded in the team.
7.1 Introduction
This chapter presents a discussion of the average costs of re-ablement services
across the five sites participating in the study. Detailed costs for each site are given
in Appendix E.
Only one site (R5) had OTs embedded in the team at the time the data were
collected in 2008/09. Another site (R4) was progressing towards a model of re-
ablement which will eventually include an occupational therapist, however, at the
time these data were collected, this change to the service had not been made and
therefore unit costs for site R4 do not include OT costs. As shown in Appendix B,
most of the services, although not having them embedded in the team (R2, R3, R4),
reported direct access to OTs. These local authorities, however, have not been able
to provide sufficiently accurate information on the total amount of services provided
by these OTs to enable their costs to be included in the overall cost. One of the five
sites (R2) is based in London.
Qualitative interviews carried out with the site managers and discussed in Chapter 4
revealed that all sites (except R2) operated purely as re-ablement services. In site
R2, re-ablement was part of the in-house home care service which resulted in home
care workers having mixed roles.
7.2 Costs of services
7.2.1 Description of costs associated with the service
Information was provided by all five of the re-ablement sites participating in the study.
Table 7.1 gives the average cost across the five sites for 2008/09 including the
average costs per service user (that is, total expenditure of all sites/total number of

Home care re-ablement services: Investigating the longer-term impacts
88
service users). Appendix E gives the average cost per service user for each site
separately. We have also calculated the average annual cost for the sites offering re-
ablement services without OTs embedded in the team and for all sites excluding R2
(based in London).
The basic unit cost for health and social care professionals is the cost per working
hour. However, for many purposes, in both research and commissioning, other
„units‟ are more useful. Therefore, we have also calculated the cost of an hour of
user contact time averaged across all sites (see Table 7.1 below), and for each site
separately (see Appendix E). The cost per hour of user contact time for each site
separately is used in Chapter 8 to calculate the costs of re-ablement services for
study participants.
Table 7.1 Costs associated with the service
Average costs £ Ranges £
Total average cost per site 3,339,647 937,739-7,646,516
Average cost per service user 2,088 1,609-3,575
Average cost per hour 20 16-23
Average cost per hour of contact 40 36-45
As shown in Table 7.1, the costs received from the sites provide an indication of the
average cost per service user (£2,088), ranging between £1,609 and £3,575; the
average cost per working hour (£20), ranging between £16 and £23; and the average
cost per hour of service user contact time (£40), ranging between £36-£45. Total
costs for the five sites ranged from £937,739 to £7,646,517, with an average cost per
service of £3,339,647.
Site R2 (London based) reported average costs of £3,575 per service user, an
average cost per working hour of £16 and an average cost per hour of contact of
£36. When we exclude the costs of this service, average costs per service user
across the remaining four sites reduced to £2,000, the average cost per working hour
increased to £21 and the average cost per service user contact hour increased to
£41. When we exclude the site with OTs embedded in the service (R5), average
costs per service user increased by less than one per cent from £2,088 to £2,095;
the average cost per working hour remained at £20 and the cost per hour of service
user contact time increased to £41. When we exclude R2 and R5 and include only
those services out of London providing re-ablement services without OTs embedded
in the team, the average cost per service user was £1,984 and the average cost per
working hour and per hour of service user contact was £21 and £42 respectively.

Chapter 7 The unit costs of re-ablement services
89
7.2.2 The costs broken down
We have also been able to provide a breakdown of the costs for each site and
therefore to calculate the percentage of expenditure which is allocated to salaries
and oncosts, overheads (direct and indirect), travel and capital overheads including
building, land and equipment costs. Table 7.2 shows the breakdown of averaged
costs across all sites. Appendix E gives the breakdown of costs for each site.
Table 7.2 Costs and unit estimation
Costs and unit estimation 2008/09
£
Percentage of
total costs (%)
Salary plus oncosts 2,148,989 64
Direct overheads
Administrative and management
Running costs, utilities, training etc.
Travel
689,064
37,065
314,559
21
1
9
Indirect overheads 141,479 4
Capital costs
(Building and equipment)
8,491
0
Total Cost
3,339,647 100
7.2.3 Care staff costs
The services in the five study sites vary in size and staffing numbers. On average,
staffing costs accounted for 64 per cent of total costs, but ranged between the sites
from 61 to 92 per cent of total costs. Excluding site R2, where staffing costs
accounted for a much higher proportion of total costs than the other four sites (92 per
cent), staffing costs ranged from 61 to 62 per cent of total costs. Given the high
proportion of staffing costs in site R2, it is unlikely that complete costs have been
provided by this site.
7.2.4 Overheads
There are two types of overheads, direct overheads and indirect overheads. Direct
overheads on the re-ablement service include administrative and supervision costs,
travel and training costs, uniforms and the running cost of buildings. On average for
the five sites, direct overheads (excluding travel) accounted for 22 per cent of total
costs, ranging from two per cent to 26 per cent across the five sites. Excluding R2
where direct overheads accounted for a lower percentage of total costs (two per
cent), direct overheads accounted for 24 per cent of total costs, ranging from 19 to 26
per cent.

Home care re-ablement services: Investigating the longer-term impacts
90
Travel costs for the five sites were nine per cent of total costs, ranging between two
and 12 per cent.
Indirect overheads are expenses that do not specifically relate to the service and
would continue whether the volume of work in this service increased or decreased.
Examples are the finance and human resources functions. On average, these costs
were four per cent of total costs, with a range of less than one per cent to nine per
cent for the five sites.
On average, total overheads (including travel) were 35 per cent of total costs for the
five sites and ranged between eight and 39 per cent of total costs. Excluding R2
where overheads accounted for a much lower proportion of total costs, total
overheads were either 38 or 39 per cent of total costs.
7.2.5 Capital costs
Capital costs (building, land and equipment) accounted for on average less than one
per cent of total costs. If the sites were unable to provide building and land costs, an
estimate was made based on the new build and land requirements for a local
authority office. This was adjusted according to the number of desk spaces required
for the service. Many of the sites operate a flexible working and desk sharing policy
and this has been taken into account when making the estimation and has been
approved by the sites.
The receipt of equipment (for example, grab rails, walking frames, wheel chairs) was
based on information provided by the local authority and costs were taken from the
Unit Costs of Health and Social Care 2009 (Curtis, 2009) publication which takes
account of the cost of installing the equipment and the price which is annuitized over
the expected life of the equipment. When this information was not available in the
Unit Costs publication, average prices have been taken from the website for the
online store Better Life Health Care and discounted over 10 years at 3.5 per cent
according to Government guidelines.
7.3 Discussion and conclusions
The introduction to this chapter discussed the difficulty in obtaining the total service
receipt provided by OTs to those service users undergoing re-ablement in sites
where OTs were not embedded (R2, R3 and R4). In the absence of this information,
it has not been possible to say whether it is more or less expensive to have OTs
embedded in teams compared to having direct access to OTs based outside re-
ablement teams. Instead, it has only been possible to compare the costs of R5
(which has OTs embedded within the team) with the other sites which have access to
NHS-employed OTs but have reported the costs borne by the local authority only. It

Chapter 7 The unit costs of re-ablement services
91
might be expected that those sites which have OTs embedded within re-ablement
teams are more costly than those which do not, however site R5 has reported a
lower cost per hour of contact than the average of the other four sites (£38 compared
to £41). For costs to be comprehensive, we would need to ensure that all relevant
costs are included irrespective of whether or not they are associated with public
expenditure.
Ideally, the cost of informal care should be included. The importance of including this
information in order to form a more complete picture of the true costs and benefits of
an intervention is discussed by Francis and McDaid (2009) in their paper „SCIE‟s
work on economics and the importance of informal care‟. They do, however, stress
that there remains no consensus on the methodology for measuring and valuing this
cost. Although this study of re-ablement has explored informal carers‟ experiences of
helping service users, it has not been possible to quantify time spent caring.
Re-ablement can be provided for a few days or up to several weeks depending on
the individual‟s needs. The annual average for all re-ablement service users across
the five re-ablement sites was 52 hours.8 It is interesting to note differences between
the sites. Three of the four sites (R1, R4 and R5) reported that the average number
of hours service users received was between 52 hours and 55 hours. R3 reported
fewer contact hours per service user (35) and R2 reported more (99). This could
indicate that these sites (R2 and R3) provide a service for those with different needs
requiring more or less time as appropriate or it could relate to the relative efficiency of
the sites. Whilst these reasons may apply to site R3 and may indicate a different type
of service user or more efficient service, the most likely explanation for the higher
number of contact hours for the service users of site R2 is that the team is multi-
purpose resulting in home care workers having mixed roles. It is possible, therefore,
that the number of contact hours for the re-ablement service in R2 has not been
accurately recorded as workers reported that they did not know which service users
were receiving conventional home care and which had been referred for re-ablement
(see Chapter 4).
As mentioned above, when we exclude R2 (the London based site) where higher
living costs inevitably raise the cost of providing the service, the average cost per
service user across the remaining sites decreases from £2,088 to £2,000 and the
range of costs is much smaller (£1,609 to £2,186). It is interesting to note, however,
that the cost per working hour and the cost per hour of service user contact in R2 are
lower than in the other sites. This must be treated with caution, however, due to the
reasons discussed above.
8 This figure differs from the 38 hours received by study participants given in Chapter 3 because it is
based on annual throughput at the five sites and not actual use of re-ablement by study participants.

Home care re-ablement services: Investigating the longer-term impacts
92
As mentioned in Chapter 4, rapid provision of equipment such as grab rails or
walking frames was considered a major part of re-ablement services. The cost of
equipment has been included in the unit cost of the service but together with the
capital costs of buildings and land, these costs account for less than one per cent of
the total costs. This estimation should be treated with caution, however, as data
provided by local authorities on the receipt of equipment does not include equipment
purchased privately.
When drawing conclusions about the costs of the re-ablement service, it is important
to take into account any cost savings made if service users are referred to the re-
ablement team rather than other teams, such as those providing conventional home
care services. Site R3 carried out some work with a view to increasing the capacity in
their re-ablement team by 20 per cent (personal communication with R3). Their
research revealed that after service users received a re-ablement package, 58 per
cent of cases needed no further services compared with just five per cent of those
referred to the independent sector. On this basis, they estimated that for every
successful re-ablement costing £1,609, around £5,000 per annum is being saved on
independent home care costs resulting in a potential saving of £1,296,066 per year.
They also estimated that if they had not referred their service users to the re-
ablement team, they would have incurred an additional £5 million in independent
homecare costs. The project to increase the capacity of the re-ablement team went
live in January 2010 and R3 revealed that they are on target to achieve the predicted
savings.
Using data available in the Unit Costs of Health and Social Care 2009 (Curtis, 2009),
it is worth noting that the average annual cost per client for providing short-stay
residential care for people having difficulty managing at home, or who have been
recently discharged from hospital, was £2,688 for social care only and £3,442 for
health and social care (28 per cent and 67 per cent higher respectively than the
equivalent re-ablement services). Not surprisingly, however, the average annual cost
of the re-ablement service is higher than that of a typical home care package. Based
on a weekly cost of £232, home care (if all hours are provided by the local authority),
would cost £1,392 for six weeks or £1,624 for seven weeks; or £1,080 (for six weeks)
and £1,261 (for seven weeks) if home care was independently provided (Curtis,
2009). As mentioned above, though, it is more likely that following re-ablement no
further services are required which leads to cost savings in the longer term.
The costs reported in this chapter have been approved by all five local authorities
taking part in the evaluation of re-ablement services. Interviews with site managers,
however, have revealed that occasionally some service users were referred for re-
ablement but moved to another more appropriate service within a very short time.
When this has happened, it could be argued that these service users have not
undergone re-ablement and therefore should not be included in the annual

Chapter 7 The unit costs of re-ablement services
93
throughput of service users. If they were excluded, the average cost would be higher
than reported in this chapter.
This research has provided a detailed costing of five re-ablement services: three
have costs of just over £2,000 per service user; one has costs of £1,609 per service
user and the other has an average cost of £3,575 per service user. Although these
costs are higher than the cost of receiving home care for the same length of time,
there is an indication from the research carried out by R3 that cost savings can be
made in the longer term. This confirms the findings of a previous study which
indicated that re-ablement may reduce the subsequent use of home care services
(Newbonner et al., 2007).
Ideally, future work should include the costs associated with informal carers. This
would allow analysis of cost savings to be carried out if carers were „trained‟ to play a
more significant part in the re-ablement process as described in Chapter 5.


95
Chapter 8 Costs and cost-effectiveness of home care
re-ablement
Summary
Re-ablement was associated with a significant decrease in subsequent social
care service use. The costs of the social care services used by people in the re-
ablement group during the 12 months of the study (excluding the costs of the re-
ablement intervention itself) were 60 per cent less than the costs of the social
care services used by people using conventional home care services.
However, this reduction in social care costs was almost entirely offset by the initial
cost of the re-ablement intervention. The total (including re-ablement) mean cost
of the social care services used by the re-ablement group was £380 lower than
the total mean cost of the social care services used by the comparison group.
The re-ablement group had significantly higher healthcare costs than the
comparison group during the first eight weeks of the study. However, more
people in the re-ablement group had been referred to the service following
discharge from hospital. These people had significantly higher healthcare costs
(mainly arising from further hospital in-patient episodes) during the first eight
weeks of the study than people who had been referred to re-ablement from the
community. However, there was no significant difference between the re-
ablement and comparison group in the costs of the health services used during
the subsequent ten months of the study. When baseline differences were taken
into account, there were also no significant differences in the duration of inpatient
stays or the total costs of healthcare service use when averaged across the two
groups over the full 12 months of the study.
Taking total healthcare, social care and re-ablement costs together, there was no
statistically significant difference in the costs of all the services used by the re-
ablement and comparison group over the 12 month study period.
Cost-effectiveness was based on health-related quality of life (EQ-5D) and social
care-related quality of life (ASCOT). At a threshold of £30,000 per EQ-5D
outcome gain, there was a 99 per cent probability of re-ablement being cost-
effective when both health and social care costs were included and just under 100
per cent if social care costs only were included. At a more stringent threshold of
£20,000 per EQ-5D outcome gain, in the case of health and social care costs the
probability of cost-effectiveness fell to around 98 per cent, but was still over 99
per cent when only social care costs were taken into account.

Home care re-ablement services: Investigating the longer-term impacts
96
In terms of social care outcomes (ASCOT) at a threshold of £30,000 per gain, the
probability of re-ablement being cost-effective was 78 per cent if health and social
care costs were included and rose to 98 per cent when social care costs only
were included. At a more stringent threshold of £20,000 per ASCOT outcome
gain, in the case of health and social care costs, the probability of re-ablement
being cost-effective was 68 per cent, but still 98 per cent when only social care
costs were included.
Taking a social care perspective, as the probability reached above 95 per cent at
both the £30,000 and £20,000 thresholds, we can conclude with a high statistical
probability that re-ablement is cost-effective on the basis of data in this study.
Taking a wider perspective that includes health care costs, at a threshold of
£30,000 per EQ-5D outcome gain, re-ablement was cost-effective. However, it
was less certain for ASCOT outcome gain, but re-ablement is more likely to be
cost-effective than not cost-effective.
8.1 Introduction
This chapter explores the relationships between needs, other characteristics of
individuals and costs, and more importantly the impact of receiving a home care re-
ablement service on these relationships. We then pull the costs and outcomes
findings together to assess the cost-effectiveness of re-ablement compared with
conventional home care services.
8.2 Method
There were two principal sources of data: individuals/carers themselves and local
authorities‟ records. As reported in Chapter 2, information was collected on all
participants‟ use of social care services during the re-ablement period for the re-
ablement group or the first eight weeks after referral for conventional home care for
participants in the comparison group. An eight week period was selected to be
consistent with the eight week period used to cost health service use.
Local authorities were asked to provide unit costs for all services used by people in
their area. Each unit cost was multiplied by the appropriate frequency of use by
study participants and summed to produce an overall social care cost for each
participant. If the unit costs were not supplied, data from the PSS EX1 2008-2009
were used and inflated to 2009-2010 prices. The data were sent to each local
authority to confirm that they agreed with the prices which were going to be used in
the analysis. The social care resources identified, along with average unit costs
supplied by the local authorities, are listed in Table F2 in Appendix F.

Chapter 8 Costs and cost-effectiveness of home care re-ablement
97
Eight weeks after recruitment to the study, a postal questionnaire was sent to each
participant asking for information about health care, social care service receipt and
equipment since agreeing to participate in the study. For the analysis, we only used
the information around health care service use as there was a risk of double counting
with the information supplied by the local authorities. For health services, each
participant was asked about contacts with their GP, health visitor, district nurse,
occupational therapist, chiropodist, day hospitals, accident and emergency units and
inpatient hospital stays. National unit costs were used for these services (Curtis,
2009) inflated to 2009-2010 prices. The service resources identified, along with their
unit costs, are listed in Table F1 in Appendix F. Each unit cost was multiplied by the
appropriate frequency of use and summed to produce an overall health care cost for
each participant. The 12 month follow-up interview (T2) (see Appendix D) explored
the health service use over the previous month apart from inpatient hospital stays
which related to the full follow-up period.
The cost-effectiveness analyses computed the improvement in outcome from use of
re-ablement services compared to conventional services, adjusted for baseline
differences (see Chapter 6). Similarly, the (adjusted) mean difference in costs of re-
ablement compared to conventional home care services was obtained. The outcome
gains over cost-difference can be expressed as a ratio to convey cost-effectiveness.
Simulations were made with the data in order to consider whether these ratios were
statistically likely to be interpreted as indicating that re-ablement is cost-effective, that
is, whether the service achieved better user outcomes at a cost that is worth paying.
8.3 Social care costs
The average cost per study participant of home care re-ablement services was
calculated using the number of hours people received the service and the newly
calculated unit cost per hour of client contact time outlined in Appendix E. Table 8.1
shows that, for these study participants, the average cost of home care re-ablement
services was around £1,5109 for a period of five to six, but up to around eight,
weeks.10 During the initial eight week period, the social care costs (including any re-
ablement costs where relevant) were higher among people in the re-ablement group
(mean £1,640) compared with those receiving conventional home care services in
9 This figure differs from the £2,088 average cost of a re-ablement episode presented in Chapter 7
because it is based on site specific unit costs and a sample of people receiving re-ablement in each site (i.e. those recruited to the study) rather than annual throughput. See Appendix E for further information. 10
There were two people who received the home care re-ablement service for more than 20 weeks. The costs associated with the two extreme cases were set to missing because it was thought that the information was unreliable. The data points would have been imputed during the missing data imputation process.

Home care re-ablement services: Investigating the longer-term impacts
98
the comparison group (mean £570; p< 0.001). However, during the following ten
months, social care costs were significantly higher for people receiving conventional
home care services (mean £2,240) compared with those in the re-ablement group
(£790; p<0.001). Over the twelve month period, the overall social care cost for
people receiving conventional services was not significantly higher (average £2,810)
than for people in the re-ablement group (£2,430).
Table 8.1 also shows the mean costs across the whole sample for which there were
data on use of other social care services. However, the number of people actually
receiving these services was generally low in both groups. These numbers are not
presented but, for example, only six people in the comparison group and none in the
re-ablement group used day care services in the ten month follow-up period. For
social care services other than meals on wheels, more people receiving conventional
home care services were in receipt of each service compared with those in the re-
ablement group. During the initial eight week period, 12 per cent of people in the re-
ablement group received meals on wheels compared to five per cent in the
comparison group. In the remaining ten months, four per cent received meals on
wheels in the re-ablement group compared to six per cent in the comparison group.
The percentage of people receiving independent home care was lower in the re-
ablement than the comparison group both within the first eight weeks (two per cent
and 65 per cent respectively) and the remaining ten months (18 per cent and 50 per
cent respectively).
Table 8.1 Social care service costs by intervention groups11
Mean cost for the initial eight
week period
Mean cost for the follow-up 10
month period
Social Care Resource Re-ablement
group
Mean cost (N)
Comparison
group
Mean cost (N)
Re-ablement
group
Mean cost (N)
Comparison
group
Mean cost (N)
Re-ablement services £1,5101 (435) 0 0 0
In-house home care £6 (438) £90 (285)*** £270 (385) £590 (195)**
Independent home care £4 (438) £510 (285)*** £450 (375) £1,660 (180)***
Day care <£1 (438) £7 (286)* 0 £60 (196)*
Meals on wheels £30 (439) £8 (286)* £60 (385) £70 (196)
Overall social care cost
(including equipment)
£1,640 (435) £570 (336)*** £790 (385) £2,240 (196)***
*** p< 0.001; ** p< 0.01; *p<0.05. 1 Calculated using actual unit cost per hour of client contact time for each re-ablement site (see
Appendix E).
Rounded to the nearest £10.
11
A cost could only be produced if local authorities provided the relevant frequency (for example number of hours of home care). Missing information has resulted in inconsistency with the reported number of participants receiving each social care service.

Chapter 8 Costs and cost-effectiveness of home care re-ablement
99
8.4 Health care costs
Health care costs were calculated across the whole sample where we received
information on whether or not participants received the service. For example, for GP
costs, the number 399 includes both people who visited their GP and those who did
not (i.e. those who had a cost of £0). Table 8.2 shows that there was a significantly
higher health care cost (mean £1,600) for people in the re-ablement group during the
initial eight week period compared with those in the comparison group (mean £1,095;
p< 0.05). However, there was not a significant difference in the cost of health care
services during the following 10 months after receiving the home care re-ablement
services. In terms of each health care service, the costs for hospital inpatient stays,
visits to an outpatient department, and visits to the nurse and therapist were
significantly higher for the re-ablement group compared with those in the comparison
group during the initial eight weeks. During both the initial eight weeks and following
10 months, people in the comparison group had significantly higher chiropody costs
than those in the re-ablement group. There was no statistically significant difference
in health care costs between the two study groups over the whole 12 month period.
Table 8.2 Health service use and costs by intervention groups
Mean cost for the initial eight
week period
Mean cost for the follow-up ten
month period
Health Resource Re-ablement
group
Mean cost (N)
Comparison
group
Mean cost (N)
Re-ablement
group
Mean cost (N)
Comparison
group
Mean cost (N)
GP £125 (399) £115 (253) £685 (241) £650 (140)
Accident and
Emergency
£77 (399) £63 (252) £101 (240) £154 (139)
Hospital inpatient £954 (370) £550 (238)***12
£1,445 (237)13
£970 (139)
Hospital outpatient £201 (388) £148 (244)** £539 (241) £678 (140)
Nurse £278 (383) £214 (239)** £533 (234) £548 (139)
Therapist £64 (391) £42 (249)*** £124 (238) £146 (140)
Chiropodist £14 (401) £25 (250)*** £85 (238) £122 (139)**
Overall health cost £1,600 £1,095* £3,455 £3,235 (ns)
*** p< 0.001; ** p< 0.01; *p<0.05; ns =p>0.05
12
The maximum inpatient cost during the initial eight weeks would be £14,880. There were two data points over £21,575 and were set to missing. The data points would have been imputed during the missing data imputation process. 13
The T2 questionnaire asked participants about the number of days they spent in hospital across the whole of the study period rather than in the previous month. The risk of double counting between the initial eight week period and the responses from the T2 interview was explored. There were two inpatient costs over £20,000 since the time that participants joined the study. The two data points were set to missing to reduce the risk of double counting with the data collected during the initial eight weeks.

Home care re-ablement services: Investigating the longer-term impacts
100
Table 8.3 shows health service use and costs by referral route. The table shows that,
overall, people in the re-ablement group who had been referred from hospital had
significantly higher health costs during the initial eight week period (£1,850)
compared with those who had been referred from the community (£1,020; p< 0.01).
Table 8.3 Health service use and costs by referral route
Re-ablement group Comparison group
Health resource Community
referral
Hospital referral Community
referral
Hospital
referral
Mean cost (N) Mean cost (N) Mean cost (N) Mean cost (N)
GP £110 (100) £130 (257) £110 (115) £120 (129)
Accident and
Emergency
£50 (100) £80 (258)* £60 (114) £60 (130)
Hospital inpatient £470 (96) £1,170 (237)* £490 (111) £540 (119)
Hospital outpatient £160 (98) £210 (250)* £130 (111) £160 (125)
Nurse £220 (97) £310 (245) £540 (57) £550 (79)
Therapist £40 (95) £70 (255)** £150 (56) £150 (81)
Chiropodist £21 (101) £10 (257) £130 (56) £120 (80)
Overall health
cost – 8 weeks
£1,020 (102) £1,850 (261)** £1,030 (116) £1,090 (130)
Overall health
cost during the
study period
£3,000 (68) £3,790 (157) £2,930 (57) £3,520 (81)
Rounded to the nearest £10.
*** p< 0.001; ** p< 0.01; *p<0.05.
8.5 Overall impact on costs
The costs data were drawn from the questionnaires at baseline and follow-up, and
from local authority service use records. In combining the range of individual cost
components, including re-ablement costs, eight week social care costs, ten month
social care costs, eight week health care and ten month health care costs, we
compound the number of any missing values on individual cost items. Where a case
has missing data on a single item then the sum across all items is also missing, even
if data on the other items are available. In order not to lose data in this way, we use
multiple imputations to replace individual missing values which therefore allows us to
sum up for the total cost (i.e. the sum of the non-missing plus imputed values) – see
Appendix F for details. Table 8.4 gives the cost data with imputed values.

Chapter 8 Costs and cost-effectiveness of home care re-ablement
101
Table 8.4 Costs (£s), with imputed missing values
N Mean costs
(£)
Std. Dev.
Min costs
(£)
Max costs
(£)
Comparison group Re-ablement 259 0 0 0 0
Social care 8 weeks 259 560 650 0 3,428
Social care 10 months 259 2,500 3,500 0 24,743
Total social care costs (12 months) 259 3,060 3,790 0 12,476
Health costs 8 weeks 259 1,090 1,660 0 19,865
Health costs 10 months 259 3,420 3,750 0 25,465
Total costs (12 months) 259 7,560 6,090 0 43,012
Re-ablement group Re-ablement 438 1,500 1,280 0 6,720
Social care eight weeks (exc. re-ablement) 438 120 290 0 2,890
Social care ten months 438 1,030 2,010 0 18,200
Total social care costs (12 months) 438 2,650 2,610 0 22,400
Health costs eight weeks 438 1,520 1,860 0 12,890
Health costs ten months 438 3,710 3,770 0 22,300
Total costs (12 months) 438 7,890 5,380 0 33,640
Rounded to the nearest £10.
The results in Table 8.4 show, in particular, the reduction in social care use by the re-
ablement group. Because recipients use a range of services, the impact of re-
ablement on service use is best illustrated by the reduction in the cost of the care
package in the re-ablement group. The table shows the raw or un-adjusted cost of
care. Since the two groups differ somewhat according to their baseline
characteristics, we can also use the cost function results (described below) to adjust
for this difference. Essentially, we calculate the average costs of care (the annual
cost of the care package) for the two groups as if, on average, the groups had people
with the same characteristics – the same age, gender mix, referral route and so on.
The annual social care costs, excluding re-ablement costs (i.e. ten months plus eight
weeks) in the table are £3,060 for the comparison group and £1,150 for the re-
ablement group (see Table 8.4: total social care costs £2,650 minus re-ablement
costs of £1,500), a reduction of more than 60 per cent. The equivalent figures, when
adjusted for baseline differences are:
Comparison group: £2,850 p.a.
Re-ablement group: £1,130 p.a.
i.e. a 60 per cent reduction. In other words, the cost of social care services for people
using re-ablement services was only 40 per cent of the cost of services needed by
people in the comparison group.

Home care re-ablement services: Investigating the longer-term impacts
102
8.6 Predictors and sources of cost variation
The study data give us an opportunity to investigate why costs of care vary between
individuals, not least in terms of the services they used and their characteristics. In
addition to exploring the factors associated with the service expenditure, we used
multivariate regression techniques to:
a) Control for the effect on service expenditure of potential differences in socio-
demographic characteristics in the re-ablement and comparison groups and also
local area differences.
b) Investigate in greater detail the nature of the interactions between needs, costs
and outcomes.
We can investigate the impact of a range of baseline characteristics (such as age,
gender and need), a person‟s circumstances at baseline (such as their living
arrangements, whether they were referred from hospital), and their use of re-
ablement services or not, on total service expenditure. Table 8.5 summarises the
findings from this multivariate estimation. Many of these baseline characteristics
were not significantly correlated with costs. Ability with activities of daily living was
found to be negatively associated with total service expenditure, indicating that,
unsurprisingly, people who could perform more activities of daily living received fewer
services compared with those who were more dependent.
Once all confounding factors were accounted for, the level of total service
expenditure over the 12 month period was not related to initially receiving the home
care re-ablement service.
Table 8.5 Total service expenditure
Coefficient Marginal
effect
SE Prob
Age 0.016 -68 0.024 0.526 NS
Age (sqrd) -0.0001
0.000 0.358 NS
Female -0.083 -685 0.068 0.230 NS
Alone 0.161 1337 0.073 0.032 NS
Owns home 0.016 134 0.076 0.834 NS
ADL ability (+1 ADL) -0.058 -479 0.017 0.001
Referred from hospital 0.162 1344 0.072 0.033
Re-ablement group 0.034 282 0.072 0.642 NS
Constant 8.785
0.979 <0.001
Dependent variable: Total cost (mean: £7770 p.a.).
Minimum n =697.
GLM regression with Log dependent variable and gamma distribution.
Marginal effect: Change in Total Cost for change in listed factor.

Chapter 8 Costs and cost-effectiveness of home care re-ablement
103
Table 8.6 shows that, consistent with the predictors of total service expenditure, the
ability to perform more activities of daily living was associated with a lower level of
social care expenditure. Once we removed the cost of health care service receipt, a
higher level of expenditure was associated with living alone. Living alone, in
particular, is a strong indicator of the extent of informal care support a person might
receive, and this in turn affects their need for social care.
After all confounding factors were accounted for, the level of social care service
expenditure was not related to initially receiving the home care re-ablement service.
Table 8.6 Social care expenditure
Coefficient Marginal
effect
SE Prob
Age 0.037 -11 0.032 0.247 NS
Age (sqrd) -0.0002
0.000 0.237 NS
Female -0.123 -330 0.102 0.231 NS
Alone 0.354 950 0.094 <0.001
Owns home 0.117 315 0.083 0.156 NS
ADL ability (+1 ADL) -0.103 -277 0.023 <0.001
Referred from hospital 0.058 157 0.090 0.519 NS
Re-ablement group -0.085 -229 0.088 0.332 NS
Constant 6.954
1.229 <0.001
Dependent variable: Social care cost (mean: £2800 p.a.).
n=697.
GLM regression with Log dependent variable and gamma distribution.
Marginal effect: Change in Social care cost for change in listed factor.
8.6.1 Hospital cost analysis
A main driver of health care costs (which differentiate total costs from social care
costs in the analysis) is the use of inpatient hospital services. Table 8.7 categorises
people by time in hospital (as an inpatient) during the study. Around a third of people
had a stay, with around six per cent of people staying in hospital for more than 28
days. The study data suggest that people in the re-ablement group were more likely
to be an inpatient and stay for longer if they were admitted.

Home care re-ablement services: Investigating the longer-term impacts
104
Table 8.7 Hospital day categorisation
Days in hospital
since start of study
Re-ablement group Comparison group Total across both
groups
% (n) % (n) % (n)
0 days 64.98 (154) 74.29 (104) 68.44 (258)
1 day 3.80 (9) 4.29 (6) 3.98 (15)
2-4 days 5.91 (14) 2.86 (4) 4.77 (18)
5-28 days 17.72 (42) 14.29 (20) 16.45 (62)
More than 28 days 7.59 (18) 4.29 (6) 6.37 (24)
Total 100 (237) 100 (140) 100 (377)
Table 8.8 shows time in hospital as an inpatient by referral route: hospital or
community. Twenty-two per cent of people in the re-ablement group who were
referred from hospital reported they had been in hospital between five and 28 days
during the study period compared to 11 per cent among people in the comparison
group. Around ten per cent of people in the re-ablement group who were referred
from community reported that they had stayed in hospital between five and 28 days
compared to 19 per cent among people in the comparison group.
Table 8.8 Hospital day categorisation by referral route
Days in
hospital since
start of study
Hospital referral Community referral
Re-ablement
group
Comparison
group
Re-ablement
group
Comparison
group
% (n) % (n) % (n) % (n)
0 days 60.13 (92) 71.60 (58) 75 (51) 77.19 (44)
1 day 3.27 (5) 7.41 (6) 2.94 (2) (0)
2-4 days 5.23 (8) 3.70 (3) 7.35 (5) 1.75 (1)
5-28 days 21.57 (33) 11.11 (9) 10.29 (7) 19.30 (11)
More than 28
days
9.80 (15) 6.17 (5) 4.41 (3) 1.75 (1)
Total 100 (153) 100 (81) 100 (68) 100 (57)
The results of Tables 8.7 and 8.8 suggest that people in the re-ablement group had
higher average hospital stays than people in the comparison group. Much of the
difference stems from the higher proportion of re-ablement people that were admitted
in the study period (35 per cent of people) compared to the comparison group, where
only 25 per cent of people were inpatients. In any case, these are unadjusted
numbers and do not account for the possibility that people in the re-ablement group
may have been sicker than those in the comparison group before the study started.
Certainly, more people in the re-ablement group were discharged from hospital into
the study. Multiple regression analysis can be used to control for these baseline
differences by estimating the independent effects of relevant factors, such as the

Chapter 8 Costs and cost-effectiveness of home care re-ablement
105
increased chance of hospital admission by 12 month follow-up (T2) resulting from
having been discharged from hospital at baseline. Where these factors are included
in the estimation, their effect can be estimated in a way that is independent of
whether a person received re-ablement services or not. The usual method of
estimation requires us to assume that the variable in question, here the number of
hospital days, has (close to) a normal distribution. But this assumption does not hold
in this case, where we have over two-thirds of the sample with zero hospital days.
Instead, we estimate a two-part model: first we model the probability that each
person had a hospital stay, and then, secondly, if they did have a stay, we model
how many days they spent in hospital (Dow and Norton, 2003). In each case, we can
control for baseline differences and so arrive at estimates of the effect of re-ablement
on, first, the chance of being an inpatient and, second, on how many days people
stayed in hospital, where both estimates are made independently of people‟s
baseline characteristics. The final step involves combining these estimates to
produce a more accurate overall estimation of the effect of re-ablement services on
average hospital bed-days, other things equal.
Table 8.9 presents the results. Controlling for age, gender, home ownership, baseline
need, self-reported health and hospital discharge referral, the analysis indicates that
people in the re-ablement group were statistically significantly more likely to be
admitted to hospital than people in the comparison group (95 per cent confidence
level). However, for those people that were admitted, those in the re-ablement group
did not have a (statistically significantly) longer stay than those inpatients in the
comparison group. When we combine the two effects, overall those people in the re-
ablement group had an average of 2.1 days longer in hospital. To assess whether
this is a statistically significant difference overall we need to combine the sample
variance of the two estimators (from the two-part model) and this was achieved by
bootstrapping (see section 8.7.1 for further details about „bootstrapping‟) the whole
two-part estimation for each of the five imputation samples. The results were
combined, using Rubin‟s Rules, to produce a standard error of 1.6 on the net effect of
2.1 more hospital days i.e. a 95 per cent confidence range of -1.0 days to +5.2 days.
In other words, on average for all people (including those with zero use of hospital),
those in the re-ablement group did not spend a statistically significantly longer time in
hospital. We can think of this finding as equivalent to saying that, on average, the
expected use of hospital care is 2.1 days longer for people using re-ablement
services compared with conventional services, but that this difference is not a
statistically significant one because, at the 95 per cent confidence level, the actual
difference between the re-ablement and comparison groups could be minus 1 day to
plus 5.2 days.
Further investigation using interaction effects, particularly between initial referral from
hospital and being in the re-ablement group did not qualitatively change this
conclusion.

Home care re-ablement services: Investigating the longer-term impacts
106
Table 8.9 Hospital day category estimation – baseline difference model
Probability of admission Length of stay of inpatients
Co-eff Prob Co-eff Prob
Age 0.001 0.909 0.252 0.231
Female -0.176 0.277 -2.424 0.620
Lives alone 0.116 0.506 -7.694 0.158
Owns home -0.186 0.239 -0.834 0.844
T1 ADLs -0.033 0.410 0.626 0.587
Referred from hospital 0.321 0.046 5.322 0.292
Good health at baseline -0.415 0.009 7.128 0.183
Re-ablement group 0.295 0.045 0.307 0.945
Constant -0.473 0.470 -4.217 0.823
n 377 119
Estimator Probit OLS
8.7 Cost-effectiveness analyses
In addition to the question of whether re-ablement works in improving outcomes for
people, we need also to consider whether re-ablement services achieve these
improvements at a cost that is worth paying. To compare the relative costs and
outcomes between the home care re-ablement and comparison groups, we carried
out cost-effectiveness analysis (CEA) which is a form of economic evaluation. The
CEA is commonly expressed in terms of a ratio between an outcome gain and the
cost associated with the gain.
8.7.1 Calculating and visualising cost-effectiveness ratios
The cost-effectiveness evaluation examined the mean differences in outcomes over
a 12 month period between people who initially received the home care re-ablement
service in five local authorities and those receiving conventional home care services
in five different authorities. The outcome difference was compared with the mean
difference in costs, after adjustment for baseline characteristics. This ratio of cost
difference to outcome difference – the incremental cost-effectiveness ratio (ICER) –
was computed on two outcomes: the EQ-5D indicator and the total ASCOT score.
An assessment of cost-effectiveness is made according to the relative size of cost-
and outcome-differences. A four quadrant cost-effectiveness chart is useful when
interpreting the results – see Figure 8.1.

Chapter 8 Costs and cost-effectiveness of home care re-ablement
107
Figure 8.1 The cost-effectiveness plane
The four quadrants represent different results from the cost-effectiveness analysis:
A ratio in the North West would indicate that the re-ablement service was more
cost-effective than conventional support arrangements.
A ratio in the South East quadrant would indicate that the re-ablement group has
worse outcomes and higher costs relative to the comparison group.
Conventional arrangements would appear to be cost-effective.
In the North East quadrant, however, the conclusion would be that the re-
ablement group had better outcomes but also higher costs.
Finally, ratios in the South West quadrant, would indicate that the re-ablement
group had worse outcomes than the comparison group, but had lower costs.
This result would indicate that the cost reduction that would follow from
introducing a home care re-ablement service would only be achieved by leaving
service users with worse outcomes.
As reported in Chapter 6, re-ablement services were found to be associated with
significantly better EQ-5D outcomes and also, slightly more tentatively, with better
ASCOT outcomes. Above, we also reported that re-ablement services were not
statistically significantly more costly than conventional services, even when
adjustment is made to reflect baseline differences in need and other relevant
characteristics. In other words, on average, if people with the same characteristics
received re-ablement services this would be no more costly over a year than if they
Creable < CSC
Key
C = costs
E = effects
Re-ablement = re-ablement group
SC = conventional home care (comparison group)
Creable> CSC
Ereable> ESC
Ereable< ESC
North West
South West
North East
South East

Home care re-ablement services: Investigating the longer-term impacts
108
received conventional home care services, according to the data collected in this
study.
We do have some grounds, therefore, to infer that re-ablement services lead to better
outcomes at the same costs and are thus cost-effective overall. However, our results
on the individual costs and outcomes effects do not necessarily result in a favourable
cost-effectiveness ratio (of cost difference over outcome difference), particularly if we
expect significant correlation between the costs and outcomes differences comparing
re-ablement with the comparison group.
Even if the outcome effect is always positive (i.e. better outcomes for re-ablement),
the distribution of values of a cost-effectiveness ratio will include positive values
where re-ablement has better outcomes but also higher costs than conventional
home care services (because the distribution of cost differences is both positive and
negative around zero). In other words, given the error margin on our estimates, there
is a good chance that the actual cost-effectiveness ratio could be in the North East
quadrant of Figure 8.1. For these values, we cannot say that re-ablement is
unambiguously cost-effective without further criteria.
Conventionally, cost-effectiveness is judged against a cost-effectiveness threshold.
This requires that an extra unit of outcome (e.g. a unit change in EQ-5D) is achieved
at an extra cost of no more than £X per annum. The size of £X is arbitrary but the
National Institute for Health and Clinical Excellence (NICE) has tended to work with a
cost-effectiveness threshold for acceptance of somewhere between £20,000 and
£30,000 per EQ-5D quality-adjusted year of life. It is important to note that spending
£30,000 per outcome gain is at the top end of NICE's threshold. Using these criteria
we can undertake analysis to establish, given the distribution of costs and outcomes
we observe in the data, the likelihood that the actual cost-effectiveness ratio for re-
ablement is below this threshold.14
A practical method for this purpose is to use bootstrapping, which involves randomly
re-sampling the data (by randomly drawing and replacing observations) many times
(normally 1,000 times) and then re-estimating both the adjusted cost-difference and
outcome-difference between re-ablement and comparison groups. In our case, these
adjustments result from the difference-in-difference models for outcome reported in
Chapter 6 and the cost-difference estimations outlined above (with multiply-imputed
data). We re-run this whole system of estimations 1,000 times. The result is 1,000
14
In theory, we could try to establish the statistical 95 per cent confidence interval in which we expect to find the true cost-effectiveness ratio value. In practice, this tends to be difficult because the distribution of ratios is often far from normally distributed (especially where the denominator is close to zero) and often impossible to calculate mathematically from the separate distributions of numerator and denominator.

Chapter 8 Costs and cost-effectiveness of home care re-ablement
109
(point) estimates of the cost-difference and the outcome-difference and, when put
together, a cost-effectiveness ratio. We then assess the probability that the true
cost-effectiveness ratio is below the £X threshold by determining the proportion of the
1,000 bootstrap values that are below this level.
Below we give these results for both the EQ-5D and ASCOT outcome measures.
We present scatter plots of the outcome-difference and the cost-difference for each
bootstrap repetition. These plots, which present the results in terms of the cost-
effectiveness plane – see Figure 8.1 – give a graphical sense of where the bulk of
values lie. We also present cost-effectiveness acceptability curves (CEACs) that
give the probability that re-ablement is cost-effective for a range of values of the £X
threshold.
8.7.2 EQ-5D cost-effectiveness
Figure 8.2 gives the EQ-5D scatter plot with differences in total costs (health and
social care) between re-ablement and comparison groups. As the adjusted EQ-5D
outcome difference is statistically significantly different from zero, with point estimate
of 0.1 (see Chapter 6, section 6.5.1, esp. Table 6.10), we see the bulk of bootstrap
repetitions are above zero on the vertical axis and clustered around that 0.1 value.
For total costs, the cost-differences on the horizontal axis are mostly in the positive
range, but with a sufficient number of negative cost differences for us to be unable to
say that the cost-difference is not different from zero. The majority of cases are in
the better outcomes but higher costs quadrant of the plot, but with many values
below a CE ratio (of cost-difference over outcome-difference) of £30,000.
Figure 8.2 EQ-5D cost-effectiveness scatter plot – total costs
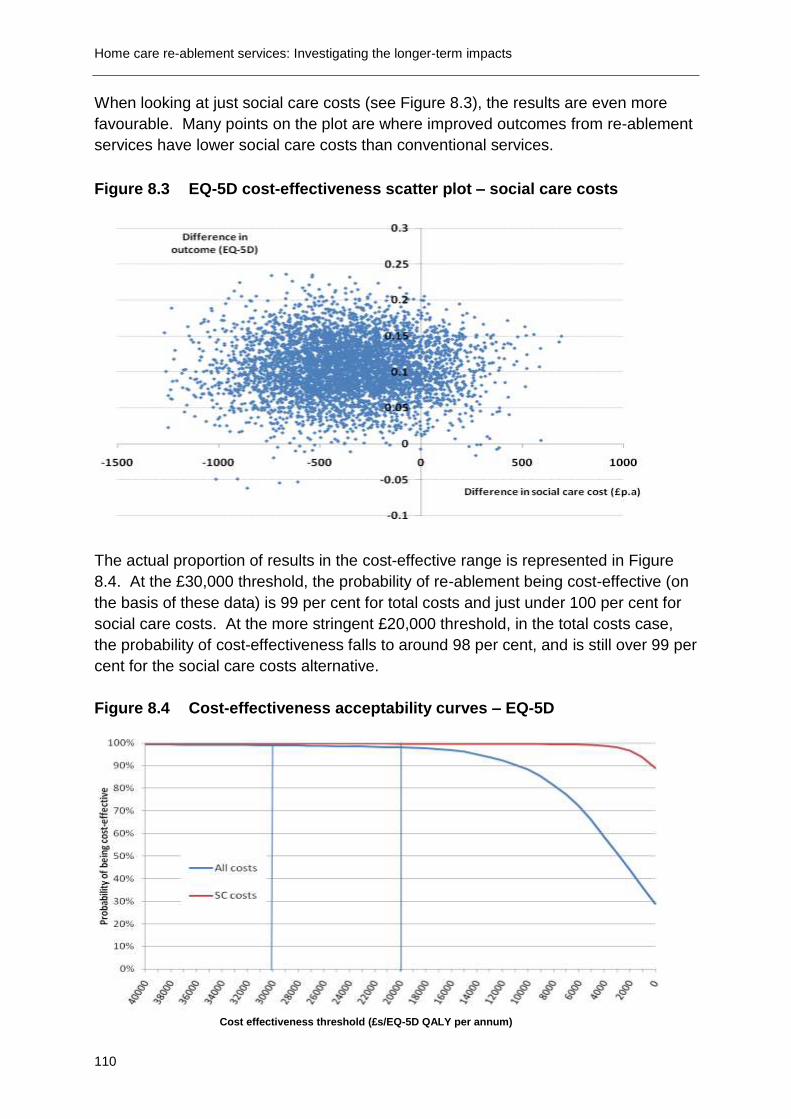
Home care re-ablement services: Investigating the longer-term impacts
110
When looking at just social care costs (see Figure 8.3), the results are even more
favourable. Many points on the plot are where improved outcomes from re-ablement
services have lower social care costs than conventional services.
Figure 8.3 EQ-5D cost-effectiveness scatter plot – social care costs
The actual proportion of results in the cost-effective range is represented in Figure
8.4. At the £30,000 threshold, the probability of re-ablement being cost-effective (on
the basis of these data) is 99 per cent for total costs and just under 100 per cent for
social care costs. At the more stringent £20,000 threshold, in the total costs case,
the probability of cost-effectiveness falls to around 98 per cent, and is still over 99 per
cent for the social care costs alternative.
Figure 8.4 Cost-effectiveness acceptability curves – EQ-5D
Cost effectiveness threshold (£s/EQ-5D QALY per annum)

Chapter 8 Costs and cost-effectiveness of home care re-ablement
111
8.7.3 Sensitivity analysis
Health care utilisation data were collected using questionnaires that were completed
by study participants. A possibility exists that people‟s recall of their use of health
services may not be completely accurate. There is some evidence that people tend
to under-report their service use when this information is compared with health care
provider reports (Richards et al., 2003). There is no particular reason to believe that
under-reporting of health care costs was different between the comparison and re-
ablement groups. In this regard, the cost-effectiveness results depend on cost
differences between the two groups and, therefore, if the under-reporting of health
care costs was by the same amount in both groups, the cost-effectiveness results
would be unchanged. If we assumed a proportional level of under-reporting – e.g.
health costs are ten per cent too low – then the absolute difference in health care
costs between the re-ablement and comparison groups would change and so would
the cost-effectiveness results. To give some context to this possibility, we can assess
how sensitive the cost-effectiveness results are to different estimates of health care
costs.
Table 8.10 reports the results of sensitivity analysis where (just) re-ablement health
care costs are higher than actually reported. The table shows the probability that re-
ablement is cost-effective when re-ablement health care costs are between five per
cent and 25 per cent higher than reported, and where health care costs for the
comparison group are unchanged. These scenarios were chosen because they will
reduce the probability that re-ablement is cost-effective and therefore challenge the
main conclusions. For example, if health care costs for re-ablement are actually ten
per cent higher than reported, the probability that re-ablement is cost-effective falls to
92 per cent at the £20,000 per EQ-5D threshold and 97 per cent at the £30,000
threshold. If costs were 25 per cent higher, then re-ablement is 70 per cent likely to
be cost-effective at £20,000 per EQ-5D but still nearly 90 per cent likely to be cost-
effective at £30,000 per EQ-5D level. Overall, at the £30,000 threshold in particular,
our conclusions about cost-effectiveness with regard to EQ-5D are reasonably
robust.

Home care re-ablement services: Investigating the longer-term impacts
112
Table 8.10 The effects of health care cost under-estimation on the probability of cost effectiveness
Under-estimated health care costs for re-ablement group
Probability of CE (%)
£20,000 £30,000
5 per cent 95.8 98.1
10 per cent 92.4 96.8
15 per cent 86.8 95.2
20 per cent 79.4 92.7
25 per cent 70.4 89.3
8.7.4 ASCOT cost-effectiveness
Figures 8.5 and 8.6 show the cost-effectiveness scatter plots for total costs and
social care costs respectively drawn against the difference in ASCOT outcomes. To
illustrate the scale of effect, these plots are drawn on the same scale as the EQ-5D
plots above. As such, it is apparent that the average improvement in ASCOT
outcomes of re-ablement is more modest than the average improvement in EQ-5D
outcomes. These results, again, are underpinned by the outcomes analysis of
ASCOT in Chapter 6, where the average improvement in ASCOT was borderline
significant. The same cost-difference estimates apply here as for the EQ-5D
analysis. The scatter plots suggest that cost-effectiveness with respect to ASCOT is
more likely when just the social care costs are taken into account.
Figure 8.5 ASCOT cost-effectiveness scatter plot – total costs
Difference in outcome (EQ-5D)

Chapter 8 Costs and cost-effectiveness of home care re-ablement
113
Figure 8.6 ASCOT cost-effectiveness scatter plot – social care costs
Figure 8.7 presents the cost-effectiveness acceptability curves using ASCOT. In this
case, at a threshold of £30,000 per ASCOT gained, for social care costs, re-ablement
is cost-effective with a 98 per cent probability. When all costs are included, the
probability falls to 78 per cent. At a threshold of £20,000 per ASCOT outcome gain,
the probability of cost-effectiveness is 98 per cent against social care costs and 68
per cent against all costs.
Figure 8.7 Cost-effectiveness acceptability curves – ASCOT

Home care re-ablement services: Investigating the longer-term impacts
114
8.8 Discussion and conclusions
Overall, on the basis of the analysis of the data in the study, we can conclude that re-
ablement is cost-effective with regards to improving outcomes for service users as
measured by EQ-5D. Re-ablement is slightly less likely to be cost-effective when we
account for the impact on health as well as social care costs, but still with a very high
probability. This slight difference of probability arises because re-ablement service
users had higher health care costs than people in the comparison group (although
health care costs in the re-ablement group were not statistically significantly higher
than in the comparison group). People in the re-ablement group were more likely to
be hospital inpatients, but again the slightly higher overall use of hospital bed days in
the re-ablement group was not statistically significantly higher than for the
comparison group. The greater likelihood of people in the re-ablement group being
hospital in patients may be due to an increased risk of readmission, but it is also
possible that, because the data are based on self-report, some participants may have
included the initial hospital stay from which they were discharged into re-ablement or
conventional care. We should note that hospital inpatient use is relatively infrequent,
even in the re-ablement group, but incurs a high cost if it happens. In this regard, it
would be useful to have more data to substantiate this effect. Collecting a more
objective measure of secondary health care service receipt by using the Hospital
Episodes Statistics (HES) would have reduced the uncertainty around the level at
which re-ablement was cost-effective when total costs were explored.
Outcomes were also measured in terms of social care-related quality of life using the
ASCOT tool. In this case, the results are more tentative regarding cost-
effectiveness. If (just) social care costs are assessed, then it is reasonable to
conclude that re-ablement is cost-effective. The likelihood of cost-effectiveness is
much lower if health care costs are also assessed.
As mentioned in Chapter 6, the stronger effect of re-ablement as measured by EQ-
5D compared with using ASCOT is not surprising given the nature of re-ablement
services and the focus of these two outcome measures. If a re-ablement service
reduces people‟s effective impairment it allows that person to achieve a better health
and social care quality of life (which would be picked up by both EQ-5D and ASCOT).
However, conventional home care services mainly help people to overcome the
adverse consequences of impairment. Potentially, therefore, EQ-5D could under-
measure the beneficial effects of conventional support, which would make re-
ablement appear more cost-effective compared to conventional services than it
actually is.
The cost-effectiveness analysis does not include informal care costs. We might
expect that re-ablement, by improving personal functioning, in turn reduces the need
for informal care. If savings on the costs of informal care did result from the use of

Chapter 8 Costs and cost-effectiveness of home care re-ablement
115
re-ablement services, this would further strength our conclusions about its cost-
effectiveness.
As previously reported in Chapter 6, it is important to be cautious as missing data
imputation analysis was required due to the amount of missing data. Furthermore,
there are many uncertainties in the way that expenditures have been reported and so
readers need to interpret the findings carefully. For example, we have used
information from local authorities around social care service use and equipment but
have used information from service users around health care service use. While
there is always a concern around the accuracy of data, particularly when it is self-
report, information from local authorities will inevitably not include services and/or
equipment that have been purchased privately or through a voluntary organisation,
and therefore we could be underestimating the cost of such services.
Are the outcome gains that were reported in Chapter 6 worth the cost of achieving
them? In drawing conclusions about re-ablement, we have to consider the results of
both the EQ-5D cost-effectiveness analysis and an ASCOT based analysis. Taking a
social care costs perspective, we can conclude with a high statistical probability that
re-ablement is cost-effective on the basis of these data. Adding in health care costs
muddies the water somewhat, but we can say that re-ablement is more likely to be
cost-effective than not cost-effective.


117
Chapter 9 Discussion and conclusions
Summary
Re-ablement was associated with a significant decrease in subsequent social
care service use. The costs of the social care services used by people in the re-
ablement group during the 12 months of the study (excluding the costs of the re-
ablement intervention itself) were 60 per cent less than the costs of the social
care services used by people using conventional home care services.
However, this reduction in social care costs was almost entirely offset by the
initial cost of the re-ablement intervention. The total (including re-ablement)
mean cost of the social care services used by the re-ablement group was £380
lower than the total mean cost of the social care services used by the comparison
group.
The re-ablement group had significantly higher healthcare costs than the
comparison group during the first eight weeks of the study. However, more
people in the re-ablement group had been referred to the service following
discharge from hospital. These people had significantly higher healthcare costs
(mainly arising from further hospital in-patient episodes) during the first eight
weeks of the study than people who had been referred to re-ablement from the
community. However, there was no significant difference between the re-
ablement and comparison group in the costs of the health services used during
the subsequent ten months of the study. When baseline differences were taken
into account, there were also no significant differences in the duration of inpatient
stays or the total costs of healthcare service use when averaged across the two
groups over the full 12 months of the study.
Taking total healthcare, social care and re-ablement costs together, there was no
statistically significant difference in the costs of all the services used by the re-
ablement and comparison group over the 12 month study period.
Re-ablement had positive impacts on users‟ health-related quality of life and
social care-related quality of life over the course of a year after re-ablement, in
comparison with users of conventional home care services.
Re-ablement also appears to be cost-effective, particularly in relation to health-
related quality of life outcomes and to a slightly lesser extent in relation to social
care-related outcomes. The probability of cost-effectiveness was particularly
high if just social care costs were considered, but was still high when health
service costs were also taken into account.

Home care re-ablement services: Investigating the longer-term impacts
118
Service users and their carers reported positive experiences of re-ablement,
particularly the good relationships they were able to develop with the team of re-
ablement workers. The reassurance provided by visits from re-ablement workers
was particularly important for users living alone.
Key features of the organisation and delivery of effective re-ablement services
were identified. These included initial training and on-going supervision; prompt
assessments; flexible responses as users‟ needs change; good team working
and communication; and prompt referral to conventional home care for those
needing on-going support.
The study had both strengths (a comparison group, long-term follow-up,
established services, cross-sectoral approach and triangulation of multiple
sources) and limitations, the most significant being a high rate of sample attrition
that prevented robust comparisons between different service models or user
groups.
Implications for policy and practice include the need for better and repeated
information to users about the aims of re-ablement; greater involvement of
informal carers; and more help for users to prepare meals, improve their mobility
and get out of the home. Whether re-ablement should be a highly selective or
relatively inclusive service also warrants consideration.
This chapter summarises the aims and main findings of the study; sets out the
study‟s strengths and limitations; and discusses the implications for policy, practice
and further research.
9.1 Aims and design of the study
This study aimed to find out whether home care re-ablement has benefits over and
above those conferred by conventional home care services; whether any such
benefits persist over time; and, if so, how far such benefits offset the costs of re-
ablement. The study compared two groups of service users – one that received an
initial period of home care re-ablement following referral for home care; and a
comparison group that received conventional home care services from the point of
referral. Re-ablement service users were recruited from five local authorities and
comparison group members from a further five local authorities that had not
introduced re-ablement services at the time the study began. Individuals were not
randomised into re-ablement or comparison groups, but were recruited according to
common study inclusion criteria. This meant that it was possible for there to be
material differences in the needs and characteristics of the service users in each
group. Multivariate analyses, using relevant characteristics and indicators of need,
were therefore conducted to take account of any significant baseline differences
between the two groups.

Chapter 9 Discussion and conclusions
119
Users in both groups were interviewed at baseline, on referral to home care re-
ablement services and conventional home care services respectively. Users in the
re-ablement group were also interviewed on completion of the re-ablement episode.
The study aimed to identify the nature and scale of any improvements in health and
well-being, or reductions in support needs, that resulted and were still apparent up to
a year after referral to re-ablement. Both re-ablement and comparison groups were
therefore re-interviewed between nine and 12 months after recruitment to the study.
Each set of interviews used the same set of standardised and validated outcome
measures.
It was possible that any reduction in levels of need or improvements in health and
well-being among re-ablement service users might have occurred anyway, as users
recovered from an illness or other crisis that had precipitated their original referral to
the service. For this reason, any changes identified over time in the re-ablement
group were compared with those in the comparison group which had received
conventional home care services. This means that any significant differences
between the two groups over time can be attributed to the impact of home care re-
ablement services.
Re-ablement is a relatively new service and its unit costs have not hitherto been
estimated. The study therefore aimed to calculate the unit costs of home care re-
ablement services. Some studies (e.g. McLeod and Mair, 2009) have found re-
ablement to be markedly more expensive than conventional home care. It was
therefore also important to estimate the volume and costs of the services received
over the full study period by both the re-ablement and comparison groups, in order to
establish whether a potentially more costly initial intervention was associated with
lower subsequent service use and any overall reduction in service costs. The study
therefore calculated the average unit costs of home care re-ablement services. It
also used these unit costs to estimate the actual costs of the re-ablement services
used by the participants in the study. In addition, information on the volume and
costs of the health and social care services used by members of both the re-
ablement and comparison groups during the nine to 12 months following recruitment
to the study was collected. These costs were set against the costs of the initial re-
ablement intervention to identify whether there were any overall cost savings. The
cost data was also used to calculate the likely cost-effectiveness of re-ablement
against outcome measures of health-related quality of life (EQ-5D) and social care
outcomes (ASCOT).
Because home care re-ablement is a relatively new service, there is little published
information on how best to organise, manage and deliver the service. If re-ablement
is demonstrated to be effective and/or cost-effective, the nature of the intervention
that produced these results needs to be clearly documented, so that it can be
replicated more widely. The study therefore collected information on the organisation
and content of the five home care re-ablement services participating in the study and

Home care re-ablement services: Investigating the longer-term impacts
120
explored with staff at different levels the factors they considered were likely to affect
the impact of the service.
Finally, the study investigated the experiences of re-ablement service users and their
carers, to investigate the acceptability of the service and identify any user-related
factors that might enhance or reduce its effectiveness.
9.2 Main findings of the study
9.2.1 The costs of home care re-ablement services and other service use
Because home care re-ablement is a relatively new service, its unit costs have not
previously been calculated. Using established methodologies for calculating unit
costs, the study found that the average cost of an episode of re-ablement for each
service user is £2,088, with a range from £1,609 to £3,575 (Chapter 7). The average
cost per hour was £20 and the average cost per hour of service user contact time
was £40. These are higher than the costs of conventional home care services of the
same duration.
The London-based site (R2) reported the highest average costs per service user; this
site employed a multi-purpose team that provided short-term conventional home care
and end-of-life care services as well as re-ablement. When this site was excluded,
the average cost of re-ablement per service user fell from £2,088 to £2,000.
The costs of a service depend in part on the skillmix of its staff. The study therefore
attempted to estimate the costs of re-ablement services with and without OTs. Only
one re-ablement service (R5) employed OTs as part of the team, although other sites
had access to NHS or jointly-funded OTs. When site R5 was excluded from the
analysis, the average cost per service user rose by less than one per cent from
£2,088 to £2,095; R5 also reported a lower cost per hour of service user contact time
than the average for the other four sites. Because only one site was involved,
caution should be used in interpreting this finding. Caution is also needed over-
estimates of the cost of equipment provided during re-ablement. Together with other
capital costs such as buildings and land, these accounted for less than one per cent
of total costs, despite reports from service managers (Chapter 4) and users (Chapter
5) that the prompt supply of equipment is an important element of home care re-
ablement. It is possible that the volume, and therefore the costs, of equipment
supplied in the course of re-ablement have been under-reported; additional
equipment costs, not captured by the study, may have been incurred by service
users and their families, voluntary organisations or the NHS.
In addition to the costs of home care re-ablement services, information was collected
from local authorities on study participants‟ use of other social care services – day

Chapter 9 Discussion and conclusions
121
care, meals on wheels, respite care and, for the comparison group, standard home
care. For the re-ablement group these costs covered the re-ablement period; for the
comparison group they covered the first eight weeks after recruitment to the study
(Chapter 8 and Appendix F). Local authorities were also asked to provide
information on the social care services received by each participant during a sample
week around the time of follow-up, nine to 12 months after recruitment to the study.
These data were used to estimate study participants‟ social care service use over a
subsequent 10 month period. Additional data obtained from study participants
themselves were used to estimate the volume and costs of the health services used
during the first eight weeks following recruitment to the study (covering the period of
home care re-ablement) and over the subsequent 10 months.
The study compared expenditure on the social care services used by the re-ablement
and conventional home care service users. For the re-ablement group, the total
costs of all the social care services (re-ablement plus any other social care services)
they used during the first eight weeks were significantly higher (a mean of £1,640)
than the costs of the social care services used by the comparison group (a mean of
£570, p<0.001) over a similar initial eight week period. However, during the
subsequent ten month follow-up period, there was a reduction in the costs of the
social care services used by the re-ablement group. The mean costs of subsequent
social care service use were therefore significantly higher among the comparison
group receiving conventional home care services than among the group that had had
re-ablement (£2,240 compared with £790, p<0.001). Taking the costs of the initial
interventions (home care re-ablement or conventional home care) and the costs of
subsequent social care service use together, over the full 12 month period the
average total costs of social care services used by the comparison group were only
slightly (and not significantly) higher, at £2,810, than the total costs of the social care
services used by the re-ablement group (£2,430). Therefore any cost savings arising
from reduced social care service use following re-ablement were almost entirely
offset by the higher costs of the initial re-ablement intervention. Multivariate
regression techniques were used to examine the impact of a range of possible
baseline factors, and these too failed to find any relationship between total social
care costs and initial receipt of home care re-ablement. The analysis found that,
after imputing missing data and accounting for differences in baseline characteristics,
the cost of the social care services used by people in the re-ablement group was 60
per cent lower during the year (£1,130) than for those in the comparison group
(£2,850).
Although hospital inpatient admission was relatively infrequent, even in the re-
ablement group, it incurs high costs when it happens. The mean costs of the health
services used by the re-ablement group during the first eight weeks of the study
(broadly covering the period of home care re-ablement) were significantly higher than
the comparison group (£1,600 compared with £1,095; p<0.05). The re-ablement
group contained a higher proportion of people who had been discharged from

Home care re-ablement services: Investigating the longer-term impacts
122
hospital immediately before recruitment to the study than the comparison group.
Further analysis found that it was these people who had significantly higher health
service costs during the initial eight week period than those who had been referred to
re-ablement from the community (£1,850 compared with £1,020; p<0.01). This could
be because they were indeed at increased risk of hospital admission; however, it is
possible that, because data were self-reported, participants may have also included
their initial hospital stay before receiving the re-ablement service.
When multiple regression techniques were used to control for baseline differences
between the two groups (especially the higher proportion of the re-ablement group
that had been discharged from hospital immediately prior to entering the study), it
was found that people in the re-ablement group were indeed statistically significantly
more likely than the comparison group to have been admitted to hospital over the
whole study period. For those who were admitted, there was no difference between
the two groups in the time people spent in hospital – the average lengths of stay
were the same. Combining the higher chances of admission and the average length
of stay, it was estimated that, overall, people in the re-ablement group could expect a
mean utilization of hospital services equivalent to 2.1 more days in hospital than
people in the comparison group; this was not significantly different. There was also
no significant difference in the total cost of all the health services used by each group
over the full 12 month study period.
9.2.2 The benefits and cost-effectiveness of home care re-ablement
The study demonstrated that use of home care re-ablement was strongly associated
with better health-related quality of life outcomes and to a lesser extent with social
care-related outcomes over time (Chapter 6). People who had used home care re-
ablement had significantly better outcomes, when measured between nine and 12
months later, than those using conventional home care services. These differences
were particularly marked in relation to health-related quality of life, which was
measured using the well-established EuroQoL scale (EQ-5D). Similarly, people in
the re-ablement group had significantly better social care-related quality of life, as
measured using the ASCOT tool, over time, compared to people using conventional
home care services, although the effect was not as strong as for EQ-5D. These
differences were sustained after controlling for any baseline differences between the
two groups. All statistical analyses are subject to margin of errors. However in this
case, even at the bottom of the error range, people who had received re-ablement
still showed greater improvements in both outcome measures over those who had
received conventional home care services.
An important question for this study is whether these outcome gains are actually
worth the costs of achieving them. It is possible that a new service or intervention
could generate better outcomes than conventional services, but at much higher cost.
This was the case, for example, with Edinburgh City Council‟s pilot re-ablement

Chapter 9 Discussion and conclusions
123
service (McLeod and Mair, 2009). Taking into account the evidence on costs
summarised above, home care re-ablement appears to lead to better outcomes, but
at no greater cost.
Conventionally, cost-effectiveness is judged by comparing the ratio of improvements
(in this instance, in health-related and/or social care-related quality of life) over
additional costs to some pre-determined acceptability threshold. This can also be
presented as a cost-effectiveness acceptability curve, which shows the probability
that re-ablement is cost-effective at different thresholds. When assessing the cost-
effectiveness of treatments, the National Institute for Health and Clinical Excellence
(NICE) assumes that £20,000 to £30,000 is a generally acceptable cost for each
year‟s increase in health-related quality of life (although it is important to note that
expenditure of £30,000 per outcome gain is at the top end of NICE‟s range).
This study found that, at a threshold of £30,000 for each increase in EQ-5D score for
a year, the probability of re-ablement being cost-effective was 99 per cent when
looking at heath and social care costs together; and just under 100 per cent when
social care costs alone were considered (Chapter 8). At a more stringent
acceptability threshold of £20,000 per EQ-5D gain per year, the probability of cost-
effectiveness fell to around 98 per cent in the case of combined health and social
care costs, but remained at over 99 per cent when only social care costs were taken
into account. Sensitivity analysis around the costs of health care confirmed that
these findings are reasonably robust, particularly at the £30,000 level with regard to
EQ-5D.
Similarly, the study found re-ablement was cost-effective in relation to social care
outcomes (ASCOT). At a threshold of £30,000 for each year‟s worth of ASCOT
improvement, and including both health and social care costs, the probability of cost-
effectiveness was 78 per cent. When only social care costs were included, the
probability of cost-effectiveness rose to 98 per cent. At a threshold of £20,000 per
ASCOT outcome gain per year, the probability of cost-effectiveness was 68 per cent
for combined health and social care costs, but still 98 per cent for social care costs
only.
9.2.3 Users’ experiences and satisfaction with home care re-ablement services
Re-ablement service users and their carers reported positive experiences (Chapter 5
and Appendix H), despite few interviewees having a clear idea initially of the aims of
the service. Most service users reported that re-ablement had improved their
independence, increased their motivation to make further self-care gains and
boosted their confidence. Users were aware of improvements in their self-care skills
and mobility and these in turn benefitted their confidence and morale. Service users
with non-progressive health conditions reported greater progress towards

Home care re-ablement services: Investigating the longer-term impacts
124
independence. The most common gains described related to personal care and
preparing simple meals.
The interviews highlighted the importance of the relationships that users were able to
develop with the team of re-ablement workers. The encouragement offered by the
workers generated motivation on the part of users. Relationships with re-ablement
workers also provided reassurance, company and valuable emotional support. This
was especially appreciated by people without informal carers.
Some users and their carers would have liked more help with improving their mobility
(including continued access to physiotherapy services) and with resuming normal
social activities outside the home. Others felt that the help they received with food
preparation was too limited to enable them to resume cooking the meals they
preferred. Visits by re-ablement workers were sometimes felt to be too short, or were
later than expected.
Carers valued the break from care routines provided by the re-ablement service;
there were indications that carers might benefit from having greater involvement in
the re-ablement process.
9.2.4 The organisation and delivery of home care re-ablement services
All five re-ablement services in this study had developed from selective hospital
discharge support schemes to a more inclusive „intake‟ function, accepting most new
referrals for home care (Chapter 4 and Appendix B). In site R2, the re-ablement
team also provided short-term conventional home care and end-of-life care.
Managers and front-line staff agreed that the most dramatic benefits of re-ablement
were seen among people recovering from acute illnesses, falls or fractures. In
comparison, people with chronic or deteriorating conditions, including dementia, who
needed on-going support were thought less likely to demonstrate significant
improvements in independence, as were those who were not motivated to become
independent or who had previous extensive experience of conventional home care
services that had created unhelpful expectations.
Key features of effective home care re-ablement services were thought to include:
Initial staff training in re-ablement approaches – motivating and encouraging
users rather than doing tasks for them and finding new ways of doing difficult
tasks - followed by on-going regular supervision and peer support.
Flexible, prompt reassessments and responses to service users‟ capabilities as
these changed.
Sufficient time during visits to encourage users to accomplish tasks themselves
rather than completing tasks for them.
Chapter 9 Discussion and conclusions
125
Team working, good communication between team members and frequent team
meetings to share information about users‟ problems and progress.
Rapid access to OTs and delivery of equipment; and access to other specialist
skills (e.g. mental health, dementia) could further extend the effectiveness of re-
ablement as services become increasingly inclusive.
Clarity among all relevant health and social care staff, including hospital
discharge staff and care managers, about the aims and limitations of the re-
ablement service.
Sufficient capacity in care management and conventional home care services, so
that users needing on-going support can be referred promptly at the end of re-
ablement and turnover within the re-ablement service can be maintained.
9.3 Strengths and limitations of the study
9.3.1 Strengths of the study
Chapter 1 summarised the existing evidence on the effectiveness of home care re-
ablement (or „restorative‟ approaches as they are known in Australia, New Zealand
and North America). A number of studies have found robust evidence of immediate
positive impacts on users‟ functional status and subsequent use of services; these
benefits have been compared with less marked changes in users‟ needs during the
early weeks of conventional home care. However, robust evidence on the longer-
term benefits of re-ablement services has hitherto been lacking and has been
identified (Ryburn et al., 2009) as a priority for further research. Although one study
(Newbronner et al., 2007) found that some users of home care re-ablement services
appeared to use fewer social care services up to 24 months after discharge from re-
ablement, that study had no comparison or control group so it was possible this
reduction would have occurred anyway. The current study makes a significant
contribution to filling this gap.
The study design and methods have a number of important strengths. First, the
study compared the experiences and outcomes for home care re-ablement users
with those of a group that received conventional home care services. Evidence from
such studies is particularly valuable, as these can control for the possibility that
improvements in health or well-being, or reductions in service use, might have
occurred anyway, regardless of the re-ablement intervention.
In this study, although service users were not randomised to the re-ablement and
comparison groups, the inclusion and exclusion criteria used by local authorities to
recruit service users to the study were the same in both the re-ablement and
comparison group sites. Identical formal training workshops were held for front-line
staff in all ten sites to ensure the study inclusion criteria were applied consistently.

Home care re-ablement services: Investigating the longer-term impacts
126
Secondly, the study was able to examine the impacts of re-ablement for up to 12
months following recruitment to the service (or to conventional home care).
Difficulties in initial recruitment to the study meant that the recruitment period had to
be extended and consequently it was only possible to follow up the majority of
service users for nine or ten months (see Appendix C). Given the high attrition rates
from both study groups over time, including the high proportions of participants who
died, it is likely that any attempts to follow service users over a longer period would
have encountered even greater difficulties in sustaining a viable sample. Even so,
the length of time over which participants in this study were followed up is
considerably longer than the follow-up period of some previous studies (McLeod and
Mair, 2009) and equal to that in another (Lewin and Vandermeulen, 2010).
Third, the study involved five well-established home care re-ablement services.
Previous studies have tended to focus on new, pilot re-ablement services (this has
also facilitated their comparative design, as they were able to recruit comparison
group participants from other parts of the same local authority to which the pilot
service had not yet been extended). The evidence from this study – particularly the
accounts of the service managers and front-line staff on the establishment and
operation of their home care re-ablement services – suggests that evaluations of new
pilot projects may overstate the impacts of such services. Pilot initiatives that have
not yet developed to full capacity are likely to be more selective in their intake,
accepting only users referred on discharge from hospital or assessed as having a
high probability of benefitting from re-ablement. Staff working in pilot projects are
also likely to be self-selecting and more highly motivated to adapt their methods of
working (see Chapter 4 and Appendix B). Finally, pilot projects may be better
resourced – a distinctive feature of the City of Edinburgh‟s pilot re-ablement service
(McLeod and Mair, 2009) which may actually have diverted resources away from the
mainstream home care services with which it was compared.
In contrast, the home care re-ablement services in this study had all developed from
selective schemes, accepting primarily or exclusively people discharged from
hospital, to more inclusive services that currently accepted most people referred for
home care. In some instances, local political decisions had influenced these
developments, in order to justify the continued retention of relatively expensive in-
house home care services. For some people recruited to the study, therefore, re-
ablement was likely to make only a small difference to their functioning and long-term
support needs. Although managers, staff and re-ablement service users themselves
all argued that even small gains in personal care skills and confidence were
important, the benefits were thought unlikely to be as dramatic as those that have
been demonstrated with more selective services. Despite the very mixed samples
included in this study, therefore, the findings regarding the cost-effectiveness of the
service (Chapter 8) provide strong evidence of the impact of re-ablement and offer a
considerably more robust evidence base for further policy and practice developments
than evaluations of more selective and/or pilot services.

Chapter 9 Discussion and conclusions
127
This study has taken a cross-sectoral perspective on the impact and outcomes of
home care re-ablement services. It has examined the effects of home care re-
ablement not only on subsequent use of social care services, but also on health
services. Interventions and initiatives in one service sector can have knock-on
influences on other sectors; this is particularly the case for health and social care,
whose boundaries frail older people may cross frequently as their health and
functional abilities fluctuate. The study found that even when the costs of health care
service use were included, home care re-ablement still appeared to be cost-effective,
although this effect was not quite as marked as for social care costs alone. In
addition, the robustness of the cost-effectiveness analysis was affected by a number
of other factors that are detailed below and that warrant caution in interpreting the
findings. Nevertheless, this cross-sectoral approach to demonstrating the impact of a
preventive intervention is important and relatively unusual.
Finally, the study had multiple strands and examined home care re-ablement
services from multiple perspectives. As well as seeking evidence of cost-
effectiveness, the study examined the perspectives of managers‟ and front-line staff
and the experiences of service users and carers; these accounts were triangulated
by observations of re-ablement services in operation. In consequence, the study has
been able to describe in detail what is involved in home care re-ablement; and has
identified a range of features of the organisation, operation and delivery of home care
re-ablement services that are likely to optimise their impact and outcomes.
9.3.2 Limitations of the study
Despite these strengths, the study has a number of limitations that affect the
interpretation of the findings. First, it was not possible to conduct a full controlled
trial, with service users randomly allocated to re-ablement and comparison groups.
Moreover, a number of other practical considerations (see Appendices A and C)
limited the extent to which either the re-ablement and comparison local authorities, or
the service users within them, could be closely matched.
The most significant limitation of this study is the lower than planned numbers of
service users who were recruited to and retained in the study - in particular the
relatively small numbers of service users who completed follow-up interviews
between nine and 12 months later, despite the efforts of the research team (see
Appendix C). Even in those follow-up interviews that were completed, some data
were missing and these were imputed, based on the completed responses to similar
questions. The small number of follow-up interviews (particularly in the comparison
group) has a number of implications.
First, it was not possible to examine whether there were differences in outcomes and
cost-effectiveness between the five different re-ablement services included in the
study and thus to examine the relative effectiveness and cost-effectiveness of

Home care re-ablement services: Investigating the longer-term impacts
128
different service models. Both the descriptions of the five services (Chapter 4 and
Appendix B) and the calculation of their respective unit costs (Chapter 7 and
Appendix E) suggest there were some substantial differences between the five
services. In particular, the re-ablement service in site R2 was part of an in-house
home care service that also provided short-term/emergency conventional home care
and home care for terminally ill people. Front-line staff in R2 reported that they were
sometimes unsure whether a client was receiving conventional home care or re-
ablement, despite the concerns expressed by service managers of the risks of
„diluting‟ the re-ablement approach if front-line staff also provided conventional home
care. The unit costs estimated for site R2 were also substantially higher than in the
other four sites. However, it was not possible to examine whether these marked
differences in service inputs were reflected in user-level outcomes. Similarly, it was
not possible to disaggregate the data at site level in order to compare the outcomes
for the re-ablement service that employed OTs and those that did not. On the other
hand, the interviews with service managers all emphasised the importance of having
rapid access to OTs, so that needs for equipment could be identified and met at the
earliest possible opportunity. Re-ablement teams that did not include OTs as full
team members had therefore negotiated „fast track‟ access to OTs located elsewhere
within local adult social care or NHS services. It is possible, therefore, that the lack
of comparison between the outcomes of re-ablement services with and without OT
members is less important than it appears.
A third consequence of the low number of follow-up interviews is that it has not been
possible to examine the outcomes of re-ablement for different groups of service
users – those of different ages, those who received different levels of re-ablement
service inputs, or those who were referred to the service via different routes. For
example, some recruits to the study subsequently received less than a week‟s re-
ablement; in contrast, the mean duration of service was 39 days and the longest was
23 weeks (Chapter 3). According to interviews with service managers, some users
discharged themselves from home care re-ablement after only a few days, believing
that they had already optimised their capacity for self-care; others were re-admitted
to hospital shortly after beginning re-ablement. These users may have showed fewer
changes in functional ability or well-being between the start and end of re-ablement
and their retention in the analysis may have depressed the apparent impact of re-
ablement. It was also not possible to compare the outcomes for service users who
were referred to re-ablement through different routes, or with different types of
conditions. As noted above, it was widely believed by re-ablement service managers
(Chapter 4), and by service users themselves (Chapter 5), that people referred
following hospital discharge, a fall or fracture were likely to demonstrate greater
improvements in functional ability and reductions in subsequent service needs than
those with chronic or deteriorating health problems. However, the low numbers of
follow-up interviews prevented disaggregation of outcomes for these different groups
of users.

Chapter 9 Discussion and conclusions
129
Uncertainties about the accuracy of data on service use and costs may have affected
the robustness of the cost-effectiveness analyses. The study used information
supplied by local authorities about the use of social care services and equipment
during one sample week towards the end of each participant‟s time in the study;
these data were then used to estimate service use and costs for a ten month period.
It would have been preferable to have obtained participants‟ actual use of services
during the whole of this period, as data from any single week might be subject to
bias, although any such risk of bias would have been similar for both groups. In
addition, these data will have excluded services or equipment that was privately
purchased or supplied by voluntary organisations. In addition, data on participants‟
use of residential care, whether on a temporary or permanent basis, during the study
period was omitted, possibly because of the method by which information about the
use of social care services was collected. In retrospect, it was unfortunate that the
study was not able to assess whether receipt of re-ablement was associated with
lower subsequent risk of admission to residential care.
The study also relied on self-reported information from service users about their use
of health services. There are always concerns about the accuracy of self-reported
information, particularly when recall over an extended period is involved. Participants
were asked about their health service use during the initial study period and it is
possible that some of the people who had been discharged from hospital immediately
before referral to re-ablement may have included this inpatient stay as well.
However, access to more accurate data such as Hospital Episode Statistics would
have required additional explicit consent from study participants.
Furthermore, at the follow-up interview, study participants were asked only about
their use of GP and community health services over the past month; these reports
were used to estimate health service use over the entire study period. However, it
might be expected that recollections of particularly major health service use such as
hospital inpatient episodes would be less susceptible to inaccurate recall than less
costly items such as GP or nurse contacts. Participants were, therefore, asked at the
follow-up interview about their use of hospital inpatient services over the full study
period. Omissions arising from inaccurate self-reports or recall could lead to an
under-estimation of the total costs of health service use; a sensitivity analysis
therefore tested the impact on cost-effectiveness of underestimations of health
service costs in the re-ablement group.
A number of relatively broad-brush outcome measures were used in the study. The
measures of self-perceived health, perceived quality of life, EQ-5D and ASCOT (see
Chapter 2 and Appendix D) are all widely used and well-validated. However, they
may not pick up very small (and perhaps shorter-lasting) improvements in functional
ability experienced by re-ablement service users with chronic, complex or
progressive conditions. They may also be insufficiently sensitive to improvements in
the confidence and morale reported by some service users in the qualitative

Home care re-ablement services: Investigating the longer-term impacts
130
interviews (Chapter 5). In addition, given the importance of mobility and involvement
in activities outside the home reported by some service users (Chapter 5), it might
have been useful to have included a measure of social participation among the
study‟s outcome measures, although this was not an objective of the services being
evaluated.
More generally, only a limited range of outcome measures were used and these may
have been too narrow to reflect the broad range of abilities and circumstances of the
users who were helped by the relatively inclusive re-ablement services in this study.
However, the study involved mainly elderly people who were often experiencing
significant health and other difficulties; the study also relied on practitioners to recruit
study participants and conduct baseline and immediate post-re-ablement interviews.
Both these considerations meant that lengthy or semi-structured interviews with the
whole study sample, that might have detected more nuanced changes, were not
practicable. They led to the early decision to drop the General Household
Questionnaire from the battery of outcome measures.
A further potential shortcoming of the study arises from the inclusion and exclusion
criteria that determined initial recruitment of service users to the study. Staff in both
the re-ablement and comparison group sites were asked to exclude from the study
anyone who they considered unable to give informed consent to participate in the
study. This means that some service users with moderate or advanced dementia, or
other serious mental health problems, may have been excluded. However, these are
also the kinds of service users who, according to managers and front-line staff, were
most likely not to be offered home care re-ablement, even from a relatively inclusive
service, as the benefits were likely to be very small. It is not possible to know how far
the exclusion from the study of those service users likely to show only minimal
changes as a result of re-ablement might have exaggerated the positive outcomes of
home care re-ablement, without further information on the extent to which they were
in practice included or excluded from the service itself.
Finally, the in-depth accounts of the users about their re-ablement services (see
Chapter 5) were broadly positive, despite the initial lack of understanding of the aims
of the intervention, and despite the rather different expectations that some may have
had as a result of previous receipt of conventional home care services. It is possible
that the high levels of satisfaction reported by users reflect the more general
tendencies of older people to give positive evaluations of any social care service
receipt.
9.4 Recommendations for policy and practice
Current government policy in England is promoting the development of home care re-
ablement services by local authorities responsible for adult social care. In autumn

Chapter 9 Discussion and conclusions
131
2010 an extra £70 million was made available to NHS Primary Care Trusts for the
development of re-ablement services; the autumn 2010 Comprehensive Spending
Review allocated a further sum up to £300m a year for re-ablement spending in the
NHS (Department of Health, 2010b, para 7.1). The high probability that home care
re-ablement is cost-effective, as demonstrated by this study, provides strong
evidence to support this direction of policy.
More precisely, the study has established a high probability of cost-effectiveness,
particularly in relation to health-related quality of life, and slightly less so in relation to
social care-related quality of life. Significantly, this conclusion has been arrived at
through research on five established services, all operating relatively inclusive
referral policies. As such, they are not characterised by highly selective intake
policies, unsustainable levels of resourcing or particularly highly motivated staff – all
features of some new or pilot services which are likely to enhance positive findings
and outcomes. On the basis of this study, the promotion of home care re-ablement
appears to be well-founded. Indeed, it may be that the experience of one of the
study sites, namely that the overall effectiveness of the home care re-ablement
service has enabled the local authority to maintain relatively low FACS eligibility
thresholds, can be replicated more widely.
However, re-ablement is not a simple, straightforward intervention. The approach
and activities of front-line workers with service users are shaped by individual user
characteristics and preferences; by the ways in which home care re-ablement
services are organised and managed; and by the wider local health and social care
service environment. This study has been able to identify those features of home
care re-ablement services that are likely to enhance their impact and effectiveness.
Although small sample sizes prevented the study examining the impacts of these
different features on user-level outcomes, there was nevertheless widespread
agreement among senior managers and front-line staff about the factors likely to
enhance the success of re-ablement interventions. There was also broad
concurrence with these views on the part of service users and carers who took part in
the in-depth interviews.
Leaving aside the individual characteristics of service users (such as their types and
levels of health problems and support needs or levels of motivation), the factors likely
to enhance the success of home care re-ablement services fall into two broad
groups: those related to the internal organisation and management of the service;
and those in the wider service environment.
The most important internal organisational factors appear to be:
The commitment, knowledge and skills of front-line staff. This requires effective
initial training, subsequently reinforced by regular senior supervision and peer
support. Initial and on-going training is particularly important for staff who have
previous extensive experience of working in conventional home care services.

Home care re-ablement services: Investigating the longer-term impacts
132
High quality initial assessment; clear re-ablement goals for each user; regular
reassessment of these goals in the light of changes in user capacities; and
flexibility to adapt the timing, duration and content of visits as users‟ needs and
capabilities alter.
Rapid assessment for, and delivery of, equipment; having quick access to
occupational therapy services may be more important than having OTs employed
as members of the re-ablement team.
On the basis of the evidence from this study, the most important wider environmental
factors contributing to the effectiveness of re-ablement are:
Clarity among all relevant staff, including hospital and intermediate care staff
involved in discharge planning and local authority care managers, about the
aims, scope and limitations of the service. Ensuring appropriate referrals from
hospitals and intermediate care may be particularly important, in order to avoid
consequent risks of early readmission for at least some re-ablement service
users.
Access to a wide range of specialist skills. As re-ablement services extend their
scope to become more inclusive and take a wider range of people needing home
care support, the range of skills needed by staff correspondingly expands. In this
study, both staff and service users noted the importance of continued help with
improving mobility; this may warrant closer involvement of physiotherapists in re-
ablement services. In addition, managers noted that more specialised training for
at least some staff to support re-ablement interventions with people with
dementia, other mental health problems and sensory impairments could extend
the effectiveness of home care re-ablement.
Prompt transfer to long-term support – whether through conventional home care
services or a personal budget – at the end of re-ablement for those still needing
on-going support at home. Transfers may be facilitated if re-ablement staff are
themselves able to refer directly to independent home care agencies rather than
referring users back to care managers, although this may need to be aligned with
new assessment and support planning processes as personal budgets are
increasingly offered to people needing long-term social care support. Adequate
preparation of users for the end of re-ablement with two or three joint hand-over
visits may also help. All staff in this study agreed that lack of capacity in
conventional home care services was a major threat to the efficiency of home
care re-ablement because of the risk of the service becoming „blocked‟ with
clients awaiting transfer.
The study also identified a number of areas in which existing practice might be
developed. First, some of the service users interviewed in depth reported receiving
limited information and had poor understanding of the aims of home care re-
ablement. This was a particular risk when users had been referred to re-ablement on
discharge from hospital; were still experiencing considerable ill health and pain; did

Chapter 9 Discussion and conclusions
133
not speak English as their first language; or had sensory impairments. Greater
attention to explaining the aims of the service, including its time-limited nature –
probably on several occasions around and following initial referral – might help users
develop appropriate expectations and enhance their responsiveness to the re-
ablement approach.
A number of service users and carers were disappointed that home care re-ablement
had not been able to address two areas of importance to them - preparing meals and
rebuilding confidence and improving mobility to walk outside the home. The latter
disappointment was linked to the reported desire for on-going physiotherapy help
during the period of re-ablement. Being able to get out of the house again was felt to
be an important aspect of independence and a vital step in resuming a „normal life‟.
Other service users were disappointed that they were only helped to make tea, toast
or sandwiches, or to use a microwave, rather than being helped to prepare food they
were used to eating.
To some extent, these limitations reflect the location of re-ablement services in local
authority home care services and the increasing focus of these services over the past
two decades on the intensive provision of personal care, rather support with
instrumental activities of daily living such as preparing meals or getting about the
house. This study suggests that such limitations may not be entirely compatible with
service users‟ priorities and desired outcomes. In addition, and subject to service
capacity, re-ablement services might consider allocating users some additional time
to build their confidence and ability to walk outside the home, where this is a desired
outcome. Again, this was a priority for some users in this study and of considerable
importance to their overall well-being and social participation. Other research
(Glendinning et al., 2008) has shown how regaining confidence in getting about
outside the home and resuming valued social activities can be important outcomes
for some older people. Such help is not time-critical and could be provided at times
of day when help with important personal care tasks like dressing, bathing or meal
preparation is not required.
Consideration could therefore be given to extending the scope of re-ablement
services, to include help with getting out of the home, going shopping and
(re)engaging in desired social activities. This may require the development of links
between re-ablement and physiotherapy services, particularly if service users have
been receiving the latter intervention in hospital or intermediate care immediately
before discharge back home. A relatively small amount of additional training could
also enable front-line re-ablement staff to extend their roles to include prompting and
encouraging users to carry out exercises as recommended by, and under the
supervision of, physiotherapists. As NHS services begin to invest the additional
resources allocated to them to develop re-ablement services, closer collaboration
Home care re-ablement services: Investigating the longer-term impacts
134
with local authority services to extend the scope and skill-mix of re-ablement services
would seem a high priority.
The role and contribution of informal carers to re-ablement warrants further
consideration. Several carers who had received advice about managing a service
user‟s daily routines, or about their own carer-related needs, reported feeling more
confident in their own roles as a result of re-ablement. Others found the provision of
equipment like hoists was also helpful. Most of the small sample of carers
interviewed in this study would have liked more involvement in re-ablement and
advice on how to maximise the service user‟s independence.
Finally, further consideration needs to be given to the extent to which re-ablement
services are targeted and selective or inclusive of all referrals to home care. The re-
ablement services taking part in this study originated as relatively selective services,
providing support primarily for people discharged from hospital or intermediate care,
but all had expanded their scope to become more inclusive and take most people
referred for home care. The latter development in some cases reflected local political
pressures to reconfigure a comparatively expensive in-house home help service.
Although this study was unable to compare the outcomes for re-ablement users who
entered the service through different referral routes, managers, front-line staff and
service users all agreed that re-ablement was likely to have far greater impacts on
some people than others – in particular, people recovering from acute illnesses, falls
or fractures, or recently discharged from hospital. People with chronic, complex or
progressive health problems affecting their ability to carry out self-care and domestic
tasks were considered far less likely to show major benefits from re-ablement
interventions. Given the increasing pressures on all health and social care services,
a return to a more targeted service may be appropriate. Again, close working with
NHS partners as they develop re-ablement services may provide a useful opportunity
for any such refocusing.
However, one of the findings from the qualitative strands of this study, particularly the
interviews with staff and observations of re-ablement visits, is that the abilities and
support needs of some people referred for re-ablement can change significantly in a
relatively short space of time. For those users who on initial referral were clearly
likely to need long-term support at home, re-ablement offered a valuable opportunity
for extended assessment, so that appropriate levels of long-term support could
eventually be commissioned. This may remain an important function of re-ablement,
whether service users move on to a personal budget or directly-commissioned
services. In the context of increasingly tight resources, the „right-sizing‟ of long-term
support will continue to be a major concern.

135
References
Audit Commission (1997) The Coming of Age: Improving care services for older
people, Audit Commission, London.
Bowling, A. (1995) Measuring Disease, Open University Press, Buckingham.
Bowling, A., Banister, D., Sutton, S., Evans, O. and Windsor, J. (2002) A
multidimensional model of the quality of life in older age, Ageing and Mental Health,
6, 4, 355-371.
Burge, P., Gallo, F. and Netten, A. (2006) Valuing PSS Outputs and Quality
Changes, PSSRU Discussion Paper 2356, Personal Social Services Research Unit,
University of Kent, Canterbury.
Burge, P., Potoglou, D., Kim, C. and Hess, S. (2010) How Do the Public Value
Different Outcomes of Social Care? Estimation of Preference Weights for ASCOT,
RAND working paper, Rand Europe, Cambridge.
Care Service Efficiency Delivery (2010) Homecare Re-ablement CSSR Scheme
Update October 2010, Department of Health, London.
Curtis, L. (ed.) (2009) Unit Costs of Health and Social Care 2009, Personal Social
Services Research Unit, University of Kent, Canterbury.
DH (2010a) Local Authority Circular on the Personal Care at Home Act 2010 and
Charging for Re-ablement, LAC (DH) (2010) 6, Department of Health, London.
Dolan, P., Gudex, C., Kind, P. and Williams, A. (1995) A Social Tariff for EuroQol:
Results from a UK general population survey, Centre for Health Economics,
University of York, York.
Dow, W.H. and Norton, E.C. (2003) Choosing between and interpreting the Heckit
and two-part models for corner solutions, Health Services and Outcomes Research
Methodology, 4, 1, 5-18.
Ferraro, K. (1980) Self-ratings of health among the old and the old-old, Journal of
Health and Social Behaviour, 21, 4, 377-383.
Francis, J. and McDaid. D. (2009) SCIE‟s work on economics and the importance of
informal care, in L. Curtis (ed.) Unit Costs of Health and Social Care, Personal Social
Services Research Unit, University of Kent, Canterbury.
Home care re-ablement services: Investigating the longer-term impacts
136
Glendinning, C., Clarke, S., Hare, P., Maddison, J. and Newbronner, L. (2008)
Progress and problems in developing outcomes-focused social care services for
older people in England, Health and Social Care in the Community, 16, 1, 54-63.
Goldberg, D. (1992) General Health Questionnaire, NFER Nelson, Windsor.
Hausman, J.A. (1978) Specification tests in econometrics, Econometrica, 46, 1251-
1271.
Idler, E. and Benyamini, Y. (1997) Self-rated health and mortality: a review of twenty
seven community studies, Journal of Health and Social Behavior, 38, 1, 21-37.
Jones, K., Baxter, K., Curtis, L., Arksey, H., Forder, J., Glendinning, C. and Rabiee,
P. (2009) The Short-term Outcomes and Costs of Re-ablement Services: Interim
report, Personal Social Services Research Unit, University of Kent.
Jones, K., Netten, A., Francis, J. and Bebbington, A. (2007) Using older home care
user experiences in performance monitoring, Health and Social Care in the
Community, 15, 322-332.
Kent, J., Payne, C., Stewart, M. and Unell, J. (2000) External Evaluation of the Home
Care Re-ablement Pilot Project, Centre for Group Care and Community Care
Studies, De Montfort University, Leicester.
Kings Fund (1999) Developing Rehabilitation Opportunities for Older People, Kings
Fund, London.
Lansley, A. (July 2010) Speech at the 5th International Carers Conference on ‘The
Principles of Social Care Reform’, downloaded from
http://www.dh.gov.uk/en/MediaCentre/Speeches/DH_117331. Downloaded 30
September 2010.
Lewin, G. and Vandermeulen, S. (2010) A non-randomised controlled trial of the
Home Independence Program (HIP): an Australian restorative programme for older
home-care clients, Health and Social Care in the Community, 18, 1, 91-99.
McLeod, B. and Mair, M. (2009) Evaluation of City of Edinburgh Council Home Care
Re-ablement Service, Scottish Government Social Research, Edinburgh.
Miles, M. and Huberman, A. (1994) Qualitative Data Analysis: An expanded
sourcebook, 2nd edn. Sage. Thousand Oaks, CA.
Netten, L. and Curtis, A. (2006) Unit Costs of Health and Social Care, 2006, Personal
Social Services Research Unit, University of Kent, Canterbury.

References
137
Newbronner, L., Baxter, M., Chamberlain, R., Maddison, J., Arksey, H. and
Glendinning, C. (2007) Research into the Longer Term Effects/Impacts of Re-
ablement Services, Social Policy Research Unit, University of York, York.
Nocon, A. and Baldwin, S. (1998) Trends in Rehabilitation Policy: A review of the
literature, King's Fund Publishing, London.
Palmore, E and Luikart, C. (1972) Health and social factors related to life satisfaction,
Journal of Health and Social Behaviour, 13, 68-80.
Parsons, M., Anderson, C., Senior, H., Chen, X., Kerse, N., Jorgensen, D., Brown,
P., Jacobs, S., Vanderhoorn, S. and Kilpatrick, J. (2007) ASPIRE: Assessment of
services promoting independence and recovery in elders, The University of
Auckland, Auckland.
Petch, A. (2008) Re-ablement and the role of the occupational therapist, Journal of
Integrated Care, 16, 2, 38-39.
Rabiee, P., Glendinning, C., Baxter, K., Arksey, H., Jones, K.C. Forder, J.E. and
Curtis, L.A. (2009) The Organisation and Content of Home Care Re-ablement
Services: Interim report, Social Policy Research Unit, University of York, York.
Ramsey, J.B. (1969) Tests for Specification Errors in Classical Linear Least Squares
Regression Analysis, Journal of the Royal Statistical Society Series B, 31, 2, 350-
371.
Richards, S.H., Coast, J., and Peters, T.J. (2003) Patient-reported use of health
service resources compared with information from health providers, Health and
Social Care in the Community, 11, 6, 510-518.
Robine, J.M., Jagger, C. and Romiue, I. (2003) Selection of a Coherent Set of Health
Indicators for the European Union. Phase II: Final report, Euro-REVES, Montpelier.
Ryburn, B., Wells, Y. and Foreman, P. (2009) Enabling independence: restorative
approaches to home care provision for frail older adults, Health and Social Care in
the Community, 17, 3, 225-234.
Secretary of State for Health (2000) The NHS Plan. A Plan for Investment, A Plan for
Reform, The Stationery Office, London.
Secretary of State for Health (2009) Shaping the Future of Care Together, Cm7673,
The Stationery Office, London.

Home care re-ablement services: Investigating the longer-term impacts
138
Shadbolt, B. (1997) Some correlates of self-rated health for Australian women,
American Journal of Public Health, 878, 6, 951-956.
Tinetti, M.E., Baker, D., Gallo, W.T., Nanda, A., Charpentier, P. and O‟Leary, J.
(2002) Evaluation of restorative care vs usual care for older adults receiving an acute
episode of home care, Journal of the American Medical Association, 287, 16, 2098-
2105.

139
Appendix A Site selection
This appendix describes the process of selecting study sites, which was lengthy but
at the same time intended to ensure that sites would be able to achieve the target
number of study participants. A „screening‟ questionnaire was developed and e-
mailed by CSED in April 2008 to all English local authorities with responsibilities for
adult social care services. The purpose of the questionnaire was to establish
whether or not councils met the following essential criteria for selection as a study
site:
Ability to access Management Information (MI) data on service users
electronically.
Ability to link easily records of individuals‟ current service with records of their
past and subsequent service use.
Willingness to work with the research team and to share outputs with other
councils on a named basis.
Availability of local resources (e.g. staffing) to undertake data collection.
In addition, data was collected on the FACS eligibility criteria currently operating in
each local authority, and on the average monthly numbers of referrals to the council‟s
re-ablement service/home care service.
Positive responses were received from 29 councils. Two individuals (a member of
the research team and a CSED representative) assessed responses against the
specified criteria. Some councils were eliminated at this point. Councils were also
excluded if they had only very low numbers of referrals to their home care services,
as it was anticipated this would make it difficult for them to achieve the appropriate
level of recruitment to the study. Choices of comparison group sites were also
restricted because many adult social care departments reported that they were
currently planning or rolling out home care re-ablement services across the authority.
Sites that were selected included councils operating different levels of FACS
eligibility thresholds, so that the study could assess the longer-term impact of re-
ablement on service users with greater and less severe levels of disability.
These sites were sent a detailed list of activities they would be involved in, if
selected; some of the sites expressing an interest in the study then withdrew. The
final selection at this initial stage of the study comprised five councils offering home
care re-ablement services (two of which had teams that included OT staff as well as
re-ablement workers); and four councils offering conventional home care services.
During summer 2008, a series of „site visits‟ was made to the nine councils by a
CSED representative and two research team members. The visits explained in detail

Home care re-ablement services: Investigating the longer-term impacts
140
the respective roles and responsibilities of both the sites and the research team in
terms of taking part in the study, recruiting service users and collecting data. Sites
were offered financial reimbursement to cover administrative and other costs incurred
through taking part in the study. One of the comparison group sites withdrew shortly
after this initial site meeting. Although a replacement site was recruited, there were
inevitable delays before the new site was in a position to start recruiting.
Sites began recruitment to the study in November 2008. At the end of March 2009,
one of the comparison group sites confirmed that it was no longer in a position to
recruit any more participants to the study. The roll-out of that site‟s own re-ablement
service meant that it was not appropriate for front-line staff, who had now been
trained in re-ablement practices, to continue providing conventional home care
services. Rates of recruitment were particularly low in the comparison group sites
(see below) and efforts were made to recruit additional sites. One further council
entered the study in May 2009 as a comparison group site for the final two months of
the extended period of recruitment (June and July 2009). Taken together, the study
involved five re-ablement sites and five comparison group sites.
Table A.1 below shows basic information about the ten study sites. Fuller
information about the five re-ablement sites is provided in Appendix B. Less detail is
included in the report about the comparison group sites as they simply assessed and
referred eligible service users straight on for standard home care services. Neither is
general socio-economic data, and information on population, ethnic diversity and the
like presented, as recruits to the study (in both the re-ablement group and the
comparison group) would have been selected in through referral/FACS and other
eligibility assessment criteria (see Appendix C).
Table A.1 Summary of ten study sites
Re-ablement sites
(n=5)
Comparison group
sites (n=5)
Types of local authority:
Unitary
Metropolitan District
London Borough
Shire County
2
1
1
1
1
1
1
2
FACS criteria at time of entry to study:
Critical and Substantial
Critical, Substantial and Moderate
Critical, Substantial, Moderate, Low (greater)
4
1
-
2
2
1

141
Appendix B Profiles of five re-ablement services (spring
2009)
This appendix summarises some of the main features of the re-ablement services in
each of the five study sites at the time of data collection in spring 2009. It draws
particularly on the accounts given by the service managers in the semi-structured
interviews (see Appendix G), which is reported in Chapter 4. More detailed
information about the costs of services in the five re-ablement sites is provided in
Appendix E.
Site R1
Re-ablement service profile
1 Name of service Community Response Service
2 Establishment of the service
2002/4: Pilot sites were established across all areas of the council, called First Response. This was an initiative within the in-house Home Care Service to provide a short-term rapid support service, predominately to older people being discharged from hospital, with the aim of promoting their independence, improving hospital discharge arrangements and reducing Delayed Transfers of Care. It was to form a foundation for change within the in-house home care service.
2004/07: Within a major transformation programme the whole of the in-house service gradually developed into a short-term assessment and re-ablement service, called Community Response focussing on crisis intervention and hospital discharge.
2008: The service moved to its new structure of four registered Area offices but is centrally managed to ensure strategic development, equity and consistency.
3 Operational structure of current service
There are four Area offices within the service. Each consists of :
a registered area manager
team leaders in each area managing the day-to-day operational service; working within the care management process to undertake on-going assessments within the up-to-six week period of intervention; setting the goals and outcomes to be achieved; and undertaking the supervision and support of staff
Community Response Assistants Level 2 (CRA2) are senior CRAs and support CRAs in complicated cases and also support the Team Leaders who work out-of-hours, particularly supporting discharges at weekends.
Community Response Assistants (CRA). Each team leader supervises CRAs in their district (each area being divided into three districts).

Home care re-ablement services: Investigating the longer-term impacts
142
There are no therapists within the re-ablement team.
4 Current service model
Currently, site R1 takes people for whom they think the service can make a difference. This includes identifying the right level of care to support service users who need on-going care packages; settling people at home after hospital discharges; trying to keep people out of long-term residential care; crisis intervention; and supporting people who are likely to have no further care needs after their intervention.
Typically the service is for six weeks (can be extended to eight weeks if necessary).
If the service user has on-going support needs, in most cases the team leader will commission a care package from an independent agency. However if the case is complex e.g. involving safeguarding then commissioning on-going support will be the responsibility of the care manager.
5 Eligibility criteria The service is available to all adults requiring home care, aged 18 years and over. The service does not take people with learning disabilities as they are considered to need a long-term support package. The service supports predominantly older people with physical or dementia needs. It also offers support to younger people with newly diagnosed conditions such as MS, Parkinson‟s and motor neurone disease.
The local FACS threshold is „critical and substantial‟ risk.
6 Referral routes The service takes referrals from hospital and community teams.
7 Skill mix and staff training
Team leaders have NVQ Level 4 in Care. All their staff have NVQ Level 2 in Care. Staff receive induction and training on re-ablement, on-going training on standard skills, dementia training and refresher courses (such as emergency aid, infection control, medication and falls). At the time of the interview, the managers and more senior home care assistants had just started training on how to assess for minor adaptations such as grab rails. A number of CRAs have had training in how to do exercises with service users.
8 Current charging policy1
The service is free for the first few days. Service users are then charged according to their ability to pay.
9 Joint funded/ managed with NHS partners
No
1 At the time the interviews were conducted, there was uncertainty about whether home care re-ablement
could be charged for. Guidance clarifying the position was issued in autumn 2010 (DH, 2010a).

Appendix B Profiles of five re-ablement services (spring 2009)
143
Site R2
Re-ablement service profile
1 Name of service Home Care Rapid Response Team
2 Establishment of the
service
1997: The Home Care Rapid Response Team started as a
project joint-funded for three years by health and social services
and was based in the LA Home Care Service.
2000: the team merged with the Social Services Integrated Care
project.
2002: The Rapid Response Team was merged with the Home
Care Service and opened up to accept all referrals.
3 Operational
structure of current
service
The re-ablement service is comprised of two sections: Rapid
Response (which does the assessments) and the provider side.
There are six managers who do assessments. Within the
providers, there are East and West teams. Each team consists
of:
a line manager (responsible for planning care, managing staff,
liaising with service users)
leaders (supporting staff and setting up the packages of care)
carers.
There are no OTs and physios in the teams but they work
closely with the therapy team and social workers.
4 Current service
model
The aim of the service is to enable adults/older people to
retain/regain their independence in order to facilitate early
hospital discharge; prevent hospital admissions where medically
safe to be treated at home; and reduce premature admission to
long-term residential or nursing care. Re-ablement is offered
within the home care service to service users identified as
having the potential to become independent in at least one area
of activity.
The service provides support for six weeks (can be extended by
two weeks, if necessary).
The majority of referrals are of older people, an increasing
number of whom may have dementia or other mental health
problems.
If the service user needs on-going support, the care
management teams are responsible for commissioning on-going
support.
5 Eligibility criteria The service is available to all adults requiring home care, aged
18 years and over.
The local FACS threshold is „critical and substantial‟ risk.
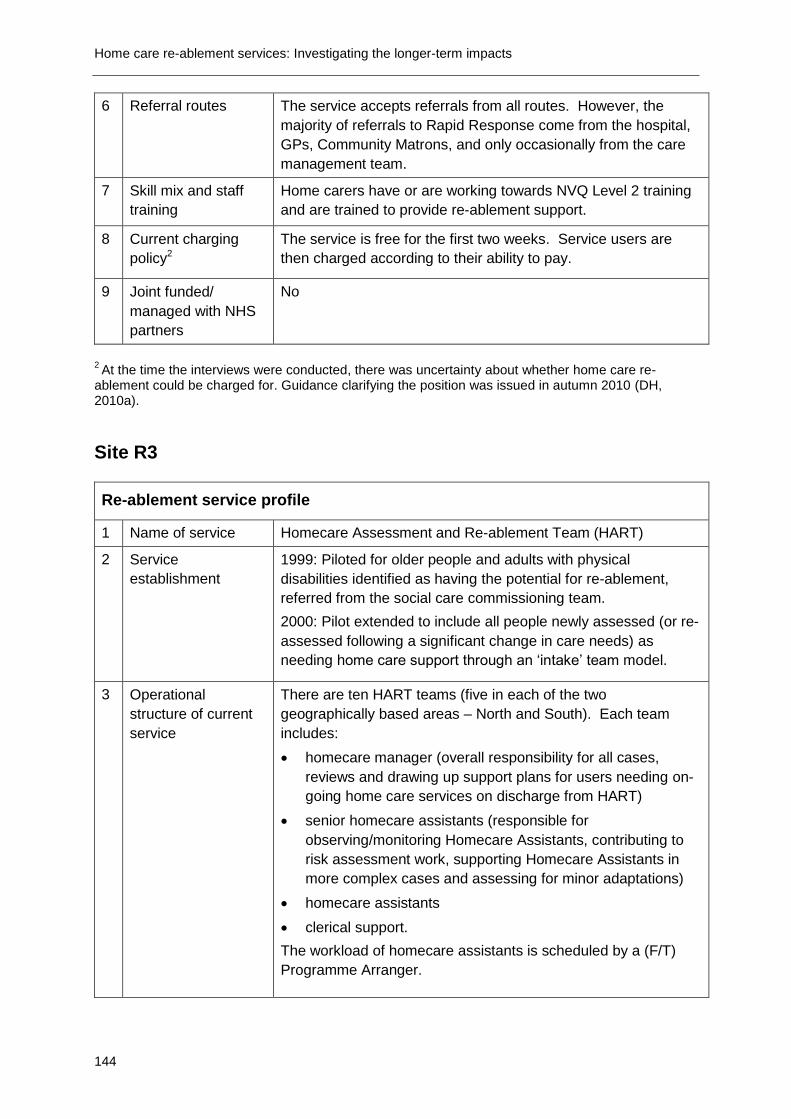
Home care re-ablement services: Investigating the longer-term impacts
144
6 Referral routes
The service accepts referrals from all routes. However, the
majority of referrals to Rapid Response come from the hospital,
GPs, Community Matrons, and only occasionally from the care
management team.
7 Skill mix and staff
training
Home carers have or are working towards NVQ Level 2 training
and are trained to provide re-ablement support.
8 Current charging
policy2
The service is free for the first two weeks. Service users are
then charged according to their ability to pay.
9 Joint funded/
managed with NHS
partners
No
2 At the time the interviews were conducted, there was uncertainty about whether home care re-
ablement could be charged for. Guidance clarifying the position was issued in autumn 2010 (DH, 2010a).
Site R3
Re-ablement service profile
1 Name of service Homecare Assessment and Re-ablement Team (HART)
2 Service
establishment
1999: Piloted for older people and adults with physical
disabilities identified as having the potential for re-ablement,
referred from the social care commissioning team.
2000: Pilot extended to include all people newly assessed (or re-
assessed following a significant change in care needs) as
needing home care support through an „intake‟ team model.
3 Operational
structure of current
service
There are ten HART teams (five in each of the two
geographically based areas – North and South). Each team
includes:
homecare manager (overall responsibility for all cases,
reviews and drawing up support plans for users needing on-
going home care services on discharge from HART)
senior homecare assistants (responsible for
observing/monitoring Homecare Assistants, contributing to
risk assessment work, supporting Homecare Assistants in
more complex cases and assessing for minor adaptations)
homecare assistants
clerical support.
The workload of homecare assistants is scheduled by a (F/T)
Programme Arranger.

Appendix B Profiles of five re-ablement services (spring 2009)
145
4 Current service
model
HART has two main roles: assessment and re-ablement.
All new referrals for homecare are referred to the HART team
following a community care assessment by a care manager or
from health via the Single Assessment Process. If there is no
capacity within the team to support the service user, or if it is
considered that they would not benefit from a short-term re-
ablement intervention, they are referred straight to an
independent sector home care provider.
If the case is accepted by HART, the team provides support for
up to six weeks (can be extended by one to two weeks if
necessary). If the service user needs on-going care at the end
of the period of re-ablement, the HART manager will commission
home care from independent agencies.
5 Eligibility criteria
The HART service is available to all adults aged 18 and over
assessed as needing home care support, including people with
learning difficulties and older people with dementia. The only
exception is when it is considered that a short-term, re-ablement
focused intervention would either be detrimental to the person or
that the service user would not benefit from it in any way, e.g.
somebody who is in the last stages of a terminal illness.
The local FACS threshold is „critical, substantial and moderate‟
risk.
Currently about 80 per cent of their are older people.
6 Referral routes The service takes referrals from hospital and community teams.
7 Skill mix and staff
training
Staff within the team have or are working towards NVQ Level 2
in Care and receive induction training on a set of core skills.
They all receive on-going training such as client handling,
personal safety, risk assessment, record keeping. In addition,
HART had an initial re-ablement training programme over two
days but this is no longer needed as new starters work alongside
experienced staff to acquire the necessary skills. Staff also
receive specific spot training as and when required. They also
receive dementia training and attend Vista courses to support
people with visual impairments. There are no OTs in the HART
teams. Home care managers and senior home care assistants
are trained to assess for minor aids and adaptations (such as
trolleys, bath boards and perching stools) so that they can order
such equipment as and when needed. Access to OTs for more
complex cases is fast-tracked to the mainstream locality
commissioning teams.
8 Current charging
policy
The service is free for the first two days. Service users are then
charged according to their ability to pay.3
3 At the time the interviews were conducted, there was uncertainty about whether home care re-ablement
could be charged for. Guidance clarifying the position was issued in autumn 2010 (DH, 2010a).

Home care re-ablement services: Investigating the longer-term impacts
146
9 Joint funded/
managed with NHS
partners
No
Site R4
Re-ablement service profile
1 Name of service START Service
2 Establishment of
the service
2005: The START Service began as a pilot within the LA home
care service delivering short-term re-ablement services, taking
on all community referrals from one locality (out of four).
2007: The START Service became Intermediate Care at Home
Service, an NHS service delivering both enablement and clinical
intervention (including OTs and physiotherapists).
2008: The START Service opened up to accept all referrals.
Currently the Rapid Response Service, which is a short-term
Crisis Intervention Service delivering home care support for up to
seven days with immediate effect, is part of the Intermediate
Care at Home service.
3 Operational
structure of current
service
The Team Manager is responsible for the overall operational
performance of the home care service, which includes START,
long-term clients and extra care housing.
There are seven teams, supporting Rapid Response and START
clients; these include:
managers (overseeing the whole service, supporting case
management, risk management issues, line management of
staff, supervision, performance observation of staff)
a scheduling team (allocating work to home care staff)
senior care officers (overseeing cases, supervising staff, risk
management)
care officers (Rapid Responders)
home care assistants.
4 Current service
model
The service is supporting individuals to regain their levels of
independence and maximise their daily living skills.
When there is no capacity to take on a referral, the referral will
go back to the commissioning teams who will arrange care from
independent providers.
The START Service provides support for six weeks (extended by
two weeks, if necessary).
If the service user needs on-going support, the care
management teams are responsible for commissioning the on-
going support.

Appendix B Profiles of five re-ablement services (spring 2009)
147
5 Eligibility criteria
The START Service is available to all people over 18 who are
assessed as needing home care services (including people with
mental health problems and dementia but excluding people with
learning disabilities).
The local FACS threshold is „critical and substantial‟ risk.
6 Referral routes The service takes referrals from hospital and community teams.
7 Skill mix and staff
training
Currently, staff within the team are trained up to NVQ Level 3.
All staff get all the basic homecare mandatory training (e.g.
moving and handling training, hoist training, Mental Capacity Act,
vulnerable adults and basic food hygiene), distance learning
dementia training and a comprehensive two week induction
programme to support enablement services. Staff receive
limited mental health training.
As part of the Intermediate Care at Home Service, the re-
ablement service had direct access to a clinical team including
OTs, physiotherapists and District Nurses. However, at the time
of the interview the service was facing a real shortage in therapy
services as the START Service had lost both its senior OTs and
physiotherapists.
8 Charging policy The service is provided free of charge.
9 Joint funded/
managed with NHS
partners
Yes
Site R5
Re-ablement service profile
1 Name of service Homecare Assessment and Re-ablement Team (HART)
2 Establishment of
the service
2004: Enablement Discharge Service (WEDS) was established
as a partnership between the in-house Homecare Service and
the Hospital Trust.
2006: WEDS ran a pilot for people over 65, discharged from
elderly care hospital wards to include an assessment function
based upon existing models.
2007: Homecare Assessment and Re-ablement Teams (HART)
were established with an assessment and re-ablement function
and with a major expansion to include all referrals for people
over 18 assessed as needing short-term homecare support.
3 Operational
structure of current
service
There are 30 HART teams (ten in each of three areas),
including:
registered managers (managing the organisers)

Home care re-ablement services: Investigating the longer-term impacts
148
organisers (line managing enablers, organising
programmes/workloads, doing risk assessments and
organising discharges)
senior carers (taking on any complicated cases, doing
quality assurance visits, supervising enablers)
home care enablers
(P/T) community OTs, funded by social services and taking
care of community referrals.
Additional OTs are embedded in HART with different grades and
funded by the Acute Hospital Trust, taking care of patients
discharged from hospital.
4 Current service
model
HART has two main roles: assessment and re-ablement.
HART provides support for up to six weeks (can be extended for
a week if necessary).
If service users need on-going support, the HART manager will
commission that from an independent agency.
5 Eligibility criteria
The HART service is available to all adults aged 18 and over
who live in the local authority area. The only limiting factor is
whether HART has the capacity to meet service users‟ needs,
for example, people needing complex and/or continuing care
packages. HART also excludes people in the last stages of a
terminal illness who they consider would not benefit from short-
term interventions.
The local FACS threshold is „critical and substantial‟ risk.
6 Referral routes The service takes referrals from hospital and community teams.
7 Skill mix and staff
training
The majority of staff have an NVQ Level 2 qualification. All staff
have had the standard training required for domiciliary care
agencies. They all receive a half day induction and training on
re-ablement. Nearly all staff have had medication training and
they all undertake dementia training. Mental health training has
not been part of re-ablement training. The staff also have
condition -specific training.
OTs are embedded in HART.
8 Charging policy The service is provided free of charge for a period of six weeks,
or longer if still providing re-ablement support. However, if the
service users are just waiting for an independent provider to
begin providing on-going care, they would be charged according
to their ability to pay.
9 Joint funded/
managed with NHS
partners
Yes

149
Appendix C Recruitment and follow-up of study
participants
This appendix describes the approach to recruitment and follow-up of study
participants.
C.1 Size of study sample
The original research proposal focused only on older users of re-ablement and
conventional home care services. Given their frailty, this group of service users
risked high attrition rates over time, between the T1 and T2 interviews.
Consequently, the study aimed to recruit 1,600 service users (800 in each group) at
T1, in the hope of achieving a final sample at T2 of 1,000 study participants (500 in
each group).
Responses to the initial screening questionnaire that had been sent to all English
councils had alerted the study team to the fact that some home care re-ablement
services screened out some potential referrals as unsuitable for re-ablement, or
lacked the capacity to offer a re-ablement approach to all new referrals. We
therefore anticipated that the home care re-ablement sites would not be able to
achieve as high levels of recruitment to the study as local authorities providing
conventional home care services. The five re-ablement sites were therefore asked to
recruit 160 service users each; the (original) four comparison group sites were asked
to recruit 200 service users each.
C.2 T1 and T1+R interviews
During September and October 2008, training workshops were held in all sites to
ensure a consistent approach by front-line staff to recruitment, obtaining informed
consent from service users and collecting data (see below). The research team
prepared a comprehensive guide for staff involved with the study: (a) to help them
establish a service user‟s eligibility to take part in the study; (b) to provide them with
step-by-step procedures when recruiting and administering questionnaires.
In the majority of cases, local authority social services staff who had taken part in the
training workshops were responsible for recruiting service users to the study and
administering the T1 (and T1+R in the re-ablement sites) questionnaires. However,
one or two sites developed different procedures; for example in one site the council
sub-contracted the local Age Concern organisation to administer the questionnaire.
Individuals were eligible to be invited to take part in the study if:

Home care re-ablement services: Investigating the longer-term impacts
150
they were newly referred to adult social care services (or, for existing service
users, if they had been referred for a review following a major change in
circumstances and needs).
they had been accepted as eligible for social care support under local FACS
criteria.
Were aged 65 years or older.
Had the mental capacity to understand the research and consent to take part;
this meant that service users with moderate or severe dementia or other
cognitive impairments were not recruited to the study.
Study participants were withdraw from the study if their case was closed prematurely,
for instance through admittance to hospital.
A specially designed database was used to manage and monitor recruitment; to
record receipt of completed consent forms, T1 and T1+R questionnaires, and the
monthly service use questionnaires; and to identify the appropriate time to arrange
T2 interviews at (up to) 12 month follow-up.
C.3 Changes to original research design
All research sites were in a position to start actively recruiting study participants by
early November 2008. Initially, recruitment rates were quite low and soon it became
clear that sites faced a number of difficulties recruiting service users to the study.
Discussions with sites revealed that these included:
high refusal rate by very frail older people (or adult children advocating on their
parent‟s behalf)
the length of time it took to complete the T1 questionnaire, which older people
found tiring
service users who were ineligible to take part in the study because of mental
capacity issues
research site staff workload and resource issues
the time of year was regarded as difficult or „quiet‟ in terms of referrals to social
services departments.
Between January and March 2009, following discussion with all the study sites, steps
were taken to address these problems and boost recruitment rates:
the age limit was lowered and recruitment extended to all adult service users (i.e.
aged 18 and above) able to give informed consent
the recruitment period was extended by a further month to the end of April 2009

Appendix C Recruitment and follow up of study participants
151
the General Health Questionnaire was removed from the study interviews to
reduce the time commitment for both staff and service users
incentives for staff were introduced, whereby a sum of money proportionate to
the total number of study participants recruited by the site would be donated to a
charity chosen by staff.
C.4 T2 interviews
The T2 interviews, which were conducted by a research agency specialising in social
and market research, started in November 2009. The intention was that all
participants would have completed T2 interviews 12 months after recruitment.
However, because the recruitment period had been extended by four months to the
end of July 2009 but all the T2 fieldwork had to be completed by the end of May 2010
(to allow sufficient time for data cleaning, statistical analysis and writing up), the T2
follow-up for those respondents recruited between May and July 2009 was less than
12 months. Ninety per cent (206) of people in the re-ablement group and 97 per cent
(136) in the comparison group were followed up at between nine and ten months.
The remainder were followed up slightly earlier in the re-ablement group and slightly
later in the comparison group.
A key concern in terms of arranging T2 interviews was to avoid unsuitable and
distressing approaches, for example in relation to study participants who had died
during the follow-up period. To that end, named liaison officers in all study sites were
sent details on a monthly basis of potential T2 interviewees in their local authority
and asked to confirm that it was still appropriate for them to be contacted to arrange
a T2 interview. Some liaison officers were efficient in providing this information but
for the majority it took numerous email and telephone requests. In addition, and as
anticipated, sites were in contact only with those participants who were still using
services, therefore, the desired information was not always available.
Those participants who were not considered suitable for follow-up at T2 were not
contacted again. At the appropriate time, a letter was sent to the remaining
participants informing them that they would be contacted one last time by an
independent fieldwork agency. Any participant who contacted the research team on
receiving this letter and asked to be withdrawn was taken out of the study at that
point. Contact details for those remaining were then sent to the independent
fieldwork agency. Their interviewers contacted participants to arrange and conduct a
T2 interview with them.
Potential biases relating to the fact that local authority staff collected T1 interview
data whereas T2 data was collected by a research agency have not been
investigated. This is because it is thought that the likelihood of them making any

Home care re-ablement services: Investigating the longer-term impacts
152
difference was low. The majority of study participants would not have known the
social services staff who were administering the T1 questionnaire because they were
new referrals (whether to re-ablement or standard home care), and in at least one
site the local authority contracted out the T1 interviews to other sessional staff or
voluntary organisations.
It is possible that participants might have exaggerated how well they were to staff at
T1 as they wanted to appear in a good light to professionals. However, if that was
the case, then the apparent benefits of re-ablement would have been
correspondingly subsequently reduced.
Table C.1 shows the dates for different fieldwork activities, and also when changes to
the research design were introduced in order to improve recruitment rates.
Table C.1 Fieldwork calendar – site selection and quantitative key milestones
Activity Apr –
June
2008
July –
Sept
2008
Oct –
Dec
2008
Jan –
Mar
2009
Apr –
June
2009
July –
Sept
2009
Oct –
Dec
2009
Jan –
Mar
2010
Apr –
June
2010
July –
Sept
2010
Study site selection process starts
Training workshops for social services staff
T1 recruitment period (Nov 2008 – July 2009)
Changes to original study design to increase recruitment rates
Fifth comparison group site joins study for two months‟ recruitment

Appendix C Recruitment and follow up of study participants
153
Activity Apr –
June
2008
July –
Sept
2008
Oct –
Dec
2008
Jan –
Mar
2009
Apr –
June
2009
July –
Sept
2009
Oct –
Dec
2009
Jan –
Mar
2010
Apr –
June
2010
July –
Sept
2010
T2 interviews conducted (Nov 2009 – May 2010)
Quantitative data cleaning, analysis and write up
Appendix G presents information on recruitment and data collection with staff in the
five re-ablement sites about the organisation and content of home care re-ablement
services.
See Appendix H for information about recruitment and in-depth interviews with re-
ablement service users and carers about their experiences and views of re-ablement
services.


155
Appendix D Standardised outcome measures
This appendix gives details of the standardised outcome measures used in the
evaluation. Study baseline (T1), post-intervention (T1+R) and 12 month follow-up
(T2) questionnaires each contained the following outcome measures for all re-
ablement and conventional home care service users. A copy of the T2 questionnaire
is included at the end of this appendix. In addition to standardised outcome
measures, the T2 questionnaire includes questions on levels of need and resource
use. Only the standardised outcome measures are discussed in this appendix. The
results associated with the standardised outcome measures are presented in
Chapters 6 and 8.
Self perceived health
A person‟s perception of his/her own health has been found to be a reliable predictor
of functional decline (Ferraro, 1980), chronic disease (Shadbolt, 1997) and even
mortality (Idler and Benyamini, 1997). The perceived health question was based on
the five point scale suggested by Robine and colleagues (2003) as part of a
European project on health indicators. This question asks respondents to rate their
health in general according to five categories ranging from „very good‟ to „very bad‟.
On the original scale, a lower score indicates better perceived health; the scale has
been reversed for this study so that a higher score indicates better perceived health.
The self-perceived health measure appears as question 2(a) on the T2 questionnaire
at the end of this appendix.
Perceived quality of life
The quality of life item was developed as part of a project funded under the ESRC
Growing Older Research Programme (Bowling et al., 2002). This item was measured
using a seven point scale, with categories ranging from „so good, it could not be
better‟ to „so bad, it could not be worse‟ (Bowling, 1995). On the original scale, a
lower score indicates better perceived quality of life; the scale has been reversed for
this study so that a higher score indicates better perceived quality of life.
The perceived quality of life scale is question 2(b) on the T2 questionnaire at the end
of this appendix.
Health-related quality of life (EQ-5D)
The Euro-QoL (EQ-5D) measure was used to explore the impact of the projects on
users‟ reported changes in health related quality of life. There are three parts to this
measure.
Part 1: Participants are asked to indicate what level of difficulty they have in carrying
out five tasks; Mobility, Self-Care, Usual Activities, Pain/Discomfort and
Anxiety/Depression. The levels of difficulty are, „no problems‟, „some problems‟ and

Home care re-ablement services: Investigating the longer-term impacts
156
„extreme problems/unable‟. So for example, within the „domain‟ of Pain/Discomfort,
users are asked to state:
I have no pain or discomfort, OR
I have moderate pain and discomfort OR
I have extreme pain and discomfort.
Participants‟ responses are then „scored‟ and the changes between pre and post
intervention assessed.
Part 2: Participants are asked to say how they feel their „general level‟ of health has
changed compared to the previous 12 months, whether it has got better, is much the
same, or worse.
Part 3: Participants are asked to indicate how good or bad their heath state is on a
„thermometer‟ that runs from 0 (worst imaginable health state) to 100 (best
imaginable health state).
The EQ-5D is question 5 on the T2 questionnaire at the end of this appendix.
Social care quality of life
Social care quality of life was measured using the Adults Social Care Outcomes
Toolkit (ASCOT). This toolkit is a preference weighted indicator that reflects need for
help and outcome gain from services across nine domains ranging from basic areas
of need such as personal care and food and nutrition, to social participation and
involvement and control over daily life. The questions ask respondents to choose,
from a series of three deteriorating situations, which of the options best describes
their situation. In this way, the questions aim to capture no needs, low level needs
and high level needs in each domain. The ASCOT appears as questions 4(b) to 4(k)
on the T2 questionnaire at the end of this appendix. Table D.1 shows the responses
and associated levels of need for each of the nine domains.15
The current outcome scores are calculated by attaching importance weights (in
number form) to the chosen level for each attribute and summing these numbers for
all domains. The results of an earlier preference study (Burge et al., 2006) provided
importance weights for seven of the nine attributes (with dignity and anxiety un-
matched). These weights were estimated using the Best-Worst approach (see Table
4.5, Burge et al., 2006). All of these preference weights were updated using the
results from a RAND working paper on the estimation of preference weights for
ASCOT (Burge et al., 2010) which includes weights for the dignity and anxiety.
15
The caring domain has now been removed from the ASCOT scale.

Appendix D Standardised outcome measures
157
Table D.1 Options provided for each ASCOT domain to reflect each need level
Domain Need level Description
Control No Low High
I have as much control over my daily life as I want Sometimes I don‟t feel I have as much control over my daily
I have no control over my daily life
Personal care No Low High
I feel clean and wear what I want I sometimes feel less clean than I want or sometimes can‟t
wear what I want I feel much less clean than I want, with poor personal hygiene
Food and nutrition No
Low High
I eat the meals I like when I want I don‟t always eat the right meals I want, but I don‟t think there
is a risk to my health I don‟t always eat the right meals I want, and I think there is a
risk to my health
Safety No Low High
I feel as safe as I want Sometimes I do not feel as safe as I want
I never feel as safe as I want
Social participation No Low High
My social situation and relationships are as good as I want Sometimes I feel my social situation and relationships are not
as good as I want I feel socially isolated and often feel lonely
Activities/occupation No
Low High
I do the activities I want to do I do some of the activities I want to do
I don‟t do any of the activities I want to do
Accommodation No Low High
My home is as clean and comfortable as I want My home is less clean and comfortable than I want
My home is not at all as clean or comfortable as I want
Level of worry and concern
No Low High
I feel free from worry and concerns on a day-to-day basis I sometimes feel worried and concerned
I feel very worried and concerned on a daily basis
Dignity and respect No Low High
I am treated by other people with the dignity and respect that I want
Sometimes I am not treated by other people with the dignity and respect that I want
I am never treated with the dignity and respect that I want
Table D.2 gives the weights that we applied to each of the attributes. For example, if
a person reported that their personal cleanliness was at a desired level then this
would be scored at 4.54. In this way, all nine attributes are weighted and summed for
a total score. The maximum possible score is 41.08 and the minimum possible is
10.82. The measure was rescaled by dividing the total by 41.08 to give a possible
range of 0.26 to 1.00.

Home care re-ablement services: Investigating the longer-term impacts
158
Table D.2 Preference weights for attributes and levels
Desired Adequate Poor
Control over daily life 5.18 1.5 0
Personal cleanliness 4.54 1.87 1.09
Meals and nutrition 4.16 2.59 1.96
Safety 4.71 1.71 1.14
Social participation 4.67 2.36 0.76
Activities/occupation 4.50 3.95 1.69
Home cleanliness and comfort 4.38 2.47 1.76
Anxiety 4.69 1.88 1.24
Dignity and respect 4.25 1.63 1.18
Psychological well-being
The psychological well being of service users was initially measured by the 12-item
version of the General Health Questionnaire (Goldberg, 1992). This scale comprises
12 items that explore whether respondents have experienced a particular symptom
or behaviour over the past few weeks. However, the scale was removed in January
2009 to reduce the time commitment for staff and service users, therefore this
question is not included in the T2 questionnaire at the end of this appendix.

Unique study participant number____________
Home Care Re-ablement Services: Investigating the Longer-term Impacts
.
Time 2 (T2) Follow-up Questionnaire
159
1) Thinking about the help that people sometimes get from family and friends.
a) Do you receive any practical help on a regular basis from any friends, neighbours, a partner or family members? Tick all that apply.
Yes, from someone living in my household
Yes, from someone living in another household
No – Go to question 2
b) How many different people provide support?
1 – 2
3 – 5
6 or more
c) Who would you say helps you the most? Tick one only.
Spouse/partner
Son/daughter
Other family member
Friend/neighbour
2) Thinking about your health and quality of life.
a) How is your health in general?
Very Good
Good
Fair
Bad
Very Bad
b) Thinking about the good and bad things that make up your quality of life, how would you rate the quality of your life as a whole?
So good, it could not be better
Very good
Good
Alright
Bad
Very bad
So bad, it could not be worse
3) The following questions are about how satisfied you are about the services that you receive
a) Firstly, could I ask whether you currently receive
services through your local council or local authority?
No Go to Q3c
Yes Go to Q3b and then to Q3c
Don‟t know Go to Q3c
b) Overall how satisfied are you with the help that you receive from your local council or local authority?
Extremely satisfied
Very satisfied
Quite satisfied
Neither satisfied nor dissatisfied
Quite dissatisfied
Very dissatisfied
Extremely dissatisfied
Not applicable
c) Have you or your family paid for any services you
have received? (Please tick one box)
No Go to Q4
Yes Go to Q3d
Don‟t know Go to Q4
d) Overall how satisfied are you with the help that
you have received which has been privately paid for?
Extremely satisfied
Very satisfied
Quite satisfied
Neither satisfied nor dissatisfied
Quite dissatisfied
Very dissatisfied
Extremely dissatisfied
Not applicable

160
4) The following questions are about how you feel at the moment about aspects of your life and home.
a) In what ways have services helped you? Please tick all that apply.
Not applicable - no services received
To feel in control of daily life (being able to do
what I want when I want)
With personal care (such as getting dressed)
Taking medicine
Meals
Feeling safe and secure
Spending time with people that I want to be with
Doing activities I want to do
Keeping my home clean and comfortable
Making my home easier to get around and
manage
Getting around my local area
Caring for others
Feeling free from worry and concerns
Other (please specify in the box)
Please tick only one box for each of the following questions.
Many people value being in control of their daily lives and having independence
By „control over daily life‟ we mean you are the one
making decisions about your life, and having the
choice to do what you want, when you want.
b) Which of the following statements best describes
your present situation?
I have as much control over my daily life as I want
Sometimes I don‟t feel I have as much control
over my daily life as I want
I have no control over my daily life
c) Thinking about the way you look and feel, which of the following statements best describes your present situation?
I feel clean and wear what I want
I sometimes feel less clean than I want or sometimes
can‟t wear what I want
I feel much less clean than I want, with poor
personal hygiene
d) Thinking about the meals you eat, which of the following statements best describes your present situation?
I eat the meals I like when I want
I don‟t always eat the right meals I want, but I don‟t
think there is a risk to my health
I don‟t always eat the right meals I want, and I think
there is a risk to my health
e) Which of the following statements best describes how safe you feel?
Not feeling safe could be due to fear of abuse, falling
or other accidental physical harm, and fear of being
attacked or robbed.
I feel as safe as I want
Sometimes I do not feel as safe as I want
I never feel as safe as I want
f) Which of the following statements best describes your social situation?
By social situation we mean keeping in touch with
people and spending time with people that you want
to be with.
My social situation and relationships are as
good as I want
Sometimes I feel my social situation and
relationships are not as good as I want
I feel socially isolated and often feel lonely
g) Thinking about your usual activities including leisure, doing things for others and paid or unpaid employment, which of the following statements best describes your present situation?
I do the activities I want to do
I do some of the activities I want to do
I don‟t do any of the activities I want to do
h) Thinking about your home, which of the following
statements best describes your present situation?
My home is as clean and comfortable as I want
My home is less clean and comfortable than I want
My home is not at all as clean or comfortable as I want

161
i) Which of these statements best describes how worried or concerned you feel?
I feel free from worry and concerns on a day-to-day basis
I sometimes feel worried and concerned
I feel very worried and concerned on a daily basis
j) Which of the following statements best describes your present situation?
I am treated by other people with the dignity and respect that I want
Sometimes I am not treated by other people with the dignity and respect that I want
I am never treated with the dignity and respect that I want
k) Thinking about the care and support you provide to others such as children, husband, wife or partner, which of the following statements best describes your present situation?
Not applicable
I provide others with the kind of support that I want
to provide
At times I find it difficult to provide others with the
kind of support that I want to provide
I am not able to provide others with the kind of
support I want to provide
5) We are now going to move on to discuss your health. By placing a tick in one box in each group below, please indicate which statements best describe your own health state today.
a) Mobility
I have no problems in walking about
I have some problems in walking about
I am confined to bed
b) Self-care
I have no problems with self-care
I have some problems washing or dressing myself
I am unable to wash or dress myself
c) Usual activities (e.g. work, study, housework, family
or leisure activities)
I have no problems with performing my usual
activities
I have some problems with performing my usual
activities
I am unable to perform my usual activities
d) Pain/Discomfort
I have no pain or discomfort
I have moderate pain or discomfort
I have extreme pain or discomfort
e) Anxiety/Depression
I am not anxious or depressed
I am moderately anxious or depressed
I am extremely anxious or depressed
f) Compared with my general level of health over the past 12 months, my health state today is:
Better
Much the same
Worse
g) To help people say how good or bad a health state is, we have drawn a scale (rather like a thermometer) on which the best state you can imagine is marked 100 and the worst state you can imagine is marked 0. We would like you to indicate on this scale how good or bad your own health is today, in your opinion. Please do this by drawing a line to whichever point on the scale that indicates how good or bad your health state is today.

162
a) Get up and down stairs or steps
On own without help Only with someone else
On own with difficulty Not at all
b) Go out of doors and walk down the road
On own without help Only with someone else
On own with difficulty Not at all
c) Get around indoors (except steps)
On own without help Only with someone else
On own with difficulty Not at all
d) Get in and out of bed (or chair)
On own without help Only with someone else
On own with difficulty Not at all
e) Use WC/toilet
On own without help Only with someone else
On own with difficulty Not at all
f) Wash face and hands
On own without help Only with someone else
On own with difficulty Not at all
g) Bath, shower or wash all over
On own without help Only with someone else
On own with difficulty Not at all
h) Get dressed and undressed
On own without help Only with someone else
On own with difficulty Not at all
i) Feed yourself
On own without help Only with someone else
On own with difficulty Not at all
j) Which of these statements describes your ability to control your bladder? (A person able to manage a catheter without assistance may be described as continent)
Continent
Has occasional accidents
Incontinent
6) The following questions are about managing to do things yourself. Do you usually manage to:
9 0
8 0
7 0
6 0
5 0
4 0
3 0
2 0
1 0
100
Worst
imaginable
health state
0
Best
imaginable
health state

163
k) Which of these statements describes your ability to control your bowels? (A person able to manage a colostomy without assistance may be described as continent)
Continent
Has occasional accidents
Incontinent
a) How many times have you seen a GP in the last month? (Please tick one box only)
Not at all
Once
2 or 3 times
4 or 5 times
6 or more times
Don‟t know
b) How many times have you visited a hospital’s Accident and Emergency department (or hospital walk-in centre) in the last month? (Please tick one box only)
Not at all
Once
2 or 3 times
4 or 5 times
6 or more times
Don‟t know
c) How many times have you attended a hospital outpatient department or clinic in the last month? (Please tick one box only)
Not at all
Once
2 or 3 times
4 or 5 times
6 or more times
Don‟t know
d) Have you been in hospital as an inpatient (overnight or longer) since you agreed to join the study? (Please tick one box only)
No
Yes
Don‟t know
e) If yes, how many separate stays? ______
f) How many days in total? ________
g) How often have you seen a nurse (e.g. district nurse, health visitor, practice nurse from a GP surgery) in the last month? (Please tick one box only)
Not at all
Less than once a week
Once a week
2 or 3 times a week
Everyday or nearly
Don‟t know
h) How many times have you seen a therapist (e.g. physiotherapist, occupational therapist, speech therapist) in the last month? (Please tick one box only)
Not at all
Once
2 or 3 times
4 or 5 times
6 or more times
Don‟t know
i) How many times have you seen a chiropodist or podiatrist in the last month? (Please tick one box only)
Not at all
Once
2 or 3 times
4 or 5 times
6 or more times
Don‟t know
j) How many times have you seen a local authority social worker or care manager in the last month? (Please tick one box only)
Not at all
Once
2 or 3 times
4 or 5 times
6 or more times
Don‟t know
k) Have you received any equipment since you agreed to join the study? (Please tick one only)
No
Yes
Don‟t know
l) If yes, what equipment have you received? (for example, grab rails, ramp, stairlift, raising chair seat, walking frame, raised chair seat, hoist)
_________________________________________
7) I would now like to ask some questions about the services that you have received.

164
m) Did you or your family pay anything towards any piece of equipment? (Please tick one box)
No
Yes
Don‟t know
The remaining questions ask about services that you have
received in the last month apart from those arranged by
your council or local authority.
n) How often have you attended a day care centre in the last month? (Please tick one box only)
Not at all
Less than once a week
Once a week
2 or 3 times a week
Everyday or nearly
Don‟t know
o) How often have you received meals on wheels in the last month? (Please tick one box only)
Not at all
Less than once a week
Once a week
2 or 3 times a week
Everyday or nearly
Don‟t know
p) How often have you received meals delivered to your home (other than standard meals on wheels service) in the last month? (Please tick one box only)
Not at all
Less than once a week
Once a week
2 or 3 times a week
Everyday or nearly
Don‟t know
q) How often have you attended a lunch club in the last month? (Please tick one box only)
Not at all
Less than once a week
Once a week
2 or 3 times a week
Everyday or nearly
Don‟t know
r) How many hours of home care/home help service have you received in the last month? (Please tick one box only)
None
5 or fewer hours a week
More than 5, up to 10 hours a week
More than 10, up to 15 hours a week
More than 15, up to 20 hours a week
Over 20 hours a week
Don‟t know
s) Have you received any other services or help in the last month (apart from those you receive from family, friends or from your council/local authority)? (Please tick all that apply)
No other services received
Cleaning/domestic help
Gardening
Visiting/befriending scheme
Help with shopping
Social group
Don‟t know
Other (please specify)
____________________________________________
a) What is your marital status?
Single, that is never married
Married
Widowed
Divorced
Civil Partnership
Cohabiting/living as married
Don‟t know
b) Who do you live with?
Alone
Spouse/partner
Parents
Son/daughter
Other (please specify)
Don‟t know
8) Finally, I would like to ask some questions about your circumstances.

165
c) What is your permanent accommodation?
Bungalow
Flat
Semi-detached house
Detached house
Terraced house
Residential home
Supported setting
Don‟t know
Interviewer note: Only ask interviewee Q8d and Q8e if
their permanent accommodation is not a residential home
or a care home
d) Have you had a stay in a care home or residential home since you agreed to join the study?
No
Yes
Don‟t know
e) If yes, how long was your stay?
Less than one week
One week
Two weeks
Three weeks
One month
More than one month (please specify__________)
Don‟t know
f) Are you ...? (please tick all that apply)
Retired
Doing voluntary work
In part time education/training
In full time education/training
Looking after home/caring for children or others
Working full time
Working part time
Self employed
Looking for work
Not looking for work
Don‟t know
g) Did someone else help with the interview? (For the interviewer to complete)
Yes - Carer
Yes - Other
No
h) Did a proxy complete the interview on behalf of the service user? (For the interviewer to complete)
Yes
No
Thank you for completing this questionnaire
Any other comments (could include comments
from the interviewee or problems completing the
questionnaire from the interviewer)


167
Appendix E Calculating the unit and average costs of
home care re-ablement services
This appendix gives fuller information about the way in which cost data were
collected and calculated. The associated results can be found in Chapter 7.
In mid-January 2009, a questionnaire was devised and sent to the five re-ablement
sites in order to collect information on the costs of the service. The aim of this
exercise was to calculate, for the first time, the unit costs of re-ablement home care
services.
The questionnaire requested detailed information (salaries and time) on the staff
employed to work for the re-ablement service; and other information on training,
travel, capital and other overhead expenditure:
the number of local authority care staff and administrative and supervisory staff
working for the service
the type of professional, their full-time annual salary (excluding oncosts) and the
hours per week or percentage time they work for the service
the same details for other staff working in the team, but who are not employed by
the local authority
an estimate of the training budget and details of what this consists of
a detailed description of the service‟s direct overheads (administration,
management and running costs) and their costs
a detailed breakdown of the service‟s indirect overheads (human resources,
general management and finance functions)
the costs allocated for travel or the amount per visit
information on the number of offices in use by the service so that capital costs
(building and land) could be estimated. If the capital costs were available, then
they could be provided.
Where data were not made available, it was, wherever possible, estimated on the
basis of previous research. As it was unlikely that the site had detailed knowledge of
what equipment had been recommended for use, receipt of equipment was taken
from questionnaires received from service users following assessment. Costs were
calculated and based on those provided in the Unit Costs of Health and Social Care
2009, which takes account of the cost of installing the equipment and the price which
is annuitised over the expected life of the equipment. Otherwise, average prices for
each piece of equipment have been taken from Better Life Health Care website and
discounted over ten years at 3.5 per cent according to Government guidelines.

Home care re-ablement services: Investigating the longer-term impacts
168
The tables below indicate where data have been estimated and approved by the
sites (italics) to ensure that all assumptions and calculations are appropriate.
Site R1
R1‟s community re-ablement team consists of 251 FTE Community Response
Assistants and 55 FTE management and supervisory staff. The team is spread over
four registered offices covering a wide geographical region. Site R1‟s County
Council operate a desk sharing and flexible working policy.
Table E.1 provides the detailed costs for Site R1 for 2007/08 which have been
uprated using the Personal Social Services inflators. The total cost of the service for
2008/09 was £7,646,517 and the total number of service users was 3,500. The cost
per service user was £2,185. The average cost per hour of contact with service
users was £40 and the average cost per total number of hours worked by care staff
(contact and non contact) was £20.
Care staff costs were 61 per cent of total costs. Due to size and area, travel costs
were at the higher end of the range for the five sites (12 per cent of total costs).
Direct overheads such as supervisory and management costs and the running costs
amounted to 26 per cent of total costs. Total overheads including travel were 39 per
cent of total costs. Capital costs for land and buildings have been estimated by
PSSRU and based on the new build and land requirements of 27 local authority
offices and were less than one per cent of total costs. Equipment costs were also
less than one per cent of the total costs.

Appendix E Calculating the unit and average costs of home care re-ablement services
169
Table E.1 Breakdown of costs for site R1
R1 Home care re-ablement service 2007/08 and uprated
to 2008/09
Salaries and oncosts
Community response assistants
£5,133,740
Less Income from health -£452,432
Overheads
Direct overheads
Administrative and Management
Travel
Supplies and Purchases
Premises
£1,906,307
£945,318
£67,616
£3,644
Indirect overheads
Capital overheads
Building and land costs based on 27 desks.
Equipment costs
£31,151
£9,655
£1,518
TOTAL COSTS £7,646,517
Total number of hours worked by care staff
382,395
Total number of hours contact with service users 191,197
Annual caseload 3,500
Cost per hour worked by care staff
£20
Cost per hour of contact with service users £40
Average annual cost per service user £2,185
Site R2
R2‟s team consists of 48.9 FTE care workers and five administrative and supervisory
staff on varying contracts. As R2 does not have a separate re-ablement service, on
any day the home care workers could be working with a mixture of re-ablement
service users, palliative care service users and conventional long-term service users.
This has been accounted for when apportioning the costs to the re-ablement service.
R2 also employs temporary staff to cover annual leave.
The total cost for the service for 2008/09 was £1,612,182 and the annual average
cost per service user was £3,575 with a total number of service users of 451 (see
Table E.2). The cost of all hours worked by care staff (contact and non contact) was
£16 and the cost per contact hour was £36. Care staff costs were 92 per cent of total

Home care re-ablement services: Investigating the longer-term impacts
170
costs, total overheads including travel were eight per cent of total costs. The capital
costs of the building have been provided by site R2 and annuitized in the usual way.
Equipment costs were £3,581 and have been estimated by PSSRU as discussed
above. They were less than one per cent of total costs.
Table E.2 Breakdown of costs for site R2
R2 Home care re-ablement service 2008/09
Salaries and oncosts
Re-ablement team leaders
Homecare staff
Bank care staff covering annual leave
Overheads
Direct overheads
Direct services management
Uniforms
Training
Travel
Indirect overheads
Capital overheads
Building and land
Equipment (computers)
Equipment (aids and adaptations)
TOTAL COSTS
Total number of hours worked by care staff
Total number of hours contact with service users
Annual caseload
Cost per hour worked by care staff
Cost per hour of contact with service users
Average annual cost per service user
£83,366
£1,238,918
£158,400
£28,935
£840
£500
£28,860
£64,500
£3,402
£880
£3,581
£1,612,182
99,879
44,679
451
£16
£36
£3,575
Site R3
R3‟s team consists of 184 home care assistants on varying contracts and 22
supervisory and management staff. The total cost for the service for 2008/09 was
£3,382,148 and the annual average cost per service user was £1,609 with a total of

Appendix E Calculating the unit and average costs of home care re-ablement services
171
2,102 service users (see Table E.3). The cost for hours worked by care staff (contact
and non contact) was £23 and the cost per contact hour was £45. Care staff costs
were 61 per cent of total costs, total overheads (including travel) were 39 per cent of
total costs (seven per cent indirect and 19 per cent indirect overheads). Total capital
costs were less than one per cent of total costs. The capital costs of the buildings
have been estimated by PSSRU and based on the new build and land requirements
of 25 local authority offices; equipment costs were estimated as discussed above.
Table E.3 Breakdown of costs for site R3
R3 Home care re-ablement service 2008/09
Salaries and oncosts
Care Staff
£2,077,201
Overheads
Direct overheads
Total Management and Supervisory Costs
£600,925
Uniforms £14,931
Direct Office Expenses £6,282
Other £3,929
Travel budget £421,206
Training Budget £15,706
Indirect overheads
Department and Central and Support Services £230,000
Capital overheads
Building and land
£8,939
Equipment £2,038
TOTAL COSTS £3,382,148
Total number of hours worked by care staff
Total number of hours contact with service users
Annual caseload
Cost per hour worked by care staff
Cost per hour of contact with service users
Average annual cost per service user
148,878
74,439
2,102
£23
£45
£1,609

Home care re-ablement services: Investigating the longer-term impacts
172
Site R4
R4‟s team consists of 40 home care workers on varying contracts and six FTE
management and supervisory staff. They support and work with people over the
whole of the region. Although in 2008/09 site R3 was progressing towards a model
of re-ablement which would include an OT, at the time of analysis, this change to the
service had not been made and these estimates therefore exclude this cost.
Total costs for 2008/09 were £937,739 and the total number of service users was
429 (see Table E.4). The average annual cost per service user was £2,185 and the
cost per hour of contact was £42. The cost for all hours worked by care staff (contact
and non contact) was £19. Care staff costs accounted for 61 per cent of total costs
and overheads (including travel) (direct and indirect) were 39 per cent of total costs.
Capital costs (building and land) were estimated by PSSRU at £2,145 and were
based on the cost of six local authority offices. Equipment costs were £700, which is
less than one per cent of total costs.
Table E.4 Breakdown of costs for site R4
R4 Home care re-ablement service 2008/09
Salaries and oncosts
Care staff
£571,357
Overheads
Direct overheads
Management and supervision costs
£182,595 Office costs Travel Training
£9,551 £83,040 £1,150
Indirect overheads
£87,200
Capital overheads Building and land based on 6 desks Equipment
£2,145 700
TOTAL COSTS
£937,739
Total number of hours worked by care staff
49,100
Total number of hours contact with service users
22,586
Annual Caseload
429 Cost per hour worked by care staff
£19
Cost per hour of contact with service users
£42
Average annual cost per service user
£2,185

Appendix E Calculating the unit and average costs of home care re-ablement services
173
Site R5
R5‟s team consists of 129 care staff (127 enablers working 21 hours), 21 home care
organisers, and 17 senior carers. Also in the team employed by the local authority
are two OTs (one senior and one grade 5). They both work 35 hours. As well as the
local authority staff, there are a further three OTs (senior 1, senior 2 and a basic
grade), a full time assistant practitioner, an OT assistant and a 0.13 WTE admin
support. They share a local authority building with another team.
Total costs for the service for 2008/09 were £3,119,653 and the total number of
service users were 1,514. (see Table E.5) The annual cost per service user was
£2,061, the cost per hour was £23 and the cost per hour of contact was £38. Care
staff costs were 62 per cent of total costs, travel costs were three per cent of total
costs and capital costs (building and land) were provided by Site R5 and accounted
for less than one per cent of total costs. Equipment costs accounted for less than
one per cent of total costs. Total overheads (including travel) were 38 per cent of
total costs (ten per cent indirect overheads and 28 per cent direct overheads).
Table E.5 Breakdown of costs for site R5
R5 Home care re-ablement service 2008/09
Salaries and on costs
£1,934,396
Care staff (enablers, home care organisers and senior carers)
Overheads
Direct overheads
Training
£8,000
Utilities
£11,002
Telephone
£863
Uniforms
£1,831
General equipment, postage
£9,821
Third Party Costs (additional 0.5/ OT + Travel) £20,000
Direct overheads for health care staff £9,661
Supervision and Administration
£726,557
Indirect overheads
Expenses Recharge
Admin Recharge
Corporate Recharge
£168,200
£39,300
£72,300
Indirect overheads for non Local Authority staff £14,743
Travel
£94,372

Home care re-ablement services: Investigating the longer-term impacts
174
R5 Home care re-ablement service 2008/09
Capital overheads
Building and land
Equipment
£3,600
£5,007
TOTAL COSTS
£3,119,653
Total number of hours worked by care staff 136,321
Total number of hours contact with service users 82,042
Annual Caseload 1,514
Cost per hour worked by care staff
£23
Cost per contact hour with service users
£38
Average annual cost per service user
£2,061
Calculating re-ablement costs for study participants
In Chapter 8, the cost of an episode of re-ablement for those participating in the
study was calculated by using the cost per contact hour for service users in each site
(presented in this appendix) and multiplying it by the number of hours of re-ablement
that each participant received. The average cost per episode for study participants
was estimated at £1,510. Chapter 7 gave the average cost of a re-ablement episode
across the five sites as £2,088; this was calculated by taking the average annual
costs of re-ablement across the five sites (£3,339,647) and dividing it by the average
annual number of service users (1,599).
The difference between the two estimates of the cost of a re-ablement episode is
because one estimate (£1,540) is calculated using site specific costs and the actual
length of time in re-ablement for study participants only, and the other (£2,088) is an
average cost of a re-ablement episode for all re-ablement service users over a one
year period, not just those participating in the evaluation.
The average length of a re-ablement episode for participants in the study was 38
hours (see Chapter 3) whereas the average for all people receiving re-ablement in
the five sites during a one year period was 52 hours (see Chapter 7). This difference
in length of episode, combined with differences in the cost per hour of client contact
time (which, as shown in the tables above, ranged from £36 to £45) accounted for
the different in the cost of an episode.
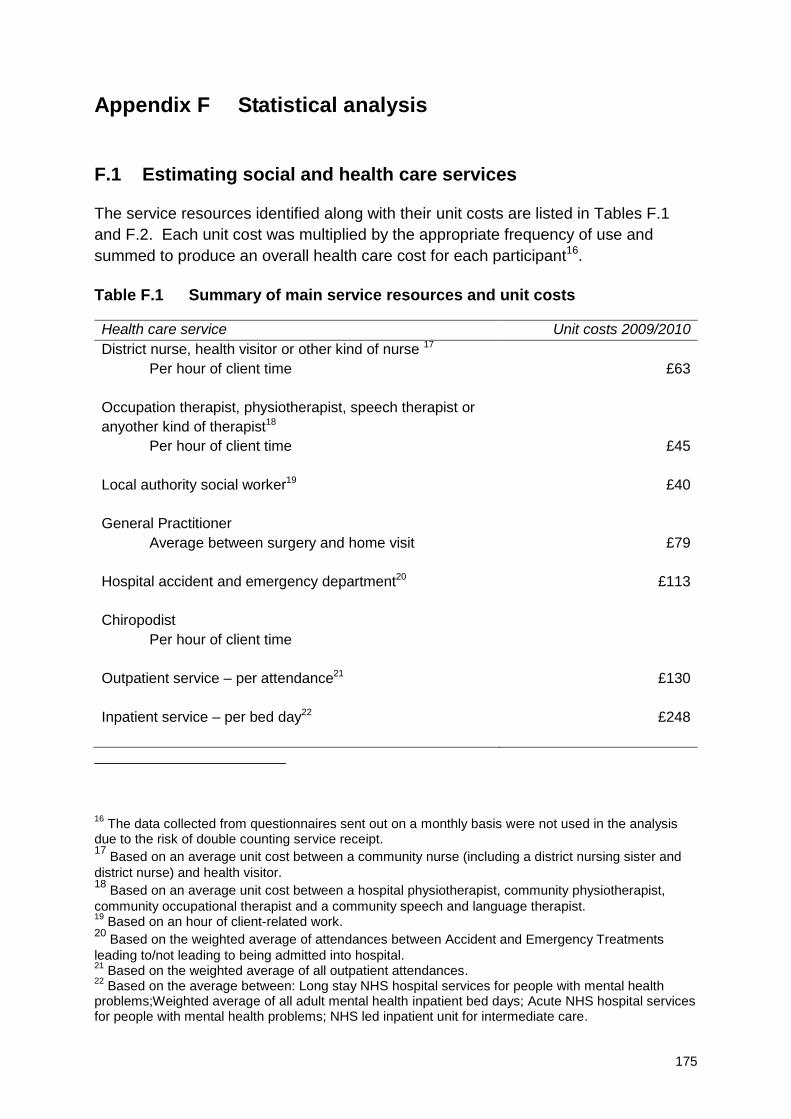
175
Appendix F Statistical analysis
F.1 Estimating social and health care services
The service resources identified along with their unit costs are listed in Tables F.1
and F.2. Each unit cost was multiplied by the appropriate frequency of use and
summed to produce an overall health care cost for each participant16.
Table F.1 Summary of main service resources and unit costs
Health care service Unit costs 2009/2010
District nurse, health visitor or other kind of nurse 17
Per hour of client time
£63
Occupation therapist, physiotherapist, speech therapist or
anyother kind of therapist18
Per hour of client time
£45
Local authority social worker19 £40
General Practitioner
Average between surgery and home visit
£79
Hospital accident and emergency department20 £113
Chiropodist
Per hour of client time
Outpatient service – per attendance21 £130
Inpatient service – per bed day22
£248
16
The data collected from questionnaires sent out on a monthly basis were not used in the analysis due to the risk of double counting service receipt. 17
Based on an average unit cost between a community nurse (including a district nursing sister and
district nurse) and health visitor. 18
Based on an average unit cost between a hospital physiotherapist, community physiotherapist,
community occupational therapist and a community speech and language therapist. 19
Based on an hour of client-related work. 20
Based on the weighted average of attendances between Accident and Emergency Treatments
leading to/not leading to being admitted into hospital. 21
Based on the weighted average of all outpatient attendances. 22
Based on the average between: Long stay NHS hospital services for people with mental health problems;Weighted average of all adult mental health inpatient bed days; Acute NHS hospital services for people with mental health problems; NHS led inpatient unit for intermediate care.

Home care re-ablement services: Investigating the longer-term impacts
176
Table F.2 Average social care costs
Social care resource23
Average unit
cost 2009/2010
Re-ablement home care 24
Mean £40
Minimum £36
Maximum £45
In-house home care
Mean £29
Minimum £17
Maximum £51
In-dependent home care service
Mean £14
Minimum £12
Maximum £16
Day centre per attendance (older person)
Mean £30
Minimum £13
Maximum £65
Day centre per attendance (mental health)
Mean £37
Minimum £16
Maximum £111
Day centre per attendance (physical disability)
Mean £57
Minimum £25
Maximum £147
Day centre per attendance (average across all client groups)
Mean £54
Minimum £33
Maximum £103
Meals on wheels (per meal)
Mean £4
Minimum £3
Maximum £6
23
Unit cost information about lunch clubs was not supplied and is not available in the PSS EX1 data. A cost was not estimated because information about which organisation supplied the service was not sent. 24
Cost per contact hour with service users (see Chapter 7 and Appendix E).

Appendix F Statistical analysis
177
Table F.3 Summary of equipment costs25
Equipment costs Unit costs
2009/2010
Source of information
Adapted telephone £21 Safe Hands: Care & Mobility Centres 2008/09
Bath seat £36 Safe Hands: Care & Mobility Centres 2008/09
Commode chair £169 Safe Hands: Care & Mobility Centres 2008/09
Entry phone £107 Safe Hands: Care & Mobility Centres 2008/09
Grab rail £101 Curtis (2009)
Hoist £1,010 Curtis (2009)
Magnifier £8 Safe Hands: Care & Mobility Centres 2008/09
Pendant alarm £90 https://www.aidcall.co.uk
Perching stool £52 Safe Hands: Care & Mobility Centres 2008/09
Portable ramp £85 Safe Hands: Care & Mobility Centres 2008/09
Raised chair seat £46 Safe Hands: Care & Mobility Centres 2008/09
Raised toilet seat £27 Safe Hands: Care & Mobility Centres 2008/09
Raising chair seat £668 Safe Hands: Care & Mobility Centres 2008/09
Shower chair on
wheels
£320 Safe Hands: Care & Mobility Centres 2008/09
Shower seat £44 Safe Hands: Care & Mobility Centres 2008/09
Special tin opener £13 Safe Hands: Care & Mobility Centres 2008/09
Stairlift £2,823 Curtis (2009)
Tap turners/levers £14 Safe Hands: Care & Mobility Centres 2008/09
Transfer boards £55 Safe Hands: Care & Mobility Centres 2008/09
Walking frame £62 Safe Hands: Care & Mobility Centres 2008/09
Walking stick £13 Safe Hands: Care & Mobility Centres 2008/09
Keysafe (Slimline) £42 http://www.keysafe.co.uk/
Steps £1,000 Estimated
F.2 Sample sizes and missing data
At baseline, 1,015 people were recruited to the study who had minimally complete
records to allow the use of multivariate analysis; of these 654 were in the re-
ablement group and 361 in the comparison group.
25
3.5 per cent was used to increase the costs to 2009/2010 prices.

Home care re-ablement services: Investigating the longer-term impacts
178
Two main sources of data were available at follow-up: data from a participant
interview at T2 and data from service record systems. The former is the source for
T2 data on outcomes whilst the latter gives service use, and so cost data for the
period up to T2.
Table F.4 gives the available sample at the different time points where at least some
data are available for study participants at T2. The table also shows the numbers of
people that were reported to have died. Table F.5 gives similar information, but
shows the numbers of people with interview data available at T2. Of the 1,015 valid
cases at T1, the data show that 109 people had died by the time of follow-up. It is
possible that some people that did not respond at all to requests to continue to
participate in the study at T2 might also have died.
Table F.4 Sample sizes – with T2 cost and/or interview data (outcomes)
Comparison Re-ablement All
T1 361 654 1,015
T2 259 438 697
All 620 1,092 1,712
Died 44 65 109
Lost at follow-up per
centa
16% 23% 21%
a Excluding people that died.
Table F.5 Sample sizes – with T2 interview data (outcomes)
Comparison Re-ablement All
T1 361 654 1,015
T2 141 241 382
All 502 895 1,397
Died 44 65 109
Lost at follow-up per
cent a
49% 53% 52%
a Excluding people that died.

Appendix F Statistical analysis
179
There are a number of reasons apart from death that people dropped out of the
study. If we exclude those who died, 209 cases or 21 per cent of T1 participants
were lost at T2. Again removing the people that died, 524 or about half of T1 cases
did not complete interviews at T2.26 This is a high loss rate from the study, but not
particularly surprising given the nature of this client group.27
What is important is to establish whether loss to follow-up (for all reasons) was
systematically higher for the re-ablement group than the comparison group. The raw
data in the table above suggest that lost to follow-up was slightly higher in the re-
ablement group. If re-ablement services have the effect of removing the need for on-
going social care support then the chances of people losing contact with councils is
higher.
Both bivariate and multivariate analysis do not suggest that lost to follow-up rates are
statistically significantly different between re-ablement and comparison groups.
Table F.6 gives the bivariate results.28 Table F.7 gives the multivariate results.
Again the statistics do not suggest a significant difference between re-ablement and
comparison groups at the 95 per cent confidence level. As expected, people with low
levels of need at baseline – here measured by the number of activities of daily living
(ADLs) they can perform – are less likely to drop out.
Table F.6 Significant difference in lost to follow-up rates
Obs Per cent lost Per cent no T2
interview
Comparison group 361 28 per cent 61%
Re-ablement group 654 33% 63%
Significant difference?
T-test Not sig, p = 0.117 Not sig, p = 0.488
Mann-Whitney Not sig, p = 0.117 Not sig, p = 0.487
26 The differing figures are based on whether we received partial information from the local authority
indicating that the person had not died and therefore we could impute the missing data. 27
Due to slower than expected recruitment rates, the time available within the tight overall timeframe of the study, as well as limited resources for the study, meant that the opportunity to improve T2 responses rates was more limited than would ideally be enjoyed. 28
The results suggest that we are less than 90 per cent confident that there is a statistically significant difference. Conventionally a greater than 95 per cent confidence level is required to reject the null hypothesis of no significant difference.

Home care re-ablement services: Investigating the longer-term impacts
180
Table F.7 Estimation of probability that case lost to follow-upa
Fully missing (mean = 0.31) Interview missing (mean = 0.62)
Coeff Marginal
effectb
Prob Coeff Marginal
effectb
Prob
Female -0.107 -0.038 0.239 NS -0.061 -0.023 0.498 NS
Age (+1 year) 0.008 0.003 0.052 NS 0.001 0.001 0.717 NS
ADLs ability (+1 ADL) -0.048 -0.017 0.014 -0.050 -0.019 0.011
Re-ablement group 0.162 0.056 0.065 NS 0.077 0.029 0.359 NS
Constant -0.886 0.012 0.493 0.145 NS
a Probit analysis, imputed independent variables, n = 1015.
b Change in probability of effect (lost to follow-up) of listed changed in factor (e.g. + 1 ADL reduces
probability of being fully missing by 0.017 or 5.5 per cent of mean probability).
F.3 Missing data imputations
A number of the measures we used require answering all individual items within the
scale to provide an overall outcome score. We applied a multi-pattern regression-
based algorithm for imputing EQ-5D and social care outcome scores. This algorithm
fits different imputation models according to the amount of information missing. We
also applied an algorithm to cope with the missing data at baseline and follow-up.
These imputation models are either a function of the available items alone, or are a
function of the available items and additional service user characteristics. Five
datasets with imputed values for missing items on each variable were estimated
using the user-written command Imputation by Chained Equations (ICE) in Stata
10.1.
Table F.8 gives a breakdown of the number of non-missing cases in the dataset. At
T1 (baseline), 1,015 partial or full records were available. Of these, just under 80 per
cent had social care cost data at T1 (for the first eight weeks after the start of the
study). Ninety-six per cent of respondents at T1 gave complete data on both EQ-5D
outcomes and ASCOT outcomes. Regarding health care data, rather more records
had missing data.
At T2 there were 697 records available with at least some relevant non-missing data.
For these cases, social care costs were non-missing in over 80 per cent of records.
Health care and outcomes data were only available from the interview questionnaire
at T2, for which we had 382 returns. Mostly, outcomes data from the T2 interview
was complete: 368 out of 382 records for EQ-5D and 376 out of 382 for the ASCOT
measure.

Appendix F Statistical analysis
181
Baseline characteristics data, such as age (1,008 cases), gender (1,002 cases) and
tenure (1,005 cases) were largely non-missing.
Missing outcomes and need data at T1 were imputed to give 1,015 records.
Imputation of missing data was also undertaken at T2 to give 382 records. In the
difference-in-difference analyses for outcomes, we use all 1,015 records at T1 and
382 at T2.
Table F.8 Missing data
Non-missing observations Percentage of records
T1
Re-ablement costs 799 79%
Social care costs 767 76%
Health care costs 651 64%
EQ-5D outcomes 974 96%
ASCOT outcomes 978 96%
ADL need 896 88%
Records 1015 100%
T2 (Any partial or full)
Social care costs 581 83%
Health care costs 377 54%
EQ-5D outcomes 368 53%
ASCOT outcomes 376 54%
ADL need 364 52%
Any partial or full record 697 100%
T2 (Interview)
Social care costs 266 70%
Health care costs 377 99%
EQ-5D outcomes 368 96%
ASCOT outcomes 376 98%
ADL need 364 95%
Interview records 382 100%
Cost data, where missing, were also imputed for T1 to give the same 697 cases as
T2. Costs are calculated for the whole year, being the sum of costs reported over the
first eight weeks and costs for the next ten months up until T2. Non-missing T1 and
T2 cost data are required for this purpose. Missing data were imputed where at least
some data on the study participant were available (the 697 cases). Although
baseline costs were available for the further 318 records, these were completely
missing at T2 and so not used in the analysis. Recall that at least 109 of these
„missing‟ records were because the study participant had died.

Home care re-ablement services: Investigating the longer-term impacts
182
The multivariate models described below are all estimated using the imputed
datasets, some just with imputed baseline characteristics data, some with imputed
outcomes and cost variables we well, as described below in individual cases.29
F.4 Death rates
As outlined above, around 11 per cent of people in the study were known to have
died at follow-up. Simple bivariate comparisons showed no significant difference
between the groups in terms of mortality rates (Table F.9). Similarly, accounting for
any difference in the characteristics of people in the groups (age, gender and need),
multivariate analysis also suggested no significant difference in the death rate
between the re-ablement and comparison groups (Table F.10).
Table F.9 Significant difference in rate at which people died at T2
Obs Per cent died
Comparison group 361 12 per cent
Re-ablement group 654 10 per cent
Significant difference
T-test Not sig, p = 0.268
Mann-Whitney Not sig, p = 0.268
Table F.10 Probability that people died at T2a (mean probability = 0.11)
Died at T2 Imputed Non-imputed
Coeff Marginal
effectb
Prob Coeff Marginal
effectb
Prob
Female -0.341 -0.064 0.003 -0.362 -0.067 0.003
Age (+1 year) 0.017 0.003 0.003 0.017 0.003 0.006
ADL ability(+1 ADL) -0.094 -0.016 <0.001 -0.097 -0.016 <0.001
Re-ablement group -0.064 -0.011 0.569NS
-0.090 -0.015 0.454NS
Constant -1.872 <0.001 -1.854 0.001
a Probit analysis, imputed independent variables, n=1,015; and non-imputed, n=889.
b Change in probability of effect (died) of listed changed in factor (e.g. + 1 year of age from average
aged of 84 increases probability of death by 0.003 or 2.8 per cent of mean probability).
29
Multiple imputation involves creating a small number of parallel datasets (in this case five) each with a slightly different random imputation of missing data. The analysis is then simultaneously run on the five datasets and the results are combined using Rubin‟s rules. This process reduces the possibility of spurious imputation of missing data, but is computationally demanding.

Appendix F Statistical analysis
183
F.5 Statistical techniques
F.5.1 Univariate analysis
A chi-square test of association was used to explore the relationship between two
discrete variables (for example, between the re-ablement and comparison groups on
the dichotomous activities of daily living scales). When the outcome measure was
based on a Likert scale (e.g. running from one to seven), a paired t-test was used
to explore mean differences between the re-ablement and comparison groups (for
example, quality of life, perceived health, health-related quality of life and social care
outcomes).
F.5.2 Difference-in-difference analysis
We can use the array of data on participant‟s characteristics and circumstances at
baseline to assess any baseline differences between the groups that are relevant to
their outcomes down the line. In particular, with this method likely confounding
factors at baseline can be included simultaneously in the analysis alongside
treatment group (re-ablement or comparison) as potential predictors of EQ-5D
scores. We can see whether differences between the groups, such as age, gender,
severity of need at the start of the study, account for the differences in EQ-5D score
over and above the effect of being in the re-ablement group rather than the
comparison group (i.e. getting re-ablement services or conventional home care
services). After accounting for possible confounding factors, any difference between
groups in people‟s care-related quality of life at baseline can be removed from any
difference between the re-ablement and comparison group in care-related quality of
life at follow-up. Multivariate analysis at baseline allows us to isolate whether there is
a remaining difference in outcomes (quality of life) at baseline even on the
assumption that people in the two groups had the same characteristics on average.
In other words, it allows us to estimate the size of any difference in outcomes that
remains at baseline between the two groups – re-ablement and comparison – when
effects such as age, gender and need are removed. Remaining differences at
baseline might be due to chance and/or other unknown factors.
This baseline outcome difference can then be subtracted from any difference
between the groups in outcomes at follow-up, again controlling for baseline
characteristics such as age and gender. The net result – the difference in time of the
difference between re-ablement and comparison groups – can then be attributed to
the effects of re-ablement services compared to conventional support. Moreover, this
measured net effect is estimated on the basis that the groups do not differ by age,
sex or need (at baseline). As shorthand, this analysis is often described as a
„difference-in-difference‟ approach and its strength is its ability to minimise selection
bias.

Home care re-ablement services: Investigating the longer-term impacts
184
F.5.3 Multivariate analysis
The multivariate analyses undertaken in this study use multiple regression methods
with multiple-imputation of missing data. Analyses were undertaken in Stata 10 with
the „mim‟ application used for analysis of multiply-imputed datasets. Multi-level
models were estimated using GLLAMM; otherwise OLS, probit and random-effects
models were used (as indicated in the main text).
The total variability of outcome scores explained by the predictors was estimated by
R2 overall. A regression specification error test (RESET) was carried out to explore
the specification of each model (Ramsey, 1969).
F.6 The impact of service user related variables on outcomes
Table F.11 lists all the variables that were used in the multivariate analysis when
exploring what factors had an impact on outcomes.
Table F.11 Service user related variables tested for their impact on outcomes
Service user – related variables Re-ablement services
Age Services involved during re-ablement period
Gender Days receiving re-ablement services
Level of need (FACS criteria) Total hours receiving re-ablement services
Ethnicity Reasons for referral to re-ablement services
Dependency levels Interaction terms including group and panel
Get up and down stairs or steps Local authority dummy codes
Go out of doors and walk down the road
Get around indoors (except steps)
Get in and out of bed (or chair)
Use WC/toilet
Wash hands and face
Bath, shower or wash all over
Get dressed and undressed
Grooming (i.e. washing own hair)
Feed him/herself
Control bladder or bowels
Referral from hospital
Household composition
Tenure
Marital status
Accommodation
Receiving practical help from someone inside or outside of household

185
Appendix G The organisation and content of re-ablement
services
This appendix contains fuller information about data collection and analysis of the
qualitative material relating to the organisation and content of the five home care re-
ablement services. This strand of the project included:
Interviews with re-ablement service managers.
Observation of visits to a sample of home care re-ablement service users.
Focus groups with front-line re-ablement staff.
G.1 Interviews with re-ablement service managers
Semi-structured interviews were conducted from January to March 2009 with the
senior service manager for home care re-ablement in each of the five re-ablement
sites. In three of the sites, senior managers were joined by an operational manager.
The interviews aimed to find out about the delivery and content of re-ablement; the
full topic guide is given below. A pilot interview to refine the topic guide was
conducted with the manager of a re-ablement service in a local authority that was not
participating in the study. A summary of the topics to be covered in the interview was
sent in advance to interviewees.
Three interviews were conducted face-to-face and the remaining two interviews over
the telephone. Interviews lasted between one-and-a-half and two hours. All
interviews were recorded, with the participant‟s consent, and transcribed in full.
Managers were also asked for any relevant documentation relating to the re-
ablement service.
Topic guide used in interviews with re-ablement service managers
Prior to the interview
Establish how much time the manager has.
Brief reminder about the study and purpose of this set of interviews.
Confidentiality – We will find it difficult to maintain anonymity, but hope that this
will not inhibit you in what you say. If there is anything you do not want reported,
you should feel free to ask for tape recorder to be switched off.

Home care re-ablement services: Investigating the longer-term impacts
186
The context and background for introducing re-ablement service
[Note: For this and the next section try and get the managers to focus on the
learning/lessons that would be useful for other LAs setting up a re-ablement service
now.]
1. Why did the LA introduce re-ablement service in the first place? o What were the drivers/objectives? o Whose idea was it? o Who took the lead in setting the service up? What was his/her position within
the LA?
2. Were you involved in setting it up or did you move into post after it had been set up? What was it that prompted your involvement?
3. To what extent did you find your experience/training relevant/helpful in setting up the new service? Did you have any specific training in setting it up? Was there any training/experience that you would have found helpful but you have not had?
4. What (related) services were already operating by the LA / or in partnership with NHS (e.g. in house home care service, intermediate care)?
Setting up the service
5. What guidance did LA have; where did LA look for advice / information / guidance?
6. How long did it take (funding issues; getting Cllrs/others on board)?
7. Did the service start operating … … Across whole of LA immediately or was it rolled out gradually/locality by
locality?
… For all eligible service users immediately or was it rolled out gradually/user
group by user group?
o Why was it done like this? o Advantages and disadvantages of this approach to implementation vs
alternative approaches
8. What was the balance between refocusing existing service and retraining staff (redeployment) and setting up entirely new service (recruiting new staff)? o Why was it done like this? o Advantages and disadvantages of this approach vs alternative approach? Any
difficulties in getting existing staff to change their practice? o What steps were taken (especially with retrained staff) to embed the re-
ablement approach in routine daily practice?

Appendix G The organisation and content of re-ablement services
187
9. Would you have done things differently with hindsight?
Professional skills in the team
10. What kinds of people, in your view, make the ideal re-ablement workers? Possible probes:
o Formal training/qualification o Professional background/experience o Commitment o Staff attitude/‟mindset‟ (Staff approach to service users and the „doing with‟
rather than „doing for ‟ approach) o Other
11. What backgrounds and expertise do you have within the re-ablement team (e.g. home care, OT, Physios, etc)? - How (well) do the re-ablement workers with different skills work together?
12. What roles and responsibilities do different staff have within the re-ablement service – managers; senior carers; carers; others?
13. Other professionals/skills outside the team that you work closely/regularly with?
o What arrangements do you have for accessing other professionals/expertise as part of the re-ablement programme – e.g. referrals to community matrons, physios, other therapists, district nurses and voluntary organisations?
o What difference do you think their involvement makes to the effectiveness of the service?
o Any barriers that you had to overcome to establish access to these professionals/expertise?
14. Other professionals/skills that you would like to have closer/easier contact with in order to improve the effectiveness of the service?
o Why – what difference do you think this would make to the effectiveness of the service?
o What are the barriers to getting closer/easier contact?
15. What kinds of training do you offer staff? Possible probes:
o Initial retraining for existing staff involved in making transition to new re-ablement service
o Induction/training for newly recruited staff o On-going training and supervision for all staff
16. What skills do you have within the re-ablement team for working with users with mental health problems and dementia (depending on eligibility criteria for service)?

Home care re-ablement services: Investigating the longer-term impacts
188
o How do you ensure appropriate team skills? o Are there any shortcomings that reduce the effectiveness of the service for this
group of users?
Key operating issues
17. What are the inclusion/exclusion criteria for the re-ablement service? Why were these decisions made?
o Eligible/non-eligible service users? o All referrals/hospital referrals only? o Any age criteria/cut-offs?
18. Do you think these criteria are appropriate? Are there people who could benefit who are not currently included? Are there people who are included who you think perhaps should not be (like very frail elderly or people who do not have informal support)?
19. Have there been any changes in your eligibility criteria? What? Why? Do you think these changes were appropriate? Are there other changes you would like to see?
20. Charging (or not) for re-ablement services (including equipment)? Why was this decision made?
21. Does a user have the same carer/worker throughout (as far as possible) or a number of different carers?
o Why is the service organised like this? o Advantages and disadvantages of this approach?
The content of re-ablement services
22. What types and service mix of intervention do you offer? o Practical support o Providing equipment o Providing information/signposting o Psychological/emotional/personal support/boosting confidence o Increasing social engagement/contacts/networks o Administering medication o Other?
23. Does everyone get offered the same skill mix/types of support no matter where they are referred from (i.e. hospital discharges and community referrals)?
24. (If providing equipment) ask: Is equipment given to people permanently or loaned for the period of re-ablement.

Appendix G The organisation and content of re-ablement services
189
25. What types of interventions are more/less common? For any particular groups?
26. Are there any interventions that you would like to be able to offer/offer more, but you are not able to? Why?
Assessments, monitoring progress and discharges
27. Who is involved in setting the goals for re-ablement? Do (informal) carers contribute to it or not?
28. How the service user‟s progress towards achieving the agreed goals is monitored? Are there any on-going assessments (setting new goals) during re-ablement?
29. How do you agree when the goals have been reached? Is there a written down care plan that is agreed/signed by the service user?
30. What happens at the end of the re-ablement period - if the service user needs on-going support/services? - If the service user is discharged altogether? o What kinds of information do you give service users on discharge? o How do you make sure that re-ablement workers‟ information is up to date, for
example about new voluntary sector services in the area? o What/are other services signposted routinely either during the re-ablement
period or on discharge (e.g. befriending services, social groups)? o Are people routinely encouraged to purchase equipment and/or support
privately (e.g. cleaners, gardeners, help with shopping) o What (if any) follow-up support is provided?
Manager’s views about the home care re-ablement
31. What factors do you feel promote the impact of re-ablement in the shorter / longer-terms? Possible probes:
o Skill mix of the staff o Access to specialised equipment o Duration of intervention o Eligibility criteria o Family circumstances (e.g. having informal support) o Commitment in the team o Liaison with other services (including how well staff with different
professional/occupational background work together) o Any management issues o Having a flexible approach o Outlook/attitude of service users o Handover to conventional care providers on discharge o Other?

Home care re-ablement services: Investigating the longer-term impacts
190
32. What factors do you feel hinder the impact of re-ablement in the shorter / longer-terms? (barriers/obstacles to successful implementation) Possible probes:
o Skill mix of the staff o Access to specialised equipment o Duration of the intervention o Eligibility criteria o Family circumstances (e.g. having informal support) o Commitment in the team o Liaison with other services (including how well staff with different
professional/occupational background work together) o Any management issues o Having a flexible approach o Outlook/attitude of service users o Handover to conventional care providers on discharge o Other?
33. Overall, in your view, has this form of home care support brought about the desired/intended objectives?
34. What, if anything, could be done to improve the potential benefits of the home care re-ablement?
35. Are there any plans in the near future to develop/modify/change the service? If so, what? Why?
Finally
36. What topics do you think we need to explore in the interviews with the service users to take account of how re-ablement works?
Please can I have copies of any documentation/policies/procedures/guidance about
the re-ablement home care delivery in your site as well as copies of referral
forms/record forms and formal statements of the service?
Thank you for your time, and taking part in this interview. Briefly outline what
happens next. Confirm that we will send them a summary of the study findings in
autumn 2009.
G.2 Observation of visits to a sample of home care re-ablement
service users
The interviews with service managers were followed by observation of a total of 26
re-ablement visits to service users across the five re-ablement sites from February to
May 2009. Service users were observed at different stages in a re-ablement period

Appendix G The organisation and content of re-ablement services
191
to see if and how the intervention differed over time. The aims of the observations
were to:
Obtain a first-hand picture of the practice and processes of re-ablement,
particularly the balance between providing a service for the client and
encouraging service users to participate in and carry out tasks for themselves.
Examine in more detail issues raised by the interviews with service managers.
Obtain (further) insights into differences in the front-line operation of re-ablement
services that might affect outcomes for service users.
Criteria for selecting the observation visits were refined following preliminary analysis
of the interviews with the service managers about the factors reported to affect the
conduct or outcomes of home care re-ablement services. Sites were asked to
arrange for the researcher to observe visits to service users with a range of
characteristics, including different referral routes, gender, age, impairments/illnesses,
ethnicity and living circumstances. In addition, sites were requested to select service
users who were new to adult social care services and those with previous histories of
service use; and those at different stages in the course of a re-ablement episode, in
order to see whether the nature of the re-ablement intervention differed between
sites and over the course of an episode. Sites were also asked to include in the
observation visits home care re-ablement staff with different levels of experience in
the service.
To give the researcher some background knowledge, before each visit sites were
asked to provide some details about the service users, including the date when their
re-ablement started, the reason for referral, their referral route and their re-ablement
goals.
Prior to the observations, staff at each site had obtained verbal consent from the
service users involved in the visits. Written consent was obtained by the researcher
from each service user at the start of the observation. Each visit took between 15 to
30 minutes. The researcher wrote short fieldwork notes during the visits and
expanded these notes, elaborating on key points, immediately after the visit. Some
planned visits were cancelled at short notice because hospital discharges had been
delayed or service users had unexpectedly been admitted to hospital. Because of
time constraints it was not possible to replace these.
The central task in observations was to obtain a first-hand picture of how re-ablement
was practiced on the ground. In particular, the researcher focussed on observations
of the following practices and processes:
Action
what did the workers do to enable/motivate service users?

Home care re-ablement services: Investigating the longer-term impacts
192
the balance between providing a service for service users and encouraging them
to participate in and carry out tasks for themselves.
Interaction
how did workers interact with service users? Who initiated those interactions and
how comfortable/friendly did the interactions seem to be?
how far did re-ablement workers discuss with service users what activities/tasks
they wanted help with?
how familiar did re-ablement workers seem to be with the service users and with
effective ways of involving them?
Process
With the service users‟ consent and time permitting, the researcher had a brief look
at their care plan to find out about:
possible changes in the way re-ablement workers had been working with the
service users since the start of re-ablement
how visits were recorded.
G.3 Focus groups with front-line re-ablement staff
The aim of the focus group discussions conducted between May and June 2009 was
to explore staff views on the factors perceived to promote or constrain the benefits of
re-ablement, in the shorter and longer terms. The original research proposal
included two focus group discussions with front-line workers in each of the five re-
ablement sites. Managers in four of the re-ablement sites were consulted about the
practicalities of this. The unanimous view was that it would be preferable to conduct
just one focus group that included members of different staff teams, to reduce the
problems of providing additional cover while staff were busy in the focus group. This,
together with limited research staff availability, led to a decision to carry out one
focus group discussion in each site.
In each of the five sites, one focus group discussion was conducted with up to eight
front-line staff. In total, 37 front-line staff took part in the focus group meetings, which
were conducted by two researchers. In three of the five sites, an OT participated in
the focus group discussion. All focus group discussions were recorded, with the
participants‟ consent, and transcribed in full.
The full topic guide drawn up for the focus group discussions is given below; it picked
up and further explored some of the issues covered in the interviews with managers
and which had arisen from the observations of re-ablement visits.

Appendix G The organisation and content of re-ablement services
193
Topic guide for the focus groups with front-line staff
1. Introduction
o Information sheet and consent form o Researcher introduction o Aims of the focus group o Confidentiality within the group o Ground rules about conduct of focus group
Group introductions: Ask everyone to say their names, their job title, background, and
how long they have been in the re-ablement team.
2. General views on re-ablement?
What, if anything, does this service actually provide that traditional home care services do not?
Do you think that re-ablement works equally/differently for different groups of people? Are there any groups of service users who you think do not have the potential to be re-abled? Why? E.g. o Those who come into the service at different FACS levels? o Younger / older people? o Hospital / community referrals? o People with Dementia and people with mental health problem?
Is all of your caseload re-ablement? If not, how do you feel about changing from one role to another?
3. What factors perceived to enhance/facilitate the impact and/or duration
of the benefits of the re-ablement service in the shorter and longer-
terms? (Ask for actual examples (anonymous) to help illustrate points being
made)
Possible prompts:
Internal factors (team/service/organisation):
Features of the re-ablement service (referrals, skill mix of the staff, assessment, team meetings, flexibility, staff rotas, time spent with the client, the duration of re-ablment, handover to independent providers).
Staff attitude.
Staff training/supervision - Adequacy/appropriateness/timeliness of training available to front-line staff
External factors:
User/carer characteristics (attitude, understanding, motivation, household/living circumstances).
Access to specialist skills outside the team. (e.g. OTs/physios/district nurses/ expertise in visual impairment, dementia, mental health, learning disability) – (Explore if they have access and how easy is it to get access)

Home care re-ablement services: Investigating the longer-term impacts
194
Availability of aids and adaptations.
Access to local facilities, voluntary organisations and services (Explore if such services are available locally, do staff know about them, do relevant services have capacity to respond to referrals? Do staff refer people during/at the end of re-ablement?).
Capacity within the private/independent home care providers.
4. What factors perceived to constrain/limit the impact and/or duration of
the benefits of the re-ablement service in the shorter and longer-terms?
(Ask for actual examples (anonymous) to help illustrate points being made)
Possible prompts:
Internal factors (team/service/organisation):
Features of the re-ablement service (inappropriate referrals, skill mix of the staff, assessment, team meetings, staff rotas, time spent with the client, the duration of re-ablement, handover to independent providers)
Staff attitude
Staff training/supervision - Adequacy/appropriateness/timeliness of training available to front-line staff
External factors:
User/carer characteristics (attitude, understanding, motivation, household/living circumstances)
Lack of access to specialist skills outside the team. (e.g. OTs/physios/district nurses/ expertise in visual impairment, dementia, mental health, learning disability)
Availability of aids and adaptations
Access to local facilities and services
Capacity within the private/independent home care providers
(Note: If time allows find out about some evidence of success/failure,
e.g. changes in a client’s levels of functional ability, independence,
quality of life, risk of entering residential care, social life)
5. Finally, staff views on how the re-ablement service could be improved
Is there anything that you think would help YOU to achieve more for service users?
Ask each member to write down three (realistic) suggestions for how the service could be improved.
G.4 Data analysis
The data generated from the senior manager interviews, focus group discussions
and observation visits were analysed using the framework approach and by a

Appendix G The organisation and content of re-ablement services
195
process of data reduction, data display, and conclusion drawing and verifying (Miles
and Huberman, 1994). The data were summarised onto a series of charts according
to analytical categories (both a priori and emergent themes) generated by the
researchers based on their readings of a sample of transcripts. The charts did not
contain verbatim text but rather a synthesis accompanied by a reference to where it
could be found in a transcript or the researcher‟s observation notes. Data were
entered on the charts so that reading across a chart provided information about a
particular site, while reading down a chart allowed comparisons to be made across
the sample. The charts were used to identify overarching themes and draw
conclusions. Conclusions were verified by checking with transcripts and through
discussions within the research team.


197
Appendix H Interviews with re-ablement service users
and informal carers
This appendix focuses on the interviews with re-ablement service users and carers
which aimed to elicit their views and experiences on re-ablement services.
We wanted to explore the views of service users and carers who had just finished or
just coming to the end of their re-ablement period. However, as time constraints had
made it impossible to conduct the interviews immediately after the re-ablement
intervention with users and carers who had been recruited to the main part of the
study, we recruited additional re-ablement service users and carers to take part in
these interviews, that is, people in the study sites who had recently used re-ablement
services but who were not part of the cohort.
H.1 Interviews with re-ablement service users
Recruitment for the semi-structured qualitative interviews with re-ablement service
users and informal carers began in February 2010 when letters were sent out to the
sites requesting their support in identifying potential participants to take part in this
component of the study. It was intended that interviews would be started in March
and completed at the end of April. Delays occurred as revised ethics approval had to
be obtained due to a slight change in the interviewing strategy. This resulted in a
reduction in the number of participants we intended to recruit. The sample size of
service users from each site was reduced from an initial target of ten to between five
and seven service users and one and three carers. Sites were initially approached in
February, advising them of research intentions, providing each team with a clear
outline of the sample we aimed to recruit. Requests were made for service users to
be recruited according to two main criteria: service users from differing referral routes
and people who had received over four weeks of re-ablement. In addition, the re-
ablement teams were asked to make their sample as diverse as possible using
subsidiary criteria to recruit older and younger service users, men and women, ethnic
background, household composition and health conditions.
The sites were approached again at the beginning of April and recruitment began.
Interviewing started in the third week of April. Due to delays in recruiting potential
study participants, recruitment was on-going until mid-June.
Several difficulties occurred in the recruitment process. These included delays in the
identification of participants from two sites and the need to seek replacements for
service users whose interviews were cancelled. Reasons for this included illness
experienced on the day of interview, hospitalisation or the service users changing
their mind about taking part in the study. R1 reported problems in finding suitable
service users. In this and three other sites, where several people had withdrawn with

Home care re-ablement services: Investigating the longer-term impacts
198
no notice, some service users were recruited very quickly and interviewed soon after
consent had been obtained from them. The majority of service users were
interviewed when they were approximately four weeks into re-ablement. However, a
few interviews took place at earlier or later stages, or just after re-ablement had
finished, due to factors such as rescheduled or replacement interviews and changes
in service users' health.
Initially, it was intended that carers would be interviewed on separate visits to sites,
after seeking permission at the service users‟ interviews on the first visit. This
strategy was revised for a number of reasons. Most importantly, there was a need to
limit the number of visits to each site and service users usually expressed a desire to
have both interviews on the same day.
The majority of service users were interviewed alone. The need to hear only service
user‟s opinions was emphasised and where carers spoke it was usually to facilitate
better communication (where there were any impairment or language-related
difficulties) or to help with sudden needs for personal care. The presence of the
carers was necessary in seven cases. However, on three occasions carers
attempted to answer a question which was directed to the service user. When this
occurred, the carer was asked if they could give their opinion afterwards.
Three pilot interviews were undertaken to test the topic guides (two service users and
one carer). These interviews were used and analysed with the other interview
transcripts as changes to the topic guides were minor.
Topic guide for interviews with re-ablement service users
Brief introduction to the project
Brief reminder about the study: Social care services are developing home care
re-ablement services in order to restore people‟s ability to live independently, as
far as possible, for example, after an illness or accident. The idea is that
following a period of re-ablement, people will once again be able to do as much
as they can for themselves, rather than having to rely on others to do things for
them. As re-ablement services are new, it is important to find out what it is like
for people to receive re-ablement services. We want to know if and how these
services really do enable people to help themselves; what differences home
care re-ablement have made to people and what kinds of things seem to make
the re-ablement services work (or not). We are also interested in how their
carers are involved, and what they think of the service that has been provided
for the person they care for. The results of the study will be helpful in enabling
local councils to develop their future services.

Appendix H Interviews with re-ablement service users and informal carers
199
Confidentiality
We will not use your name in any reports of the research and it will not be known who
took part in this research. Everything you say during the interview will remain
confidential.
Consent form (or verbal consent)
Switch on the recorder
Background information
Verbal Consent (if applicable)
Recall
Q.1 Can I ask you to think back to when you were first referred to re-ablement?
Who referred you to social services/for home care and why?
Q2. What difficulties were you experiencing at the time? [probe for aspects of daily
living e.g. going up and down the steps, shopping, personal care]
Q3. Can you tell me about your situation just before re-ablement. Just before re-
ablement were you receiving care from health or other social care workers
(prompt OT, hospital, SW, intermediate care workers)?
How long had you been receiving this support?
Q4. Just before re-ablement were you getting any help from family members of
friends?
• How long had you been receiving help from them?
Expectations - before / at start of receiving re-ablement
Q5. When you started using the re-ablement service, did you feel you had a good
understanding of what you were being offered? What you were told about it?
Did you have a clear idea what would be expected of you?
Q6. Did you think what they offered you differed from your expectations of re-
ablement or from services experienced before (if previous home care service
user)?
Q7. Did you think what you were offered was what you needed?
[probe for any doubts, expectations and resistance]
If not, what did you want the re-ablement services/workers to provide or help you with?

Home care re-ablement services: Investigating the longer-term impacts
200
Q8. How did you think that re-ablement services might affect anyone else who has
been, or is, caring for you? Probe for relatives involved in care
Experiences
[I would now like to ask you a few questions to find out more about the kind of service
you received].
Q9. Can you first of all tell me how you decided what the re-ablement service would
help you with?
o Did you feel that you had sufficient opportunities to say what you wanted re-ablement to help you with?
o Was your informal carer (if any) or anyone else involved in deciding what the re-ablement service would help you with?
Q10. What did re-ablement help you with? Possible probes:
help you how to do things for yourself Personal care (e.g. dressing, toileting, bathing) Practical skills (e.g. shopping, cooking, cleaning)
talk to you to help you get your confidence back
give you emotional support
give you information and advice
increase your social contacts/ not to feel lonely
help you to manage your health (medication, pain, depression)
make you feel safer
help you in providing support for other people
Other
Q11. What happened during the visits? Possible probes:
What kind of help were you given? What did they do? What did they encourage or expect you to do?
How did this change during the period of re-ablement?
Who decided what was to happen? How did you feel about it? [Probe for any opportunities for involvement in changes]
Did the type of help given in the visits change over (the re-ablement) time ? Can you tell me how they changed for yourself and anyone who usually cares for you?
[Probe for balance between being encouraged to do things for self and home
carers assistance then for changes in this balance during the period of re-
ablement]
Q12. Can you tell me how many visits you had each day or week?
How long were the visits? [ Probe for any benefit from longer or shorter visits]

Appendix H Interviews with re-ablement service users and informal carers
201
Were there any differences in the ways the re-ablement workers helped you?
How do you feel about the ways that the re-ablement workers worked together to support you? [Probe for information sharing/communication]
Q13. Did you receive any equipment in the process of re-ablement?
Has the equipment been helpful?
Was this provided at a useful time?
Did you experience any difficulties (e.g. delays) in getting or using your equipment?
Q14. Did you have to pay for the re-ablement service?
How do you feel about it?
Thinking about the service ending
Q15. How do you feel about coming to the end of re-ablement?
Do you feel you have had the service for long enough?
Would you have wanted it to go on for longer?
How much longer?
How do you think that would have helped you?
Q16. Have you had any assessment of the help you need before the re-ablement
period ended? (If yes) who was involved in it?
Q17. What was decided?
o No further support needed o Referred on to other services. What? o Put in touch with community activities (e.g. lunch clubs)
Q18. How did you feel about the decision? Do you have any concerns about the
way the service ended? Explain.
Q19. What other support did you receive/are expecting to receive at discharge from
re-ablement? How do you feel about it?
o information/advice/signposting?
Thinking about the benefits home care re-ablement support has made to your
life
Q20. What, if any, differences do you feel the re-ablement service has made to your
life? Has it had any impact on:
Possible probes:
Doing activities you want to do (including personal care, shopping, cooking, cleaning)

Home care re-ablement services: Investigating the longer-term impacts
202
Feeling in control of your daily life (doing things when you want to do them)
Feeling safe and secure
keeping your home clean and comfortable
making home more accessible
Social contacts/socialise
Caring for others
Managing own health
Feeling better about yourself/the quality of your life
Q21. Do you feel more able to do things independently? What? How has this
changed (if at all) and how do you feel about this?
Q22 (If applicable) Earlier on you said you had some help from [x and y/other people]
before you started the re-ablement. Since you started re-ablement has that
support changed at all? How? How do you feel about it?
Do you think re-ablement has had any benefits or difficulties for them?
Q23. What elements of the re-ablement service do you feel have been most helpful
for you? Why? [Explore the greatest benefits]
Possible probes:
Access to specialised equipment
Access to information
Access to specialised staff
Teaching you the skills to do things for yourself
Staff being supportive/encouraging (i.e. having faith in your ability to do things)
Carers‟ attitude/input
Having control over the goals / how to achieve them
Flexibility in duration of support
Intensity of contact with staff
contacts made with community organisations
continuity of support during/after re-ablement
Q24. What elements of the re-ablement service do you feel have been least
helpful/not working for you? Explain.
Possible probes:
Access to specialised equipment
Access to information
Access to specialised staff
Teaching you the skills to do things for yourself
Staff attitude during re-ablement (Staff being supportive/encouraging/having faith in your ability to do things)
Carers‟ attitude/input
Having control over the goals / how to achieve them

Appendix H Interviews with re-ablement service users and informal carers
203
Flexibility in duration of support
intensity of contact/ frequency of contact
contacts made with community organisations
Discontinuity of support during/after re-ablement
Q25. Are there any changes that you think could be made to the re-ablement
service which would have helped you to benefit more from the service?
Possible probes:
Possible probes:
Access to specialised equipment
Access to information
Access to specialised staff
Teaching you the skills to do things for yourself
Staff attitude during re-ablement (Staff being supportive/encouraging/having faith in your ability to do things)
Carers‟ attitude/input
Having control over the goals / how to achieve them
Flexibility in duration of support
intensity of contact/ frequency of contact
contacts made with community organisations
continuity/discontinuity of support during/after re-ablement
Home care / agency staff attitudes once re-ablement finished
Any other?
Outstanding unmet needs
Q26. Overall how much do you think the re-ablement service has helped you? How
do you feel about the way the service helped out?
Possible probes:
Was there any help you would have liked to have but you did not get? Why could you not get this help?
Do you have any fears about doing things for yourself? How did you find re-ablement? Helpful, upsetting, difficult,
pointless, empowering, meeting your hope and aspirations? Please explain.
Thank you very much for your time and taking part in this interview.
H.2 Interviews with informal carers of re-ablement service users
In total, ten carers of service users who had taken part in the interviews described
above were interviewed in all five re-ablement sites. Nine of the ten carers were the
spouses of service users, and the tenth person was the daughter of a service user.
All interviews were recorded with the participants‟ consent and transcribed in full.

Home care re-ablement services: Investigating the longer-term impacts
204
Service users were sometimes present during these interviews but this was avoided
whenever possible.
Matching the approach taken towards the service user interviews, themes were
generated from the interviews with service managers, focus group discussions with
front-line staff and observations of re-ablement activities conducted at earlier stages
of this research. These interviews sought to explore informal carers‟ experiences of
helping service users and the impact of home care re-ablement service on their role.
The topic guide focused on the following areas: carers‟ experiences of caring before
and during re-ablement, carers‟ expectations – before/at start of re-ablement; their
involvement in the re-ablement process; how carers perceived their future role in
helping the service user. Additional concerns addressed included the impact of re-
ablement on relationships between carers and service users, and recommendations
for improvement. Interviews with carers tended to last between half an hour and an
hour.
Topic guide for interviews with informal carers
Brief introduction to the project
Brief reminder about the study: Social care services are developing home care
re-ablement services in order to restore people‟s ability to live independently, as
far as possible, for example, after an illness or accident. The idea is that
following a period of re-ablement, people will once again be able to do as much
as they can for themselves, rather than having to rely on others to do things for
them. As re-ablement services are new, it is important to find out what it is like
for people to receive re-ablement services. We want to know if and how these
services really do enable people to help themselves; what differences home
care re-ablement have made to people and what kinds of things seem to make
the re-ablement services work (or not). We are also interested in how their
carers are involved, and what they think of the service that has been provided
for the person they care for. The results of the study will be helpful in enabling
local councils to develop their future services.
Confidentiality
We will not use your name in any reports of the research and it will not be known who
took part in this research. Everything you say during the interview will remain
confidential.
i) Have you seen the Information Sheet sent about this project?
If no, offer the Information sheet for immediate reading or offer to read through

Appendix H Interviews with re-ablement service users and informal carers
205
ii) Do you have any questions about the research or the interview?
Consent form
Switch on the recorder
Socio-demographic information
Service user/carer relationship
History of caring role (previous experience)
Age
Ethnicity: White British/other
Gender: Male/femaler
Background information
Q1. Please can you tell me what you know about the homecare services that the
person you are caring for receives at the moment?
Q2. What were your initial understandings and expectations of re-ablement
(homecare services) for:
the person you care for
Your role as carer
Did you expect re-ablement services to have any impact on the care you provide?
Q3. Prior to using the re-ablement service, how were you involved in supporting the
service user? What did you help them with? Probe for:
personal care,
practical assistance,
medical management/tasks
emotional support,
information and advice,
organising support/contacting /visits with professionals,
getting equipment,
social, leisure
caring for others
Q3. How long have you supported the service user for?
Q4 How many hours a week did you spend on caring before re-ablement services
started?
Q5. Did anyone else provide care before the start of re-ablement (friends, family
members, etcetera) What did they do?

Home care re-ablement services: Investigating the longer-term impacts
206
Expectations - before / at start of re-ablement
Q6. When the service user started using the re-ablement service, did you feel you
had a good understanding of the service?
How did you think it may affect you? How did you feel about that?
What were you were told about it? Did you expect or get any help from the re-ablement workers?
Involvement with the re-ablement workers
[I would now like to ask you a few questions about your involvement with the re-
ablement process]
Q7. Can you tell me more about your on-going involvement (if any) in the planning
and delivering of re-ablement to the service user?Q8. Did you feel that you have had
sufficient opportunities to say what you wanted rto do in supporting the service user
and yourself? Prompt:
At the start
During the process of re-ablement
Q9. How did the re-ablement worker(s) involve you in re-ablement? Probe for:
support of independent living for the service user
your own support needs
Q10.Please can you give me an example of how the re-ablement worker involved
you in the re-ablement process?
Q11.Did your involvement change during the course of re-ablement ? How?
Q12. How did the re-ablement worker(s) help you carry out your caring role? Probe
for:
Advice and information given to the service user or yourself, for their re-ablement
Safeguarding the service user/Risk avoidance strategies
Overcoming any fears and doubts about re-ablement, for the service user or yourself
Help in changing your role and teaching you new skills or approaches to care (e.g. promoting independence rather than caring for the service user
Signposting access to knowledge to enhance your work or career (e.g. training, resources etc)
Managing changes in service users needs and caring role
How did you feel about the help provided by the re-ablement workers to assist you in your caring role?

Appendix H Interviews with re-ablement service users and informal carers
207
Experiences of caring during re-ablement
Q13. Did you think re-ablement services differ from what you were expecting/had
experienced from services before (*if caring for previous home care service user)?
Q15. Please can you tell me what the re-ablement users did to help the service user
and how they did it?
Did you think that the service user received what they needed from re-ablement?
Did you have any worries or disappointment about what was being provided for the
service user or yourself (Explain)
Probe for receipt of equipment – how timely? How useful?
Q16. Can you tell me about any help you received from the re-ablement worker for
yourself during this period? (if applicable)
Were there any changes in the support given from the re-ablement worker? How?
Who decided what was to happen?
Q17. What happened during the visits? Possible probes:
Your role and support given during and after the visits
The activities of the service user
Q15 Did the visits change over (the re-ablement) time? Can you tell me how they changed for yourself and the service user?
[Probe for balance between re-ablement service user being encouraged to do things
for self with or without your support and doing things directly for the service user then
for changes in this balance changed during the period of re-ablement]
Q18. Can you tell me about how re-ablement has affected your caring duties?
Possible probes:
changes in time spent as a carer (e.g. reduction)
greater self- reliance and confidence for service user Personal care (e.g. dressing, toileting, bathing) Practical skills (e.g. shopping, cooking, cleaning)
give you emotional support
give you information and advice
reduce/increase any emotional aspects of your work
role in health management
made service user safer, or increase risks and possible workload?
Other
Q19. Has re-ablement changed the ways that you (and the service user) get things
done on a daily basis? (How?)

Home care re-ablement services: Investigating the longer-term impacts
208
How do you feel about these changes and your new role (if it has changed?
Q20. Overall, how do you think that re-ablement services have affected your role as
carer?
Reduction (or expansion) of caring role [probe for changes in hours]
Has it helped you? How?
Have any difficulties been created for you by the service?
Is there anything you wanted from the services that you are not getting? Or any benefits you didn‟t expect?
Do you have any fears about the service user doing things for themselves
Thinking about the service ending
Q21. How do you feel about the re-ablement service coming to an end?
Do you feel the service user has had the service for long enough?
Do you have any concerns about the way the service ended? Explain.
Q22. Do you feel service user is now more independent/able to do things for self, as
result of re-ablement?
Do you feel more equipped to give them care which supports greater independence
and their needs? Please explain how. [Possible probes- levels of confidence/esteem,
fear and knowledge]
Q23. How do you perceive your caring role in the service user‟s future
Practical help and personal care
Involvement with other services. How?
Involvement in other activities, e.g. social.
Thinking about the benefits home care re-ablement support has made to your
role
Q24. What, if any, differences do you feel having this support has made to
your caring role? Has it had any impact on:
Possible probes:
Your attitude to the service user
Your skills as a carer
The value of your caring work
Making your caring role easier or more difficult, more or less enjoyable
Your future employment needs
Other
Q25. What elements of re-ablement service do you feel have been helpful for you?
Why? [Explore the greatest benefits]

Appendix H Interviews with re-ablement service users and informal carers
209
Possible probes:
Access to specialised equipment
Access to information
Access to specialised staff
Teaching you the skills to enhance your caring role
Staff providing a wider support network
Service user‟s attitude
Continuity of support during/after re-ablement
Q26. What elements of re-ablement service do you feel have been least helpful?
Explain.
Possible probes:
Access to specialised equipment
Access to information
Access to specialised staff
Staff attitudes during re-ablement (Staff being
supportive/encouraging towards your caring role
flexibility in duration of support
intensity of contact/ frequency of contact
contacts made with community organisations discontinuity of support for caring during/after re-
ablement
Q27. Are there any improvements that you think could be made to re-ablement
which would help benefit you or other carers more?
Possible probes:
Possible probes:
teaching you new approaches and skills
re-ablement staff attitudes to you during re-ablement
having involvement in re-ablement goals/how to achieve them
flexibility in duration of support
intensity of contact/ frequency of contact
continuity/discontinuity of support during/after re-ablement Any other?
Overall views
Q28. How do you feel that re-ablement affected you caring role overall?
Do you have any additional concerns about re-ablement?
Do you have any suggestions about how re-ablement services can be improved?
Thank you very much for your time and taking part in this interview.

Home care re-ablement services: Investigating the longer-term impacts
210
H.3 Data analysis
The data generated from the interviews with service users and carers was analysed
using a process of data reduction, data display, and conclusion drawing and verifying
(Miles and Huberman, 1994). It was summarised into whole interview summaries and
thematic summaries according to analytical categories (both a priori and emergent
themes) generated by the researcher, based on iterative readings of the transcripts.
A priori themes were identified in earlier stages of the research and emergent themes
were those which were added arising from pilot interviews and new findings.
This slightly different approach to analysis through interview and thematic summaries
allowed for examination of interview themes in their entirety, capturing important
subjective issues. It illuminated ambivalence or contradiction and permitted greater
comparison between service users‟ and corresponding carers‟ accounts. Thematic
summaries contain a synthesis of relevant discussion and minor amounts of verbatim
comments, referenced to where they could be found in a transcript or the
researcher‟s observation notes. These were cross referenced with other transcripts
where appropriate, allowing for comparisons to be made across the sample. The
summaries were used together for intra-case and cross-case analysis, to identify
overarching themes and factors and factors contributing to individual variations in
experience. Conclusions were then drawn and verified by checking with transcripts
and other members of the research team.
H.4 Confidentiality
All participants were given guarantees of confidentiality and anonymity. Primary
issues of confidentiality pertaining to the relationship between the service user and
the carer were addressed by obtaining the service user‟s signed or verbal consent to
approach their carer, explaining why we wanted their opinions to be provided
separately. Where possible this was obtained before returning to interview the carer
later. Time and organisational constraints resulted in some service users and carers
being interviewed consecutively on the same visit, following the same procedure of
consent. Service users and carers who were together at the time of interview were
advised that there might be questions which they could choose to answer
confidentially and that the researcher would make efforts to provide these
opportunities after the interview. Care was taken to frame questions in an appropriate
manner and all interview questions received responses. However, on three
occasions carers revealed more about their own particular needs (e.g. for respite)
when the service user was in another room.

211
Appendix I Supplementary outcome data
This appendix has two sections. The first summarises differences in outcomes
between baseline and immediately post-re-ablement for the re-ablement group only.
The data are presented in more detail in the interim report (see Jones et al., 2009).
The data presented here are in addition to those in Chapter 6 which compare
outcomes between baseline and 12 month follow-up for the re-ablement and
comparison groups.
The second section presents tables showing factors associated with outcomes at
baseline and 12 month follow-up. The results presented in these tables are
summarised in the text of Chapter 6.
I.1 The impact of re-ablement on outcomes immediately post-re-
ablement
Outcomes are measured in four ways: perceived health; perceived quality of life;
health-related quality of life; and social care outcomes. For each measure, the level
of outcome, direction of change and mean score is shown. Results are shown only
for participants who completed both a baseline (T1) and post-re-ablement (T1+R)
questionnaire.
I.1.1 Perceived health
Table I.1 gives levels of perceived health at baseline and immediately after re-
ablement. Perceived health ranges from very good to very bad. A higher percentage
of people at post-re-ablement compared to baseline perceived their health to be
good or very good than bad or very bad. Statistical significance is not presented due
to small numbers in some categories rendering these tests unreliable.
Table I.1 Perceived health at baseline and post-re-ablement
Baseline Post-re-ablement
(n=447) Per cent (n) Per cent (n)
Very good 7 (33) 8 (36)
Good 23 (102) 29 (129)
Fair 46 (207) 45 (202)
Bad 18 (79) 14 (64)
Very bad 6 (26) 5 (21)

Home care re-ablement services: Investigating the longer-term impacts
212
Table I.2 shows the direction of change in perceived health. More people felt their
health had improved immediately post-re-ablement than felt it had declined.
Table I.2 Direction of change in perceived health from baseline to post-re-ablement
(n=447) Per cent (n)
Perceived health improved 30 (133)
Remained the same 51 (228)
Perceived health declined 19 (86)
Perceived health can also be presented as an overall score. Possible scores range
from one to five. A higher score indicates better perceived health. There was a small
but statistically significant improvement in the mean score for perceived health
between baseline (mean 3.08 (sd 0.96)) and immediately post-re-ablement (mean
3.22 (sd 0.93); p<0.01).
I.1.2 Perceived quality of life
Table I.3 gives people‟s perceived quality of life at baseline and immediately after re-
ablement. This is measured as „so good it could not be better‟ to „so bad it could not
be worse‟. Fifty one per cent perceived their quality of life to be good or better
immediately after re-ablement compared to 42 per cent at baseline. Small numbers
in some categories render statistical tests unreliable and so statistical significance is
not presented.
Table I.3 Perceived quality of life at baseline and post-re-ablement
Baseline Post-re-ablement
(n=435) % (n) % (n)
So good it could not be better 1 (4) 1 (5)
Very good 15 (65) 16 (69)
Good 26 (114) 34 (149)
Alright 42 (181) 36 (161)
Bad 12 (51) 9 (38)
Very bad 3 (13) 3 (14)
So bad it could not be worse 2 (7) 2 (8)
Table I.4 shows whether people in the re-ablement group perceived their quality of
life to have improved, stayed the same or declined between baseline and
immediately post-re-ablement. About half stayed the same and a third improved.

Appendix I Supplementary outcome data
213
Table I.4 Direction of change in perceived quality of life from baseline to post-re-ablement
(n=435) % (n)
Perceived quality of life improved 31 (134)
Remained the same 48 (208)
Perceived quality of life declined 21 (93)
When presented as an overall score, perceived quality of life has a possible range
from one to seven. A higher score indicates better perceived quality of life. There
was no change in the mean perceived quality of life score between baseline (mean
4.36, sd 1.09) and immediately post-re-ablement (mean 4.48, sd 1.10).
I.1.3 Health-related quality of life (EQ-5D)
Table I.5 gives the five dimensions of health-related quality of life and people‟s
general health compared to 12 months ago. Small numbers in some categories of
each domain render statistical tests unreliable and so statistical significance is not
presented. In general, the percentage of participants with no problems increased and
the percentage with extreme problems decreased in each domain between baseline
and post-re-ablement. The percentage of people who felt their general health today
was better than a year ago also increased.
Table I.5 Health-related quality of life at baseline and post-re-ablement
Baseline Post-re-ablement
% (n) % (n)
Mobility (n=447)
No problems 13 (57) 21 (93)
Some problems 85 (378) 77 (344)
Confined to bed 3 (12) 2 (10)
Self-care (n=447)
No problems 19 (83) 42 (189)
Some problems 68 (304) 43 (194)
Unable 13 (60) 14 (64)
Usual activities (n=448)
No problems 7 (31) 16 (70)
Some problems 45 (201) 47 (210)
Unable 48 (216) 38 (168)

Home care re-ablement services: Investigating the longer-term impacts
214
Baseline Post-re-ablement
% (n) % (n)
Pain/discomfort (n=440)
None 21 (91) 28 (123)
Moderate 60 (265) 60 (262)
Extreme 19 (84) 13 (55)
Anxiety/depression (n=450)
None 55 (249) 63 (284)
Moderate 39 (175) 31 (141)
Extreme 6 (26) 6 (25)
General health today (n=448)
Better than previous 12 months 8 (38) 21 (92)
Much the same 29 (130) 31 (137)
Worse than previous 12 months 63 (280) 49 (219)
Table I.6 shows whether health-related quality of life improved or declined between
baseline and immediately post-re-ablement. The figures indicate about a third of
people improved in their ability to self-care or to undertake usual activities. However,
a third perceived their general health compared to a year ago to be worse than at
baseline and a quarter had more problems with pain and discomfort immediately
after re-ablement. The majority (81 per cent) had no change in their mobility.
Table I.6 Direction of change in health-related quality of life from baseline to post-re-ablement
% (n)
Mobility (n=447)
Fewer problems after re-ablement 14 (62)
No change after re-ablement 81 (361)
More problems after re-ablement 5 (24)
Self-care (n=447)
Fewer problems after re-ablement 31 (140)
No change after re-ablement 59 (262)
More problems after re-ablement 10 (45)
Usual activities (n=448)
Fewer problems after re-ablement 28 (127)
No change after re-ablement 61 (272)
More problems after re-ablement 11 (49)

Appendix I Supplementary outcome data
215
% (n)
Pain/discomfort (n=440)
Fewer problems after re-ablement 13 (58)
No change after re-ablement 60 (265)
More problems after re-ablement 26 (117)
Anxiety/depression (n=450)
Fewer problems after re-ablement 20 (91)
No change after re-ablement 66 (297)
More problems after re-ablement 14 (62)
General health today (n=448)
Improved general health today 12 (52)
No change 58 (260)
Decline in general health today 30 (136)
Health-related quality of life can also be presented as an overall score. Scores can
range from less than zero to one. A higher score indicates a better health-related
quality of life. There was a statistically significant improvement in health-related
quality of life between baseline (mean 0.35, sd 0.30) and immediately post-re-
ablement (mean 0.46, sd 0.32, p<0.001).
I.1.4 Social care outcomes (ASCOT)
Table I.7 shows social care outcomes at baseline and post-re-ablement. Statistical
tests for differences between baseline and post-re-ablement were conducted on all
domains. Differences were statistically significant on all domains, but small numbers
render the tests on some domains unreliable. Statistical significance is therefore
shown only for domains with sufficiently large numbers in all categories of response.
In general, the table shows an improvement in social care outcomes on all domains
between baseline and immediately post-re-ablement.

Home care re-ablement services: Investigating the longer-term impacts
216
Table I.7 Social care outcomes at baseline and post-re-ablement
Baseline Post-re-ablement
% (n) % (n)
Control over daily life (n=453)
No needs 43 (193) 54 (244)
Low needs 45 (206) 34 (155)
High needs 12 (54) 12 (54)
Personal care/comfort (n=451)
No needs 81 (367) 92 (417)
Low needs 16 (73) 7 (30)
High needs 2 (11) 1 (4)
Meals and nutrition (n=452)
No needs 77 (348) 87 (395)
Low needs 18 (83) 12 (53)
High needs 5 (21) 1 (4)
Safety (n=451)
No needs 64 (290) 80 (361)
Low needs 33 (148) 19 (86)
High needs 3 (14) 1 (5)
Social situation and relationships (n=451)***
No needs 48 (216) 52 (233)
Low needs 41 (185) 37 (167)
High needs 11 (50) 11 (51)
Usual activities (n=451)***
No needs 16 (70) 20 (90)
Low needs 30 (134) 32 (143)
High needs 55 (247) 48 (218)
Accommodation cleanliness/comfort (n=448)
No needs 85 (382) 88 (396)
Low needs 13 (57) 10 (47)
High needs 2 (9) 1 (5)

Appendix I Supplementary outcome data
217
Baseline Post-re-ablement
% (n) % (n)
Worries and concerns (n=451)***
No needs 36 (164) 42 (190)
Low needs 53 (240) 49 (221)
High needs 10 (47) 9 (40)
Dignity and respect (n=448)
No needs 92 (413) 96 (430)
Low needs 8 (35) 4 (17)
High needs 0 (0) 0 (1)
***p<0.001
Table I.8 shows whether participants‟ levels of social care needs decreased, stayed
the same or increased between baseline and post-re-ablement. The biggest
decreases in need were achieved for control over daily life, usual activities, and
worries and concerns, with 25 per cent having a lower level of need post-re-
ablement than at baseline on each domain. However, these three domains, along
with social situation and relationships, also showed the biggest percentage increases
in levels of need, with increases ranging from 15 to 19 per cent. There was little
change in cleanliness and comfort of accommodation, or dignity and respect, with
over 85 per cent in each remaining unchanged.

Home care re-ablement services: Investigating the longer-term impacts
218
Table I.8 Direction of change in social care outcomes between baseline and post-re-ablement
% (n)
Control over daily life (n=453)
Lower level of need at post-re-ablement 25 (113)
Same level of need at post-re-ablement 60 (274)
Higher level of need at post-re-ablement 15 (66)
Personal care/comfort (n=451)
Lower level of need at post-re-ablement 14 (63)
Same level of need at post-re-ablement 83 (375)
Higher level of need at post-re-ablement 3 (13)
Meals and nutrition (n=452)
Lower level of need at post-re-ablement 17 (77)
Same level of need at post-re-ablement 77 (348)
Higher level of need at post-re-ablement 6 (27)
Safety (n=452)
Lower level of need at post-re-ablement 23 (102)
Same level of need at post-re-ablement 70 (318)
Higher level of need at post-re-ablement 7 (32)
Social situation and relationships (n=451)
Lower level of need at post-re-ablement 23 (103)
Same level of need at post-re-ablement 58 (261)
Higher level of need at post-re-ablement 19 (87)
Usual activities (n=451)
Lower level of need at post-re-ablement 25 (111)
Same level of need at post-re-ablement 59 (268)
Higher level of need at post-re-ablement 16 (72)
Accommodation cleanliness/comfort (n=448)
Lower level of need at post-re-ablement 9 (42)
Same level of need at post-re-ablement 85 (381)
Higher level of need at post-re-ablement 6 (25)
Worries and concerns (n=451)
Lower level of need at post-re-ablement 25 (114)
Same level of need at post-re-ablement 57 (256)
Higher level of need at post-re-ablement 18 (81)
Dignity and respect (n=448)
Lower level of need at post-re-ablement 6 (27)
Same level of need at post-re-ablement 92 (410)
Higher level of need at post-re-ablement 2 (11)

Appendix I Supplementary outcome data
219
Overall social care needs are calculated by applying a weight to the selected
attribute for each domain and summing to give an overall score. Full details are
given in Appendix D. The highest ASCOT score was 1 and the lowest was 0.29.
For the follow-up ASCOT score, highest score was 1 and the lowest was 0.35. A
higher score indicates a better outcome, that is, that social care needs are being
met. There was a statistically significant improvement in mean social care need
scores between baseline (mean 0.76, sd 0.15) and immediately post-re-ablement
(mean 0.82, sd 0.13; p<0.001).
I.1.5 Ways in which participants felt re-ablement services had helped
Table I.9 shows the percentage and number of participants who felt that re-ablement
services had helped them in each of a number of key activities. Participants were
asked these questions immediately post-re-ablement (T1+R). The data do not allow
comparisons to be made between pre- and post-re-ablement. The majority (82 per
cent) felt that re-ablement services had helped with personal care; four per cent felt
re-ablement services had helped with getting around the local area. The relatively
small percentages of re-ablement service users who felt that re-ablement services
had helped in ways such as spending time with people they wanted to be with and
doing activities they wanted to do, correspond with service users‟ beliefs that these
types of activities were outside the remit of re-ablement services (reported in
Chapter 5).
Table I.9 Ways in which re-ablement services helped
Per cent Number
(n=454)
Personal care 82 374
Feeling safe and secure 45 204
To feel in control over daily life 41 182
Meals 33 151
Feeling free from worry and concerns 27 124
Making my home easier to get around and manage 20 92
Taking medicines 18 83
Spending time with people I want to be with 15 68
Keeping my home clean and comfortable 13 57
Doing activities I want to do 10 47
Getting around my local area 4 16

Home care re-ablement services: Investigating the longer-term impacts
220
I.2 Factors independently associated with outcomes at baseline
and 12 month follow-up
This section presents tables showing mean scores for each outcome measure by
sample characteristics such as age or gender, and by dependency. Each
characteristic or measure of dependency is treated independently of all others. For
many of the characteristics, the sample sizes are unequal and in some cases quite
small. Therefore differences that appear to be statistically significant should be
treated with caution. Summaries of these tables are given in the text of Chapter 6.
I.2.1 Perceived health
Tables I.10 and I.11 present mean scores for perceived health, by sample
characteristics such as age or gender and by dependency, at baseline and 12 month
follow-up respectively. The results suggest that better perceived level of health at
baseline in both re-ablement and comparison groups was associated with being over
65 years of age, female, living alone, not having an informal carer within the same
household, and having a lower FACS level. In the re-ablement group only, perceived
level of health at baseline was positively associated with being White British or Irish
and being a home owner.

Appendix I Supplementary outcome data
221
Table I.10 Perceived health by sample characteristics and dependency at baseline
Re-ablement Comparison
Mean (n, sd) Mean (n, sd)
Age
Under 65 years 2.70 (43, 1.12)* 2.61 (28, 0.88)*
Over 65 years 3.12 (583, 0.93) 3.02 (328, 0.92)
Gender
Male 2.98 (184, 0.95)* 2.84 (112, 0.90)*
Female 3.18 (541, 0.97) 3.06 (247, 0.92)
Ethnicity
White British or Irish 3.17 (579, 0.96)*** 2.98 (325, 0.93)
Other 2.53 (51, 0.90) 3.12 (33, 0.78)
Lives alone
No 2.96 (204, 1.01)** 2.78 (127, 0.90)**
Yes 3.19 (435, 0.95) 3.11 (233, 0.91)
Owner occupier
No 3.03 (229, 0.97)* 2.93 (177, 0.90)
Yes 3.24 (352, 1.00) 3.06 (182, 0.94)
Informal carer in same household
No 3.18 (469, 0.97)* 3.08 (250, 0.92)**
Yes 2.95 (171, 0.99) 2.80 (105, 0.90)
Informal carer in another household
No 3.03 (230, 0.99) 2.94 (131, 0.91)
Yes 3.17 (410, 0.97) 3.03 (224, 0.93)
FACS level
Critical or substantial 3.01 (115, 1.02)* 2.9 (251, 0.89)***
Moderate or low 3.24 (197, 0.91) 3.35 (75, 0.83)
*p<0.05; **p<0.01; ***p<0.001

Home care re-ablement services: Investigating the longer-term impacts
222
Results presented in Table I.11 suggest that perceived health at 12 month follow-up
was statistically significantly positively associated only with older age and only in the
comparison group.
Table I.11 Perceived health by sample characteristics and dependency at follow-up
Re-ablement Comparison
Mean (n, sd) Mean (n, sd)
Age
Under 65 years 2.47 (15, 1.25) 2.25 (8, 0.89)*
Over 65 years 2.98 (215, 0.06) 3.00 (131, 1.04)
Gender
Male 2.81 (63, 0.88) 2.88 (43, 0.91)
Female 2.98 (170, 0.97) 2.99 (97, 1.09)
Ethnicity
White British or Irish 2.91 (227, 0.93) 2.92 (129, 1.05)
Other 3.14 (7, 1.35) 3.36 (11, 0.81)
Lives alone
No 2.88 (80, 0.99) 2.90 (40, 0.87)
Yes 2.93 (161, 0.93) 2.98 (100, 1.10)
Owner occupier
No 2.89 (76, 1.01) 3.03 (61, 0.87)
Yes 2.92 (165, 0.92) 2.90 (79, 1.15)
Informal carer in same household
No 2.98 (170, 0.95) 2.97 (102, 1.09)
Yes 2.75 (71, 0.92) 2.92 (38, 0.88)
Informal carer in another household
No 2.99 (107, 1.03) 2.83 (64, 1.00)
Yes 2.85 (134, 0.87) 3.07 (76, 1.06)
*p<0.05

Appendix I Supplementary outcome data
223
I.2.2 Perceived quality of life
Tables I.12 and I.13 present mean scores for perceived quality of life by sample
characteristics and dependency, at baseline and 12 month follow-up respectively.
The results presented in Table I.12 suggest that perceived quality of life at baseline
in both re-ablement and comparison groups was statistically significantly associated
with gender, whether or not the participant lived alone, and whether they had an
informal carer. Older age and having a lower FACS level were associated with better
perceived quality of life for the comparison group only.
Table I.12 Perceived quality of life by sample characteristics and dependency at baseline
Re-ablement Comparison
Mean (n, sd) Mean (n, sd)
Age
Under 65 years 4.24 (42, 1.25) 3.52 (23, 1.08)**
Over 65 years 4.42 (577, 1.10) 4.31 (312, 1.14)
Gender
Male 4.19 (181, 1.14)** 4.06 (107, 1.14)*
Female 4.48 (447, 1.13) 4.36 (232, 1.14)
Ethnicity
White British or Irish 4.39 (573, 1.13) 4.27 (308, 1.14)
Other 4.33 (49, 1.30) 4.21 (29, 1.24)
Lives alone
No 4.25 (203, 1.14)* 4.03 (121, 1.17)**
Yes 4.45 (429, 1.13) 4.40 (218, 1.11)
Owner occupier
No 4.43 (226, 1.18) 4.29 (164, 1.18)
Yes 4.30 (351, 1.12) 4.24 (174, 1.10)
Informal carer in same household
No 4.45 (464, 1.12)* 4.35 (236, 1.13)*
Yes 4.24 (169, 1.18) 4.06 (98, 1.18)
Informal carer in another household
No 4.26 (228, 1.17)* 4.03 (123, 1.16)**
Yes 4.47 (405, 1.12) 4.40 (211, 1.13)
FACS level
Critical or substantial 4.63 (112, 1.07) 4.15 (233, 1.16)***
Moderate or low 4.42 (195, 0.95) 4.71 (75, 0.90)
*p<0.05; **p<0.01; ***p<0.001

Home care re-ablement services: Investigating the longer-term impacts
224
Table I.13 shows that age group was the only characteristic associated with
perceived quality of life at the time of 12 month follow-up. The differences in the
mean scores for perceived quality of life were statistically significant in both groups,
but the sample sizes for those participants aged under 65 years were particularly
small; the results should therefore be treated with caution.
Table I.13 Perceived quality of life by sample characteristics and dependency at follow-up
Re-ablement Comparison
Mean (n, sd) Mean (n, sd)
Age
Under 65 years 3.73 (15, 1.28)* 2.78 (9, 1.40)***
Over 65 years 4.42 (214, 1.07) 4.14 (131, 1.05)
Gender
Male 4.31 (62, 1.11) 4.04 (43, 0.95)
Female 4.39 (170, 1.08) 4.04 (98, 1.19)
Ethnicity
White British or Irish 4.35 (226, 1.09) 4.01 (129, 1.12)
Other 4.29 (7, 1.11) 4.33 (12, 1.15)
Lives alone
No 4.30 (80, 1.12) 4.03 (40, 1.14)
Yes 4.38 (160, 1.08) 4.05 (101, 1.12)
Owner occupier
No 4.39 (75, 1.14) 4.08 (62, 1.09)
Yes 4.34 (165, 1.07) 4.01 (79, 1.09)
Informal carer in same household
No 4.44 (169, 1.07) 4.01 (103, 1.18)
Yes 4.15 (71, 1.12) 4.13 (38, 0.93)
Informal carer in another household
No 4.42 (106, 1.09) 3.95 (65, 1.10)
Yes 4.31 (134, 1.09) 4.12 (76, 1.14)
*p<0.05; **p<0.01; ***p<0.001

Appendix I Supplementary outcome data
225
I.2.3 Health-related quality of life (EQ-5D)
Tables I.14 and I.15 present mean scores for health-related quality of life by sample
characteristics and dependency, at baseline and 12 month follow-up respectively.
Table I.14 shows that being older, living alone, and having a lower FACS level were
each independently associated with health-related quality of life at baseline in both
the re-ablement and comparison group. Being White British or Irish and having an
informal carer from another household were both positively associated with health-
related quality of life in the re-ablement group alone; having an informal carer living
in the same household was negatively associated with health-related quality of life in
the comparison group alone.
Table I.14 Health-related quality of life by sample characteristics and dependency at baseline
Re-ablement Comparison
Mean (n, sd) Mean (n, sd)
Age
Under 65 years 0.14 (41, 0.31)*** 0.09 (28, 0.41)**
Over 65 years 0.37 (563, 0.29) 0.32 (323, 0.35)
Gender
Male 0.33 (177, 0.29) 0.30 (112, 0.36)
Female 0.35 (437, 0.30) 0.30 (242, 0.36)
Ethnicity
White British or Irish 0.36 (561, 0.30)*** 0.30 (320, 0.36)
Other 0.19 (48, 0.26) 0.35 (33, 0.35)
Lives alone
No 0.29 (197, 0.30)** 0.19 (124, 0.33)***
Yes 0.37 (420, 0.30) 0.36 (231, 0.36)
Owner occupier
No 0.34 (224, 0.30) 0.34 (175, 0.36)
Yes 0.36 (339, 0.30) 0.27 (179, 0.36)
Informal carer in same household
No 0.36 (455, 0.30) 0.36 (245, 0.36)***
Yes 0.31 (163, 0.28) 0.16 (105, 0.33)

Home care re-ablement services: Investigating the longer-term impacts
226
Re-ablement Comparison
Mean (n, sd) Mean (n, sd)
Informal carer in another household
No 0.31 (218, 0.29)* 0.25 (131, 0.38)
Yes 0.37 (400, 0.30) 0.33 (219, 0.35)
FACS level
Critical or substantial 0.28 (110, 0.31)** 0.25 (245, 0.36)***
Moderate or low 0.39 (190, 0.28) 0.48 (75, 0.31)
*p<0.05; **p<0.01; ***p<0.001
Table I.15 shows that, by the time of 12 month follow-up, not having an informal
carer living in the same household was independently associated with better health-
related quality of life in both re-ablement and comparison groups. Age group and
whether or not a person lived alone remained associated with health-related quality
of life for people in the comparison group; having an informal carer living in another
household became positively associated with health-related quality of life for people
in the comparison group. Age group and ethnicity were no longer factors associated
with health-related quality of life for people in the re-ablement group.
Table I.15 Health-related quality of life by sample characteristics and dependency at follow-up
Re-ablement Comparison
Mean (n, sd) Mean (n, sd)
Age
Under 65 years 0.40 (14, 0.44) 0.03 (9, 0.37)**
Over 65 years 0.48 (208, 0.34) 0.34 (125, 0.36)
Gender
Male 0.43 (61, 0.34) 0.31 (43, 0.33)
Female 0.49 (164, 0.35) 0.33 (92, 0.38)
Ethnicity
White British or Irish 0.47 (220, 0.36) 0.32 (123, 0.35)
Other 0.42 (7, 0.31) 0.35 (12, 0.44)
Lives alone
No 0.41 (78, 0.35) 0.21 (38, 0.35)*
Yes 0.49 (155, 0.35) 0.36 (97, 0.36)

Appendix I Supplementary outcome data
227
Re-ablement Comparison
Mean (n, sd) Mean (n, sd)
Owner occupier
No 0.48 (75, 0.38) 0.34 (62, 0.38)
Yes 0.46 (158, 0.34) 0.31 (73, 0.35)
Informal carer in same household
No 0.51 (165, 0.35)** 0.36 (99, 0.35)*
Yes 0.37 (68, 0.34) 0.21 (36, 0.37)
Informal carer in another household
No 0.49 (103, 0.35) 0.23 (63, 0.38)**
Yes 0.44 (130, 0.35) 0.40 (72, 0.32)
*p<0.05; **p<0.01
1.2.4 Social care needs (ASCOT)
Tables I.16 and I.17 present mean scores for social care needs by sample
characteristics and dependency. Table I.16 shows that being aged over 65 years,
living alone and having an informal carer living in another household were each
statistically significantly associated with fewer social care needs at baseline in both
re-ablement and comparison groups. Being female and White British or Irish were
associated with fewer needs in the re-ablement group only; lower FACS level and
not having an informal carer living in the same household were associated with fewer
current needs in the comparison group only.
Table I.16 Social care needs by sample characteristics and dependency at baseline
Re-ablement Comparison
Mean (n, sd) Mean (n, sd)
Age
Under 65 years 0.64 (32, 0.16)*** 0.58 (26, 0.16)***
Over 65 years 0.78 (585, 0.14) 0.78 (329, 0.16)
Gender
Male 0.75 (182, 0.15)* 0.76 (110, 0.17)
Female 0.78 (433, 0.14) 0.77 (246, 0.16)
Ethnicity
White British or Irish 0.70 (564, 0.14)*** 0.76 (323, 0.17)
Other 0.78 (50, 0.14) 0.78 (32, 0.17)

Home care re-ablement services: Investigating the longer-term impacts
228
Re-ablement Comparison
Mean (n, sd) Mean (n, sd)
Lives alone
No 0.74 (198, 0.15)** 0.73 (125, 0.16)**
Yes 0.78 (421, 0.14) 0.78 (232, 0.17)
Owner occupier
No 0.78 (223, 0.15) 0.77 (175, 0.18)
Yes 0.77 (342, 0.14) 0.76 (181, 0.16)
Informal carer in same household
No 0.78 (454, 0.15) 0.77 (248, 0.16)*
Yes 0.76 (165, 0.14) 0.73 (104, 0.17)
Informal carer in another household
No 0.74 (220, .15)** 0.73 (130, 0.17)**
Yes 0.79 (399, 0.14) 0.78 (222, 0.16)
FACS level
Critical or substantial 0.75 (109, 0.15) 0.75 (247, 0.17)***
Moderate or low 0.77 (192, 0.14) 0.82 (75, 0.14)
*p<0.05; **p<0.01; ***p<0.001
Table I.17 shows the mean current social care needs scores in each group at 12
month follow-up. By this stage, only age remained statistically significantly
associated with social care needs, in the comparison group only. However, the
number of people aged less than 65 was very small meaning this result should be
treated with caution.

Appendix I Supplementary outcome data
229
Table I.17 Social care needs by sample characteristics and dependency at follow-up
Re-ablement Comparison
Mean (n, sd) Mean (n, sd)
Age
Under 65 years 0.69 (13,* 0.18) 0.63 (6, 0.18)*
Over 65 years 0.80 (219, 0.16) 0.79 (130, 0.15)
Gender
Male 0.77 (63, 0.16) 0.76 (42, 0.15)
Female 0.81 (167, 0.16) 0.79 (96, 0.16)
Ethnicity
White British or Irish 0.79 (225, 0.16) 0.78 (126, 0.15)
Other 0.74 (6, 0.14) 0.80 (12, 0.17)
Lives alone
No 0.77 (79, 0.16) 0.77 (39, 0.15)
Yes 0.81 (159, 0.16) 0.79 (99, 0.16)
Owner occupier
No 0.80 (75, 0.18) 0.80 (60, 0.15)
Yes 0.80 (163, 0.15) 0.77 (78, 0.16)
Informal carer in same household
No 0.81 (167, 0.16) 0.78 (100, 0.16)
Yes 0.77 (71, 0.15) 0.77 (38, 0.14)
Informal carer in another household
No 0.79 (107, 0.15) 0.77 (65, 0.15)
Yes 0.80 (131, 0.16) 0.79 (73, 0.16)
*p<0.05