holland case study - michiganfinal report holland case study— community and economic benefits...
TRANSCRIPT

FINAL REPORT
Holland Case Study—Community and Economic Benefits of Bicycling
Michigan Department of Transportation

Final Report
June 2014
Holland Case Study— Community and Economic Benefits of Bicycling
Prepared for Michigan Department of Transportation 425 West Ottawa Street Lansing, Michigan 48933-1532 Prepared by BBC Research & Consulting 1999 Broadway, Suite 2200 Denver, Colorado 80202-9750 303.321.2547 fax 303.399.0448 www.bbcresearch.com [email protected]

BBC RESEARCH & CONSULTING HOLLAND CASE STUDY, PAGE 1
Holland Case Study – Community and Economic Benefits of Bicycling
Introduction
This report on the community and economic impacts of bicycling in Holland is one of five case
studies developed for the Michigan Department of Transportation (MDOT) by BBC Research &
Consulting and R. Neuner Consulting (the study team). The research on Holland was conducted
as part of the first phase of a study of economics and bicycling throughout Michigan. The study
objectives include:
1. Estimating the community and economic benefits of bicycling in Michigan;
2. Estimating the community and economic benefits of bicycling in five case study
communities throughout the state;
3. Providing in-depth qualitative information on links between bicycling and the
economy according to business owners, government officials and bicycling
advocates;
4. Estimating the economic benefits to Michigan from out-of-state participation in
bicycling events; and
5. Estimating the economic benefits to Michigan from bicycle-related tourism.
Phase I of the project addressed the first three objectives and Phase II addresses the fourth and
fifth objectives. The combination of the statewide and community specific research provides an
opportunity to examine the specific ways policies and infrastructure impact local businesses and
residents in the context of bicycling statewide. Additionally, the diverse nature of bicycling in the
five case study communities gives stakeholders throughout Michigan an understanding of the
many roles bicycling can play in a local economy. As a result, the case study reports can be a
useful starting place for residents in investigating the economic benefits of bicycling in
communities that were not studied as a part of this research.
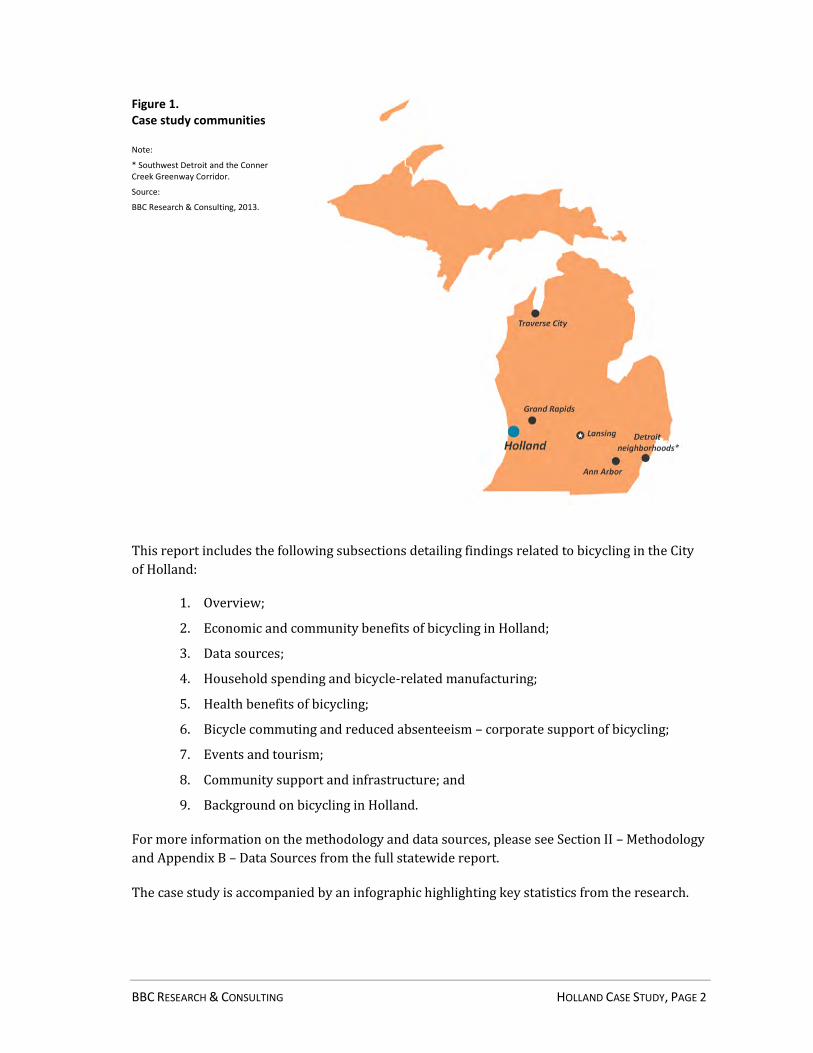
Figure 1 provides a map of Michigan showing Holland, the other four case study communities,
and the state capital, Lansing.
BBC RESEARCH & CONSULTING HOLLAND CASE STUDY, PAGE 2
Figure 1. Case study communities
Note:
* Southwest Detroit and the Conner Creek Greenway Corridor.
Source:
BBC Research & Consulting, 2013.
This report includes the following subsections detailing findings related to bicycling in the City
of Holland:
1. Overview;
2. Economic and community benefits of bicycling in Holland;
3. Data sources;
4. Household spending and bicycle-related manufacturing;
5. Health benefits of bicycling;
6. Bicycle commuting and reduced absenteeism – corporate support of bicycling;
7. Events and tourism;
8. Community support and infrastructure; and
9. Background on bicycling in Holland.
For more information on the methodology and data sources, please see Section II – Methodology
and Appendix B – Data Sources from the full statewide report.
The case study is accompanied by an infographic highlighting key statistics from the research.

BBC RESEARCH & CONSULTING HOLLAND CASE STUDY, PAGE 3
1- Overview
Holland is a small city with a population of about 33,000 residents. It is located in southwest
Michigan, near the shores of Lake Michigan. According to the West Michigan Coast Chamber of
Commerce, the primary drivers of the Holland area regional economy are manufacturing (28%
of jobs are tied to manufacturing within a diverse base including auto, office furniture, food
processing, advanced energy such as electric battery plants). Tourism is also important, but not
the lead industry for the region. In an interview, Jane Clark, the Chamber President, highlighted
that Holland has unique assets because it is both “a tourism destination and a place that has a
solid job base.”
This case study provides an estimate of the community and economic benefits of bicycling in
Holland along with key information from local residents detailing the links between bicycling
and the economy. This combination of data helps the reader quantify the impacts of bicycling on
the economy while providing background and context from key Holland stakeholders on how
bicycling enhances the Holland economy.
Given the relative lack of specific data on bicycling in Holland, the analysis relies on information
from a variety of sources including:
Numerous stakeholder interviews with Holland officials, bicycle advocates, business
owners and residents;
A household survey conducted with city residents; and
A variety of secondary data sources including the United States Census Bureau’s American
Community Survey, the Michigan Department of Community Health and the United States
Centers for Disease Control and Prevention.

BBC RESEARCH & CONSULTING HOLLAND CASE STUDY, PAGE 4
2- Economic and Health Benefits of Bicycling in Holland
Below is a summary of the annual economic and health benefits associated with bicycling
estimated for Holland:
Household spending on bicycling related items (from bicycle-specific and general retail
establishments) - $1.1 million;
Manufacturing - $410,000;
Avoided health care costs - $2.5 million;
Reduced absenteeism - $1.8 million; and
Event and tourism spending - $557,000.
These benefits total approximately $6.4 million annually. The remainder of the report provides
more information on each of the key components of the overall economic and community
benefits.
During in-depth interviews, key stakeholders from Holland highlight a number of unique
characteristics that have influenced bicycling in Holland and the relationship between bicycling
and the local economy. 1
Holland has taken a unique approach to building bicycle infrastructure, with a large
network of separated, multi-use paths and minimal on-road infrastructure, such as bicycle
lanes.
Bicycling has a growing role in Holland’s tourism market, and more local businesses and
public entities are looking for ways to capture visits from those seeking experiential
tourism opportunities.
Although there is a strong bicycling community in Holland, there is not an organized
presence working to promote and encourage bicycling or work with public entities to
improve infrastructure or programming.
Holland’s bicycle shops play an active and creative role in promoting bicycling and building
a bicycling culture and community.
Adding connections between current bicycle facilities is seen as the next step in
encouraging more bicycling by residents and visitors.
3- Data Sources
A number of data sources were used in calculating the overall economic and community benefits
and reporting on bicycling in Holland including:
1 While qualitative information collected from various stakeholders in the Holland proved to be of great value, the views and
opinions expressed by stakeholders cited in this report do not necessary represent those of MDOT.

BBC RESEARCH & CONSULTING HOLLAND CASE STUDY, PAGE 5
The American Community Survey (ACS) – The ACS is a survey conducted by the United
States Census Bureau on an ongoing basis. It provides statistically reliable information on
residents throughout the United States for a variety of topics including basic demographics,
employment, transportation and payments for essential goods and services.2
2013 Michigan Department of Transportation Household Survey on Bicycling – As a
part of the study, an online household survey was conducted to gather information from
Michigan residents about their bicycling habits and spending. Responses were collected through
outreach to statewide bicycle organizations, social media, cards distributed in each of the case
study communities and post cards mailed to a random selection of households in Holland. A total
of 215 responses from households in Holland were collected. Estimates regarding bicycling
participation among all Holland households were calculated using the 156 responses collected
from the mailed post card surveys. A copy of the survey instrument is included Appendix C of the
Phase I report.
Michigan Department of Community Health (MDCH) – The Michigan Department of
Community Health provides health services to millions of Michigan residents each year and
maintains information on the rate of certain diseases and medical conditions such as stroke and
heart disease. MDCH provided data estimating the number of stroke and heart disease cases and
the average direct and indirect costs associated per case. These data were used to estimate the
number of such cases and costs incurred in Holland. These estimated costs were applied to the
World Health Organization’s estimate of the percent of stroke and heart disease cases
attributable to inactivity, thereby allowing a calculation of costs avoided by active bicyclists
(those who ride two days a week or more).
The Centers for Disease Control and Prevention (CDC) – The CDC is operated by the
United States Department of Health and Human Services and collects data on health problems
throughout the country. CDC data were used in calculating avoided health benefits due to
bicycling, as described above.
Dun & Bradstreet (D&B) – D&B provides information on businesses by industry and location.
Data from Hoovers, a D&B subsidiary, provides information on the revenues and employment of
bicycle-related manufacturers and retailers throughout the state.
Where appropriate, this case study provides comparisons between other economic research
related to bicycling and the results of this study.
In-depth stakeholder interviews. – As a part of this study, key public officials, business
owners and representatives of community organizations were interviewed about bicycling and
the local economy. A list of interview participants is included in Appendix D of the statewide
report.
2For commuting by bicycle data were taken from the U.S. Census Bureau; American Community Survey; 2008-2012 5-Year
Estimates, Table S0801 Commuting Characteristics by Sex. For information on the population and number of households in
Michigan, data were taken from U.S. Census Bureau; American Community Survey; 2008-2012 5-Year Estimates, Table DP02
Selected Social Characteristics in the United States. Both tables were accessed at http://factfinder2.census.gov/.

BBC RESEARCH & CONSULTING HOLLAND CASE STUDY, PAGE 6
4- Household Spending and Bicycle-related Manufacturing
In the household survey, respondents were asked to quantify their total annual household
spending on bicycling. Spending on bicycling includes bicycles, components, equipment and
maintenance. The most frequent response was $1-100. About 20 percent of households reported
spending more than $100 annually, while a very modest amount of households spend
considerably more than $100 annually.
Based on the distribution of spending, the average Holland household spent $93 on bicycle-
related equipment in 2013. This is on par with the national average of $90 per-household, as
reported by the Outdoor Industry Association in 2012 and is higher than the statewide average
of $46 per household.3
Using the average household spending from the survey along with ACS data regarding the total
number of households in Holland (11,451), the total spending on bicycle-related retail purchases
in 2013 was approximately $1.1 million.4
As shown in Figure 2, the most frequently reported type of retail establishment for bicycle
purchases was a bicycle-specific retail shop. Such businesses were the source of more than half
of all bicycle purchases, while 18 percent of survey respondents’ primary bicycles came from
general retail stores. Another 11 percent reported obtaining their bicycle second-hand from
sources like garage sales and classified advertisements.
Figure 2. Primary Bicycle Source
Source:
BBC Research & Consulting from 2013 Michigan Department of Transportation Household Survey on Bicycling
n = 114
4.1 - Bicycle retailers in Holland. In addition to information from the household survey, data
were also collected from Dun & Bradstreet about bicycle retailers in Holland. Dun & Bradstreet
maintains business listings for the United States and reports information such as revenue and
employment. Using these data, BBC collected information on bicycle-related retail
establishments in Holland. The average three-year revenue for these businesses in Holland was
3 The Outdoor Recreation Economy, Outdoor Industry Association accessed at :
http://www.outdoorindustry.org/images/researchfiles/OIA_OutdoorRecEconomyReport2012.pdf?167
4 U.S. Census Bureau; American Community Survey; 2008-2012 5-Year Estimates, Table DP02 Selected Social Characteristics in
the United States.

BBC RESEARCH & CONSULTING HOLLAND CASE STUDY, PAGE 7
$1.9 million. Dun & Bradstreet also reported that these businesses employ 25 individuals. These
data serve as a conservative estimate of the bicycle-specific retail sales and employment in
Holland, given that there may be new businesses founded since the data were collected and that
many establishments that might be bicycle-specific shops may be categorized more broadly by
Dun & Bradstreet (e.g. as a sporting goods retailer).
Holland has a robust bicycle retail and manufacturing scene, with seven bicycle shops located
within a five-mile radius of downtown. Bicycle-related businesses range from Jade Cycles, which
builds custom bicycles, to full-service operators like Velo City Cycles and West Michigan Bike and
Fitness, both located in the heart of downtown Holland.
Shop owners interviewed for this study see a growing population of people choosing bicycling in
Holland:
“We’re seeing some growth, partially because of the aging population. People that used to
run now choose to bike. We see a lot of older people coming in looking for certain kinds of
bikes.” – Brad White, Velo City Cycles
Holland’s bicycle business community has a tradition of being engaged in promoting bicycling
beyond their shop doors. According to Mark DeWitt of Hope College, “We have very active bike
shops.” For example, one shop hosts a weekly evening ride and organizes an annual Cranksgiving
ride in November. The shop also hosts various clinics, women’s rides, an in-store yoga class and
an indoor training center. According to the shop owner:
“This shop has long been invested in the riding community. It’s not just about selling
someone a bike and getting them out the door. It’s about selling someone a bike and
enhancing their purchase with rides, workshops. You don’t grow the bicycling community
just by selling bikes. Cycling is a sport and an activity that can be very social. People really
enjoy that social aspect of cycling. You can make connections, whether it is a business
connection or a friend.” – Brad White
4.2 - Non-bicycle-specific retail spending. Given that there are many types of retailers in
Holland that sell bicycles, the study team used results from the household survey on bicycle
spending along with the reported distribution of type of establishment to estimate total bicycle-
related spending at general retail establishments. Using this information, bicycle related
spending at general retail establishments totals approximately $270,000 in annual sales.
4.3 - Bicycle-related manufacturing in Holland. The study team identified one bicycle
manufacturer in Holland with annual revenues of approximately $410,000. The manufacturer
supports four full-time employees.
5- Health Benefits of Bicycling
The study team used information from a variety of sources to estimate the health and workplace
benefits derived from bicycling in Holland.
5.1 - Health benefits from physical activity. Physical activity helps reduce the risk of a
number of costly medical conditions. Several studies quantified the value of physical activity in

BBC RESEARCH & CONSULTING HOLLAND CASE STUDY, PAGE 8
terms of avoided health costs. The study team quantified benefits to Holland from physical
activity based on avoided costs for treatment of strokes and heart disease. The information used
came from a variety of sources including:
Data on the proportion of the conditions caused by physical inactivity from The World
Health Organization;5
The annual number of cases of these conditions in Michigan from the CDC (strokes) and the
MDCH (heart disease);
The annual direct and indirect costs per case from the MDCH; and
The proportion of residents who reported riding their bicycle two or more days each week
in the household survey.
Using statewide heart disease and stroke case data from the CDC and MDCH, it was estimated
that Holland experiences approximately 95 cases of stroke and 386 cases of heart disease
annually that require hospitalization. These case numbers were applied to MDCH’s cost per case
estimates of about $90,000 for stroke and $88,000 for heart disease and the WHO’s estimation
that 10 percent of stroke cases and 20 percent of heart disease cases are attributable to
inactivity.
Using these estimates, the study team estimates that the total avoided costs for strokes and heart
disease in Holland due to bicycling is approximately $2.5 million. A number of other costly
medical conditions can also be linked to reduced physical activity including diabetes and some
forms of cancer. The study team was not able to find adequate data to estimate the potential
avoided health costs for these diseases.
6- Bicycle Commuting and Reduced Absenteeism
The 2012 ACS also provides some data on bicycle commuting in Holland, reporting the total
commute share at 2.2 percent.6 The ACS asks participants to report their commute by asking
how respondents “usually” commuted to work over the past week and directs respondents to
only report the type of transportation which accounts for the majority of the distance. As a
result, it may underreport the prevalence of bicycle commuting in Holland given that some
individuals may not “usually” bicycle and that many bicycle commuters may combine their
bicycle commute with other types of transportation including transit and carpooling.
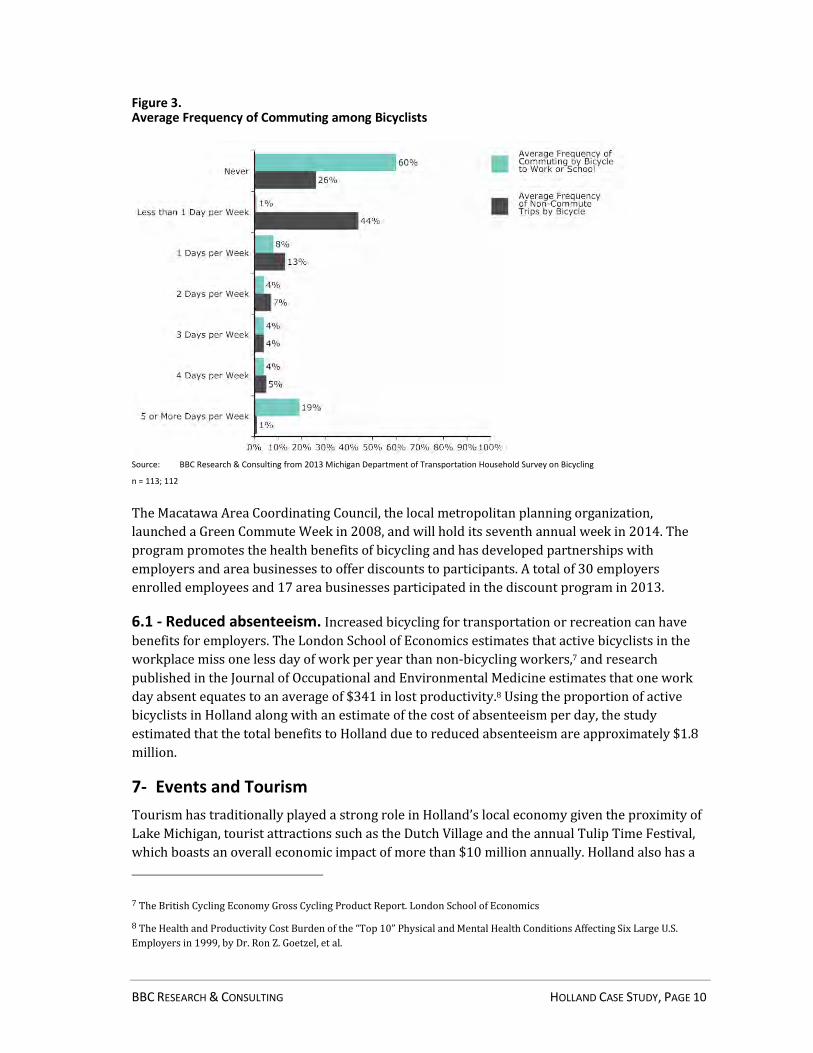
The study team also asked bicyclists in the household survey about how often they use their
bicycle for commuting or other types of transportation. Results are shown in Figure 3 below.
While most responding bicyclists report never commuting to work or school by bicycle
(60%), just more than one-third do so at least once a week (39%). Non-work/school
transportation by bicycle, including running errands or attending social events, is more common.
5 The World Health Report 2002: Reducing Risks, Promoting Healthy Life.
6 U.S. Census Bureau; American Community Survey; 2008-2012 5-Year Estimates, Table S0801 Commuting Characteristics by
Sex.

BBC RESEARCH & CONSULTING HOLLAND CASE STUDY, PAGE 9
BBC RESEARCH & CONSULTING HOLLAND CASE STUDY, PAGE 10
Figure 3. Average Frequency of Commuting among Bicyclists
Source: BBC Research & Consulting from 2013 Michigan Department of Transportation Household Survey on Bicycling
n = 113; 112
The Macatawa Area Coordinating Council, the local metropolitan planning organization,
launched a Green Commute Week in 2008, and will hold its seventh annual week in 2014. The
program promotes the health benefits of bicycling and has developed partnerships with
employers and area businesses to offer discounts to participants. A total of 30 employers
enrolled employees and 17 area businesses participated in the discount program in 2013.
6.1 - Reduced absenteeism. Increased bicycling for transportation or recreation can have
benefits for employers. The London School of Economics estimates that active bicyclists in the
workplace miss one less day of work per year than non-bicycling workers,7 and research
published in the Journal of Occupational and Environmental Medicine estimates that one work
day absent equates to an average of $341 in lost productivity.8 Using the proportion of active
bicyclists in Holland along with an estimate of the cost of absenteeism per day, the study
estimated that the total benefits to Holland due to reduced absenteeism are approximately $1.8
million.
7- Events and Tourism
Tourism has traditionally played a strong role in Holland’s local economy given the proximity of
Lake Michigan, tourist attractions such as the Dutch Village and the annual Tulip Time Festival,
which boasts an overall economic impact of more than $10 million annually. Holland also has a
7 The British Cycling Economy Gross Cycling Product Report. London School of Economics
8 The Health and Productivity Cost Burden of the “Top 10” Physical and Mental Health Conditions Affecting Six Large U.S.
Employers in 1999, by Dr. Ron Z. Goetzel, et al.

BBC RESEARCH & CONSULTING HOLLAND CASE STUDY, PAGE 11
growing number of bicycle-related events that serve local residents and attract visitors. This
section provides an overview of bicycling tourism and events along with a summary of
household spending on these activities from the household survey.
7.1 - Tourism. Holland’s walkable downtown and proximity to Lake Michigan makes it a
significant tourism and cultural destination, attracting visitors from Michigan and beyond,
including a large number of visitors from the Great Lakes region (the most out-of-state visitors
live in Illinois, followed by Indiana, Ohio and Wisconsin). Located about halfway between
Chicago and Detroit, the Holland region markets itself as being more accessible than other
tourism destinations farther north, like Traverse City. Holland tourism officials highlighted the
growing role of spur-of-the-moment visits from residents of the Chicago region, where Holland’s
brand as a tourism destination is growing.
Bicycling has a growing role in the tourism market. The Holland Visitors Bureau has promoted
Ottawa County’s vast trail network with a map since the 1980s, and is devoting two full pages in
its 2014 visitors publication to bicycling. The Bureau purchased an ad in Michigan Trails
magazine and is looking at an expanded array of targeted advertising for 2014 and future years.
According Sally Laukitis, Executive Director of the Holland Convention and Visitors Bureau:
“Within the last two years, we’ve seen an active increase in the number of cars rolling into
town with bikes on the back. We’ve seen more people here to bicycle, more people here to
see Holland on bike.”
Ms. Laukitis also sees an opportunity to do more to promote itself as a bicycle-friendly
destination.
“We have to be more intentional about becoming bicycle-friendly. We need to make sure
that if we want to attract cyclists, we are truly cycling friendly, and that we have the
amenities they need. It’s the little things – we have to do our homework in terms of what we
can do to attract that segment. Communicating with the area hotels, campgrounds and
B&B’s about the influx of cyclists would be a critical piece of the mix… We used to work
with the ski clubs; now we need to work with the cycling clubs. We haven’t really
capitalized on that yet.”
Although the community may be able to do more to link bicycling and tourism, businesses and
public entities alike are exploring new revenue opportunities that link the two. One local hotel
offers guests the option to rent an electric-aerobic cruiser bicycle, and several businesses located
near the lakefront offer bicycles for rent.
Holland’s traditional bicycle shops have found ways to tap into the community’s tourism market.
Many retail shops also have an active rental business, and some offer to deliver rental bikes to
lodging locations around the region. Laura Harris from Cross Country Cycle, a Grand Rapids
bicycle shop, commented on hotels wanting more and more information about bicycle rentals,
and the larger role that shops can play in making Holland a destination:
“I’m constantly looking for more ways to have experience-based activities in my store.
Renting a bike, or riding a fat bike rental here in the winter – those are ways to make this
BBC RESEARCH & CONSULTING HOLLAND CASE STUDY, PAGE 12
city cooler, and help my shop make more money. It feeds into the idea of this community as
a destination.”
7.2 – Bicycle-related events. Holland has a number of annual stand-alone bicycle events and
has recently seen an increase in bicycle activities. There are several large organized bicycling
events in the region, including the Macatawa Cycling Club Holland Hundred (celebrating its 40th
year in 2014), and the Lakeshore Harvest Country Bike Tour. Tulip Time, the 85-year-old festival
that celebrates tulips blossoming across the city each May added a criterium to their schedule of
events in 2013. The race included 218 participants in their first year, and Tulip Time officials will
continue to host the race in 2014, citing several advantages:
“Tulip Time decided to add a bicycling event to our lineup for a multitude of reasons. We
strive to reach a broad spectrum of people with events that appeal to a variety of ages. We
are a multi-generational festival, and adding the criterium to our lineup helped us reach a
new audience and interest group. Cycling is also a major part of Dutch culture in the
Netherlands. With Tulip Time’s mission being to celebrate the Dutch culture of Holland,
what better way to do this than bring a cycling event into our lineup?” – Carra Hood, Tulip
Time Festival
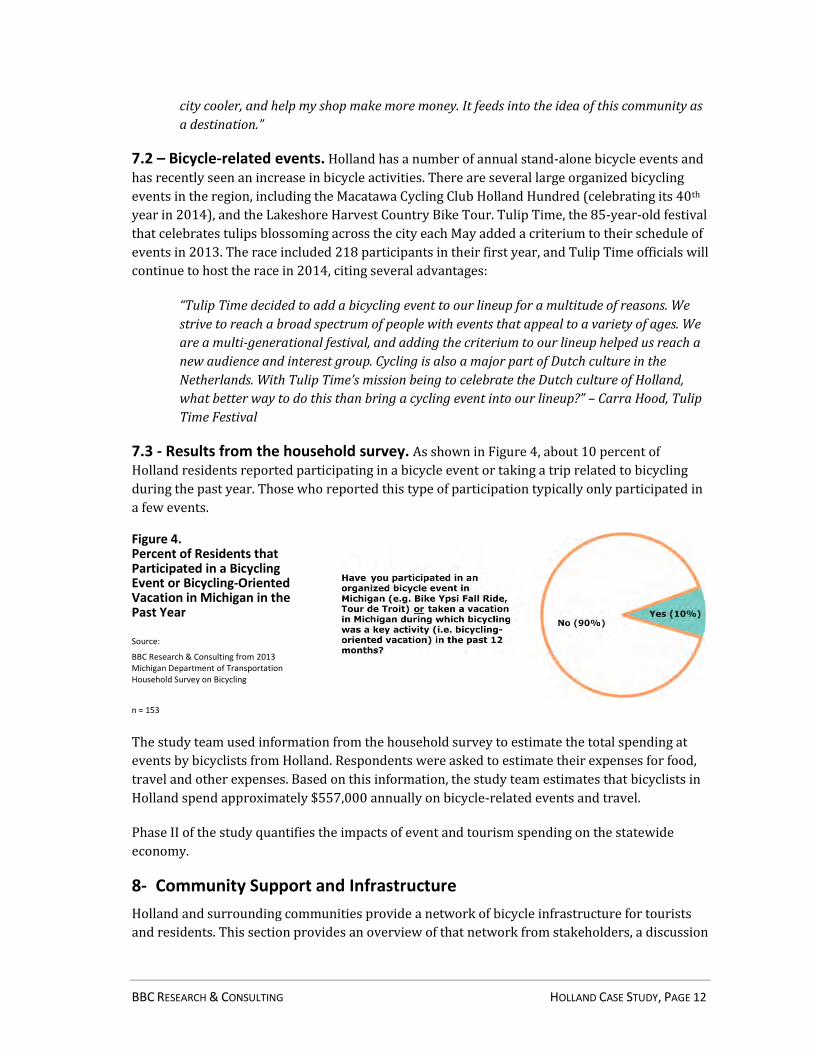
7.3 - Results from the household survey. As shown in Figure 4, about 10 percent of
Holland residents reported participating in a bicycle event or taking a trip related to bicycling
during the past year. Those who reported this type of participation typically only participated in
a few events.
Figure 4. Percent of Residents that Participated in a Bicycling Event or Bicycling-Oriented Vacation in Michigan in the Past Year
Source:
BBC Research & Consulting from 2013 Michigan Department of Transportation Household Survey on Bicycling
n = 153
The study team used information from the household survey to estimate the total spending at
events by bicyclists from Holland. Respondents were asked to estimate their expenses for food,
travel and other expenses. Based on this information, the study team estimates that bicyclists in
Holland spend approximately $557,000 annually on bicycle-related events and travel.
Phase II of the study quantifies the impacts of event and tourism spending on the statewide
economy.
8- Community Support and Infrastructure
Holland and surrounding communities provide a network of bicycle infrastructure for tourists
and residents. This section provides an overview of that network from stakeholders, a discussion

BBC RESEARCH & CONSULTING HOLLAND CASE STUDY, PAGE 13
of the relationship between bicycling by tourists and residents, the view of stakeholders on the
next steps for Holland, and results from the household survey on residents’ value of Holland’s
bicycle infrastructure.
8.1 - Shared-use path network and placemaking. Compared with other case study
communities, Holland has taken a unique approach to bicycle infrastructure, with a large
network of separated, shared-use and sidepaths and very little on-road infrastructure. The large
shared-use path and sidepath network is helping bicycling emerge as a lifestyle choice that some
feel is attracting multiple segments of potential new residents to Holland, from millenials to
retirees.
“Sidepaths have helped create a culture here. People actually retire to the north side of
Holland because of the sidepaths. They’re my customers – they move here because of the
sidepaths, and come in wanting to buy bikes so they can get to Evergreen Commons, to the
library, to the beach, get exercise, to have fun.” – Laura Harris
Local officials see changes in neighborhood demographics that are bringing young families to
city neighborhoods as a big opportunity.
“As we’ve read widely and hear from developers, realtors, and residents, millenials want to
live in places that are close to amenities. Opportunities for biking is one such amenity, and
one we need to offer.” – Phil Meyer, Director of Community and Neighborhood Services, City
of Holland
Interviewees see small investments in bicycling around town as a sign that the connection
between bicycling and placemaking is growing. Local officials reported that more businesses
have recently installed bicycle racks and made other investments to encourage employees and
patrons to use their bicycles. A member of the business community highlighted the connection
between bicycling, placemaking and talent attraction:
“I’ve heard it said that when people are considering Holland, they look at our bike paths
and are pleased to see that is an amenity we offer. Right now we really need engineers.
Young engineers are looking for a community that offers strong quality of life amenities.
Biking is one element of attracting those talented people we need.” - Jane Clark
8.2 - Infrastructure for tourism and transportation. Stakeholders saw a strong
connection between the community’s tourism industry and efforts to make the community
friendlier to bicycling.
“There’s an opportunity for cycling to grow here as both a tourism element and as a
commuting and transportation element. If you can marry the concept of a bike-friendly
community to attracting tourism, that’s a bonus,” – Brian Burch, Holland City Council
Holland’s local government is supportive of bicycling. The City of Holland adopted its first
Bicycle and Pedestrian Transportation Plan in March 2006, and expects to release a new Non-
Motorized Plan in spring 2014. The City of Holland adopted a Complete Streets resolution in
April 2011, and city officials expressed a strong commitment to advancing the infrastructure:

BBC RESEARCH & CONSULTING HOLLAND CASE STUDY, PAGE 14
“We don’t have enough dedicated funding, but whenever we are going to reconstruct or
even resurface, we’re thinking about opportunities and we do as much as we can to install
bike infrastructure.” – Mark Vanderploeg, city planner, City of Holland
The city currently has 13.6 miles of shared-use path, and 3.5 miles of paved shoulders or bicycle
lanes.9 Ottawa County features more than 175 miles of shared-use paths.
Holland is also home to a portion of United States Bicycle Route 35 (USBR-35). This route runs
along the coast of Lake Michigan. Michigan’s section of USBR-35 is roughly 500 miles long and
stretches from the Indiana Border to Sault St. Marie. In May 2012 the USBR-35 was officially
designated by the American Association of State Highway and Traffic Officials.
A bicycle shop owner noted that while Holland has a good network of paths for bicyclists, that
there is room for improvement:
“I’ve been to the Netherlands to race. The cycling culture and recreational cycling culture is
so huge there. Cycling is a means of transportation there. We haven’t quite hit that here yet,
but we’re trying to work towards better transportation for cyclists here. It’s good but it
could be better. That’s not a job just for the City; it is for the entire cycling community to
get behind. We would like to work toward Holland being more bike-friendly and easier to
get around by bike.” – Brad White
8.3 - Connectivity. Connectivity between bicycle facilities is seen as the next step among many
in making Holland more bicycle-friendly.
“There is a tremendous amount of bicycling in this community. I wish we had more of a
safe, direct connection between some key places.” – Brian Burch
Recent projects were praised for the improved connections they’ve offered riders, including the
recent Lakeshore Trail extension to Saugatuck, a small lakeshore community about 10 miles
south of Holland. “That was a huge benefit to connecting those communities,” according to Jane
Clark.
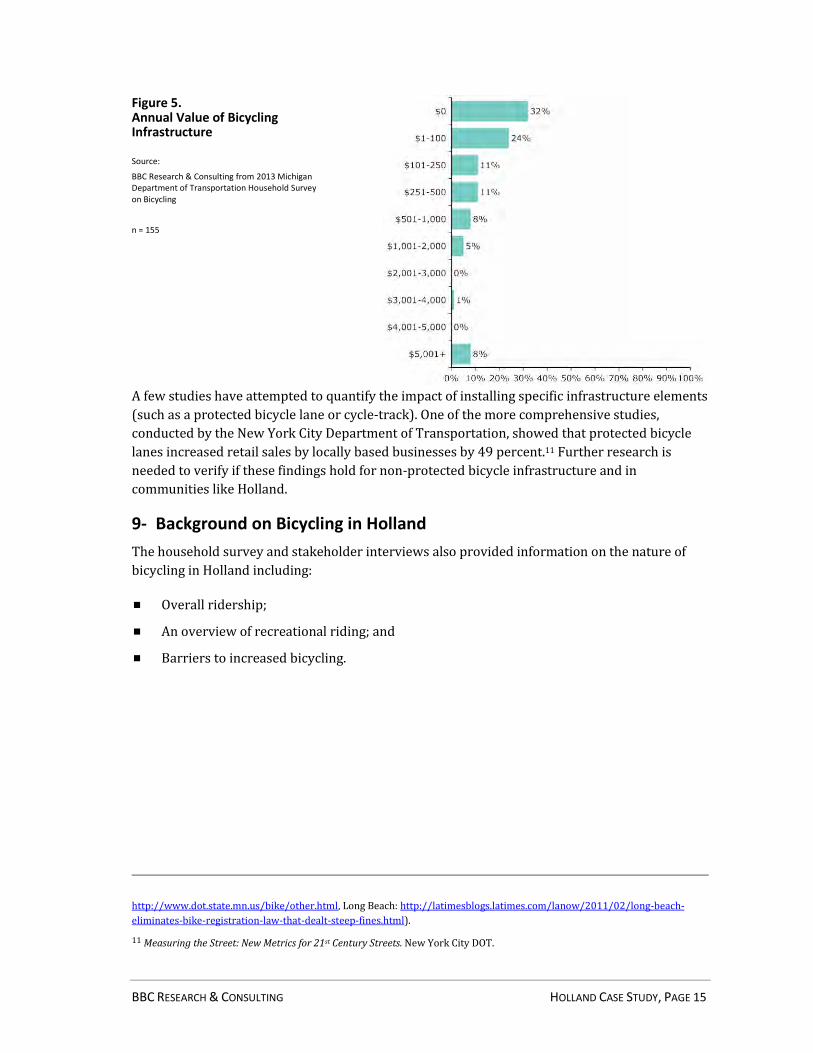
8.4 - Value of bicycle infrastructure. Residents in Holland report substantial value from the
availability of quality bicycle infrastructure. The study team also wanted to quantify the value
placed on bicycle-specific infrastructure such as bicycle lanes, cycle-tracks and shared-use
pathways. As shown in Figure 5, nearly half of respondents placed an annual value of accessing
bicycle infrastructure at more than $100. Eight percent of respondents place an annual value of
more than $5,000 on the ability to use bicycle infrastructure.10
9 Macatawa Area Coordinating Council Draft Non-Motorized Plan – forthcoming spring 2014
10 It is important to note that while respondents reported a high value for a network of bicycling infrastructure, this does not
suggest that Holland should implement taxes or fees for residents to access this infrastructure. Bicycle registration and fee
collection have been considered by a few jurisdictions in the past decade and have not been implemented or have been
repealed for a variety of reasons (Ottawa: http://www.ottawasun.com/2012/01/13/staff-to-council-no-bicycle-licences; San
Diego: http://calbike.org/san-diego-repeals-bicycle-license-law/ ; Minneapolis and Minnesota:
BBC RESEARCH & CONSULTING HOLLAND CASE STUDY, PAGE 15
Figure 5. Annual Value of Bicycling Infrastructure
Source:
BBC Research & Consulting from 2013 Michigan Department of Transportation Household Survey on Bicycling
n = 155
A few studies have attempted to quantify the impact of installing specific infrastructure elements
(such as a protected bicycle lane or cycle-track). One of the more comprehensive studies,
conducted by the New York City Department of Transportation, showed that protected bicycle
lanes increased retail sales by locally based businesses by 49 percent.11 Further research is
needed to verify if these findings hold for non-protected bicycle infrastructure and in
communities like Holland.
9- Background on Bicycling in Holland
The household survey and stakeholder interviews also provided information on the nature of
bicycling in Holland including:
Overall ridership;
An overview of recreational riding; and
Barriers to increased bicycling.
http://www.dot.state.mn.us/bike/other.html, Long Beach: http://latimesblogs.latimes.com/lanow/2011/02/long-beach-
eliminates-bike-registration-law-that-dealt-steep-fines.html).
11 Measuring the Street: New Metrics for 21st Century Streets. New York City DOT.

BBC RESEARCH & CONSULTING HOLLAND CASE STUDY, PAGE 16
9.1 - Overall ridership. As shown in Figure 6, about three quarters of the adult residents of
Holland reported riding a bicycle in the past year. Those respondents who report having ridden
a bicycle in the past 12 months are considered “cyclists” in the analysis of this report.
Figure 6. Residents Who Have Ridden in the Past Year
Source:
BBC Research & Consulting from 2013 Michigan Department of Transportation Household Survey on Bicycling
n = 156
9.1.1 - Demographics. The household survey provides demographic information about residents
who reported riding in the last year. As seen in Figure 7, approximately 64 percent of bicyclists
in Holland were male and more than 80 percent were age 35 or older.
Figure 7. Age and Gender of Bicyclists
Source: BBC Research & Consulting from 2013 Michigan Department of Transportation Household Survey on Bicycling
n = 115
9.2 - Recreational riding. Among residents who have ridden a bicycle in the past year, about
41 percent reported bicycling recreationally some but less than once per week, while about 40
percent reported riding their bicycle for recreation at least two days per week. This distribution
of the frequency of recreational bicycling is shown in Figure 8.

BBC RESEARCH & CONSULTING HOLLAND CASE STUDY, PAGE 17
Figure 8. Average Frequency of Recreational Bicycling among bicyclists
Source:
BBC Research & Consulting from 2013 Michigan Department of Transportation Household Survey on Bicycling
n = 114
9.3 - Barriers to increased bicycling. In the household survey, residents were asked about
barriers to riding more overall as well as barriers specific to commuting by bicycle. Respondents
were able to cite multiple barriers rather than indicating only the largest barrier. Addressing and
mitigating the most commonly stated barriers to bicycling is an effective approach to increasing
ridership. The most frequently cited barriers to increased bicycling in Holland were weather
conditions (60%) and lack of necessary time (39%), followed closely by safety concerns (38%).
BBC RESEARCH & CONSULTING HOLLAND CASE STUDY, PAGE 18
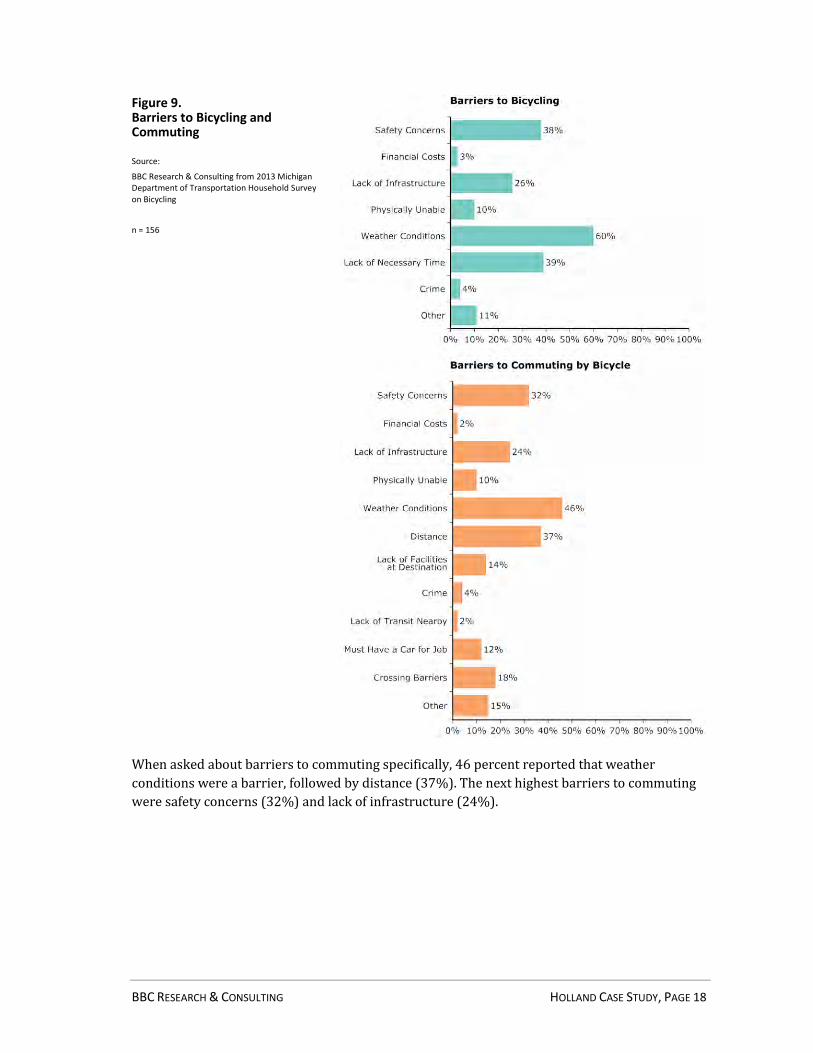
Figure 9. Barriers to Bicycling and Commuting
Source:
BBC Research & Consulting from 2013 Michigan Department of Transportation Household Survey on Bicycling
n = 156
When asked about barriers to commuting specifically, 46 percent reported that weather
conditions were a barrier, followed by distance (37%). The next highest barriers to commuting
were safety concerns (32%) and lack of infrastructure (24%).

Bicycling in HOLLAND
Population: 33,307
Miles of existing infrastructure: 17
Residents who place an annual value of at least $100 on the ability to use bicycle infrastructure
Total annual economic impact of bicycling
Bicycling retail revenue
People employed by bicycling industry: 29
Key barriers to bicycling
Bicyclists who bike at least twice a week
Bicyclists who commute by bicycle at least twice a week
Total annual spending associated with bicycling events and vacations in Michigan
$1.9 million
$557,000
$6.4 million
45%44%31%10%
Top primary bicycle types
For more information contact Josh DeBruyn, MDOT Bicycle and Pedestrian Coordinator at [email protected]
“[People] move here because of the sidepaths, and … buy bikes so they can get to Evergreen Commons, to the library, to the beach, get exercise, to have fun.” - Laura Harris, Cross County Cycle
Study funded by
Residents who participated in a bicycling event or bicycle-oriented vacation in Michigan in the past year

This infographic provides a one-page summary of bicycling within Holland based on information gathered by BBC Research & Consulting and R. Neuner Consulting for the Michigan Department of Transportation (MDOT) as part of the first phase of a two-phase study on the economic benefits of bicycling in Michigan. The infographic is accompanied by a case study report on Holland as well as a report providing information on the state of Michigan and the data sources and methodology used for the study. A household survey was conducted with residents in Holland, which gathered the following information shown on the infographic:
Annual spending associated with bicycling events and vacations;
Key barriers to bicycling;
Percent of residents who place an annual value of at least $100 on the ability to use bicycle infrastructure;
Percent of bicyclists who bike at least twice a week;
Percent of bicyclists who commute by bicycle at least twice a week;
Percent of residents who participated in a bicycling event in Michigan in the past year; and
Primary types of bicycles used by residents.
Below is a description of the data source for other data on the infographic:
Population – provided by the U.S. Census Bureau 2012 American Community Survey;
Miles of existing infrastructure – gathered from interviews with local officials during the case study process;
Bicycle Friendly CommunitySM Rating – a rating based on a number of metrics related to bicycling support and participation from the League of American Bicyclists;
Bicycling retail revenue – based on the three-year average annual revenue of bicycle retailers in the City of Holland reported in Dun & Bradstreet;
People employed by bicycling industry – based on the three year annual employment averages for retail bicycle shops and bicycle manufactures located in Holland as reported in Dun & Bradstreet;
Total annual impact of bicycling – calculated from the following components:
Total household retail spending on bicycling reported by Holland residents in the household survey ($1.1 million);
The total household spending on bicycle events and vacations as reported by Holland residents in the household survey ($557,000);
The average three-year annual revenues of bicycle-related manufactures in Holland as reported in Dun & Bradstreet ($410,000;
The avoided health care costs due to physical activity from bicycling based on ($2.5 million):
The statewide rates of hospitalization for stroke and heart disease from the United States Centers for Disease Control;
The proportion of heart disease and stroke due to physical inactivity from the World Health Organization;
The proportion of residents who are physical active using their bicycle from the household survey; and
The average cost of hospitalization for stroke and heart disease from the Michigan Department of Community Health.
The avoided costs of absenteeism for Holland employees due to bicycling based on ($1.8 million):
The proportion of residents who are physical active using their bicycle from the household survey;
The cost of absenteeism per day from the Journal of Occupational and Environmental
Medicine;1 and
The number of days per year of avoided absenteeism due to cycling from the London School
of Economics.2
1 The Health and Productivity Cost Burden of the “Top 10” Physical and Mental Health Conditions Affecting Six Large U.S. Employers in 1999, by Dr. Ron Z. Goetzel, et al.
2 The British Cycling Economy Gross Cycling Product Report. London School of Economics