holiday habits report 2018...this year, a new sightseeing trip category was introduced (such as a...
TRANSCRIPT

HOLIDAY HABITS REPORT2018

INTRODUCTION
ABTA Holiday Habits Report 2018 1
This is ABTA’s eighth Holiday Habits report, revealing British holidaymakers’ booking behaviour in the last 12 months and their attitudes to planning and booking holidays in the 12 months ahead, both in the UK and abroad.
What our report tells us is that, at a time of unprecedented political turbulence and uncertainty, people are still firmly committed to taking holidays and they continue to be a spending priority. Government figures show that spending on overseas package holidays increased in 2017 and our findings reinforce this picture.
Our research shows that 60% of the population took a foreign holiday in the past 12 months – the highest figure since 2011 - with longer overseas breaks the beneficiary. They also show that people managed their budgets by reducing the number of UK breaks and shorter overseas breaks and by cutting back on their spending while they are away.
Looking more closely at package holidays, they have again proved popular in the past year, with value for money rising up the list of priorities for people choosing a package. Spain and Portugal have benefited from the resurgence of the package in recent years and with destinations like Turkey, Egypt and Tunisia – all of which offer excellent value for money – significantly up on bookings for summer 2018, package holidays look set to be popular again in the year ahead.
Mark Tanzer CHIEF EXECUTIVE

NO HOLIDAYS UK ONLY ABROAD ONLY BOTH UK AND ABROAD
% of consumers
0
10
20
30
40
50
20142015201620172018
20142015201620172018
20142015201620172018
20142015201620172018
1320 23 14 30 15 4214 26 17 4327 12 4123 30 13 15 41 41
UKHOLIDAYS
HOLIDAYSABROAD
TOTALHOLIDAYS
LIDAYAA S
LIDAYSROAD
TALOLIDAYS
2014 2015
3.0
2016
3.2
2017
3.4
2018
2.1
1.7
1.8
1.2
1.7
1.5
2.0
1.4
3.8
1.8
1.6
3.4
The number of Britons taking a holiday is stable and remains high, with 86% of respondents saying they took a holiday either at home or abroad in the 12 months to August 2018 (87% in 2017).
However, the average number of holidays taken has fallen from 3.8 to 3.4 per person. While consistent with 2016, this is a decrease of 0.4 from last year.
This decrease is being driven by two main factors: people taking fewer UK breaks, and people taking fewer shorter breaks, at home and abroad. By contrast, the number of longer holidays abroad (7+ nights) has continued to increase since 2016 (2016: 0.7, 2017: 0.9, 2018: 1.0) and the percentage of people taking foreign holidays has also increased on last year by 3% (57% to 60%), the highest number since 2011.
After two strong years of growth for domestic holidays, the volume of UK holidays has fallen from 2.1 to 1.8 per person. The percentage of people taking a UK break has also decreased by 4% since last
year – with 68% of people having taken one in the last 12 months, compared to 72% in 2017.
Following an increase in 2017, the average number of shorter UK holidays (1-3 nights) has fallen slightly from 1.3 to 1.1 per person, and shorter foreign holidays (under 7 nights) from 0.8 to 0.6 per person. This is also reflected in a reduction in holidaymakers taking city breaks – with a 5% drop in the past 12 months (53% to 48%). These figures suggest that the trend in recent years of taking multiple shorter breaks may be slowing, with people focusing on preserving and investing in their longer holidays, particularly abroad.
People are also spending less while they are away. The average amount spent whilst on holiday has fallen across all holiday types, but is most pronounced for longer UK breaks where spend is down £40 - from £311 to £271, and for longer breaks abroad the average spend is down from £586 to £562. This suggests that holidaymakers are budgeting more carefully while away, rather than choosing not to go on holiday at all.
TABLE 1 Britons taking a holiday 2014-18
TABLE 2 Average number of holidays taken per person 2014-18 (split by UK and abroad)
1. NUMBER OF HOLIDAYS TAKEN
BRITONS TAKING A HOLIDAY 2014-2018
AVERAGE NUMBER OF HOLIDAYS
2 ABTA Holiday Habits Report 2018
NO HOLIDAYS UK ONLY ABROAD ONLY BOTH UK AND ABROAD
% of consumers
0
10
20
30
40
50
20142015201620172018
20142015201620172018
20142015201620172018
20142015201620172018
1320 23 14 30 15 4214 26 17 4327 12 4123 30 13 15 41 41
UKHOLIDAYS
HOLIDAYSABROAD
TOTALHOLIDAYS
LIDAYAA S
LIDAYSROAD
TALOLIDAYS
2014 2015
3.0
2016
3.2
2017
3.4
2018
2.1
1.7
1.8
1.2
1.7
1.5
2.0
1.4
3.8
1.8
1.6
3.4

People aged between 25-34 took the most holidays in the past 12 months (4.1). Families with young children took the most holidays, with an average of 4 holidays a year – 2.2 of those in the UK.
Whilst the number of overseas holidays remains relatively consistent across life stages, and is similar to last year, there has been a notable drop in families with older children taking domestic breaks (1.9) – down from 2.7 last year.
As in previous years, people are most likely to go on holiday with their partner, with over half doing so (51%), or immediate family (33%). Extended family groups and adult only group holidays are taken by around one in five people, while 4% of people took group holidays with friends.
ABTA Holiday Habits Report 2018 3
1. NUMBER OF HOLIDAYS TAKEN CONTINUED
AVERAGE NUMBER OF HOLIDAYS PER PERSON IN 2018 BY LIFE STAGE
SPOTLIGHT ON SOLO TRAVEL
TABLE 3 Number of holidays by life stage
TABLE 4 Solo holidays by age
UKHOLIDAYS
HOLIDAYSABROAD
TOTALHOLIDAYS
LIDAYAA S
LIDAYSROAD
TALOLIDAYS
AVERAGE
3.4
UNDER 45(no kids at home)
3.3
YOUNG FAMILY(any children under 5)
4
OLDER FAMILY(any children over 5)
3.5
OVER 45(no kids at home)
1.8
1.6
1.8
1.6
1.7
1.6
2.2
1.8
1.9
1.6
3.4
UKHOLIDAYS
HOLIDAYSABROAD
TOTALHOLIDAYS
LIDAYAA S
LIDAYSROAD
TALOLIDAYS
AVERAGE
3.4
UNDER 45(no kids at home)
3.3
YOUNG FAMILY(any children under 5)
4
OLDER FAMILY(any children over 5)
3.5
OVER 45(no kids at home)
1.8
1.6
1.8
1.6
1.7
1.6
2.2
1.8
1.9
1.6
3.4
Average 18-24 25-34 35-44 45-54 55-64 65-74 75+
15% 11% 16% 16% 13% 17% 17% 22%
12% 12% 10% 5% 12% 11% 18% N/A
AN INCREASE IN SOLO TRAVEL 2018
2017
The trend for solo holidays has been growing in recent years, which is further reflected in the report findings. More than one in six people (15%) chose to go on holiday by themselves in the past 12 months – up from the one in nine (12%) who took a solo holiday in 2017. However, the reasons for doing so vary compared to last year.
The top reason to travel alone is still to have the opportunity to do what they want, with over three-quarters (76%) of people doing so – up 3% on last year. But holidaymakers aren’t as interested in travelling alone to take time out (63% vs 71% last year) or to meet new people (31% vs 41% last year).
These changes are most notable among the 35-44 year old age-group, which has seen an increase of 11% in solo travel from last
year (from 5% to 16%). Just over nine in ten (92%) said travelling alone meant they had the opportunity to do what they want – 22% up on last year.
The most likely to travel solo are those aged 75+, one in five have done so this year with the main reason being to take some time out (81%). This age group are the least keen to make new friends when they travel alone, with just one-fifth looking for the chance to meet new people (22%) compared to almost two-fifths of 55-64 year olds (38%).

City breaks continue to be the nation’s favourite type of holiday, with almost half of people taking one in the past 12 months (48%), down from 53% in 2017.
Beach holidays continue to be the second most popular type of holiday, 40% took one this year which was consistent with last year (41%), while 15% took an all-inclusive holiday – slightly down on 2017 (17%). This year, a new sightseeing trip category was introduced (such
as a road trip or tour of a country), one in six people (15%) chose this type of holiday.
Looking to next year, value for money looks set to be a priority, with more people planning all-inclusive holidays (18% – which is 3% more than people who went on an all-inclusive holiday in the past 12 months). Cruise holidays look set for another strong year, with one in 12 (8%) having booked a cruise in the past 12 months and one in eight (12%) planning one next year.
2. WHAT TYPE OF HOLIDAYS HAVE BEEN BOOKED?
4 ABTA Holiday Habits Report 2018
TOP TEN TYPES OF HOLIDAY TAKEN IN THE PAST 12 MONTHS
TABLE 5 Top ten types of holiday taken in the past 12 months
*or sporting holiday (walking, cycling, sailing, trekking) **or a home swap, home stay, couch surfing
POPULAR HOLIDAYS IN THE PAST 12 MONTHS
48%A CITYBREAK
40%A BEACH HOLIDAY
21%COUNTRYSIDE
BREAK
15%A
SIGHTSEEING TRIP
15%AN ALL-
INCLUSIVEHOLIDAY
9%LAKES AND
MOUNTAINS8%
A CRUISE 7%RENTING A
PRIVATEHOME
5%A COACHHOLIDAY
5%A TRAINHOLIDAY
4%ADVENTUREOR ACTIVITY
HOLIDAY
48%of people took a city break
in the past 12 months making it the nation’s
favourite type of holiday
**
*
BOOKING METHODS OVER THE PAST 12 MONTHS
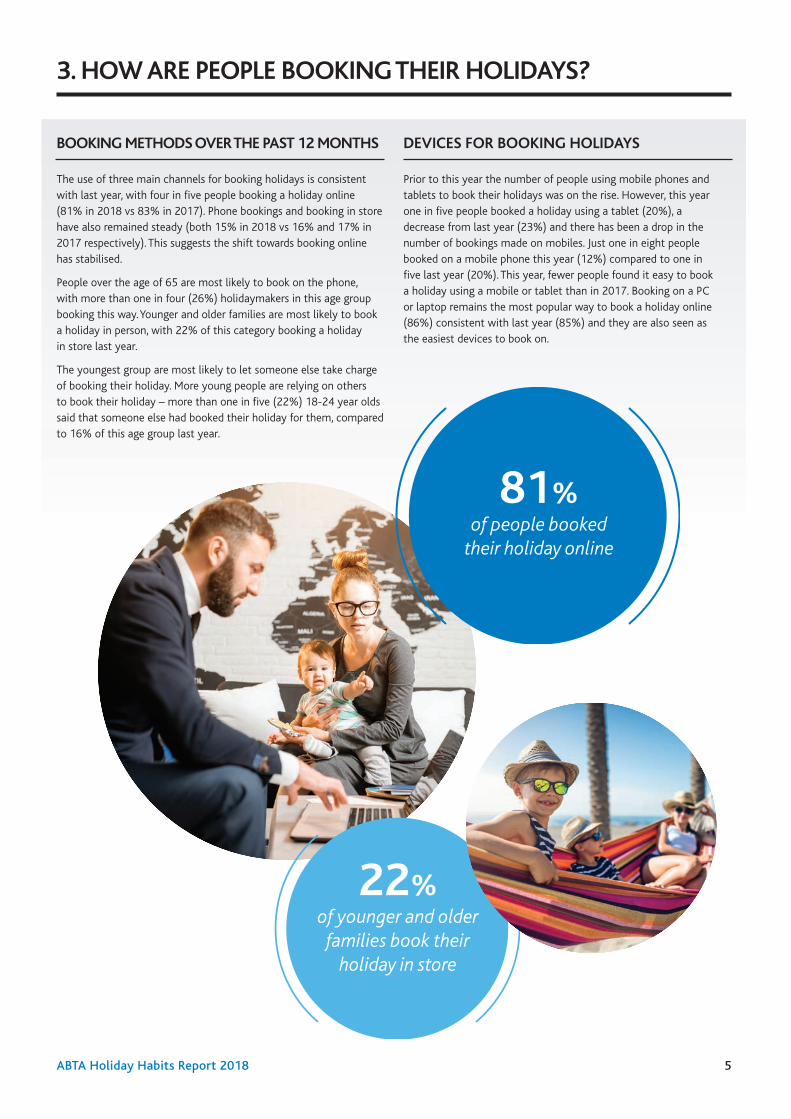
The use of three main channels for booking holidays is consistent with last year, with four in five people booking a holiday online (81% in 2018 vs 83% in 2017). Phone bookings and booking in store have also remained steady (both 15% in 2018 vs 16% and 17% in 2017 respectively). This suggests the shift towards booking online has stabilised.
People over the age of 65 are most likely to book on the phone, with more than one in four (26%) holidaymakers in this age group booking this way. Younger and older families are most likely to book a holiday in person, with 22% of this category booking a holiday in store last year.
The youngest group are most likely to let someone else take charge of booking their holiday. More young people are relying on others to book their holiday – more than one in five (22%) 18-24 year olds said that someone else had booked their holiday for them, compared to 16% of this age group last year.
DEVICES FOR BOOKING HOLIDAYS
Prior to this year the number of people using mobile phones and tablets to book their holidays was on the rise. However, this year one in five people booked a holiday using a tablet (20%), a decrease from last year (23%) and there has been a drop in the number of bookings made on mobiles. Just one in eight people booked on a mobile phone this year (12%) compared to one in five last year (20%). This year, fewer people found it easy to book a holiday using a mobile or tablet than in 2017. Booking on a PC or laptop remains the most popular way to book a holiday online (86%) consistent with last year (85%) and they are also seen as the easiest devices to book on.
ABTA Holiday Habits Report 2018 5
3. HOW ARE PEOPLE BOOKING THEIR HOLIDAYS?
81%of people booked
their holiday online
22%of younger and older
families book their holiday in store

4. WHO DID PEOPLE BOOK THEIR HOLIDAYS WITH?
6 ABTA Holiday Habits Report 2018
The preferred method for booking a holiday abroad is directly though a service provider, with almost half of people booking a holiday overseas in this way (47%) – up from 43% in 2017. The next most popular methods are through a holiday booking website (41%) and through a travel company or travel agent (40%) – with little difference between the two.
People over 65 are the most likely to book a holiday abroad with a travel company or agent (45%), booking in this way is most popular in the North East where 50% used this method. For a UK break, those aged 25-34 and 75+ are most likely to book via a travel company or agent (26%).
For domestic holidays, people still prefer to book through a holiday booking website (48%) or directly with the service providers (46%).
Interestingly there have been some changes among the most and least well-off travellers. People in social grade A and E were more likely to book their UK holiday through a travel company or travel agent this year, up 6% and 4% respectively. As were people in London, Wales, North East and the West Midlands (up, 9%, 3%, 1% and 1% respectively).
TABLE 7Who holidays have been booked with in 2018
UKHOLIDAYS
HOLIDAYSABROAD
0% 10% 20% 30% 40% 50%
40
20
11
12
41
48
47
46
VIA A HOME SHARING OROWNERS LETTING SITE (e.g. Airbnb, Owners Direct)
VIA A TRAVEL COMPANY OR AGENT THAT SELLS HOLIDAYS
A GENERAL HOLIDAY BOOKING WEBSITE (e.g. Opodo, booking.com)
DIRECTLY WITH SERVICE PROVIDERS (e.g. airline and/or a hotel/villa)
WHO DID YOU BOOK YOUR HOLIDAY WITH IN THE PAST 12 MONTHS?
TABLE 6 Who holidays have been booked with in 2018
WHY PEOPLE BOOK WITH TRAVEL PROFESSIONALS
Over a third (36%) of people have booked a holiday with a travel professional in the past year, similar to last year (38%). The main reasons people use a travel professional to book are the ease of booking (58%), because it saves them time (51%) and the fact that they feel more confident booking through them (45%).
Older people are the most likely to cite ease of booking, with over three quarters (77%) of those aged 75+ and 73% of those 65+ stating this. By contrast, for younger people (34 and under) and families the main reason for using a travel professional is because it saves them time (54% and 56% respectively). A fifth of 25-34 years olds also feel they have a better holiday when they book through one – more than any other age range.
For older families with children over five, time is at a premium and they are the group who tend to use a travel professional because it saves them time (59%).
This year, for the first time, the research asked people about what they did after they spoke to a travel professional. Just under a third (30%) had spoken to a travel professional about their last holiday – with 93% saying they went onto book with the company. Two in five (40%) booked in store, 30% booked online and one in four (23%) booked over the phone. Only 7% of people said they spoke to a travel professional and then booked with another travel company or organised the holiday themselves. The findings show that if businesses engage a customer in their expertise, they have more than a nine in ten chance of converting that conversation into a sale.

69%choose a package
holiday because everything is taken care of
The package holiday continues to be a popular choice for UK travellers. This year, about half of UK holidaymakers took a package holiday abroad (49%), steady with last year’s figures (51%).
The most common reason for choosing a package holiday is having everything taken care of, with seven in ten people (69%) who booked a package stating this. However this has dropped by 6% since last year, whereas value for money has risen up the priority list. Six in ten (60%) said that they booked a package because it was the best value option for the price – up 3% on last year. The time saving benefits of booking a package also proved important, with 39% of people who booked a package saying they did this for convenience.
The number of people booking travel and accommodation from different companies has stayed consistent with last year, with 50% booking their holidays abroad this way (49% last year) and has increased slightly from last year for UK trips (39% vs 37%).
Given the new package travel regulations (which came into force on 1 July 2018) will make more holiday travel arrangements packages, it will be interesting to see how these figures may change over the next 12 months.
ABTA Holiday Habits Report 2018 7
WHAT HAS BEEN BOOKED IN THE PAST 12 MONTHS
UKHOLIDAYS
HOLIDAYSABROAD
TABLE 7What has been booked in the past 12 months
23%
49%
UKHOLIDAYS
HOLIDAYSABROAD
39%
50%
UKHOLIDAYS
HOLIDAYSABROAD
52%
24%
7
A holiday where you booked travel and accommodation yourself, from different travel companies
Travel only or accommodation only, for the purpose of a holiday
A package holiday where your travel and accommodation were included in the same price
5. THE PACKAGE HOLIDAY

Cruise holidays have been taken by one in 12 (8%) of respondents in the past 12 months, with one in eight (12%) considering going on one in the next 12 months. As with last year, three quarters of people have yet to go on a cruise holiday, with 39% of respondents saying they have not been on a cruise but are interested. Though the younger age groups are less likely to have been on a cruise holiday, they are open to the idea. 53% of 18-24 year olds are interested in taking a cruise (but have not done so previously), followed by 45% of 25-34 year olds. In recent years cruise companies have clearly recognised this market potential – by developing ships and itineraries designed specifically for these generations as well as through more targeted marketing campaigns.
Among people who have been on a cruise, people aged 65+ are most likely to want to go on another one (29%). People who have taken a cruise holiday most valued the quality of the food and drink available (78%) and the chance to see multiple destinations (76%) – these two options have switched around since 2017. Quality of accommodation is another element people value (64%), this was the most popular reason cited by the youngest age groups (18-34). This year we asked for the first time about the variety of itineraries, and over half (51%) of people said they valued this when on a cruise.
8 ABTA Holiday Habits Report 2018
HAVE YOU BEEN ON A CRUISE HOLIDAY?
WHAT DO PEOPLE VALUE ABOUT CRUISE HOLIDAYS?
NO, I HAVE NOT BEEN ON ONE BUT AM INTERESTED 39%
NO, I HAVE NOT BEEN ON ONE AND HAVE NO INTENTION OF GOING 36%
YES, I HAVE BEEN ON ONE AND WANT TO GO AGAIN 19%
YES, I HAVE BEEN ON ONE BUT DON’T WANT TO GO AGAIN 6%
80%
CHANCE TO SEE MULTIPLE DESTINATIONS
70%
EASE OFTRAVEL
35%
GLAMOUR OF A CRUISE
76%
QUALITY OF FOOD & DRINK OFFERING
38%
SOCIALISING WITHOTHER PASSENGERS
58%
ON-BOARD ENTERTAINMENT OPTIONS
63%
QUALITY OF ACCOMMODATION
CHANCE TO SEE MULTIPLE DESTINATIONS
ON-BOARD ENTERTAINMENT OPTIONS
SOCIALISING WITHOTHER PASSENGERS
GLAMOUR OF A CRUISE
QUALITY OF FOOD & DRINK OFFERING
QUALITY OF ACCOMMODATION
EASE OFTRAVEL
80%
xx%
2017
2018
76%
xx%
2017
2018
63%
xx%
2017
2018
58%
xx%
2017
2018
38%
xx%
2017
2018
35%
xx%
2017
2018
70%
xx%
2017
2018
CHANCE TO SEE MULTIPLE DESTINATIONS
ON-BOARD ENTERTAINMENT OPTIONS
SOCIALISING WITHOTHER PASSENGERS
GLAMOUR OF A CRUISE
QUALITY OF FOOD & DRINK OFFERING
QUALITY OF ACCOMMODATION
EASE OFTRAVEL
74%
80%
2016
2017
69%
76%
2016
2017
68%
63%
2016
2017
51%
58%
2016
2017
32%
38%
2016
2017
28%
35%
2016
2017
67%
70%
2016
2017
QUALITY OF FOOD & DRINK OFFERING 76% 78%
CHANCE TO SEE MULTIPLE DESTINATIONS 80% 76%
EASE OF TRAVEL 70% 68%
QUALITY OF ACCOMMODATION 63% 64%
VARIETY OF ITINERARIES AVAILABLE N/A 51%
ON-BOARD ENTERTAINMENT OPTIONS 58% 48%
VALUE FOR MONEY N/A 42%
SOCIALISING WITH OTHER PASSENGERS 38% 34%
GLAMOUR OF A CRUISE 35% 29%
ON-BOARD ACTIVITIES (eg surfing) N/A 22%
2017 2018 2017 2018
6. CRUISE HOLIDAYS
TABLE 8 Have you been on a cruise holiday?
TABLE 9 What people who have been on a cruise most value about cruise holidays
53%of 18-24 year olds who
have not been on a cruise would like to go on one

As with the past 12 months, the findings suggest that holidays are a spending priority for the year ahead, despite the political uncertainty.
More than half of people (51%) said they will spend the same on their holiday next year (up from 47% in 2017), however fewer people are planning to spend more (25% compared to 31% in 2017). The number of people who said they will spend less is consistent with last year at 14%. This suggests a slightly more cautious approach to holiday spending for next year.
The main reason people said they plan to spend more is to get the destination they want – 28% (up from 23% last year), rising to 35% for 18-24 year olds and 55-64 year olds so the competition for popular destinations is set to continue next year. For 18-24 year
olds taking a trip of a lifetime is the most popular reason for a planned increase in holiday spend, where four in ten (40%) cited this as a reason.
There are just five months, from October 2018 until the UK leaves the EU, and the final arrangements are still to be agreed. There have been some increases in peoples’ levels of confusion and concerns about the impact of Brexit on their holidays: a 7% increase in people who are confused about how Brexit will affect their holidays (43% vs 36% last year), and an increase in both people’s concerns about cost (54% vs 51% last year) and that it will be harder to travel (48% vs 43% last year) after Brexit.
7. OUTLOOK FOR THE YEAR AHEAD
ABTA Holiday Habits Report 2018 9
WHAT CONSUMERS ARE EXPECTING TO SPEND ON NEXT YEAR’S HOLIDAY
More
Less
Unsure
About the same
TABLE 13Chart showing what consumers are planning to spend on their holidayss
14%
31%
9%47%
2018
2017
018
017
More
25%
31%
14%
14%
10%
9%
51%
47%
Less Unsure About the same
2017
2016
7
6
More
31%
24%
14%
16%
9%
11%
47%
49%
Less Unsure About the same
£
TABLE 10 What consumers are planning to spend on their holidays in 2018
28%of people will be spending more money next year to make sure they go to the
destination they want

Looking ahead, more than two-fifths of British holidaymakers (45%) are planning to visit a new country in the next 12 months – similar to 2017 (46%).
Europe tops the list of places people plan to travel to in the next 12 months (61%). This is a slight reduction compared to last year (63%). More holidaymakers are looking to Asia as a destination for the year ahead (13% plan to visit compared to 10% last year).
The availability of cheap long-haul flights to Asian destinations, as well as a favourable exchange rate, may be driving the popularity of Asia.
Beach holidays look set to increase in popularity, with 44% of people planning on taking one (compared to 40% who took one in the past 12 months), while city breaks look set to track in line with this year.
7. OUTLOOK FOR THE YEAR AHEAD CONTINUED
10 ABTA Holiday Habits Report 2018
POPULAR DESTINATIONS IN NEXT 12 MONTHS
TABLE 11 Where people are planning to travel in the next 12 months
45%of British holidaymakers
plan to visit a new country in the next 12 months

DID YOU KNOW...
ABOUT THE RESEARCH
ABOUT ABTA
Email: [email protected]
Web: abta.com
Twitter: @ABTAtravel
Facebook: ABTAlovetravel
ABTA Ltd
Post: 30 Park Street, London, SE1 9EQ
Tel: +44 (0)20 3117 0500
Fax: +44 (0)20 3117 0581
ABTA has been a trusted travel brand for over 65 years. Our purpose is to help our Members to grow their businesses successfully and sustainably, and to help their customers travel with confidence.
The ABTA brand stands for support, protection and expertise. This means consumers have confidence in ABTA and a strong trust in ABTA Members. These qualities are core to us as they ensure that holidaymakers remain confident in the holiday products that they buy from our Members.
We help our Members and their customers navigate through today’s changing travel landscape by raising
standards in the industry; offering schemes of financial protection; providing an independent complaints resolution service should something go wrong; giving guidance on issues from sustainability to health and safety and by presenting a united voice to government to ensure the industry and the public get a fair deal.
ABTA currently has around 1,200 Members with a combined annual UK turnover of £38 billion. For more details about what we do, what being an ABTA Member means and how we help the British public travel with confidence, visit abta.com.
Consumer research was conducted by Arkenford Ltd (www.arkenford.co.uk) who specialise in leisure and tourism market research. The ABTA Consumer Trends survey generated responses from a nationally representative sample of 2,001 consumers using an
online research methodology and related to holiday booking habits in the 12 months to August 2018. Fieldwork was conducted between the end of July and the beginning of August 2018.
CONTACT US
65%
75% 74%
62%
of people expect their holiday company to be a Member of ABTA
of people feel more confident
booking a holiday with an ABTA Member
of people feel less positively about companies that are not ABTA Members
J J J ABTA was voted both a Business and Consumer Superbrand in 2018 J J J
J J J ABTA is ranked the UK’s most trusted travel association J J J
of people feel that ABTA’s help and advice
in the event of a crisis is essential