hmis bulletin - national health mission bulletin - nov...hmis bulletin (health management...
TRANSCRIPT

HMIS Bulletin (Health Management Information System)
National Health Mission
Govt. of Uttar Pradesh
Prepared by:-
MIS Division
State Program Management Unit
Uttar Pradesh

S. No
1
1.1 Sterilization
1.2 Sterilization Quality
1.3 IUD
1.4 CC and OCP Users
2
2.1 BCG
2.2 Measles
2.3 Fully Immunization
3
3.1 Antenatal Care
3.2 Pregnancy complications
3.3 Delivery
3.4 JSY
3.5 C Section and Complications
3.6 Institutional Delvery and New Born Care
3.7 MTP Services and Pregnancey loss
3.8 Sex ratio at Birth
3.9 Childhood Disease
3.10 Maternal and Child death
4
4.1OPD, IPD and Lab Test conducted at public health
facilities
4.2 Facilities not conducted essential hospital services
Maternal and Child Care Programme
Prepared by:-
MIS Unit
State Programme Management Unit
(National Health Mission)
HMIS
(National Health Mission Bulletin)Uttar Pradesh
Apr-Nov (2017-18)
Services
Family Welfare
Child Immunization
(As on 15 Dec 2017)
Hospital services

Leprosc
opic
sterilizat
ion
Minilap Post
Partum
Post
abortio
n
Total
Steriliz
ation
Inst.
Delivery
1 Agra 21095 32151 62 1143 894 138 147 2384 11 6 0
2 Aligarh 17467 42276 71 756 23 15 0 865 5 2 0
3 Allahabad 28868 47423 284 3022 197 310 37 3850 13 8 1
4 Ambedkar Nagar 11833 23102 1 0 288 28 5 322 3 9 0
5 Auraiya 6888 11046 0 53 2 0 0 55 1 0 0
6 Azamgarh 23085 32825 23 1627 39 146 0 1835 8 8 0
7 Bagpat 6797 10408 183 622 0 19 0 824 12 2 0
8 Bahraich 13925 37266 51 994 18 46 25 1134 8 4 0
9 Ballia 16075 27103 4 499 56 13 3 575 4 2 0
10 Balrampur 9849 22853 8 173 29 5 0 215 2 2 0
11 Banda 8755 24138 0 0 260 52 68 380 4 14 0
12 Barabanki 15611 31991 44 945 151 293 14 1447 9 20 1
13 Bareilly 21036 34527 92 1679 46 322 21 2160 10 15 1
14 Basti 12089 23354 0 121 2 14 50 187 2 7 0
15 Bijnor 18289 36898 10 2192 57 92 13 2364 13 4 0
16 Budaun 15421 32946 5 311 107 29 45 497 3 6 0
17 Bulandshahar 17072 23729 140 1051 146 13 0 1350 8 1 0
18 C S M Nagar 11477 19852 0 320 88 2 0 410 4 0 0
19 Chandauli 9582 12912 16 4 1713 120 36 1889 20 6 1
20 Chitrakoot 4668 13787 1 0 213 4 0 218 5 2 0
21 Deoria 15952 30595 6 725 10 7 0 748 5 1 0
22 Etah 8690 15664 4 173 85 7 0 269 3 3 0
23 Etawah 7832 23383 4 500 0 132 0 636 8 21 1
24 Faizabad 12084 29708 12 123 187 41 0 363 3 11 0
25 Farrukhabad 9208 14496 5 306 39 10 32 392 4 3 0
26 Fatehpur 13466 25103 2 269 11 53 28 363 3 15 0
27 Firozabad 11956 22411 9 939 81 5 43 1077 9 0 0
28 Gautam Buddha Nagar 6957 27367 40 1166 22 475 132 1835 26 26 2
29 Ghaziabad 13359 21740 16 892 135 31 0 1074 8 3 0
30 Ghazipur 17814 31338 24 760 89 50 0 923 5 5 0
31 Gonda 16165 31276 12 366 16 127 11 532 3 24 0
32 Gorakhpur 22114 33999 94 2362 772 16 33 3277 15 0 0
33 Hamirpur 6087 14182 50 0 1137 0 0 1187 20 0 0
34 Hapur 5863 4755 8 367 0 0 0 375 6 0 0
35 Hardoi 19852 42709 25 890 99 49 8 1071 5 5 0
36 Hathras 7784 14008 0 262 3 31 3 299 4 10 0
37 Jalaun 8499 15142 3 3 819 11 1 837 10 1 0
38 Jaunpur 22856 37225 20 1318 82 143 1 1564 7 9 0
39 Jhansi 10201 16954 39 19 386 141 7 592 6 24 1
40 Jyotiba Phule Nagar 8750 12521 2 1043 0 0 0 1045 12 0 0
41 Kannauj 8093 21784 3 0 120 14 0 137 2 10 0
42 Kanpur Dehat 9251 15454 3 30 51 20 10 114 1 18 0
43 Kanpur Nagar 24179 59126 134 709 601 216 0 1660 7 13 0
44 Kashi Ram Nagar 7603 14371 0 96 38 18 9 161 2 11 0
45 Kaushambi 7560 22547 30 384 59 40 0 513 7 8 0
46 Kushinagar 16902 31886 0 0 121 0 0 121 1 0 0
STERILIZATION BY METHOD & POST PARTUM STERILIZATION
Apr-Nov (2017-18)
Sterilization by MethodS. No Districts Inst.
Delivery
Annual
workload
as per
NHM for
sterilizatio
n
TotalMale
Sterilizati
on (NSV)
% of
Sterilizat
ion
against
NHM
Workloa
d
% of PP
Sterilization to Female sterilization

Leprosc
opic
sterilizat
ion
Minilap Post
Partum
Post
abortio
n
Total
Steriliz
ation
Inst.
Delivery
STERILIZATION BY METHOD & POST PARTUM STERILIZATION
Apr-Nov (2017-18)
Sterilization by MethodS. No Districts Inst.
Delivery
Annual
workload
as per
NHM for
sterilizatio
n
TotalMale
Sterilizati
on (NSV)
% of
Sterilizat
ion
against
NHM
Workloa
d
% of PP
Sterilization to Female sterilization
47 Lakhimpur Kheri 18700 45990 85 1540 212 58 1 1896 10 3 0
48 Lalitpur 5709 18500 5 0 2321 71 13 2410 42 3 0
49 Lucknow 21517 36079 432 1093 288 1028 387 3228 15 32 3
50 Maharajganj 12666 25063 42 1039 65 13 0 1159 9 1 0
51 Mahoba 4140 9399 2 0 875 18 13 908 22 2 0
52 Mainpuri 9304 15610 0 154 0 0 0 154 2 0 0
53 Mathura 12095 23324 84 501 778 64 0 1427 12 4 0
54 Maunathbhanjan 10809 22870 1 172 132 6 0 311 3 2 0
55 Meerut 17537 16208 79 1017 52 297 2 1447 8 21 2
56 Mirzapur 12356 22746 6 788 199 78 5 1076 9 7 0
57 Moradabad 14455 21607 15 337 147 288 32 819 6 35 1
58 Muzaffarnagar 13717 34537 17 1144 31 470 384 2046 15 23 1
59 Pilibhit 9609 16223 22 855 26 163 17 1083 11 15 1
60 Pratapgarh 15936 27482 26 528 252 59 2 867 5 7 0
61 Rae Bareli 11940 30871 49 490 13 112 21 685 6 16 0
62 Rampur 11225 15534 8 270 0 44 0 322 3 14 0
63 Saharanpur 16640 28454 21 1036 204 384 0 1645 10 23 1
64 Sambhal 9956 17013 3 382 0 0 0 385 4 0 0
65 Sant Kabir Nagar 8328 19180 8 349 45 15 2 419 5 4 0
66 Sant Ravidas Nagar 7901 14602 6 2 645 0 0 653 8 0 0
67 Shahjahanpur 14896 30755 29 1166 143 19 0 1357 9 1 0
68 Shamli 6967 10700 4 554 0 0 0 558 8 0 0
69 Shrawasti 6866 18275 0 4 3 0 0 7 0 0 0
70 Siddharth Nagar 11908 23906 2 140 38 32 19 231 2 14 0
71 Sitapur 21132 51523 14 1926 69 41 212 2262 11 2 0
72 Sonbhadra 8547 16921 32 4 398 22 0 456 5 5 0
73 Sultanpur 12013 26411 0 20 174 106 8 308 3 34 0
74 Unnav 15776 17950 13 233 28 0 0 274 2 0 0
75 Varanasi 18396 23749 28 2683 632 323 102 3768 20 9 1
Uttar Pradesh 970000 1851813 2573 47641 17062 7009 2002 76287 8 9 0.38
High Priority
District>100% >35, <=100 >10, <=35 <=10
0.3785
District performance:
NSV3%
Leproscopic sterilization 63%
Minilap 22%
Post Partum 9%
Post abortion 3%
Distribution of sterilization by method

1 Agra 62 2322 0 0 17 1 1 2 16 1 0 0 0 0
2 Aligarh 71 794 0 0 0 0 0 0 17 2 0 0 0 0
3 Allahabad 284 3566 0 0 0 0 0 0 0 0 0 0 0 0
4 Ambedkar Nagar 1 321 0 0 1 0 0 0 1 0 0 0 0 0
5 Auraiya 0 55 0 0 0 0 0 0 0 0 0 0 0 0
6 Azamgarh 23 1812 0 0 1 0 0 0 10 1 0 0 0 0
7 Bagpat 183 641 0 0 0 0 1 1 0 0 0 0 0 0
8 Bahraich 51 1083 0 0 2 0 4 8 79 7 0 0 0 0
9 Ballia 4 571 0 0 0 0 0 0 0 0 0 0 0 0
10 Balrampur 8 207 0 0 0 0 0 0 0 0 0 0 0 0
11 Banda 0 380 0 0 0 0 16 0 0 0 0 0 0 0
12 Barabanki 44 1403 0 0 0 0 51 116 34 2 0 0 0 0
13 Bareilly 92 2068 0 0 0 0 1 1 16 1 0 0 0 0
14 Basti 0 187 0 0 0 0 1 0 0 0 0 0 0 0
15 Bijnor 10 2354 0 0 2 0 31 310 41 2 0 0 0 0
16 Budaun 5 492 0 0 0 0 0 0 9 2 0 0 0 0
17 Bulandshahar 140 1210 0 0 898 74 21 15 30 2 13 0 11 1
18 C S M Nagar 0 410 0 0 1 0 0 0 13 3 0 0 0 0
19 Chandauli 16 1873 0 0 0 0 0 0 10 1 0 0 0 0
20 Chitrakoot 1 217 0 0 0 0 0 0 0 0 0 0 0 0
21 Deoria 6 742 0 0 0 0 0 0 0 0 0 0 0 0
22 Etah 4 265 0 0 1 0 45 1125 159 60 0 0 0 0
23 Etawah 4 632 0 0 0 0 0 0 1 0 0 0 0 0
24 Faizabad 12 351 0 0 0 0 1 8 32 9 0 0 0 0
25 Farrukhabad 5 387 0 0 7 2 0 0 70 18 0 0 0 0
26 Fatehpur 2 361 0 0 0 0 0 0 3 1 0 0 0 0
27 Firozabad 9 1068 0 0 0 0 1 11 0 0 0 0 0 0
28 Gautam Buddha Nagar 40 1795 0 0 2 0 0 0 0 0 0 0 0 0
29 Ghaziabad 16 1058 0 0 1 0 4 25 46 4 0 0 0 0
30 Ghazipur 24 899 0 0 0 0 0 0 2 0 0 0 0 0
31 Gonda 12 520 1 8 6 1 2 17 76 15 0 0 0 0
32 Gorakhpur 94 3183 0 0 0 0 0 0 0 0 0 0 0 0
33 Hamirpur 50 1137 0 0 0 0 0 0 0 0 0 0 0 0
34 Hapur 8 367 0 0 0 0 1 13 33 9 0 0 0 0
35 Hardoi 25 1046 0 0 0 0 28 112 2 0 0 0 0 0
36 Hathras 0 299 0 0 0 0 0 0 2 1 0 0 0 0
37 Jalaun 3 834 0 0 0 0 2 67 30 4 0 0 0 0
38 Jaunpur 20 1544 0 0 0 0 0 0 24 2 0 0 0 0
39 Jhansi 39 553 0 0 0 0 2 5 8 1 0 0 0 0
40 Jyotiba Phule Nagar 2 1043 0 0 1 0 0 0 3 0 0 0 0 0
41 Kannauj 3 134 0 0 0 0 22 733 14 10 0 0 0 0
42 Kanpur Dehat 3 111 0 0 0 0 0 0 0 0 0 0 0 0
43 Kanpur Nagar 134 1526 0 0 1 0 0 0 17 1 0 0 0 0
44 Kashi Ram Nagar 0 161 0 0 0 0 0 0 71 44 0 0 0 0
45 Kaushambi 30 483 0 0 0 0 0 0 2 0 0 0 0 0
46 Kushinagar 0 121 0 0 0 0 0 0 0 0 0 0 0 0
47 Lakhimpur Kheri 85 1811 0 0 1 0 20 24 149 8 0 0 0 0
48 Lalitpur 5 2405 0 0 0 0 2 40 20 1 0 0 0 0
49 Lucknow 432 2796 0 0 1 0 54 13 64 2 0 0 0 0
50 Maharajganj 42 1117 0 0 0 0 0 0 0 0 0 0 0 0
51 Mahoba 2 906 0 0 0 0 0 0 1 0 0 0 0 0
52 Mainpuri 0 154 0 0 0 0 0 0 0 0 0 0 0 0
53 Mathura 84 1343 0 0 0 0 0 0 24 2 0 0 0 0
54 Maunathbhanjan 1 310 0 0 0 0 0 0 9 3 0 0 0 0
55 Meerut 79 1368 0 0 0 0 7 9 50 4 0 0 0 0
56 Mirzapur 6 1070 0 0 0 0 4 67 135 13 0 0 0 0
57 Moradabad 15 804 0 0 0 0 5 33 63 8 0 0 0 0
58 Muzaffarnagar 17 2029 0 0 2 0 9 53 26 1 0 0 0 0
59 Pilibhit 22 1061 0 0 8 1 0 0 6 1 0 0 0 0
60 Pratapgarh 26 841 4 15 7 1 19 73 35 4 0 0 0 0
61 Rae Bareli 49 636 0 0 1 0 12 24 99 16 0 0 0 0
62 Rampur 8 314 0 0 3 1 61 763 37 12 0 0 0 0
63 Saharanpur 21 1624 0 0 0 0 0 0 67 4 0 0 0 0
64 Sambhal 3 382 0 0 0 0 0 0 18 5 0 0 0 0
65 Sant Kabir Nagar 8 411 0 0 0 0 1 13 21 5 0 0 0 0
66 Sant Ravidas Nagar 6 647 0 0 1 0 0 0 5 1 0 0 0 0
67 Shahjahanpur 29 1328 0 0 0 0 5 17 100 8 0 0 0 0
68 Shamli 4 554 0 0 0 0 0 0 3 1 0 0 0 0
69 Shrawasti 0 7 0 0 0 0 0 0 0 0 0 0 0 0
70 Siddharth Nagar 2 229 0 0 0 0 0 0 0 0 0 0 0 0
71 Sitapur 14 2248 0 0 0 0 0 0 0 0 0 0 0 0
72 Sonbhadra 32 424 0 0 0 0 3 9 56 13 0 0 0 0
73 Sultanpur 0 308 0 0 0 0 0 0 1 0 0 0 0 0
74 Unnav 13 261 0 0 15 6 0 0 31 12 0 0 0 0
75 Varanasi 28 3740 0 0 0 0 12 43 50 1 0 0 0 0
Uttar Pradesh 2573 73714 5 0 980 1 449 17 1941 3 13 0 11 0
Data quality issues highlighted for varification and confirmation
Female
(Number
)
Female
(%)
Death
STERILIZATION - Quality report
Apr-Nov (2017-18)
Male
(Number
)
Male (%)
Failure
Male (%) Female
(%)
Complication
Female
(Number
)
Female
(%)
Female Male
(Number
)
Female
(Number
)
Male
(Number
)
Male (%)
S. No Districts Sterilization
Male
Public
facility
Private
facility
Total Public
facility
Total
PPIUCD
at any
facility
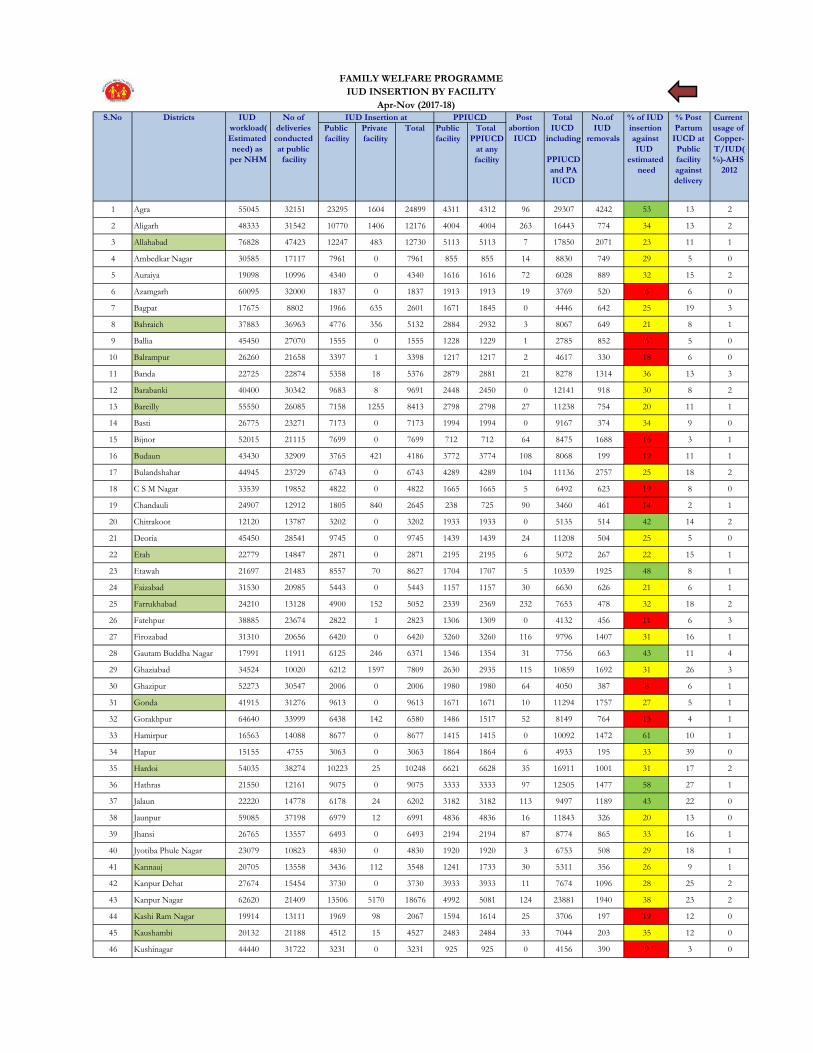
1 Agra 55045 32151 23295 1604 24899 4311 4312 96 29307 4242 53 13 2
2 Aligarh 48333 31542 10770 1406 12176 4004 4004 263 16443 774 34 13 2
3 Allahabad 76828 47423 12247 483 12730 5113 5113 7 17850 2071 23 11 1
4 Ambedkar Nagar 30585 17117 7961 0 7961 855 855 14 8830 749 29 5 0
5 Auraiya 19098 10996 4340 0 4340 1616 1616 72 6028 889 32 15 2
6 Azamgarh 60095 32000 1837 0 1837 1913 1913 19 3769 520 6 6 0
7 Bagpat 17675 8802 1966 635 2601 1671 1845 0 4446 642 25 19 3
8 Bahraich 37883 36963 4776 356 5132 2884 2932 3 8067 649 21 8 1
9 Ballia 45450 27070 1555 0 1555 1228 1229 1 2785 852 6 5 0
10 Balrampur 26260 21658 3397 1 3398 1217 1217 2 4617 330 18 6 0
11 Banda 22725 22874 5358 18 5376 2879 2881 21 8278 1314 36 13 3
12 Barabanki 40400 30342 9683 8 9691 2448 2450 0 12141 918 30 8 2
13 Bareilly 55550 26085 7158 1255 8413 2798 2798 27 11238 754 20 11 1
14 Basti 26775 23271 7173 0 7173 1994 1994 0 9167 374 34 9 0
15 Bijnor 52015 21115 7699 0 7699 712 712 64 8475 1688 16 3 1
16 Budaun 43430 32909 3765 421 4186 3772 3774 108 8068 199 19 11 1
17 Bulandshahar 44945 23729 6743 0 6743 4289 4289 104 11136 2757 25 18 2
18 C S M Nagar 33539 19852 4822 0 4822 1665 1665 5 6492 623 19 8 0
19 Chandauli 24907 12912 1805 840 2645 238 725 90 3460 461 14 2 1
20 Chitrakoot 12120 13787 3202 0 3202 1933 1933 0 5135 514 42 14 2
21 Deoria 45450 28541 9745 0 9745 1439 1439 24 11208 504 25 5 0
22 Etah 22779 14847 2871 0 2871 2195 2195 6 5072 267 22 15 1
23 Etawah 21697 21483 8557 70 8627 1704 1707 5 10339 1925 48 8 1
24 Faizabad 31530 20985 5443 0 5443 1157 1157 30 6630 626 21 6 1
25 Farrukhabad 24210 13128 4900 152 5052 2339 2369 232 7653 478 32 18 2
26 Fatehpur 38885 23674 2822 1 2823 1306 1309 0 4132 456 11 6 3
27 Firozabad 31310 20656 6420 0 6420 3260 3260 116 9796 1407 31 16 1
28 Gautam Buddha Nagar 17991 11911 6125 246 6371 1346 1354 31 7756 663 43 11 4
29 Ghaziabad 34524 10020 6212 1597 7809 2630 2935 115 10859 1692 31 26 3
30 Ghazipur 52273 30547 2006 0 2006 1980 1980 64 4050 387 8 6 1
31 Gonda 41915 31276 9613 0 9613 1671 1671 10 11294 1757 27 5 1
32 Gorakhpur 64640 33999 6438 142 6580 1486 1517 52 8149 764 13 4 1
33 Hamirpur 16563 14088 8677 0 8677 1415 1415 0 10092 1472 61 10 1
34 Hapur 15155 4755 3063 0 3063 1864 1864 6 4933 195 33 39 0
35 Hardoi 54035 38274 10223 25 10248 6621 6628 35 16911 1001 31 17 2
36 Hathras 21550 12161 9075 0 9075 3333 3333 97 12505 1477 58 27 1
37 Jalaun 22220 14778 6178 24 6202 3182 3182 113 9497 1189 43 22 0
38 Jaunpur 59085 37198 6979 12 6991 4836 4836 16 11843 326 20 13 0
39 Jhansi 26765 13557 6493 0 6493 2194 2194 87 8774 865 33 16 1
40 Jyotiba Phule Nagar 23079 10823 4830 0 4830 1920 1920 3 6753 508 29 18 1
41 Kannauj 20705 13558 3436 112 3548 1241 1733 30 5311 356 26 9 1
42 Kanpur Dehat 27674 15454 3730 0 3730 3933 3933 11 7674 1096 28 25 2
43 Kanpur Nagar 62620 21409 13506 5170 18676 4992 5081 124 23881 1940 38 23 2
44 Kashi Ram Nagar 19914 13111 1969 98 2067 1594 1614 25 3706 197 19 12 0
45 Kaushambi 20132 21188 4512 15 4527 2483 2484 33 7044 203 35 12 0
46 Kushinagar 44440 31722 3231 0 3231 925 925 0 4156 390 9 3 0
Total
IUCD
including
PPIUCD
and PA
IUCD
FAMILY WELFARE PROGRAMME
IUD INSERTION BY FACILITY
Apr-Nov (2017-18)
Current
usage of
Copper-
T/IUD(
%)-AHS
2012
IUD
workload(
Estimated
need) as
per NHM
% of IUD
insertion
against
IUD
estimated
need
% Post
Partum
IUCD at
Public
facility
against
delivery
S.No Districts IUD Insertion at No.of
IUD
removals
No of
deliveries
conducted
at public
facility
PPIUCD Post
abortion
IUCD

Public
facility
Private
facility
Total Public
facility
Total
PPIUCD
at any
facility
Total
IUCD
including
PPIUCD
and PA
IUCD
FAMILY WELFARE PROGRAMME
IUD INSERTION BY FACILITY
Apr-Nov (2017-18)
Current
usage of
Copper-
T/IUD(
%)-AHS
2012
IUD
workload(
Estimated
need) as
per NHM
% of IUD
insertion
against
IUD
estimated
need
% Post
Partum
IUCD at
Public
facility
against
delivery
S.No Districts IUD Insertion at No.of
IUD
removals
No of
deliveries
conducted
at public
facility
PPIUCD Post
abortion
IUCD
47 Lakhimpur Kheri 51005 42277 3309 0 3309 3277 3277 19 6605 455 13 8 1
48 Lalitpur 15150 17968 3277 0 3277 4380 4380 0 7657 376 51 24 0
49 Lucknow 56055 36079 4854 24 4878 8241 8241 788 13907 1400 25 23 3
50 Maharajganj 38602 24687 5271 0 5271 1792 1792 5 7068 1328 18 7 0
51 Mahoba 13130 9399 3182 0 3182 1399 1399 4 4585 1017 35 15 2
52 Mainpuri 27771 14078 13726 0 13726 756 756 0 14482 1017 52 5 1
53 Mathura 32500 17510 6537 93 6630 1941 1941 12 8583 1496 26 11 1
54 Maunathbhanjan 29795 16022 1585 0 1585 861 861 0 2446 37 8 5 0
55 Meerut 45450 14301 5357 58 5415 2073 2073 20 7508 1343 17 14 2
56 Mirzapur 31739 22746 5794 0 5794 2376 2376 43 8213 1468 26 10 1
57 Moradabad 38097 14392 6598 0 6598 2718 2718 65 9381 1520 25 19 1
58 Muzaffarnagar 37973 18467 3115 0 3115 1725 1725 2 4842 1274 13 9 2
59 Pilibhit 25755 13785 3334 0 3334 2365 2365 4 5703 573 22 17 1
60 Pratapgarh 42420 24941 4419 0 4419 807 807 5 5231 1169 12 3 0
61 Rae Bareli 32492 27858 4798 13 4811 2387 2387 6 7204 370 22 9 1
62 Rampur 29290 13329 3755 0 3755 1963 1963 57 5775 621 20 15 1
63 Saharanpur 43430 24231 5247 242 5489 1382 1383 4 6876 1778 16 6 1
64 Sambhal 26695 17013 5113 88 5201 1705 1713 7 6921 259 26 10 0
65 Sant Kabir Nagar 18436 18811 2481 0 2481 1002 1002 0 3483 532 19 5 0
66 Sant Ravidas Nagar 20503 14602 3672 0 3672 1448 1448 0 5120 608 25 10 1
67 Shahjahanpur 39390 25405 8953 2518 11471 4017 4150 29 15650 1668 40 16 1
68 Shamli 19284 10479 4454 25 4479 1182 1182 0 5661 893 29 11 0
69 Shrawasti 18677 17483 653 0 653 683 683 29 1365 105 7 4 0
70 Siddharth Nagar 32320 23441 4792 55 4847 1460 1460 0 6307 268 20 6 0
71 Sitapur 60186 51343 4723 0 4723 3959 3959 347 9029 678 15 8 1
72 Sonbhadra 22902 15862 3122 53 3175 1878 1888 41 5104 718 22 12 1
73 Sultanpur 36888 25803 7901 0 7901 1015 1015 30 8946 1460 24 4 1
74 Unnav 42420 17950 4704 0 4704 1791 1791 13 6508 1188 15 10 2
75 Varanasi 47813 23749 8401 0 8401 2855 2855 76 11332 1389 24 12 2
Uttar Pradesh 2610967 1629752 429733 17860 447593 174024 175882 3767 627242 70469 24 11 1
High Priority District >100% >35, <=100 >10, <=35 <=10
Note: More than 100 % for data quality review)
District performance:
Interval IUCD71%
PPIUCD28%
PA IUCD1%
Distribution of IUD insertion - Type
24
11
1
0
5
10
15
20
25
30
% of IUD insertion against IUDestimated need
% Post Partum IUCD at Public facilityagainst delivery
Current usage of Copper-T/IUD(%)-AHS2012
% of IUD insertion and post partum IUD insertion

1 Agra 50500 21211 42 8.8 25250 6948 28 2.4
2 Aligarh 33537 14903 44 12.9 17463 3796 22 2.3
3 Allahabad 55220 9039 16 12.1 28810 6239 22 3.8
4 Ambedkar Nagar 21385 5517 26 8.9 11190 4253 38 6
5 Auraiya 15359 10639 69 14.6 7282 2776 38 2.2
6 Azamgarh 47975 3589 7 8.9 23331 1531 7 2.2
7 Bagpat 12625 4569 36 17.5 10100 2874 28 5.2
8 Bahraich 40590 1286 3 7.2 15221 1892 12 2.1
9 Ballia 30805 2352 8 11.1 15655 839 5 2.9
10 Balrampur 24745 4112 17 6.2 9595 2660 28 2.9
11 Banda 22725 6027 27 10.9 11615 7091 61 3.1
12 Barabanki 28280 16757 59 15.5 14645 9013 62 1.5
13 Bareilly 40905 2189 5 19.4 20301 2032 10 8.4
14 Basti 22730 5793 25 9.8 12408 4598 37 3.1
15 Bijnor 36360 8425 23 27.2 18786 3742 20 3.5
16 Budaun 36481 3413 9 9.2 15635 1734 11 3.2
17 Bulandshahar 35350 14603 41 13.2 16867 3914 23 2.3
18 C S M Nagar 24275 2078 9 0 12576 1116 9 0
19 Chandauli 23523 1870 8 7.2 10378 1912 18 2.6
20 Chitrakoot 10100 6908 68 5.2 4545 4292 94 2.9
21 Deoria 39390 1953 5 9.6 17170 891 5 4.5
22 Etah 15549 5582 36 9.4 8649 2105 24 1.9
23 Etawah 17449 11247 64 18.9 8273 3984 48 1.9
24 Faizabad 22045 2830 13 13.1 11535 3462 30 3.9
25 Farrukhabad 22462 10589 47 18.5 9065 4707 52 3.6
26 Fatehpur 25452 5032 20 16.6 13221 1449 11 6.1
27 Firozabad 22725 8529 38 10.3 12625 4501 36 7.5
28 Gautam Buddha Nagar 13426 7618 57 13.9 6712 7570 113 4.9
29 Ghaziabad 25764 5646 22 21.1 12883 2597 20 3.2
30 Ghazipur 36863 2243 6 8.3 19143 1579 8 3.1
31 Gonda 35855 3823 11 7.4 15655 3258 21 1.8
32 Gorakhpur 40905 3205 8 20.9 20705 1745 8 4.9
33 Hamirpur 11666 10699 92 10.6 6069 5085 84 0.5
34 Hapur 11310 3703 33 0 5655 2117 37 0
35 Hardoi 37875 12995 34 16.6 19695 5711 29 4.4
36 Hathras 14953 11726 78 8.5 7787 1508 19 1.9
37 Jalaun 16665 7602 46 13.5 7979 4518 57 0.8
38 Jaunpur 41107 4972 12 11.4 21412 1839 9 4.3
39 Jhansi 20705 6163 30 15.9 10100 3793 38 1.5
40 Jyotiba Phule Nagar 16011 2559 16 21 8366 681 8 2.5
41 Kannauj 20705 6736 33 9.6 7474 2356 32 11.2
42 Kanpur Dehat 19306 9734 50 20.1 9991 4229 42 3.4
43 Kanpur Nagar 44945 14451 32 23 23230 8952 39 3.6
44 Kashi Ram Nagar 14600 1235 8 0 7006 1990 28 0
45 Kaushambi 14470 5794 40 8.6 7550 2524 33 4.2
46 Kushinagar 53943 858 2 9.7 17801 258 1 4.5
47 Lakhimpur Kheri 35350 2880 8 10.9 18685 1936 10 3.5
48 Lalitpur 10989 3300 30 13.6 5555 1435 26 3.6
49 Lucknow 38885 12296 32 17.8 20200 9273 46 3.3
FAMILY WELFARE PROGRAMME
Condom and OCP user
Apr-Nov (2017-18) S.No Districts WORK_LOAD
(Estimated
need) CC Users
Current
usage of
OCP (%)-
AHS 2012
WORK_LO
AD
(Estimated
need) OCP
users
CC users
as per
HMIS
% of CC
users as
per HMIS
against
NHM
workload
OCP users
as per
HMIS
% of OCP
users as per
HMIS
against
NHM
workload
Current
usage of
Condoms
(%)-AHS
2012
50 Maharajganj 26839 2917 11 6.9 13964 1781 13 5.6
51 Mahoba 9090 2501 28 13.4 4545 1330 29 9.6
52 Mainpuri 19309 10804 56 10.6 10046 1918 19 1.6
53 Mathura 23672 9969 42 7.3 11963 3536 30 3.1
54 Maunathbhanjan 20705 1283 6 10.9 10605 845 8 4.2
55 Meerut 35350 5868 17 17.6 18180 4393 24 3.5
56 Mirzapur 24760 4440 18 9.2 11963 3385 28 2.3
57 Moradabad 26429 8314 31 19.2 13810 6501 47 2.5
58 Muzaffarnagar 30142 2961 10 16.5 16076 1336 8 4.1
59 Pilibhit 17675 8282 47 15.3 9595 3795 40 6.3
60 Pratapgarh 35248 4461 13 9.4 15655 5458 35 3.9
61 Rae Bareli 22571 7320 32 10.6 11855 4318 36 1.7
62 Rampur 19392 4440 23 18.4 10504 3032 29 2.9
63 Saharanpur 40400 5244 13 19.7 18685 2373 13 7.8
64 Sambhal 19554 7082 36 0 9659 2848 29 0
65 Sant Kabir Nagar 15650 4250 27 8.4 8613 2918 34 3.1
66 Sant Ravidas Nagar 14241 2587 18 7.8 7474 1966 26 2.2
67 Shahjahanpur 27775 1749 6 13.7 14645 1860 13 4.4
68 Shamli 15308 2832 18 0 8164 3949 48 0
69 Shrawasti 20010 1036 5 7.1 7504 1373 18 3
70 Siddharth Nagar 24240 3541 15 9.5 12120 2579 21 4.8
71 Sitapur 41847 5404 13 7.1 21772 3017 14 1.7
72 Sonbhadra 15943 3207 20 6.7 8338 2766 33 2.3
73 Sultanpur 27389 9965 36 11.3 14050 4487 32 1.8
74 Unnav 29846 6014 20 15.6 16382 2303 14 2.4
75 Varanasi 45157 5536 12 13.9 19922 2951 15 2.9
Uttar Pradesh 2003382 463287 23 13.2 987933 246322 25 3.6
High Priority District>100% >40, <=100 >20, <=40 <=20
Note: More than 100 % for data quality review)
District performance:
23
13.2
25
3.6
0
5
10
15
20
25
30
% of CC users as per HMIS againstNHM workload
Current usage of Condoms (%)-AHS2012
% of OCP users as per HMIS againstNHM workload
Current usage of OCP (%)-AHS 2012
% of Current Condom and OCP usage

Prop. Annual Against live
birth
1 Agra 125357 36317 72502 87 58 200
2 Aligarh 105127 49250 62201 89 59 126
3 Allahabad 170541 53125 106734 94 63 201
4 Ambedkar Nagar 68641 25731 33589 73 49 131
5 Auraiya 39269 12916 19872 76 51 154
6 Azamgarh 132103 37894 67809 77 51 179
7 Bagpat 37262 12180 18418 74 49 151
8 Bahraich 99532 49499 67668 102 68 137
9 Ballia 92246 36003 45699 74 50 127
10 Balrampur 61496 35763 41674 102 68 117
11 Banda 51493 25418 26188 76 51 103
12 Barabanki 93228 36874 57743 93 62 157
13 Bareilly 127778 49987 55908 66 44 112
14 Basti 70423 28102 40684 87 58 145
15 Bijnor 105415 53236 49338 70 47 93
16 Budaun 91351 44457 55002 90 60 124
17 Bulandshahar 100112 34667 58326 87 58 168
18 C S M Nagar 51848 21002 27819 80 54 132
19 Chandauli 55877 18011 27809 75 50 154
20 Chitrakoot 28346 14283 16101 85 57 113
21 Deoria 88668 33004 50258 85 57 152
22 Etah 50396 21529 34785 104 69 162
23 Etawah 45188 23624 32132 107 71 136
24 Faizabad 70632 30357 31557 67 45 104
25 Farrukhabad 54013 20752 34060 95 63 164
26 Fatehpur 75335 32550 43529 87 58 134
27 Firozabad 71446 29269 41093 86 58 140
28 Gautam Buddha Nagar 47923 29887 32235 101 67 108
29 Ghaziabad 96680 44199 58018 90 60 131
30 Ghazipur 103670 37604 58867 85 57 157
31 Gonda 98190 40409 64244 98 65 159
32 Gorakhpur 126946 45802 78290 93 62 171
33 Hamirpur 31593 14438 15233 72 48 106
34 Hapur 36708 8188 18556 76 51 227
35 Hardoi 117076 59404 67411 86 58 113
36 Hathras 44803 27926 30390 102 68 109
37 Jalaun 47810 17215 26348 83 55 153
38 Jaunpur 128088 48823 80639 94 63 165
39 Jhansi 57253 17808 23197 61 41 130
40 Jyotiba Phule Nagar 52617 19001 29126 83 55 153
41 Kannauj 47446 24400 25364 80 53 104
42 Kanpur Dehat 51367 16798 25893 76 50 154
43 Kanpur Nagar 130857 60986 85354 98 65 140
44 Kashi Ram Nagar 41153 22213 24723 90 60 111
45 Kaushambi 45695 23731 29599 97 65 125
46 Kushinagar 101894 44324 50450 74 50 114
47 Lakhimpur Kheri 114852 54651 62988 82 55 115
48 Lalitpur 34854 18831 20969 90 60 111
49 Lucknow 131301 40009 83043 95 63 208
50 Maharajganj 76268 30608 38423 76 50 126
51 Mahoba 25070 9483 11672 70 47 123
Child Immunization (BCG)
Apr-Nov (2017-18)
Sr. No. DISTRICT Annual Service
Need
(Estimated)
(Children Below
one year)
Live Birth Achievement % Achievement

Prop. Annual Against live
birth
Child Immunization (BCG)
Apr-Nov (2017-18)
Sr. No. DISTRICT Annual Service
Need
(Estimated)
(Children Below
one year)
Live Birth Achievement % Achievement
52 Mainpuri 52859 25215 32423 92 61 129
53 Mathura 72738 25116 39560 82 54 158
54 Maunathbhanjan 63102 18455 37941 90 60 206
55 Meerut 98650 22468 44349 67 45 197
56 Mirzapur 71383 32966 38919 82 55 118
57 Moradabad 89797 40154 48855 82 54 122
58 Muzaffarnagar 76705 41774 42356 83 55 101
59 Pilibhit 58295 21058 29586 76 51 140
60 Pratapgarh 90819 30596 36848 61 41 120
61 Rae Bareli 83485 32015 37158 67 45 116
62 Rampur 66828 25684 32532 73 49 127
63 Saharanpur 99130 35435 55820 84 56 158
64 Sambhal 61677 31921 39091 95 63 122
65 Sant Kabir Nagar 49056 22614 27580 84 56 122
66 Sant Ravidas Nagar 44474 16880 24913 84 56 148
67 Shahjahanpur 85914 38670 51594 90 60 133
68 Shamli 41722 12888 23616 85 57 183
69 Shrawasti 31895 21234 28370 133 89 134
70 Siddharth Nagar 73070 39598 45514 93 62 115
71 Sitapur 128037 65908 70712 83 55 107
72 Sonbhadra 53299 23858 29088 82 55 122
73 Sultanpur 70552 26353 33972 72 48 129
74 Unnav 89011 22002 29322 49 33 133
75 Varanasi 105355 20542 48017 68 46 234
Uttar Pradesh 5711087 2315942 3187666 84 56 138
High Priority Districts >100%
District performance:
Note: More than 100 % for data quality review)
Below State Average

Prop. Annual Against
live birth
1 Agra 125357 36317 77566 93 62 214
2 Aligarh 105127 49250 60665 87 58 123
3 Allahabad 170541 53125 94815 83 56 178
4 Ambedkar Nagar 68641 25731 34036 74 50 132
5 Auraiya 39269 12916 17848 68 45 138
6 Azamgarh 132103 37894 59493 68 45 157
7 Bagpat 37262 12180 19595 79 53 161
8 Bahraich 99532 49499 47422 71 48 96
9 Ballia 92246 36003 40933 67 44 114
10 Balrampur 61496 35763 32717 80 53 91
11 Banda 51493 25418 29185 85 57 115
12 Barabanki 93228 36874 53043 85 57 144
13 Bareilly 127778 49987 66308 78 52 133
14 Basti 70423 28102 38914 83 55 138
15 Bijnor 105415 53236 44679 64 42 84
16 Budaun 91351 44457 57984 95 63 130
17 Bulandshahar 100112 34667 64463 97 64 186
18 C S M Nagar 51848 21002 28046 81 54 134
19 Chandauli 55877 18011 26269 71 47 146
20 Chitrakoot 28346 14283 16448 87 58 115
21 Deoria 88668 33004 46745 79 53 142
22 Etah 50396 21529 34626 103 69 161
23 Etawah 45188 23624 26571 88 59 112
24 Faizabad 70632 30357 75706 161 107 249
25 Farrukhabad 54013 20752 28485 79 53 137
26 Fatehpur 75335 32550 40770 81 54 125
27 Firozabad 71446 29269 39698 83 56 136
28 Gautam Buddha Nagar 47923 29887 33488 105 70 112
29 Ghaziabad 96680 44199 66862 104 69 151
30 Ghazipur 103670 37604 57112 83 55 152
31 Gonda 98190 40409 54280 83 55 134
32 Gorakhpur 126946 45802 69630 82 55 152
33 Hamirpur 31593 14438 15464 73 49 107
34 Hapur 36708 8188 20086 82 55 245
35 Hardoi 117076 59404 63692 82 54 107
36 Hathras 44803 27926 25829 86 58 92
37 Jalaun 47810 17215 27494 86 58 160
38 Jaunpur 128088 48823 72216 85 56 148
39 Jhansi 57253 17808 22902 60 40 129
40 Jyotiba Phule Nagar 52617 19001 29033 83 55 153
41 Kannauj 47446 24400 21702 69 46 89
42 Kanpur Dehat 51367 16798 21638 63 42 129
43 Kanpur Nagar 130857 60986 87143 100 67 143
44 Kashi Ram Nagar 41153 22213 21773 79 53 98
Child Immunization (Measles)
Apr-Nov (2017-18)
Sr. No. DISTRICT Annual Service
Need*
(Children
Below one
year)
Live
Birth
Achieve
ment
% Achievement

Prop. Annual Against
live birth
Child Immunization (Measles)
Apr-Nov (2017-18)
Sr. No. DISTRICT Annual Service
Need*
(Children
Below one
year)
Live
Birth
Achieve
ment
% Achievement
45 Kaushambi 45695 23731 24439 80 53 103
46 Kushinagar 101894 44324 45209 67 44 102
47 Lakhimpur Kheri 114852 54651 62363 81 54 114
48 Lalitpur 34854 18831 22441 97 64 119
49 Lucknow 131301 40009 81637 93 62 204
50 Maharajganj 76268 30608 42680 84 56 139
51 Mahoba 25070 9483 14042 84 56 148
52 Mainpuri 52859 25215 35467 101 67 141
53 Mathura 72738 25116 35415 73 49 141
54 Maunathbhanjan 63102 18455 36029 86 57 195
55 Meerut 98650 22468 39431 60 40 175
56 Mirzapur 71383 32966 34037 72 48 103
57 Moradabad 89797 40154 46931 78 52 117
58 Muzaffarnagar 76705 41774 43301 85 56 104
59 Pilibhit 58295 21058 31873 82 55 151
60 Pratapgarh 90819 30596 34091 56 38 111
61 Rae Bareli 83485 32015 35538 64 43 111
62 Rampur 66828 25684 32604 73 49 127
63 Saharanpur 99130 35435 58060 88 59 164
64 Sambhal 61677 31921 39747 97 64 125
65 Sant Kabir Nagar 49056 22614 24093 74 49 107
66 Sant Ravidas Nagar 44474 16880 23851 80 54 141
67 Shahjahanpur 85914 38670 53278 93 62 138
68 Shamli 41722 12888 24002 86 58 186
69 Shrawasti 31895 21234 23651 111 74 111
70 Siddharth Nagar 73070 39598 36515 75 50 92
71 Sitapur 128037 65908 68551 80 54 104
72 Sonbhadra 53299 23858 30310 85 57 127
73 Sultanpur 70552 26353 30436 65 43 115
74 Unnav 89011 22002 37461 63 42 170
75 Varanasi 105355 20542 50229 72 48 245
Uttar Pradesh 5711087 2315942 3111086 82 54 134
High Priority Districts >100% Below State Average
Note: More than 100 % for data quality review)
District performance:

Prop. Annual Against
live birth
1 Agra 125357 36317 90069 108 72 248 44.3
2 Aligarh 105127 49250 61011 87 58 124 53.6
3 Allahabad 170541 53125 94638 83 55 178 54.9
4 Ambedkar Nagar 68641 25731 33758 74 49 131 63.7
5 Auraiya 39269 12916 15954 61 41 124 46.2
6 Azamgarh 132103 37894 57487 65 44 152 56.7
7 Bagpat 37262 12180 19564 79 53 161 75
8 Bahraich 99532 49499 60736 92 61 123 27.5
9 Ballia 92246 36003 39550 64 43 110 71
10 Balrampur 61496 35763 31808 78 52 89 36.4
11 Banda 51493 25418 29377 86 57 116 43.6
12 Barabanki 93228 36874 53094 85 57 144 43.9
13 Bareilly 127778 49987 68547 80 54 137 41.4
14 Basti 70423 28102 39037 83 55 139 66.2
15 Bijnor 105415 53236 43622 62 41 82 69.2
16 Budaun 91351 44457 57799 95 63 130 30.7
17 Bulandshahar 100112 34667 56786 85 57 164 52.4
18 C S M Nagar 51848 21002 30910 89 60 147 0
19 Chandauli 55877 18011 27009 73 48 150 60.2
20 Chitrakoot 28346 14283 16483 87 58 115 48
21 Deoria 88668 33004 55133 93 62 167 66.4
22 Etah 50396 21529 33769 101 67 157 40
23 Etawah 45188 23624 26151 87 58 111 58
24 Faizabad 70632 30357 35224 75 50 116 66.3
25 Farrukhabad 54013 20752 29882 83 55 144 44.1
26 Fatehpur 75335 32550 40023 80 53 123 51.5
27 Firozabad 71446 29269 36851 77 52 126 55.9
28 Gautam Buddha Nagar 47923 29887 32056 100 67 107 60.4
29 Ghaziabad 96680 44199 68239 106 71 154 59.1
30 Ghazipur 103670 37604 53753 78 52 143 55.8
31 Gonda 98190 40409 67554 103 69 167 48.6
32 Gorakhpur 126946 45802 72861 86 57 159 65.6
33 Hamirpur 31593 14438 15191 72 48 105 50.6
34 Hapur 36708 8188 18153 74 49 222 0
35 Hardoi 117076 59404 62959 81 54 106 51.8
36 Hathras 44803 27926 28613 96 64 102 55.7
37 Jalaun 47810 17215 26872 84 56 156 54.3
38 Jaunpur 128088 48823 71199 83 56 146 60.1
39 Jhansi 57253 17808 23119 61 40 130 72.5
40 Jyotiba Phule Nagar 52617 19001 28308 81 54 149 56.4
41 Kannauj 47446 24400 21886 69 46 90 46.4
42 Kanpur Dehat 51367 16798 22062 64 43 131 61.9
43 Kanpur Nagar 130857 60986 91894 105 70 151 59.2
44 Kashi Ram Nagar 41153 22213 20797 76 51 94 0
45 Kaushambi 45695 23731 24111 79 53 102 46.9
46 Kushinagar 101894 44324 46243 68 45 104 60.8
47 Lakhimpur Kheri 114852 54651 63264 83 55 116 37.8
48 Lalitpur 34854 18831 22523 97 65 120 54.2
49 Lucknow 131301 40009 104786 120 80 262 68.9
50 Maharajganj 76268 30608 42679 84 56 139 58.9
51 Mahoba 25070 9483 16698 100 67 176 67.4
52 Mainpuri 52859 25215 36915 105 70 146 50.6
Coverage
full
Immuniz
ation
(%)
AHS
2012
Child Immunization (Full Immunization)
Apr-Nov (2017-18)
Sr. No. DISTRICT Live Birth % AchievementAnnual Service
Need*
(Children Below
one year)
Achievement

Prop. Annual Against
live birth
Coverage
full
Immuniz
ation
(%)
AHS
2012
Child Immunization (Full Immunization)
Apr-Nov (2017-18)
Sr. No. DISTRICT Live Birth % AchievementAnnual Service
Need*
(Children Below
one year)
Achievement
53 Mathura 72738 25116 40521 84 56 161 45.5
54 Maunathbhanjan 63102 18455 33392 79 53 181 53.8
55 Meerut 98650 22468 39361 60 40 175 57.8
56 Mirzapur 71383 32966 35286 74 49 107 43.7
57 Moradabad 89797 40154 51009 85 57 127 52.4
58 Muzaffarnagar 76705 41774 43887 86 57 105 53.5
59 Pilibhit 58295 21058 32061 82 55 152 55.6
60 Pratapgarh 90819 30596 34415 57 38 112 64.9
61 Rae Bareli 83485 32015 35228 63 42 110 54.8
62 Rampur 66828 25684 32992 74 49 128 61.5
63 Saharanpur 99130 35435 58053 88 59 164 77.4
64 Sambhal 61677 31921 37557 91 61 118 0
65 Sant Kabir Nagar 49056 22614 24313 74 50 108 58.5
66 Sant Ravidas Nagar 44474 16880 23419 79 53 139 42.2
67 Shahjahanpur 85914 38670 52666 92 61 136 40.9
68 Shamli 41722 12888 24002 86 58 186 0
69 Shrawasti 31895 21234 23695 111 74 112 24.9
70 Siddharth Nagar 73070 39598 38451 79 53 97 51.4
71 Sitapur 128037 65908 71043 83 55 108 35.4
72 Sonbhadra 53299 23858 29971 84 56 126 32.4
73 Sultanpur 70552 26353 30451 65 43 116 47.2
74 Unnav 89011 22002 37152 63 42 169 63.1
75 Varanasi 105355 20542 51458 73 49 251 65.2
Uttar Pradesh 5711087 2315942 3147390 83 55 136 52.7
High Priority District >100% >90, <=100 >=70, <=90 <70
District performance:
Note: More than 100 % for data quality review)

Number %
(Annual)
%
(Propotionate
)
Number % Number % Number %
1 Agra 146580 85345 58 87 45808 47 149026 153 53831 55
2 Aligarh 122926 61141 50 75 31792 39 108847 133 36305 44
3 Allahabad 199413 112981 57 85 62440 47 90599 68 49315 37
4 Ambedkar Nagar 80260 36034 45 67 14331 27 33854 63 18109 34
5 Auraiya 45916 26693 58 87 15082 49 23471 77 10216 33
6 Azamgarh 154467 78411 51 76 38021 37 106835 104 27155 26
7 Bagpat 43570 21194 49 73 15061 52 16476 57 12409 43
8 Bahraich 116381 76601 66 99 24186 31 65503 84 23110 30
9 Ballia 107862 57073 53 79 23131 32 48941 68 12135 17
10 Balrampur 71907 50133 70 105 15016 31 36718 77 23487 49
11 Banda 60212 40143 67 100 16985 42 31002 77 11908 30
12 Barabanki 109011 64027 59 88 23338 32 52984 73 26777 37
13 Bareilly 149409 72170 48 72 45959 46 63330 64 33200 33
14 Basti 82346 56910 69 104 26018 47 144131 263 16350 30
15 Bijnor 123262 63217 51 77 33405 41 30448 37 36147 44
16 Budaun 106817 73257 69 103 28900 41 54759 77 18006 25
17 Bulandshahar 117059 63502 54 81 32516 42 88851 114 30457 39
18 C S M Nagar 63763 30888 48 73 13240 31 9949 23 13712 32
19 Chandauli 65337 34362 53 79 14283 33 33436 77 5070 12
20 Chitrakoot 33146 17724 53 80 5514 25 14016 63 6986 32
21 Deoria 103679 52329 50 76 29203 42 23911 35 13975 20
22 Etah 58928 45052 76 115 17755 45 34860 89 15744 40
23 Etawah 52838 37516 71 107 14620 42 38003 108 37638 107
24 Faizabad 82591 38211 46 69 13079 24 27666 50 18879 34
25 Farrukhabad 63158 52427 83 125 15323 36 46833 111 16759 40
26 Fatehpur 88089 54196 62 92 22776 39 61868 105 32585 55
27 Firozabad 83541 47083 56 85 22813 41 39923 72 19989 36
28 Gautam Buddha Nagar 56035 42442 76 114 27672 74 38446 103 20108 54
29 Ghaziabad 113040 71288 63 95 37113 49 54405 72 24978 33
30 Ghazipur 121215 65031 54 80 34637 43 66582 82 38916 48
31 Gonda 114813 75388 66 98 21279 28 51667 68 30176 39
32 Gorakhpur 148436 88759 60 90 40087 41 69887 71 37285 38
33 Hamirpur 36940 19146 52 78 9388 38 19123 78 11477 47
34 Hapur 42930 21106 49 74 12651 44 14919 52 12016 42
35 Hardoi 136896 80980 59 89 36921 40 79950 88 39401 43
36 Hathras 52387 35186 67 101 18862 54 26596 76 15971 46
37 Jalaun 55902 36604 65 98 16430 44 27931 75 20083 54
38 Jaunpur 149768 79101 53 79 43476 44 72413 73 45202 45
39 Jhansi 66945 31753 47 71 15470 35 51153 115 15658 35
40 Jyotiba Phule Nagar 61525 29437 48 72 12688 31 24985 61 12627 31
41 Kannauj 55476 31292 56 85 11851 32 25537 69 8421 23
42 Kanpur Dehat 60063 39175 65 98 12139 30 24960 62 10135 25
43 Kanpur Nagar 153009 108451 71 106 27831 27 163103 160 42903 42
44 Kashi Ram Nagar 48120 32831 68 102 15306 48 23128 72 7785 24
45 Kaushambi 53432 31850 60 89 12057 34 29630 83 15857 45
46 Kushinagar 119144 57405 48 72 27683 35 52323 66 19864 25
47 Lakhimpur Kheri 134295 77184 57 86 31451 35 135668 152 34338 38
48 Lalitpur 40754 24586 60 90 10504 39 23654 87 16793 62
49 Lucknow 153528 101591 66 99 54990 54 409431 400 57095 56
50 Maharajganj 89180 47756 54 80 16907 28 35112 59 22891 39
Women distributed 180
IFA tablet
Women received 4
ANC checkups
ANC Registration
Apr-Nov (2017-18)
District_HMISS.NO. Estimated
Pregnant
Women
ANC Registration ANC Registration in
Ist trimster

Number %
(Annual)
%
(Propotionate
)
Number % Number % Number %
Women distributed 180
IFA tablet
Women received 4
ANC checkups
ANC Registration
Apr-Nov (2017-18)
District_HMISS.NO. Estimated
Pregnant
Women
ANC Registration ANC Registration in
Ist trimster
51 Mahoba 29313 26902 92 138 7298 37 13624 70 9782 50
52 Mainpuri 61806 41402 67 100 23652 57 36000 87 19491 47
53 Mathura 85051 41831 49 74 20399 36 32012 56 15469 27
54 Maunathbhanjan 73784 43245 59 88 14104 29 31118 63 17334 35
55 Meerut 115349 53465 46 70 25330 33 26350 34 22809 30
56 Mirzapur 83466 47307 57 85 21336 38 39384 71 24933 45
57 Moradabad 104985 54640 52 78 26261 38 47589 68 26945 38
58 Muzaffarnagar 89692 40868 46 68 16877 28 34941 58 16729 28
59 Pilibhit 68165 35081 51 77 20739 46 34302 75 19413 43
60 Pratapgarh 106193 44681 42 63 23424 33 74802 106 20220 29
61 Rae Bareli 100680 36933 37 55 14082 21 40685 61 17639 26
62 Rampur 78142 39329 50 75 16442 32 52590 101 15424 30
63 Saharanpur 115912 69282 60 90 38793 50 42902 56 33251 43
64 Sambhal 72133 56324 78 117 25659 53 36783 76 24755 51
65 Sant Kabir Nagar 57360 31779 55 83 12902 34 27039 71 16925 44
66 Sant Ravidas Nagar 52003 28379 55 82 11910 34 23231 67 12440 36
67 Shahjahanpur 100458 59761 59 89 31606 47 54067 81 33423 50
68 Shamli 48784 27328 56 84 13907 43 20955 64 13695 42
69 Shrawasti 37295 31979 86 129 12678 51 20380 82 12389 50
70 Siddharth Nagar 85440 47383 55 83 23834 42 21522 38 24563 43
71 Sitapur 149713 92572 62 93 42360 42 96898 97 31983 32
72 Sonbhadra 62322 40628 65 98 15411 37 33646 81 16835 41
73 Sultanpur 73255 35585 49 73 16873 35 23317 48 21903 45
74 Unnav 104079 39660 38 57 13111 19 35007 50 16455 24
75 Varanasi 123205 54246 44 66 21233 26 43898 53 24337 30
6674884 3797552 57 85 1718209 39 3939885 89 1689376 38
High Priority Districts >100%
District performance:
Below State Average
Note: More than 100 % for data quality review)

No of new
hypertensive
PW
% of
new
hyperte
nsive
PW
Number % Number % Number %
1 Agra 146580 2639 2 70677 48 62460 88 5046 7
2 Aligarh 122926 1148 1 44540 36 34592 78 4277 10
3 Allahabad 199413 2941 1 64997 33 28981 45 3405 5
4 Ambedkar Nagar 80260 558 1 46536 58 28092 60 1334 3
5 Auraiya 45916 2588 6 17090 37 8043 47 321 2
6 Azamgarh 154467 2566 2 26275 17 36986 141 1991 8
7 Bagpat 43570 307 1 14866 34 9577 64 947 6
8 Bahraich 116381 1575 1 10870 9 26923 248 2285 21
9 Ballia 107862 1778 2 8735 8 15942 183 658 8
10 Balrampur 71907 406 1 30277 42 19964 66 1866 6
11 Banda 60212 1898 3 19665 33 19968 102 9214 47
12 Barabanki 109011 681 1 64040 59 52346 82 3339 5
13 Bareilly 149409 1320 1 67376 45 33235 49 1998 3
14 Basti 82346 274 0 21712 26 11039 51 545 3
15 Bijnor 123262 792 1 48236 39 25594 53 1722 4
16 Budaun 106817 510 0 35844 34 27658 77 2479 7
17 Bulandshahar 117059 2327 2 21915 19 32647 149 3730 17
18 C S M Nagar 63763 84 0 12944 20 9566 74 869 7
19 Chandauli 65337 145 0 2837 4 10636 375 206 7
20 Chitrakoot 33146 327 1 22225 67 21119 95 1358 6
21 Deoria 103679 159 0 10453 10 13686 131 211 2
22 Etah 58928 705 1 33365 57 24186 72 2461 7
23 Etawah 52838 1995 4 17285 33 16655 96 857 5
24 Faizabad 82591 467 1 28856 35 23794 82 1003 3
25 Farrukhabad 63158 368 1 14438 23 21669 150 1352 9
26 Fatehpur 88089 335 0 47633 54 39249 82 2033 4
27 Firozabad 83541 2016 2 45517 54 49498 109 4280 9
28 Gautam Buddha Nagar 56035 449 1 27380 49 22268 81 2738 10
29 Ghaziabad 113040 1085 1 42499 38 34529 81 2489 6
30 Ghazipur 121215 994 1 28206 23 11594 41 1771 6
31 Gonda 114813 3454 3 54305 47 41200 76 1694 3
32 Gorakhpur 148436 593 0 45678 31 26773 59 1096 2
33 Hamirpur 36940 561 2 29512 80 19765 67 599 2
34 Hapur 42930 174 0 16141 38 11733 73 994 6
35 Hardoi 136896 1048 1 57231 42 57108 100 2090 4
36 Hathras 52387 592 1 13753 26 15493 113 1130 8
37 Jalaun 55902 543 1 34153 61 24370 71 1107 3
38 Jaunpur 149768 385 0 44990 30 32123 71 708 2
39 Jhansi 66945 218 0 18974 28 18084 95 1407 7
40 Jyotiba Phule Nagar 61525 219 0 26340 43 17309 66 697 3
41 Kannauj 55476 195 0 23858 43 24264 102 1136 5
42 Kanpur Dehat 60063 353 1 28474 47 33035 116 3038 11
PW with HB less
than 11
PW with HB less
than 7
Complication Identification and treated at facility
Apr-Nov (2017-18)
S.NO. District_HMIS PW HB test
conducted
Hypertension
detection at Facility
ANC
Registratio
n

No of new
hypertensive
PW
% of
new
hyperte
nsive
PW
Number % Number % Number %
PW with HB less
than 11
PW with HB less
than 7
Complication Identification and treated at facility
Apr-Nov (2017-18)
S.NO. District_HMIS PW HB test
conducted
Hypertension
detection at Facility
ANC
Registratio
n
43 Kanpur Nagar 153009 1273 1 49174 32 50190 102 1656 3
44 Kashi Ram Nagar 48120 672 1 9827 20 15080 153 1934 20
45 Kaushambi 53432 251 0 20463 38 16165 79 1211 6
46 Kushinagar 119144 3632 3 21599 18 11922 55 1007 5
47 Lakhimpur Kheri 134295 1459 1 81921 61 47360 58 4236 5
48 Lalitpur 40754 701 2 39624 97 14844 37 1441 4
49 Lucknow 153528 3575 2 101513 66 87653 86 4960 5
50 Maharajganj 89180 486 1 43755 49 28571 65 978 2
51 Mahoba 29313 97 0 22295 76 11739 53 466 2
52 Mainpuri 61806 215 0 29520 48 13741 47 799 3
53 Mathura 85051 1912 2 21676 25 16059 74 1201 6
54 Maunathbhanjan 73784 146 0 7564 10 7991 106 272 4
55 Meerut 115349 673 1 23511 20 35993 153 1776 8
56 Mirzapur 83466 623 1 29375 35 26171 89 2131 7
57 Moradabad 104985 814 1 36853 35 31758 86 1253 3
58 Muzaffarnagar 89692 1178 1 36183 40 29314 81 2053 6
59 Pilibhit 68165 933 1 32839 48 30367 92 1284 4
60 Pratapgarh 106193 847 1 29270 28 31854 109 1381 5
61 Rae Bareli 100680 1470 1 42190 42 29966 71 3198 8
62 Rampur 78142 709 1 9705 12 29904 308 1568 16
63 Saharanpur 115912 1538 1 67429 58 48979 73 2852 4
64 Sambhal 72133 367 1 24767 34 21310 86 1104 4
65 Sant Kabir Nagar 57360 277 0 23795 41 16279 68 331 1
66 Sant Ravidas Nagar 52003 86 0 12519 24 5014 40 183 1
67 Shahjahanpur 100458 1924 2 61441 61 36002 59 2811 5
68 Shamli 48784 417 1 21194 43 10760 51 2313 11
69 Shrawasti 37295 509 1 7344 20 12889 176 1916 26
70 Siddharth Nagar 85440 515 1 15579 18 7336 47 551 4
71 Sitapur 149713 1825 1 70169 47 41281 59 2313 3
72 Sonbhadra 62322 581 1 38226 61 18198 48 1366 4
73 Sultanpur 73255 151 0 28961 40 25271 87 1147 4
74 Unnav 104079 171 0 28246 27 26159 93 504 2
75 Varanasi 123205 266 0 16237 13 24795 153 630 4
6674884 72065 1 2445462 37 1954668 80 135307 6
High Priority Districts >100%
District performance:
Below State Average
Note: More than 100 % for data quality review)
Uttar Pradesh

SBA Non SBA Total Public
facility
Private
facility
%
(Annual
)
%
(Proport
ionate)
1 Agra 133254 1355 2205 3560 32151 0 27 40 24 36
2 Aligarh 111751 712 5614 6326 31542 10734 43 65 38 57
3 Allahabad 181284 172 6007 6179 47423 0 30 44 26 39
4 Ambedkar Nagar 72964 1363 1473 2836 17117 5985 36 53 32 47
5 Auraiya 41742 69 1771 1840 10996 50 31 46 26 40
6 Azamgarh 140424 1326 2714 4040 32000 825 26 39 23 35
7 Bagpat 39609 0 1790 1790 8802 1606 31 46 26 39
8 Bahraich 105801 1193 9906 11099 36963 303 46 69 35 53
9 Ballia 98056 2127 5478 7605 27070 33 35 53 28 41
10 Balrampur 65370 891 12837 13728 21658 1195 56 84 35 52
11 Banda 54738 301 845 1146 22874 1264 46 69 44 66
12 Barabanki 99101 104 2464 2568 30342 1649 35 52 32 48
13 Bareilly 135826 25 12081 12106 26085 8442 34 51 25 38
14 Basti 74860 19 3493 3512 23271 83 36 54 31 47
15 Bijnor 112056 4194 4489 8683 21115 15783 41 61 33 49
16 Budaun 97106 1099 10487 11586 32909 37 46 69 34 51
17 Bulandshahar 106417 3550 5612 9162 23729 0 31 46 22 33
18 C S M Nagar 57967 388 420 808 19852 0 36 53 34 51
19 Chandauli 59397 1506 798 2304 12912 0 26 38 22 33
20 Chitrakoot 30133 40 560 600 13787 0 48 72 46 69
21 Deoria 94254 660 738 1398 28541 2054 34 51 32 49
22 Etah 53570 334 5624 5958 14847 817 40 61 29 44
23 Etawah 48035 62 227 289 21483 1900 49 74 49 73
24 Faizabad 75083 968 1976 2944 20985 8723 43 65 40 59
25 Farrukhabad 57416 789 4954 5743 13128 1368 35 53 25 38
26 Fatehpur 80081 665 6354 7019 23674 1429 40 60 31 47
27 Firozabad 75946 297 933 1230 20656 1755 31 47 30 44
28 Gautam Buddha Nagar 50941 3 1804 1807 11911 15456 57 86 54 81
29 Ghaziabad 102764 5093 6933 12026 10020 11720 33 49 21 32
30 Ghazipur 110196 2269 1105 3374 30547 791 32 47 28 43
31 Gonda 104375 1643 8616 10259 31276 0 40 60 30 45
32 Gorakhpur 134942 1612 1797 3409 33999 0 28 42 25 38
33 Hamirpur 33582 84 296 380 14088 94 43 65 42 63
34 Hapur 39027 27 3053 3080 4755 0 20 30 12 18
35 Hardoi 124451 677 17357 18034 38274 4435 49 73 34 51
36 Hathras 47625 1823 7837 9660 12161 1847 50 75 29 44
37 Jalaun 50820 865 600 1465 14778 364 33 49 30 45
38 Jaunpur 136153 532 9216 9748 37198 27 35 52 27 41
39 Jhansi 60859 307 238 545 13557 3397 29 43 28 42
40 Jyotiba Phule Nagar 55931 1618 5021 6639 10823 1698 34 51 22 34
41 Kannauj 50433 135 2160 2295 13558 8226 48 72 43 65
42 Kanpur Dehat 54603 15 1386 1401 15454 0 31 46 28 42
43 Kanpur Nagar 139099 583 1697 2280 21409 37717 44 66 43 64
44 Kashi Ram Nagar 43746 68 4511 4579 13111 1260 43 65 33 49
45 Kaushambi 48575 68 1544 1612 21188 1359 50 75 46 70
46 Kushinagar 108313 2596 4552 7148 31722 164 36 54 29 44
47 Lakhimpur Kheri 122086 1350 5963 7313 42277 3713 44 65 38 57
Proportio
nate
Institutional
Delivery
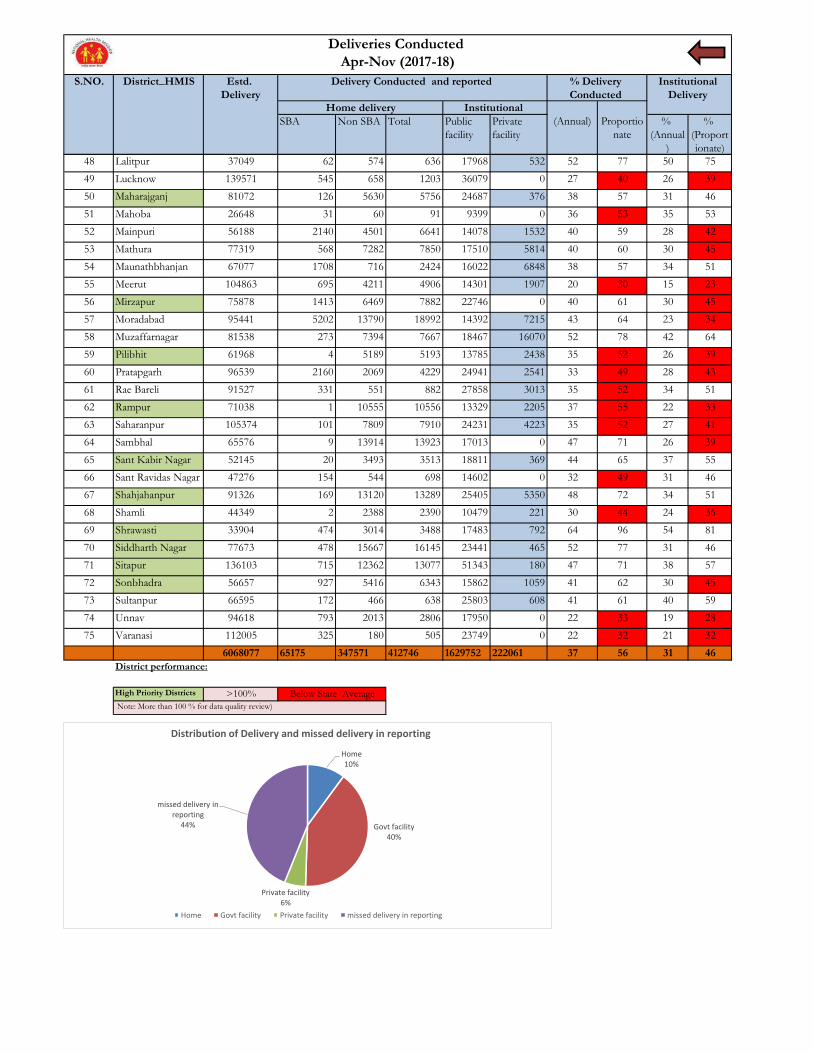
Deliveries Conducted
Apr-Nov (2017-18)
S.NO. District_HMIS Estd.
Delivery
Delivery Conducted and reported % Delivery
Conducted
Home delivery Institutional
(Annual)
SBA Non SBA Total Public
facility
Private
facility
%
(Annual
)
%
(Proport
ionate)
Proportio
nate
Institutional
Delivery
Deliveries Conducted
Apr-Nov (2017-18)
S.NO. District_HMIS Estd.
Delivery
Delivery Conducted and reported % Delivery
Conducted
Home delivery Institutional
(Annual)
48 Lalitpur 37049 62 574 636 17968 532 52 77 50 75
49 Lucknow 139571 545 658 1203 36079 0 27 40 26 39
50 Maharajganj 81072 126 5630 5756 24687 376 38 57 31 46
51 Mahoba 26648 31 60 91 9399 0 36 53 35 53
52 Mainpuri 56188 2140 4501 6641 14078 1532 40 59 28 42
53 Mathura 77319 568 7282 7850 17510 5814 40 60 30 45
54 Maunathbhanjan 67077 1708 716 2424 16022 6848 38 57 34 51
55 Meerut 104863 695 4211 4906 14301 1907 20 30 15 23
56 Mirzapur 75878 1413 6469 7882 22746 0 40 61 30 45
57 Moradabad 95441 5202 13790 18992 14392 7215 43 64 23 34
58 Muzaffarnagar 81538 273 7394 7667 18467 16070 52 78 42 64
59 Pilibhit 61968 4 5189 5193 13785 2438 35 52 26 39
60 Pratapgarh 96539 2160 2069 4229 24941 2541 33 49 28 43
61 Rae Bareli 91527 331 551 882 27858 3013 35 52 34 51
62 Rampur 71038 1 10555 10556 13329 2205 37 55 22 33
63 Saharanpur 105374 101 7809 7910 24231 4223 35 52 27 41
64 Sambhal 65576 9 13914 13923 17013 0 47 71 26 39
65 Sant Kabir Nagar 52145 20 3493 3513 18811 369 44 65 37 55
66 Sant Ravidas Nagar 47276 154 544 698 14602 0 32 49 31 46
67 Shahjahanpur 91326 169 13120 13289 25405 5350 48 72 34 51
68 Shamli 44349 2 2388 2390 10479 221 30 44 24 36
69 Shrawasti 33904 474 3014 3488 17483 792 64 96 54 81
70 Siddharth Nagar 77673 478 15667 16145 23441 465 52 77 31 46
71 Sitapur 136103 715 12362 13077 51343 180 47 71 38 57
72 Sonbhadra 56657 927 5416 6343 15862 1059 41 62 30 45
73 Sultanpur 66595 172 466 638 25803 608 41 61 40 59
74 Unnav 94618 793 2013 2806 17950 0 22 33 19 28
75 Varanasi 112005 325 180 505 23749 0 22 32 21 32
6068077 65175 347571 412746 1629752 222061 37 56 31 46
High Priority Districts >100%
District performance:
Below State Average
Note: More than 100 % for data quality review)
Home10%
Govt facility40%
Private facility6%
missed delivery in reporting
44%
Distribution of Delivery and missed delivery in reporting
Home Govt facility Private facility missed delivery in reporting
Public Private Number %
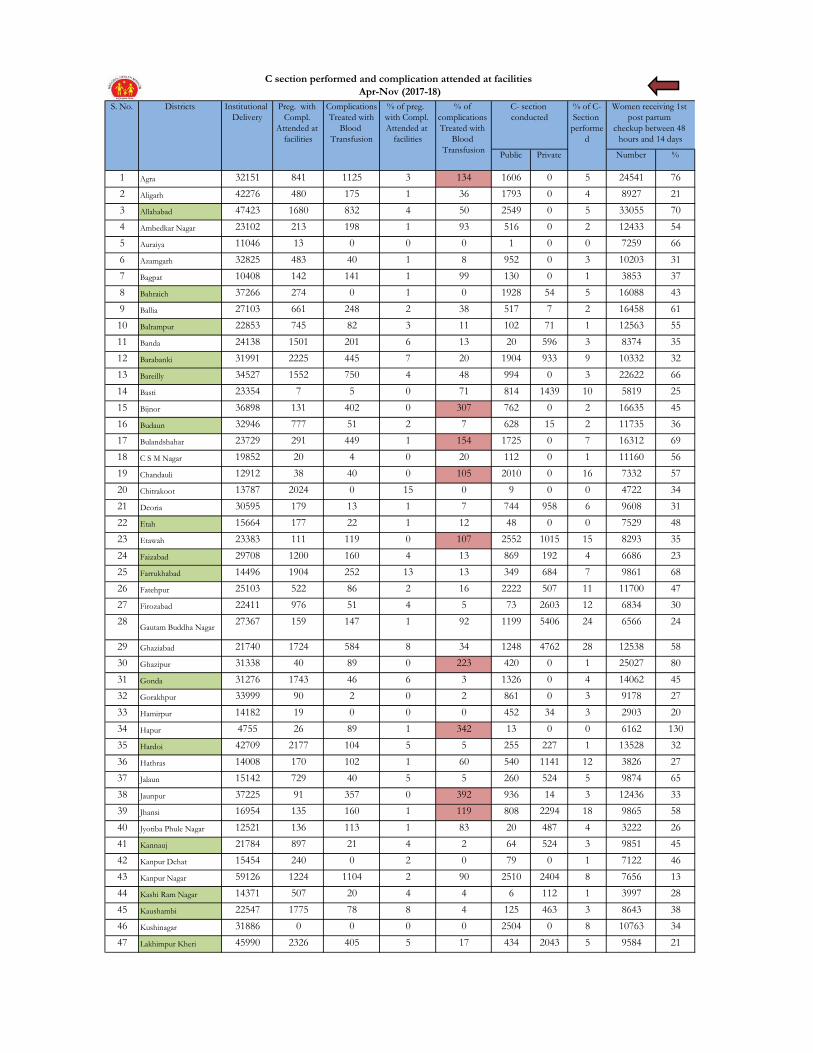
1 Agra 32151 841 1125 3 134 1606 0 5 24541 76
2 Aligarh 42276 480 175 1 36 1793 0 4 8927 21
3 Allahabad 47423 1680 832 4 50 2549 0 5 33055 70
4 Ambedkar Nagar 23102 213 198 1 93 516 0 2 12433 54
5 Auraiya 11046 13 0 0 0 1 0 0 7259 66
6 Azamgarh 32825 483 40 1 8 952 0 3 10203 31
7 Bagpat 10408 142 141 1 99 130 0 1 3853 37
8 Bahraich 37266 274 0 1 0 1928 54 5 16088 43
9 Ballia 27103 661 248 2 38 517 7 2 16458 61
10 Balrampur 22853 745 82 3 11 102 71 1 12563 55
11 Banda 24138 1501 201 6 13 20 596 3 8374 35
12 Barabanki 31991 2225 445 7 20 1904 933 9 10332 32
13 Bareilly 34527 1552 750 4 48 994 0 3 22622 66
14 Basti 23354 7 5 0 71 814 1439 10 5819 25
15 Bijnor 36898 131 402 0 307 762 0 2 16635 45
16 Budaun 32946 777 51 2 7 628 15 2 11735 36
17 Bulandshahar 23729 291 449 1 154 1725 0 7 16312 69
18 C S M Nagar 19852 20 4 0 20 112 0 1 11160 56
19 Chandauli 12912 38 40 0 105 2010 0 16 7332 57
20 Chitrakoot 13787 2024 0 15 0 9 0 0 4722 34
21 Deoria 30595 179 13 1 7 744 958 6 9608 31
22 Etah 15664 177 22 1 12 48 0 0 7529 48
23 Etawah 23383 111 119 0 107 2552 1015 15 8293 35
24 Faizabad 29708 1200 160 4 13 869 192 4 6686 23
25 Farrukhabad 14496 1904 252 13 13 349 684 7 9861 68
26 Fatehpur 25103 522 86 2 16 2222 507 11 11700 47
27 Firozabad 22411 976 51 4 5 73 2603 12 6834 30
28Gautam Buddha Nagar
27367 159 147 1 92 1199 5406 24 6566 24
29 Ghaziabad 21740 1724 584 8 34 1248 4762 28 12538 58
30 Ghazipur 31338 40 89 0 223 420 0 1 25027 80
31 Gonda 31276 1743 46 6 3 1326 0 4 14062 45
32 Gorakhpur 33999 90 2 0 2 861 0 3 9178 27
33 Hamirpur 14182 19 0 0 0 452 34 3 2903 20
34 Hapur 4755 26 89 1 342 13 0 0 6162 130
35 Hardoi 42709 2177 104 5 5 255 227 1 13528 32
36 Hathras 14008 170 102 1 60 540 1141 12 3826 27
37 Jalaun 15142 729 40 5 5 260 524 5 9874 65
38 Jaunpur 37225 91 357 0 392 936 14 3 12436 33
39 Jhansi 16954 135 160 1 119 808 2294 18 9865 58
40 Jyotiba Phule Nagar 12521 136 113 1 83 20 487 4 3222 26
41 Kannauj 21784 897 21 4 2 64 524 3 9851 45
42 Kanpur Dehat 15454 240 0 2 0 79 0 1 7122 46
43 Kanpur Nagar 59126 1224 1104 2 90 2510 2404 8 7656 13
44 Kashi Ram Nagar 14371 507 20 4 4 6 112 1 3997 28
45 Kaushambi 22547 1775 78 8 4 125 463 3 8643 38
46 Kushinagar 31886 0 0 0 0 2504 0 8 10763 34
47 Lakhimpur Kheri 45990 2326 405 5 17 434 2043 5 9584 21
Women receiving 1st
post partum
checkup between 48
hours and 14 days
C section performed and complication attended at facilities
Apr-Nov (2017-18)
Institutional
Delivery
Preg. with
Compl.
Attended at
facilities
C- section
conducted
% of C-
Section
performe
d
DistrictsS. No. Complications
Treated with
Blood
Transfusion
% of
complications
Treated with
Blood
Transfusion
% of preg.
with Compl.
Attended at
facilities

Public Private Number %
Women receiving 1st
post partum
checkup between 48
hours and 14 days
C section performed and complication attended at facilities
Apr-Nov (2017-18)
Institutional
Delivery
Preg. with
Compl.
Attended at
facilities
C- section
conducted
% of C-
Section
performe
d
DistrictsS. No. Complications
Treated with
Blood
Transfusion
% of
complications
Treated with
Blood
Transfusion
% of preg.
with Compl.
Attended at
facilities
48 Lalitpur 18500 373 910 2 244 608 283 5 18993 103
49 Lucknow 36079 5619 4115 16 73 9889 0 27 16617 46
50 Maharajganj 25063 619 6 2 1 29 175 1 14637 58
51 Mahoba 9399 636 102 7 16 85 0 1 2828 30
52 Mainpuri 15610 38 0 0 0 5 287 2 9497 61
53 Mathura 23324 158 113 1 72 355 0 2 3680 16
54 Maunathbhanjan 22870 22 1 0 5 43 0 0 7442 33
55 Meerut 16208 416 304 3 73 1575 812 15 13433 83
56 Mirzapur 22746 331 224 1 68 1299 0 6 8765 39
57 Moradabad 21607 240 616 1 257 1316 0 6 17399 81
58 Muzaffarnagar 34537 2210 3289 6 149 2478 0 7 13080 38
59 Pilibhit 16223 687 60 4 9 268 0 2 6343 39
60 Pratapgarh 27482 75 38 0 51 1261 0 5 14338 52
61 Rae Bareli 30871 1196 737 4 62 1380 1601 10 7010 23
62 Rampur 15534 1353 482 9 36 340 1307 11 14567 94
63 Saharanpur 28454 2062 772 7 37 3038 1189 15 15043 53
64 Sambhal 17013 168 0 1 0 0 0 0 9838 58
65 Sant Kabir Nagar 19180 340 8 2 2 132 261 2 9730 51
66 Sant Ravidas Nagar 14602 38 18 0 47 22 0 0 6238 43
67 Shahjahanpur 30755 1754 182 6 10 344 0 1 15722 51
68 Shamli 10700 93 39 1 42 53 92 1 7787 73
69 Shrawasti 18275 1100 804 6 73 14 0 0 6405 35
70 Siddharth Nagar 23906 325 43 1 13 122 34 1 17591 74
71 Sitapur 51523 4110 114 8 3 1619 0 3 25250 49
72 Sonbhadra 16921 1013 207 6 20 37 390 3 8610 51
73 Sultanpur 26411 131 328 0 250 1274 329 6 15626 59
74 Unnav 17950 33 0 0 0 640 0 4 12219 68
75 Varanasi 23749 501 440 2 88 2028 0 9 10697 45
1851813 59016 23304 3 39 70243 36269 6 837122 45
High Priority Districts
District performance:
Note: More than 100 % for data quality review)
>100%

Sr. No. District Total del. Inst. Del. % PW
Discharged
within 48
hrs of Del.
% Total Live
Births
% of live
Birth
against
total
delivery
No of
children
Weighted
at Birth
% Birth
Weight
<2.5 Kgs
% New Born
Breast Fed
within one
hour of Del.
%
1 Agra 35711 32151 90 9771 30 36317 102 34178 94 4181 12 33377 92
2 Aligarh 48602 42276 87 35211 83 49250 101 48650 99 7158 15 48395 98
3 Allahabad 53602 47423 88 43947 93 53125 99 52787 99 3886 7 51606 97
4 Ambedkar Nagar 25938 23102 89 17547 76 25731 99 25319 98 1921 8 24027 93
5 Auraiya 12886 11046 86 10570 96 12916 100 11123 86 811 7 11148 86
6 Azamgarh 36865 32825 89 22643 69 37894 103 36036 95 3339 9 35923 95
7 Bagpat 12198 10408 85 707 7 12180 100 11496 94 1091 9 11372 93
8 Bahraich 48365 37266 77 27584 74 49499 102 41400 84 4523 11 37269 75
9 Ballia 34708 27103 78 8720 32 36003 104 34868 97 2398 7 33444 93
10 Balrampur 36581 22853 62 16790 73 35763 98 33044 92 2763 8 33109 93
11 Banda 25284 24138 95 21613 90 25418 101 24535 97 3530 14 23784 94
12 Barabanki 34559 31991 93 21277 67 36874 107 33585 91 4914 15 30865 84
13 Bareilly 46633 34527 74 7668 22 49987 107 38123 76 2996 8 44292 89
14 Basti 26866 23354 87 19698 84 28102 105 23710 84 3837 16 24989 89
15 Bijnor 45581 36898 81 17934 49 53236 117 51139 96 11018 22 49090 92
16 Budaun 44532 32946 74 20365 62 44457 100 40151 90 5448 14 40995 92
17 Bulandshahar 32891 23729 72 13452 57 34667 105 33112 96 4176 13 32766 95
18 C S M Nagar 20660 19852 96 13303 67 21002 102 20393 97 1681 8 20089 96
19 Chandauli 15216 12912 85 10561 82 18011 118 17696 98 1642 9 17666 98
20 Chitrakoot 14387 13787 96 8316 60 14283 99 13241 93 2580 19 13646 96
21 Deoria 31993 30595 96 9747 32 33004 103 28466 86 1983 7 28612 87
22 Etah 21622 15664 72 7003 45 21529 100 20140 94 1204 6 20198 94
23 Etawah 23672 23383 99 19333 83 23624 100 22801 97 2869 13 22796 96
24 Faizabad 32652 29708 91 16490 56 30357 93 20235 67 1688 8 20684 68
25 Farrukhabad 20239 14496 72 9562 66 20752 103 18127 87 1882 10 18054 87
26 Fatehpur 32122 25103 78 21411 85 32550 101 31443 97 4624 15 30555 94
27 Firozabad 23641 22411 95 8203 37 29269 124 19732 67 2332 12 19568 67
28 Gautam Buddha Nagar 29174 27367 94 15035 55 29887 102 29341 98 5334 18 25651 86
29 Ghaziabad 33766 21740 64 10520 48 44199 131 32052 73 6854 21 28764 65
30 Ghazipur 34712 31338 90 21402 68 37604 108 36625 97 3186 9 36446 97
31 Gonda 41535 31276 75 29186 93 40409 97 35082 87 3413 10 37567 93
32 Gorakhpur 37408 33999 91 23097 68 45802 122 38384 84 2325 6 38408 84
33 Hamirpur 14562 14182 97 6696 47 14438 99 13985 97 1280 9 14161 98
34 Hapur 7835 4755 61 2154 45 8188 105 8001 98 682 9 7738 95
35 Hardoi 60743 42709 70 25219 59 59404 98 53900 91 5950 11 52711 89
36 Hathras 23668 14008 59 12324 88 27926 118 24468 88 3095 13 27915 100
37 Jalaun 16607 15142 91 11798 78 17215 104 17057 99 2302 13 17123 99
38 Jaunpur 46973 37225 79 27495 74 48823 104 43509 89 2862 7 42257 87
39 Jhansi 17499 16954 97 7135 42 17808 102 16764 94 2373 14 16680 94
40 Jyotiba Phule Nagar 19160 12521 65 2076 17 19001 99 17658 93 1937 11 17569 92
41 Kannauj 24079 21784 90 13783 63 24400 101 23636 97 1721 7 22743 93
42 Kanpur Dehat 16855 15454 92 9891 64 16798 100 16337 97 1058 6 15550 93
43 Kanpur Nagar 61406 59126 96 17639 30 60986 99 16961 28 4007 24 16422 27
Institutional Delvery and New Born Care
Apr-Nov (2017-18)

Sr. No. District Total del. Inst. Del. % PW
Discharged
within 48
hrs of Del.
% Total Live
Births
% of live
Birth
against
total
delivery
No of
children
Weighted
at Birth
% Birth
Weight
<2.5 Kgs
% New Born
Breast Fed
within one
hour of Del.
%
Institutional Delvery and New Born Care
Apr-Nov (2017-18)
44 Kashi Ram Nagar 18950 14371 76 9309 65 22213 117 19412 87 1065 5 19446 88
45 Kaushambi 24159 22547 93 14301 63 23731 98 20999 88 2395 11 20928 88
46 Kushinagar 39034 31886 82 21043 66 44324 114 43223 98 3465 8 42118 95
47 Lakhimpur Kheri 53303 45990 86 22800 50 54651 103 50931 93 7286 14 48801 89
48 Lalitpur 19136 18500 97 4132 22 18831 98 18689 99 2674 14 18012 96
49 Lucknow 37282 36079 97 18327 51 40009 107 38259 96 6494 17 33200 83
50 Maharajganj 30819 25063 81 16247 65 30608 99 29262 96 2274 8 29420 96
51 Mahoba 9490 9399 99 4843 52 9483 100 9421 99 1410 15 9167 97
52 Mainpuri 22251 15610 70 9853 63 25215 113 23036 91 1329 6 23938 95
53 Mathura 31174 23324 75 13052 56 25116 81 24755 99 3904 16 24545 98
54 Maunathbhanjan 25294 22870 90 20711 91 18455 73 16610 90 1659 10 15660 85
55 Meerut 21114 16208 77 7951 49 22468 106 21180 94 2722 13 20535 91
56 Mirzapur 30628 22746 74 8382 37 32966 108 30760 93 3167 10 30309 92
57 Moradabad 40599 21607 53 11845 55 40154 99 32679 81 1701 5 31781 79
58 Muzaffarnagar 42204 34537 82 26368 76 41774 99 40503 97 6996 17 39113 94
59 Pilibhit 21416 16223 76 4154 26 21058 98 18199 86 2507 14 18240 87
60 Pratapgarh 31711 27482 87 22356 81 30596 96 28710 94 2072 7 27962 91
61 Rae Bareli 31753 30871 97 13529 44 32015 101 29343 92 5546 19 27224 85
62 Rampur 26090 15534 60 11936 77 25684 98 25778 100 2350 9 25574 100
63 Saharanpur 36364 28454 78 21016 74 35435 97 34830 98 3322 10 40577 115
64 Sambhal 30936 17013 55 15188 89 31921 103 29761 93 2989 10 29904 94
65 Sant Kabir Nagar 22693 19180 85 13567 71 22614 100 20788 92 1167 6 20476 91
66 Sant Ravidas Nagar 15300 14602 95 12582 86 16880 110 16319 97 1162 7 16317 97
67 Shahjahanpur 44044 30755 70 12313 40 38670 88 38372 99 3950 10 36442 94
68 Shamli 13090 10700 82 4183 39 12888 98 12653 98 1923 15 12558 97
69 Shrawasti 21763 18275 84 14229 78 21234 98 18712 88 2848 15 17982 85
70 Siddharth Nagar 40051 23906 60 22628 95 39598 99 35355 89 1621 5 38063 96
71 Sitapur 64600 51523 80 33651 65 65908 102 58507 89 5632 10 63653 97
72 Sonbhadra 23264 16921 73 13469 80 23858 103 20125 84 2950 15 19868 83
73 Sultanpur 27049 26411 98 23080 87 26353 97 26201 99 2642 10 25531 97
74 Unnav 20756 17950 86 16457 92 22002 106 20684 94 3368 16 21262 97
75 Varanasi 24254 23749 98 17905 75 20542 85 19467 95 1294 7 19342 94
2264559 1851813 82 1156283 62 2315942 102 2082813 90 234738 11 2063972 89
High Priority Districts
District performance:
>100%
Note: More than 100 % for data quality review)

% % %
1 Agra 85345 785 345 24 1154 1.4 1.04 1.0 2.43
2 Aligarh 61141 580 2741 0 3321 5.4 37.73 24.9 11.89
3 Allahabad 112981 392 734 200 1326 1.2 3.47 3.5 1.81
4 Ambedkar Nagar 36034 204 23 0 227 0.6 0.00 0.0 0.00
5 Auraiya 26693 77 65 114 256 1.0 0.00 0.0 0.00
6 Azamgarh 78411 116 11 10 137 0.2 0.00 0.0 0.00
7 Bagpat 21194 321 79 7 407 1.9 0.00 0.0 0.00
8 Bahraich 76601 261 744 1025 2030 2.7 0.00 0.0 0.00
9 Ballia 57073 355 11 2 368 0.6 0.00 0.0 2.17
10 Balrampur 50133 82 164 32 278 0.6 0.00 0.0 0.00
11 Banda 40143 191 45 0 236 0.6 0.00 0.0 0.00
12 Barabanki 64027 494 245 0 739 1.2 0.00 0.5 0.41
13 Bareilly 72170 227 570 74 871 1.2 0.00 0.0 11.14
14 Basti 56910 123 1 0 124 0.2 0.00 0.0 0.00
15 Bijnor 63217 919 35 2 956 1.5 0.00 0.0 0.21
16 Budaun 73257 904 1812 2 2718 3.7 1.18 5.3 22.74
17 Bulandshahar 63502 575 1192 23 1790 2.8 18.38 0.0 32.29
18 C S M Nagar 30888 26 26 0 52 0.2 0.00 0.0 0.00
19 Chandauli 34362 62 40 11 113 0.3 0.00 0.0 0.00
20 Chitrakoot 17724 102 3 0 105 0.6 0.00 0.0 0.00
21 Deoria 52329 108 419 234 761 1.5 0.00 0.0 8.54
22 Etah 45052 135 105 11 251 0.6 0.00 0.0 0.00
23 Etawah 37516 84 116 0 200 0.5 1.00 1.0 4.00
24 Faizabad 38211 213 91 3 307 0.8 0.00 0.0 0.00
25 Farrukhabad 52427 415 648 47 1110 2.1 0.00 0.0 10.00
26 Fatehpur 54196 64 243 3 310 0.6 23.55 23.9 0.00
27 Firozabad 47083 240 1681 1 1922 4.1 0.00 0.0 0.00
28 Gautam Buddha Nagar 42442 7 339 1 347 0.8 0.00 0.0 12.39
29 Ghaziabad 71288 1020 909 2 1931 2.7 0.00 0.0 3.16
30 Ghazipur 65031 248 236 13 497 0.8 0.00 0.0 0.00
31 Gonda 75388 464 156 0 620 0.8 1.77 0.2 0.16
32 Gorakhpur 88759 26 852 0 878 1.0 0.00 4.6 0.00
33 Hamirpur 19146 164 252 1213 1629 8.5 0.00 0.0 0.00
34 Hapur 21106 51 145 0 196 0.9 0.00 0.0 0.00
35 Hardoi 80980 195 9 0 204 0.3 6.37 6.4 0.98
36 Hathras 35186 1 1069 0 1070 3.0 0.00 0.0 2.62
37 Jalaun 36604 508 571 0 1079 2.9 4.82 3.9 26.88
38 Jaunpur 79101 15 107 11 133 0.2 0.00 0.0 4.51
39 Jhansi 31753 162 1399 5 1566 4.9 0.00 0.0 0.00
40 Jyotiba Phule Nagar 29437 64 0 0 64 0.2 0.00 0.0 0.00
41 Kannauj 31292 74 23 0 97 0.3 0.00 0.0 49.48
42 Kanpur Dehat 39175 215 264 0 479 1.2 0.00 0.0 0.21
43 Kanpur Nagar 108451 370 1499 17 1886 1.7 0.27 0.1 0.21
44 Kashi Ram Nagar 32831 234 0 0 234 0.7 0.00 0.0 0.00
45 Kaushambi 31850 73 64 3 140 0.4 2.14 0.0 0.00
46 Kushinagar 57405 11 52 10 73 0.1 0.00 0.0 0.00
47 Lakhimpur Kheri 77184 262 500 0 762 1.0 0.00 0.0 8.40
48 Lalitpur 24586 131 245 0 376 1.5 9.04 1.3 25.80
49 Lucknow 101591 1393 1657 382 3432 3.4 1.72 1.8 14.95
50 Maharajganj 47756 96 2 0 98 0.2 0.00 0.0 0.00
51 Mahoba 26902 42 261 50 353 1.3 2.83 2.8 60.06
More than
12 weeks of
preg.
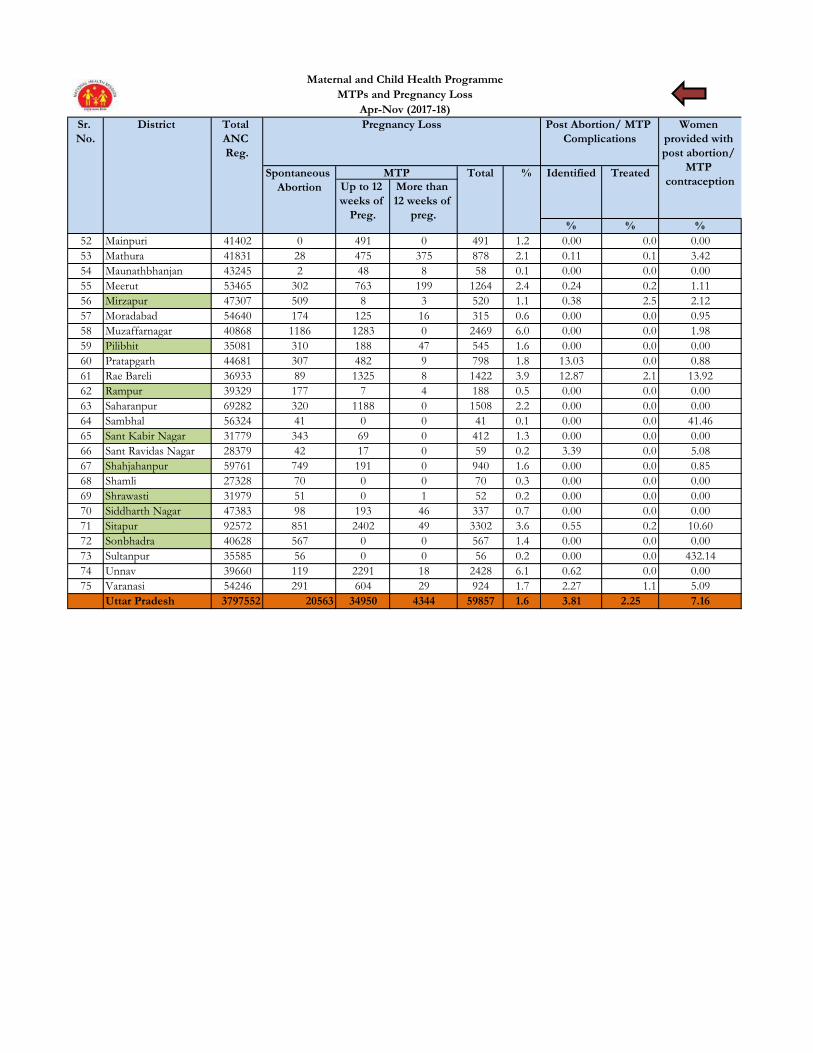
Maternal and Child Health Programme
MTPs and Pregnancy Loss
Apr-Nov (2017-18)
Sr.
No.
District Total
ANC
Reg.
Pregnancy Loss
Spontaneous
Abortion
MTP Total
Post Abortion/ MTP
Complications
%
Women
provided with
post abortion/
MTP
contraceptionTreatedIdentified
Up to 12
weeks of
Preg.
% % %
More than
12 weeks of
preg.
Maternal and Child Health Programme
MTPs and Pregnancy Loss
Apr-Nov (2017-18)
Sr.
No.
District Total
ANC
Reg.
Pregnancy Loss
Spontaneous
Abortion
MTP Total
Post Abortion/ MTP
Complications
%
Women
provided with
post abortion/
MTP
contraceptionTreatedIdentified
Up to 12
weeks of
Preg.
52 Mainpuri 41402 0 491 0 491 1.2 0.00 0.0 0.00
53 Mathura 41831 28 475 375 878 2.1 0.11 0.1 3.42
54 Maunathbhanjan 43245 2 48 8 58 0.1 0.00 0.0 0.00
55 Meerut 53465 302 763 199 1264 2.4 0.24 0.2 1.11
56 Mirzapur 47307 509 8 3 520 1.1 0.38 2.5 2.12
57 Moradabad 54640 174 125 16 315 0.6 0.00 0.0 0.95
58 Muzaffarnagar 40868 1186 1283 0 2469 6.0 0.00 0.0 1.98
59 Pilibhit 35081 310 188 47 545 1.6 0.00 0.0 0.00
60 Pratapgarh 44681 307 482 9 798 1.8 13.03 0.0 0.88
61 Rae Bareli 36933 89 1325 8 1422 3.9 12.87 2.1 13.92
62 Rampur 39329 177 7 4 188 0.5 0.00 0.0 0.00
63 Saharanpur 69282 320 1188 0 1508 2.2 0.00 0.0 0.00
64 Sambhal 56324 41 0 0 41 0.1 0.00 0.0 41.46
65 Sant Kabir Nagar 31779 343 69 0 412 1.3 0.00 0.0 0.00
66 Sant Ravidas Nagar 28379 42 17 0 59 0.2 3.39 0.0 5.08
67 Shahjahanpur 59761 749 191 0 940 1.6 0.00 0.0 0.85
68 Shamli 27328 70 0 0 70 0.3 0.00 0.0 0.00
69 Shrawasti 31979 51 0 1 52 0.2 0.00 0.0 0.00
70 Siddharth Nagar 47383 98 193 46 337 0.7 0.00 0.0 0.00
71 Sitapur 92572 851 2402 49 3302 3.6 0.55 0.2 10.60
72 Sonbhadra 40628 567 0 0 567 1.4 0.00 0.0 0.00
73 Sultanpur 35585 56 0 0 56 0.2 0.00 0.0 432.14
74 Unnav 39660 119 2291 18 2428 6.1 0.62 0.0 0.00
75 Varanasi 54246 291 604 29 924 1.7 2.27 1.1 5.09
Uttar Pradesh 3797552 20563 34950 4344 59857 1.6 3.81 2.25 7.16
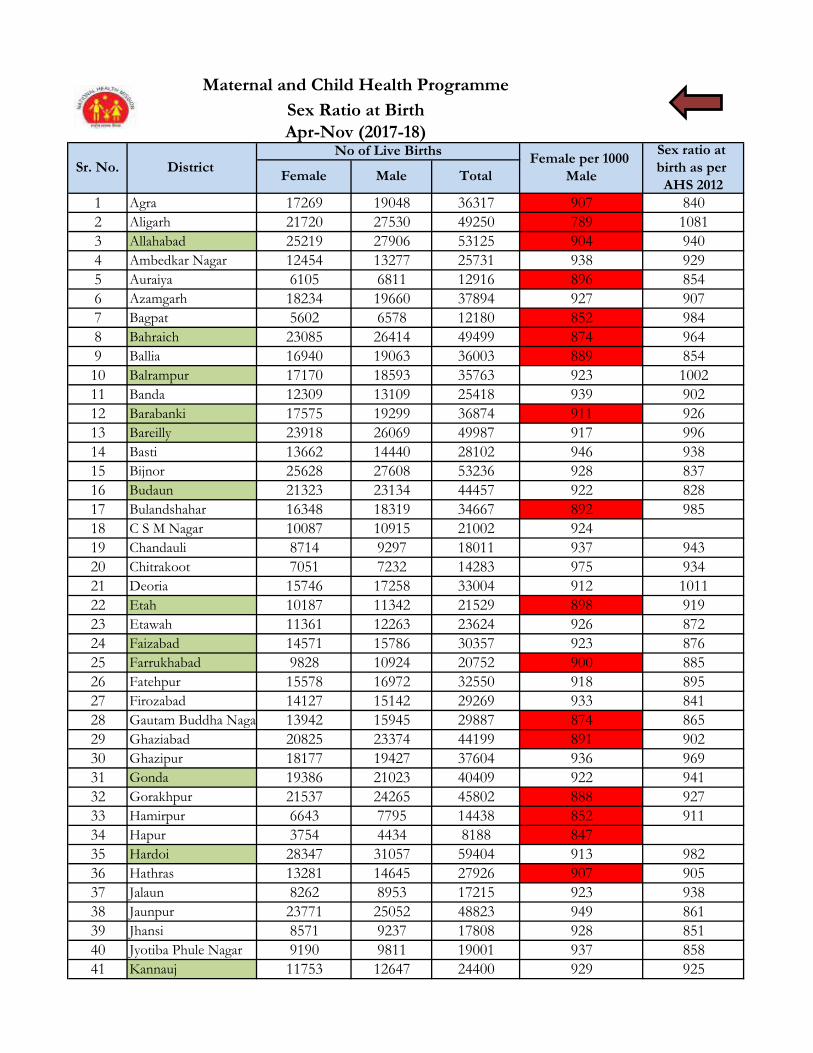
1 Agra 17269 19048 36317 907 840
2 Aligarh 21720 27530 49250 789 1081
3 Allahabad 25219 27906 53125 904 940
4 Ambedkar Nagar 12454 13277 25731 938 929
5 Auraiya 6105 6811 12916 896 854
6 Azamgarh 18234 19660 37894 927 907
7 Bagpat 5602 6578 12180 852 984
8 Bahraich 23085 26414 49499 874 964
9 Ballia 16940 19063 36003 889 854
10 Balrampur 17170 18593 35763 923 1002
11 Banda 12309 13109 25418 939 902
12 Barabanki 17575 19299 36874 911 926
13 Bareilly 23918 26069 49987 917 996
14 Basti 13662 14440 28102 946 938
15 Bijnor 25628 27608 53236 928 837
16 Budaun 21323 23134 44457 922 828
17 Bulandshahar 16348 18319 34667 892 985
18 C S M Nagar 10087 10915 21002 924
19 Chandauli 8714 9297 18011 937 943
20 Chitrakoot 7051 7232 14283 975 934
21 Deoria 15746 17258 33004 912 1011
22 Etah 10187 11342 21529 898 919
23 Etawah 11361 12263 23624 926 872
24 Faizabad 14571 15786 30357 923 876
25 Farrukhabad 9828 10924 20752 900 885
26 Fatehpur 15578 16972 32550 918 895
27 Firozabad 14127 15142 29269 933 841
28 Gautam Buddha Nagar 13942 15945 29887 874 865
29 Ghaziabad 20825 23374 44199 891 902
30 Ghazipur 18177 19427 37604 936 969
31 Gonda 19386 21023 40409 922 941
32 Gorakhpur 21537 24265 45802 888 927
33 Hamirpur 6643 7795 14438 852 911
34 Hapur 3754 4434 8188 847
35 Hardoi 28347 31057 59404 913 982
36 Hathras 13281 14645 27926 907 905
37 Jalaun 8262 8953 17215 923 938
38 Jaunpur 23771 25052 48823 949 861
39 Jhansi 8571 9237 17808 928 851
40 Jyotiba Phule Nagar 9190 9811 19001 937 858
41 Kannauj 11753 12647 24400 929 925
Sex ratio at
birth as per
AHS 2012
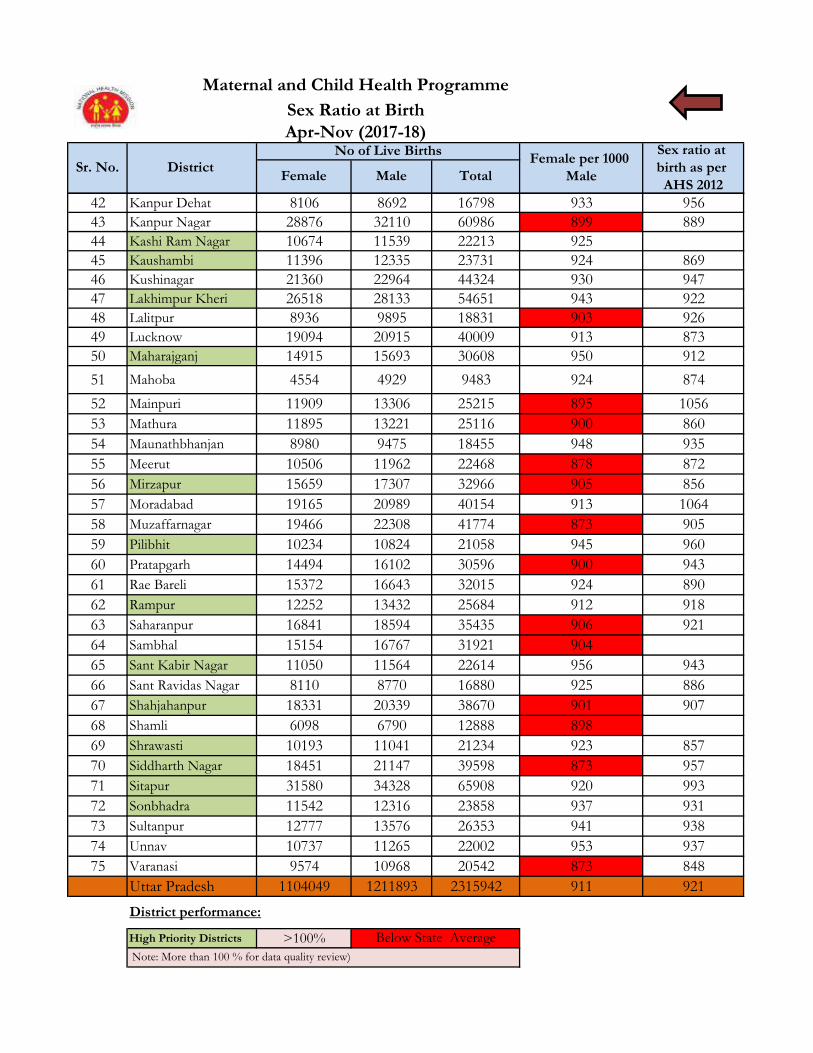
Maternal and Child Health Programme
Sex Ratio at Birth
Apr-Nov (2017-18)
Sr. No. District No of Live Births
Female per 1000
MaleFemale Male Total
Sex ratio at
birth as per
AHS 2012
Maternal and Child Health Programme
Sex Ratio at Birth
Apr-Nov (2017-18)
Sr. No. District No of Live Births
Female per 1000
MaleFemale Male Total
42 Kanpur Dehat 8106 8692 16798 933 956
43 Kanpur Nagar 28876 32110 60986 899 889
44 Kashi Ram Nagar 10674 11539 22213 925
45 Kaushambi 11396 12335 23731 924 869
46 Kushinagar 21360 22964 44324 930 947
47 Lakhimpur Kheri 26518 28133 54651 943 922
48 Lalitpur 8936 9895 18831 903 926
49 Lucknow 19094 20915 40009 913 873
50 Maharajganj 14915 15693 30608 950 912
51 Mahoba 4554 4929 9483 924 874
52 Mainpuri 11909 13306 25215 895 1056
53 Mathura 11895 13221 25116 900 860
54 Maunathbhanjan 8980 9475 18455 948 935
55 Meerut 10506 11962 22468 878 872
56 Mirzapur 15659 17307 32966 905 856
57 Moradabad 19165 20989 40154 913 1064
58 Muzaffarnagar 19466 22308 41774 873 905
59 Pilibhit 10234 10824 21058 945 960
60 Pratapgarh 14494 16102 30596 900 943
61 Rae Bareli 15372 16643 32015 924 890
62 Rampur 12252 13432 25684 912 918
63 Saharanpur 16841 18594 35435 906 921
64 Sambhal 15154 16767 31921 904
65 Sant Kabir Nagar 11050 11564 22614 956 943
66 Sant Ravidas Nagar 8110 8770 16880 925 886
67 Shahjahanpur 18331 20339 38670 901 907
68 Shamli 6098 6790 12888 898
69 Shrawasti 10193 11041 21234 923 857
70 Siddharth Nagar 18451 21147 39598 873 957
71 Sitapur 31580 34328 65908 920 993
72 Sonbhadra 11542 12316 23858 937 931
73 Sultanpur 12777 13576 26353 941 938
74 Unnav 10737 11265 22002 953 937
75 Varanasi 9574 10968 20542 873 848
Uttar Pradesh 1104049 1211893 2315942 911 921
High Priority Districts >100%
District performance:
Below State Average
Note: More than 100 % for data quality review)
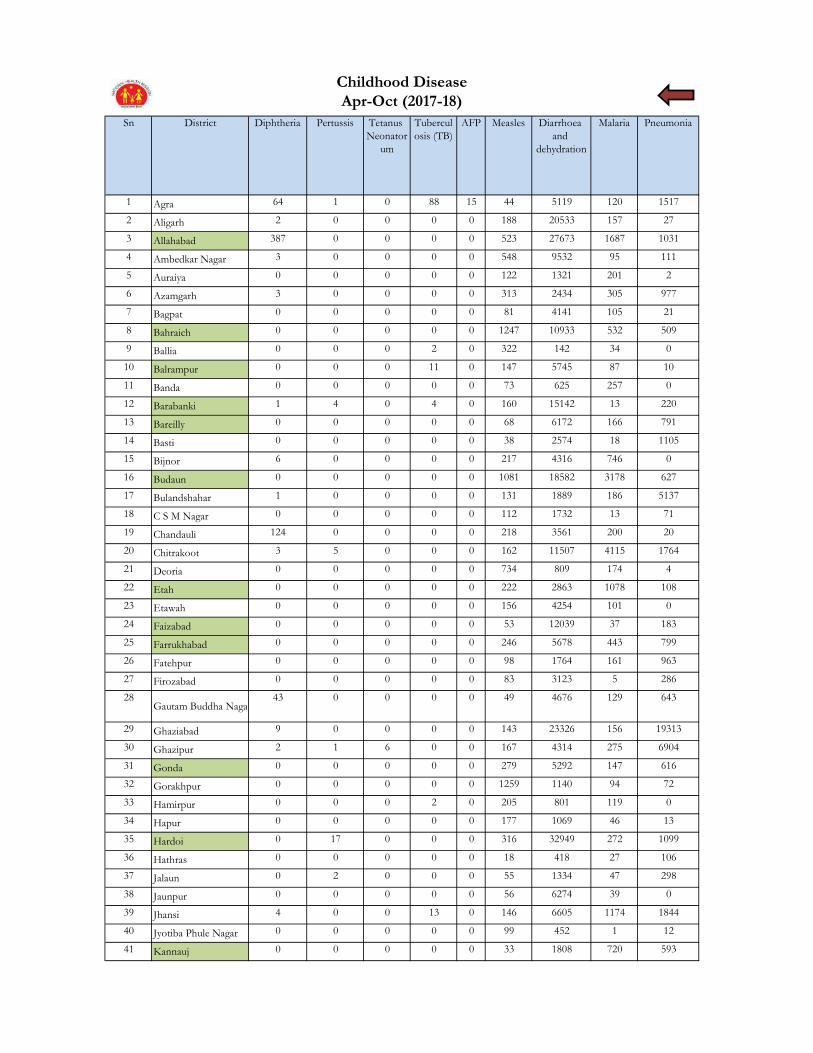
Sn District Diphtheria Pertussis Tetanus
Neonator
um
Tubercul
osis (TB)
AFP Measles Diarrhoea
and
dehydration
Malaria Pneumonia
1 Agra 64 1 0 88 15 44 5119 120 1517
2 Aligarh 2 0 0 0 0 188 20533 157 27
3 Allahabad 387 0 0 0 0 523 27673 1687 1031
4 Ambedkar Nagar 3 0 0 0 0 548 9532 95 111
5 Auraiya 0 0 0 0 0 122 1321 201 2
6 Azamgarh 3 0 0 0 0 313 2434 305 977
7 Bagpat 0 0 0 0 0 81 4141 105 21
8 Bahraich 0 0 0 0 0 1247 10933 532 509
9 Ballia 0 0 0 2 0 322 142 34 0
10 Balrampur 0 0 0 11 0 147 5745 87 10
11 Banda 0 0 0 0 0 73 625 257 0
12 Barabanki 1 4 0 4 0 160 15142 13 220
13 Bareilly 0 0 0 0 0 68 6172 166 791
14 Basti 0 0 0 0 0 38 2574 18 1105
15 Bijnor 6 0 0 0 0 217 4316 746 0
16 Budaun 0 0 0 0 0 1081 18582 3178 627
17 Bulandshahar 1 0 0 0 0 131 1889 186 5137
18 C S M Nagar 0 0 0 0 0 112 1732 13 71
19 Chandauli 124 0 0 0 0 218 3561 200 20
20 Chitrakoot 3 5 0 0 0 162 11507 4115 1764
21 Deoria 0 0 0 0 0 734 809 174 4
22 Etah 0 0 0 0 0 222 2863 1078 108
23 Etawah 0 0 0 0 0 156 4254 101 0
24 Faizabad 0 0 0 0 0 53 12039 37 183
25 Farrukhabad 0 0 0 0 0 246 5678 443 799
26 Fatehpur 0 0 0 0 0 98 1764 161 963
27 Firozabad 0 0 0 0 0 83 3123 5 286
28Gautam Buddha Nagar
43 0 0 0 0 49 4676 129 643
29 Ghaziabad 9 0 0 0 0 143 23326 156 19313
30 Ghazipur 2 1 6 0 0 167 4314 275 6904
31 Gonda 0 0 0 0 0 279 5292 147 616
32 Gorakhpur 0 0 0 0 0 1259 1140 94 72
33 Hamirpur 0 0 0 2 0 205 801 119 0
34 Hapur 0 0 0 0 0 177 1069 46 13
35 Hardoi 0 17 0 0 0 316 32949 272 1099
36 Hathras 0 0 0 0 0 18 418 27 106
37 Jalaun 0 2 0 0 0 55 1334 47 298
38 Jaunpur 0 0 0 0 0 56 6274 39 0
39 Jhansi 4 0 0 13 0 146 6605 1174 1844
40 Jyotiba Phule Nagar 0 0 0 0 0 99 452 1 12
41 Kannauj 0 0 0 0 0 33 1808 720 593
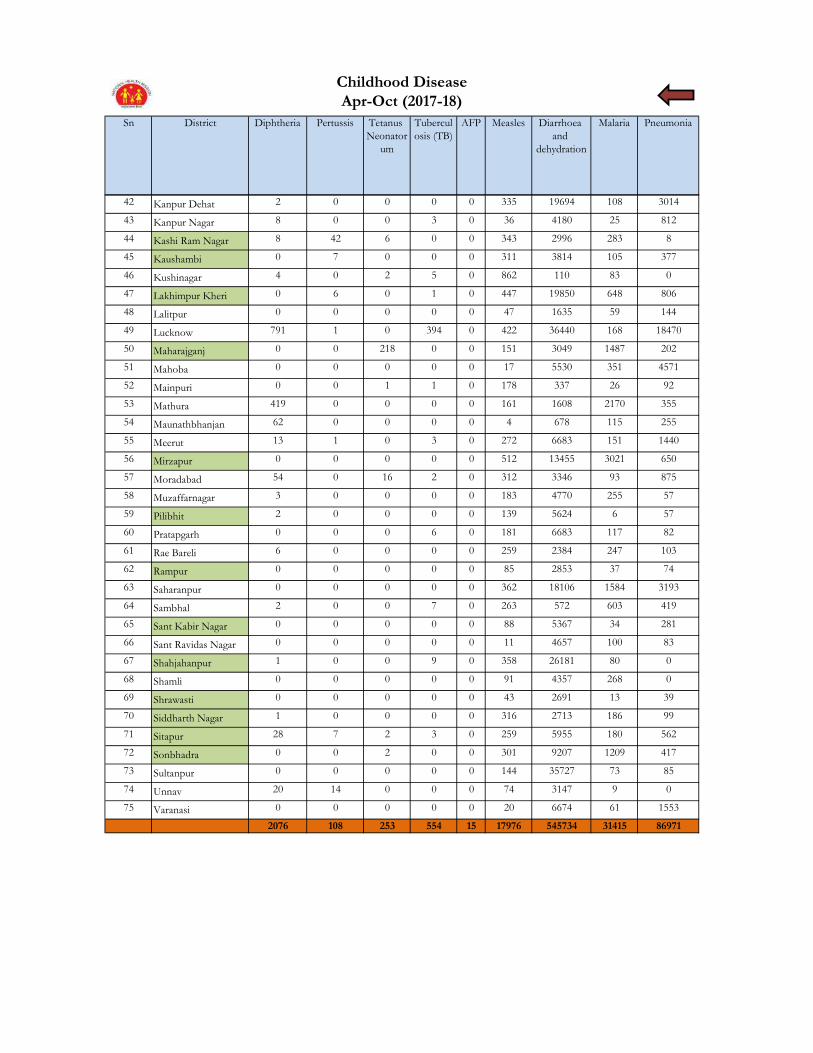
Childhood Disease
Apr-Oct (2017-18)
Sn District Diphtheria Pertussis Tetanus
Neonator
um
Tubercul
osis (TB)
AFP Measles Diarrhoea
and
dehydration
Malaria Pneumonia
Childhood Disease
Apr-Oct (2017-18)
42 Kanpur Dehat 2 0 0 0 0 335 19694 108 3014
43 Kanpur Nagar 8 0 0 3 0 36 4180 25 812
44 Kashi Ram Nagar 8 42 6 0 0 343 2996 283 8
45 Kaushambi 0 7 0 0 0 311 3814 105 377
46 Kushinagar 4 0 2 5 0 862 110 83 0
47 Lakhimpur Kheri 0 6 0 1 0 447 19850 648 806
48 Lalitpur 0 0 0 0 0 47 1635 59 144
49 Lucknow 791 1 0 394 0 422 36440 168 18470
50 Maharajganj 0 0 218 0 0 151 3049 1487 202
51 Mahoba 0 0 0 0 0 17 5530 351 4571
52 Mainpuri 0 0 1 1 0 178 337 26 92
53 Mathura 419 0 0 0 0 161 1608 2170 355
54 Maunathbhanjan 62 0 0 0 0 4 678 115 255
55 Meerut 13 1 0 3 0 272 6683 151 1440
56 Mirzapur 0 0 0 0 0 512 13455 3021 650
57 Moradabad 54 0 16 2 0 312 3346 93 875
58 Muzaffarnagar 3 0 0 0 0 183 4770 255 57
59 Pilibhit 2 0 0 0 0 139 5624 6 57
60 Pratapgarh 0 0 0 6 0 181 6683 117 82
61 Rae Bareli 6 0 0 0 0 259 2384 247 103
62 Rampur 0 0 0 0 0 85 2853 37 74
63 Saharanpur 0 0 0 0 0 362 18106 1584 3193
64 Sambhal 2 0 0 7 0 263 572 603 419
65 Sant Kabir Nagar 0 0 0 0 0 88 5367 34 281
66 Sant Ravidas Nagar 0 0 0 0 0 11 4657 100 83
67 Shahjahanpur 1 0 0 9 0 358 26181 80 0
68 Shamli 0 0 0 0 0 91 4357 268 0
69 Shrawasti 0 0 0 0 0 43 2691 13 39
70 Siddharth Nagar 1 0 0 0 0 316 2713 186 99
71 Sitapur 28 7 2 3 0 259 5955 180 562
72 Sonbhadra 0 0 2 0 0 301 9207 1209 417
73 Sultanpur 0 0 0 0 0 144 35727 73 85
74 Unnav 20 14 0 0 0 74 3147 9 0
75 Varanasi 0 0 0 0 0 20 6674 61 1553
2076 108 253 554 15 17976 545734 31415 86971

Estd. Still
birth as
per SRS
Still
Birth as
per
HMIS
1 Agra 88659 177 477 136 82 1852 21
2 Aligarh 74351 149 338 190 18 3448 34
3 Allahabad 120614 241 539 341 118 4303 98
4 Ambedkar Nagar 48545 97 359 177 108 1621 363
5 Auraiya 27772 56 154 67 36 749 37
6 Azamgarh 93429 187 187 252 18 2804 6
7 Bagpat 26353 53 146 40 18 633 52
8 Bahraich 70393 141 1040 258 15 3267 608
9 Ballia 65240 130 238 176 15 2484 63
10 Balrampur 43493 87 652 159 44 3111 112
11 Banda 36419 73 552 103 30 1398 84
12 Barabanki 65935 132 657 240 43 2507 116
13 Bareilly 90370 181 346 177 8 3899 110
14 Basti 49807 100 354 151 52 2276 8
15 Bijnor 74555 149 505 166 81 3301 183
16 Budaun 64608 129 663 127 83 3734 65
17 Bulandshahar 70803 142 323 107 52 2357 88
18 C S M Nagar 38567 77 355 120 68 1113 66
19 Chandauli 39519 79 280 111 9 1387 23
20 Chitrakoot 20048 40 143 57 9 957 53
21 Deoria 62710 125 334 189 20 2310 12
22 Etah 35642 71 255 91 14 1442 91
23 Etawah 31959 64 207 77 40 1323 455
24 Faizabad 49955 100 416 182 60 2671 106
25 Farrukhabad 38201 76 381 92 14 1619 126
26 Fatehpur 53280 107 272 151 17 1790 25
27 Firozabad 50530 101 196 77 50 1639 85
28 Gautam Buddha Nagar 33893 68 220 51 14 1704 20
29 Ghaziabad 68372 137 130 103 13 2033 143
30 Ghazipur 73317 147 419 206 44 2896 53
31 Gonda 69444 139 828 254 14 2869 78
32 Gorakhpur 89781 180 364 271 50 2840 62
33 Hamirpur 22343 45 195 63 13 650 17
34 Hapur 25966 52 47 39 4 409 19
35 Hardoi 82801 166 1280 258 7 4812 4459
36 Hathras 31686 63 183 81 0 1592 2
37 Jalaun 33812 68 212 79 18 1119 79
38 Jaunpur 90587 181 313 255 21 3662 1
39 Jhansi 40491 81 185 94 11 730 5
40 Jyotiba Phule Nagar 37213 74 247 83 54 1368 128
41 Kannauj 33555 67 312 81 12 1928 0
42 Kanpur Dehat 36329 73 268 87 17 1092 239
43 Kanpur Nagar 92547 185 460 222 26 2256 147
44 Kashi Ram Nagar 29105 58 564 75 4 1488 89
45 Kaushambi 32318 65 451 91 38 1946 150
46 Kushinagar 72064 144 550 218 58 3546 48
Maternal and Child Health Programme
MATERNAL AND INFANT DEATHS
Apr-Nov (2017-18)
Sr.
No.
District Estimated
Live
biirth
upto the
month
Estimated
Maternal
death (per
lakhs live
births)
No. of
Materna
l Deaths
No. of
Infant
Deaths
Estimated
infant death
(per lakhs live
births)
Outcome of Delivery
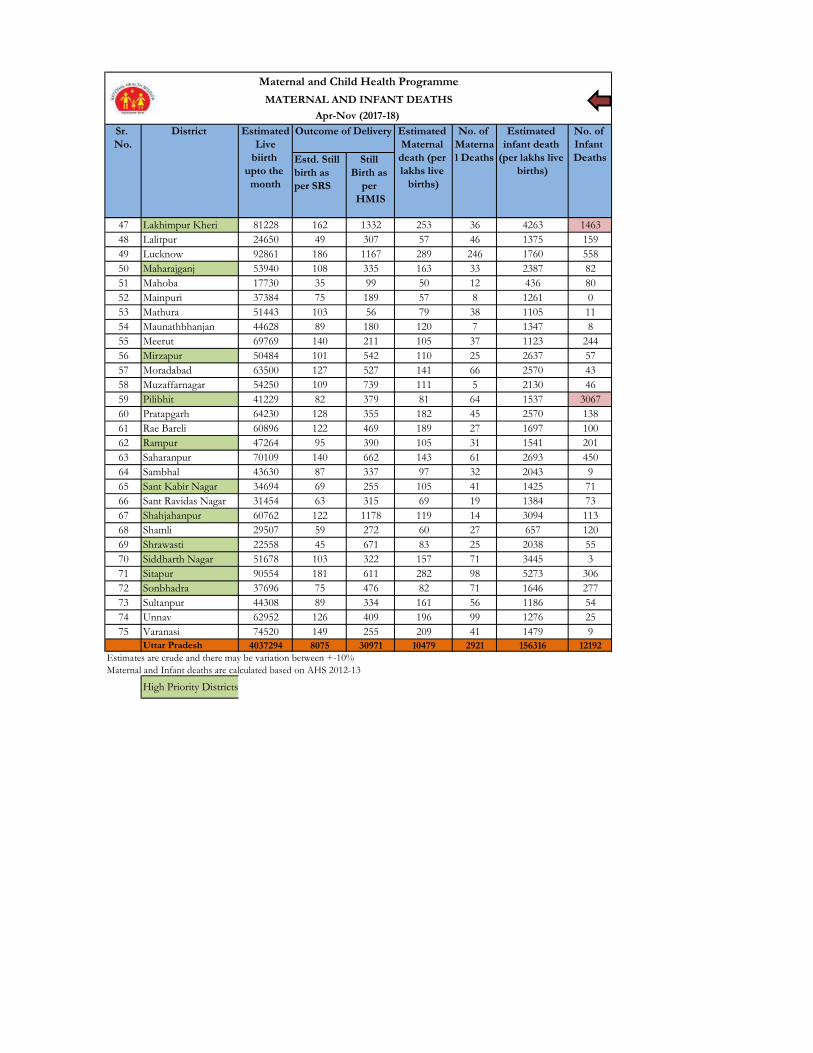
Estd. Still
birth as
per SRS
Still
Birth as
per
HMIS
Maternal and Child Health Programme
MATERNAL AND INFANT DEATHS
Apr-Nov (2017-18)
Sr.
No.
District Estimated
Live
biirth
upto the
month
Estimated
Maternal
death (per
lakhs live
births)
No. of
Materna
l Deaths
No. of
Infant
Deaths
Estimated
infant death
(per lakhs live
births)
Outcome of Delivery
47 Lakhimpur Kheri 81228 162 1332 253 36 4263 1463
48 Lalitpur 24650 49 307 57 46 1375 159
49 Lucknow 92861 186 1167 289 246 1760 558
50 Maharajganj 53940 108 335 163 33 2387 82
51 Mahoba 17730 35 99 50 12 436 80
52 Mainpuri 37384 75 189 57 8 1261 0
53 Mathura 51443 103 56 79 38 1105 11
54 Maunathbhanjan 44628 89 180 120 7 1347 8
55 Meerut 69769 140 211 105 37 1123 244
56 Mirzapur 50484 101 542 110 25 2637 57
57 Moradabad 63500 127 527 141 66 2570 43
58 Muzaffarnagar 54250 109 739 111 5 2130 46
59 Pilibhit 41229 82 379 81 64 1537 3067
60 Pratapgarh 64230 128 355 182 45 2570 138
61 Rae Bareli 60896 122 469 189 27 1697 100
62 Rampur 47264 95 390 105 31 1541 201
63 Saharanpur 70109 140 662 143 61 2693 450
64 Sambhal 43630 87 337 97 32 2043 9
65 Sant Kabir Nagar 34694 69 255 105 41 1425 71
66 Sant Ravidas Nagar 31454 63 315 69 19 1384 73
67 Shahjahanpur 60762 122 1178 119 14 3094 113
68 Shamli 29507 59 272 60 27 657 120
69 Shrawasti 22558 45 671 83 25 2038 55
70 Siddharth Nagar 51678 103 322 157 71 3445 3
71 Sitapur 90554 181 611 282 98 5273 306
72 Sonbhadra 37696 75 476 82 71 1646 277
73 Sultanpur 44308 89 334 161 56 1186 54
74 Unnav 62952 126 409 196 99 1276 25
75 Varanasi 74520 149 255 209 41 1479 9
Uttar Pradesh 4037294 8075 30971 10479 2921 156316 12192
Estimates are crude and there may be variation between +-10%
Maternal and Infant deaths are calculated based on AHS 2012-13
High Priority Districts

Number ratio per
1000
population
Number ratio per
1000
population
Number ratio per
1000
population
1 Agra 4935347 1366387 277 95575 19 364910 74
2 Aligarh 4138912 1797510 434 58124 14 324131 78
3 Allahabad 6714234 3071569 457 95901 14 837606 125
4 Ambedkar Nagar 2702355 627649 232 38685 14 262882 97
5 Auraiya 1546001 349048 226 20200 13 32319 21
6 Azamgarh 5200901 1074316 207 45510 9 137270 26
7 Bagpat 1466993 828984 565 25643 17 123080 84
8 Bahraich 3918562 1091854 279 97195 25 370243 94
9 Ballia 3631714 1109745 306 52334 14 270187 74
10 Balrampur 2421112 685019 283 42449 18 156506 65
11 Banda 2027341 451355 223 28868 14 206275 102
12 Barabanki 3670403 1328988 362 51449 14 898988 245
13 Bareilly 5030602 1590541 316 57823 11 239859 48
14 Basti 2772596 596623 215 53781 19 297053 107
15 Bijnor 4150231 1345415 324 33226 8 178866 43
16 Budaun 3596517 822448 229 76755 21 63754 18
17 Bulandshahar 3941374 1905696 484 258405 66 285228 72
18 C S M Nagar 2146915 567746 264 21826 10 81066 38
19 Chandauli 2199903 351742 160 9835 4 33631 15
20 Chitrakoot 1116028 601489 539 38210 34 196967 176
21 Deoria 3490887 773551 222 43246 12 22522 6
22 Etah 1984092 563764 284 34973 18 65569 33
23 Etawah 1779061 933354 525 123688 70 751271 422
24 Faizabad 2780836 874998 315 41346 15 259177 93
25 Farrukhabad 2126520 813819 383 38685 18 153247 72
26 Fatehpur 2965949 818934 276 42031 14 283452 96
27 Firozabad 2812821 857569 305 68583 24 294551 105
28 Gautam Buddha Nagar 1886712 1170627 620 45624 24 409715 217
29 Ghaziabad 3806075 1118312 294 61151 16 429917 113
30 Ghazipur 4081319 627361 154 44787 11 51763 13
31 Gonda 3865757 1154121 299 84306 22 118485 31
32 Gorakhpur 4997852 1600732 320 120892 24 394716 79
33 Hamirpur 1243776 751349 604 48432 39 164091 132
34 Hapur 1445460 408723 283 11075 8 74482 52
35 Hardoi 4609299 1349324 293 102021 22 305718 66
36 Hathras 1763874 552691 313 37724 21 147383 84
37 Jalaun 1882211 885118 470 48853 26 360179 191
38 Jaunpur 5042687 905007 179 106981 21 175325 35
39 Jhansi 2254026 996858 442 80180 36 116336 52
40 Jyotiba Phule Nagar 2071536 830812 401 36330 18 109685 53
41 Kannauj 1867888 507382 272 49106 26 94887 51
42 Kanpur Dehat 2022328 673723 333 41179 20 81305 40
43 Kanpur Nagar 5151830 1553516 302 34078 7 440996 86
44 Kashi Ram Nagar 1620209 332441 205 14229 9 36549 23
45 Kaushambi 1799057 532099 296 34833 19 108779 60
46 Kushinagar 4011586 612327 153 43507 11 102469 26
47 Lakhimpur Kheri 4521710 1274295 282 82573 18 262929 58
48 Lalitpur 1372185 853820 622 54690 40 163644 119
49 Lucknow 5169296 7672021 1484 413630 80 3409548 660
50 Maharajganj 3002685 841995 280 59273 20 80317 27
51 Mahoba 986953 619303 627 47439 48 181866 184
52 Mainpuri 2081025 630537 303 41189 20 149795 72
53 Mathura 2863666 803024 280 27776 10 185360 65
54 Maunathbhanjan 2484317 550099 221 17481 7 34542 14
Outpatient - AllopathicPopulation
Hospital services
OPD, IPD and Lab Test conducted at public health facilities
Apr-Nov (2017-18)
Sr. No. District Lab test Inpatient
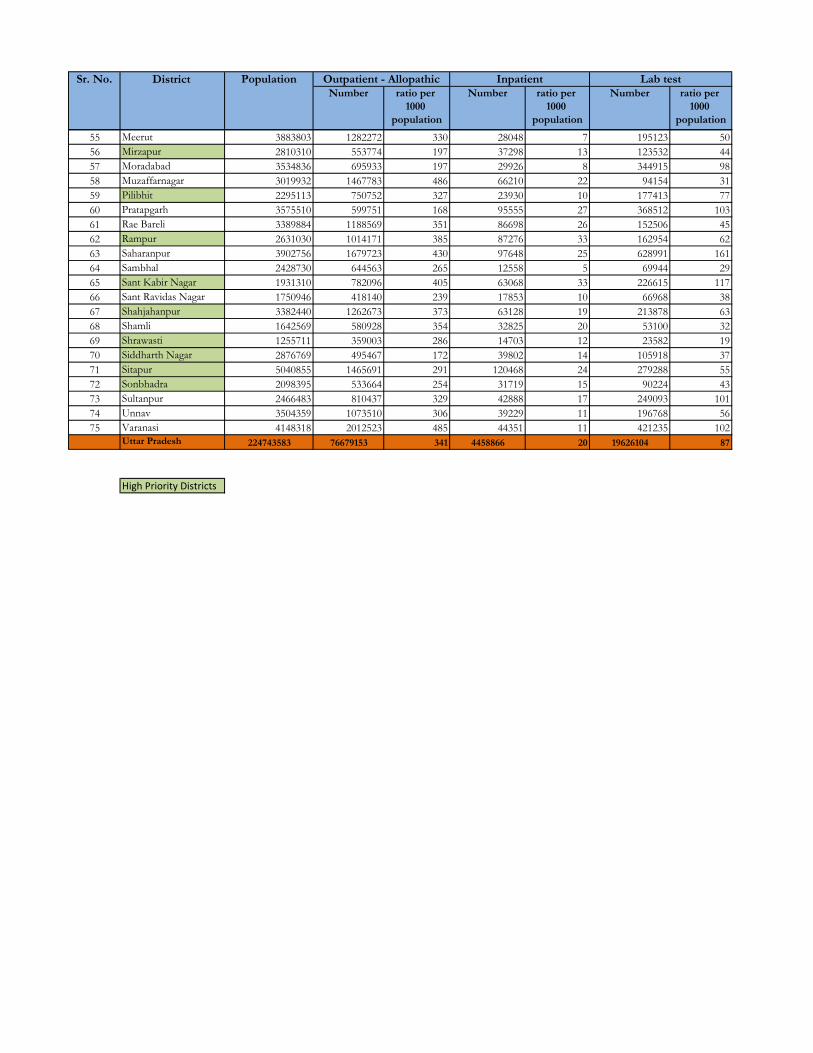
Number ratio per
1000
population
Number ratio per
1000
population
Number ratio per
1000
population
Outpatient - AllopathicPopulation Sr. No. District Lab test Inpatient
55 Meerut 3883803 1282272 330 28048 7 195123 50
56 Mirzapur 2810310 553774 197 37298 13 123532 44
57 Moradabad 3534836 695933 197 29926 8 344915 98
58 Muzaffarnagar 3019932 1467783 486 66210 22 94154 31
59 Pilibhit 2295113 750752 327 23930 10 177413 77
60 Pratapgarh 3575510 599751 168 95555 27 368512 103
61 Rae Bareli 3389884 1188569 351 86698 26 152506 45
62 Rampur 2631030 1014171 385 87276 33 162954 62
63 Saharanpur 3902756 1679723 430 97648 25 628991 161
64 Sambhal 2428730 644563 265 12558 5 69944 29
65 Sant Kabir Nagar 1931310 782096 405 63068 33 226615 117
66 Sant Ravidas Nagar 1750946 418140 239 17853 10 66968 38
67 Shahjahanpur 3382440 1262673 373 63128 19 213878 63
68 Shamli 1642569 580928 354 32825 20 53100 32
69 Shrawasti 1255711 359003 286 14703 12 23582 19
70 Siddharth Nagar 2876769 495467 172 39802 14 105918 37
71 Sitapur 5040855 1465691 291 120468 24 279288 55
72 Sonbhadra 2098395 533664 254 31719 15 90224 43
73 Sultanpur 2466483 810437 329 42888 17 249093 101
74 Unnav 3504359 1073510 306 39229 11 196768 56
75 Varanasi 4148318 2012523 485 44351 11 421235 102
Uttar Pradesh 224743583 76679153 341 4458866 20 19626104 87
High Priority Districts

PHC CHC DH PHC CHC DH PHC CHC DH PHC CHC DH
1 Agra 75 16 3 48 75 33 65 88 67 89 94 33
2 Aligarh 53 13 4 23 38 75 43 23 75 96 92 75
3 Allahabad 83 19 7 34 89 71 31 89 71 92 95 71
4 Ambedkar Nagar 28 10 2 54 90 50 86 100 50 79 100 50
5 Auraiya 26 7 2 4 43 50 46 100 50 88 100 50
6 Azamgarh 77 19 3 13 11 0 17 37 0 31 16 0
7 Bagpat 24 7 1 21 86 100 75 86 100 100 100 100
8 Bahraich 61 6 2 3 33 100 16 67 100 18 33 100
9 Ballia 81 9 2 6 22 50 26 22 100 63 89 50
10 Balrampur 25 9 3 16 44 100 60 67 67 100 78 100
11 Banda 52 4 2 29 100 100 35 75 50 81 100 50
12 Barabanki 55 17 2 40 82 100 44 76 100 89 82 100
13 Bareilly 74 6 2 28 33 50 35 83 50 77 83 50
14 Basti 37 9 4 51 78 25 100 78 25 92 78 25
15 Bijnor 64 7 2 20 86 100 48 57 100 92 71 100
16 Budaun 57 8 2 9 38 0 40 75 0 63 75 0
17 Bulandshahar 71 10 4 30 50 50 70 90 50 86 90 50
18 C S M Nagar 31 13 0 10 54 0 65 69 0 61 85 0
19 Chandauli 30 4 3 0 50 0 3 50 0 30 75 0
20 Chitrakoot 28 6 1 64 50 100 100 83 100 96 83 100
21 Deoria 76 16 2 18 6 50 32 31 50 63 31 50
22 Etah 34 4 2 9 100 50 35 100 100 65 100 100
23 Etawah 33 8 3 21 63 67 70 75 100 94 88 100
24 Faizabad 40 5 3 68 100 67 95 100 67 90 100 67
25 Farrukhabad 32 6 3 13 83 67 72 100 67 97 100 33
26 Fatehpur 48 7 2 29 100 100 35 100 100 92 100 100
27 Firozabad 19 3 3 79 67 100 84 100 67 84 100 67
28 Gautam Buddha Nagar 37 5 2 32 60 50 57 60 50 89 100 50
29 Ghaziabad 51 4 3 59 100 100 24 100 100 100 100 100
30 Ghazipur 12 6 2 42 100 0 58 100 0 100 100 0
31 Gonda 52 16 2 21 81 50 19 81 100 96 94 50
32 Gorakhpur 85 9 3 35 100 67 49 78 67 87 100 33
33 Hamirpur 40 4 2 48 100 100 58 100 100 80 100 100
34 Hapur 26 4 0 12 100 0 12 100 0 100 100 0
35 Hardoi 61 7 2 15 100 100 56 100 100 75 100 100
36 Hathras 27 7 2 11 71 100 22 29 100 78 71 100
37 Jalaun 41 7 3 37 100 67 95 100 67 100 100 67
38 Jaunpur 13 11 2 38 45 0 46 91 0 54 91 0
39 Jhansi 53 8 3 45 63 67 74 100 67 85 100 33
40 Jyotiba Phule Nagar 31 8 1 13 75 100 97 88 100 97 88 100
41 Kannauj 30 7 2 30 100 50 63 100 50 100 100 50
42 Kanpur Dehat 31 6 1 19 50 0 45 67 0 77 83 0
43 Kanpur Nagar 81 10 6 43 70 0 35 80 0 80 90 0
44 Kashi Ram Nagar 31 7 1 19 71 100 19 86 100 77 86 100
45 Kaushambi 35 5 1 9 40 100 6 40 100 6 40 100
46 Kushinagar 59 9 1 5 0 100 8 0 100 10 22 100
47 Lakhimpur Kheri 60 14 2 20 57 50 55 71 50 63 79 50
48 Lalitpur 27 4 2 4 50 100 67 50 100 70 50 100
49 Lucknow 80 17 11 70 88 64 58 88 73 86 94 73
50 Maharajganj 40 12 1 28 75 0 53 83 0 100 92 0
51 Mahoba 17 4 2 41 100 50 88 100 50 88 100 50
52 Mainpuri 47 5 2 11 40 100 26 80 100 60 80 100
53 Mathura 37 7 3 27 100 33 38 71 67 68 100 67
54 Maunathbhanjan 43 6 2 7 50 100 12 67 100 65 83 100
55 Meerut 57 12 3 25 83 0 84 83 0 77 92 0
56 Mirzapur 38 14 2 39 50 50 53 79 50 61 79 50
57 Moradabad 31 3 2 74 67 100 39 100 50 97 100 0
58 Muzaffarnagar 49 4 2 8 50 50 76 100 50 90 100 50
59 Pilibhit 33 6 2 12 83 0 33 100 50 42 100 0
Sr.
No.District
Hospital services
Apr-Sep (2017-18)
% facilities conducted essential facility (OPD, IPD and Lab test) services in any month
% of facilities conducted any
outpatient services
% of facilities conducted any
Inpaitient services
% of facilities conducted any
lab test services
No of facilities in the
districts
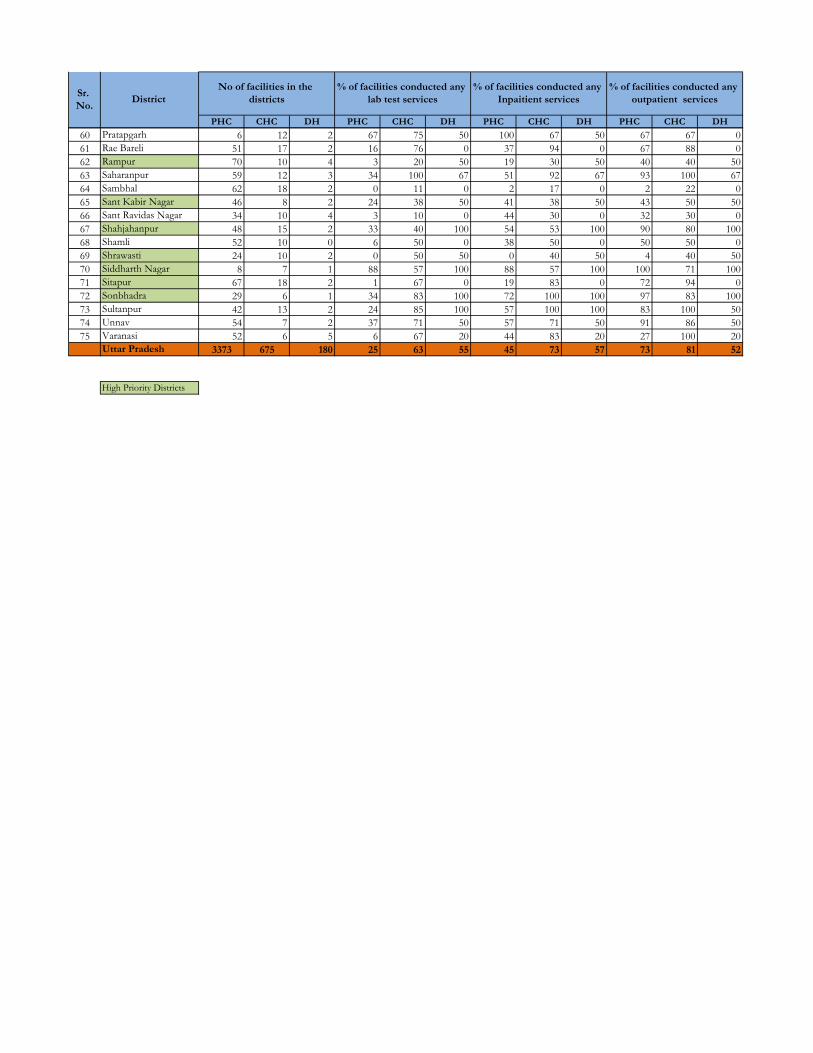
PHC CHC DH PHC CHC DH PHC CHC DH PHC CHC DH
Sr.
No.District
% of facilities conducted any
outpatient services
% of facilities conducted any
Inpaitient services
% of facilities conducted any
lab test services
No of facilities in the
districts
60 Pratapgarh 6 12 2 67 75 50 100 67 50 67 67 0
61 Rae Bareli 51 17 2 16 76 0 37 94 0 67 88 0
62 Rampur 70 10 4 3 20 50 19 30 50 40 40 50
63 Saharanpur 59 12 3 34 100 67 51 92 67 93 100 67
64 Sambhal 62 18 2 0 11 0 2 17 0 2 22 0
65 Sant Kabir Nagar 46 8 2 24 38 50 41 38 50 43 50 50
66 Sant Ravidas Nagar 34 10 4 3 10 0 44 30 0 32 30 0
67 Shahjahanpur 48 15 2 33 40 100 54 53 100 90 80 100
68 Shamli 52 10 0 6 50 0 38 50 0 50 50 0
69 Shrawasti 24 10 2 0 50 50 0 40 50 4 40 50
70 Siddharth Nagar 8 7 1 88 57 100 88 57 100 100 71 100
71 Sitapur 67 18 2 1 67 0 19 83 0 72 94 0
72 Sonbhadra 29 6 1 34 83 100 72 100 100 97 83 100
73 Sultanpur 42 13 2 24 85 100 57 100 100 83 100 50
74 Unnav 54 7 2 37 71 50 57 71 50 91 86 50
75 Varanasi 52 6 5 6 67 20 44 83 20 27 100 20
Uttar Pradesh 3373 675 180 25 63 55 45 73 57 73 81 52
High Priority Districts