hiv-induced changes in t cell signaling pathways - the journal of
TRANSCRIPT

of January 4, 2019.This information is current as
PathwaysHIV-Induced Changes in T Cell Signaling
G. Deeks and Joseph M. McCuneMarc Schweneker, David Favre, Jeffrey N. Martin, Steven
http://www.jimmunol.org/content/180/10/6490doi: 10.4049/jimmunol.180.10.6490
2008; 180:6490-6500; ;J Immunol
Referenceshttp://www.jimmunol.org/content/180/10/6490.full#ref-list-1
, 29 of which you can access for free at: cites 65 articlesThis article
average*
4 weeks from acceptance to publicationFast Publication! •
Every submission reviewed by practicing scientistsNo Triage! •
from submission to initial decisionRapid Reviews! 30 days* •
Submit online. ?The JIWhy
Subscriptionhttp://jimmunol.org/subscription
is online at: The Journal of ImmunologyInformation about subscribing to
Permissionshttp://www.aai.org/About/Publications/JI/copyright.htmlSubmit copyright permission requests at:
Email Alertshttp://jimmunol.org/alertsReceive free email-alerts when new articles cite this article. Sign up at:
Print ISSN: 0022-1767 Online ISSN: 1550-6606. Immunologists All rights reserved.Copyright © 2008 by The American Association of1451 Rockville Pike, Suite 650, Rockville, MD 20852The American Association of Immunologists, Inc.,
is published twice each month byThe Journal of Immunology
by guest on January 4, 2019http://w
ww
.jimm
unol.org/D
ownloaded from
by guest on January 4, 2019
http://ww
w.jim
munol.org/
Dow
nloaded from

HIV-Induced Changes in T Cell Signaling Pathways1
Marc Schweneker,2* David Favre,* Jeffrey N. Martin,‡ Steven G. Deeks,†
and Joseph M. McCune3*†
Infection with HIV usually results in chronic activation of the immune system, with profound quantitative and qualitative changesin the T cell compartment. To better understand the mechanistic basis for T cell dysfunction and to discern whether suchmechanisms are reversed after effective antiviral treatment, we analyzed changes in signaling pathways of human CD4� and CD8�
T cells from 57 HIV-infected subjects in varying stages of disease progression and treatment, including long-term nonprogressors,progressors, and chronically infected subjects provided effective antiretroviral therapy (responders). A previously describedPhosFlow method was adapted and optimized so that protein phosphorylation could be visualized in phenotypically definedsubpopulations of CD4� and CD8� T cells (naive, memory, and effector) by flow cytometry. T cell signaling induced by TCRcross-linking, IL-2, or PMA/ionomycin was found to be blunted within all T cell subpopulations in those with progressive HIVdisease compared with long-term nonprogressors and responders. Although alterations in cellular signaling correlated with levelsof basal phosphorylation, viral load, and/or expression of programmed death-1, it was the level of basal phosphorylation thatappeared to be the factor most dominantly associated with impaired signaling. Notably, provision of effective antiretroviraltherapy was associated with a normalization of both basal phosphorylation levels and T cell signaling. These data, in aggregate,suggest that generalized dysfunction of the T cell compartment during progressive HIV disease may be in part dependent uponan increased basal level of phosphorylation, which itself may be due to the heightened state of immune activation found inadvanced disease. The Journal of Immunology, 2008, 180: 6490–6500.
T he T cell plays a major role in the cellular response to theHIV infection, inhibiting virus replication either throughsecretion of IFNs and other suppressive factors or by di-
rect cytotoxicity (1–9). Even in the face of a vigorous T cell re-sponse to HIV, however, viral replication usually proceeds un-checked and disease progression occurs.
CD4� T cells play an important role in immune responses, bothby providing help to B cells and by facilitating the generation andactivity of CD8� CTLs (10). A major characteristic of HIV diseaseis the decline of CD4� T cell numbers due to a shortened survivaltime and a failure to increase T cell production (11–15). In additionto the loss of numbers, CD4� T cells have functional defects,
reduced proliferative capacity, abnormal cytokine profiles, and de-fective responses to and production of IL-2 (16–20).
Changes in the number and function of CD4� T cells alone,however, would not fully explain HIV disease progression. CD4�
T cells are critical for effective CD8� T cell responses (10) andloss of numbers and function within the CD4� T cell compartmentmight, in turn, have detrimental effects on CD8� T cell compart-ment. By example, HIV-specific CD8� T cells have been reportedto express only low levels of perforin, a key mediator of cytolyticactivity, even though they can still produce antiviral cytokines andchemokines (21–23). Defective cytolytic activity has been associ-ated with a specific CD8� T cell subpopulation, the less differen-tiated CD8�CD27� T cell subset (22), suggesting an associationbetween impaired T cell function with skewed maturation and animmature phenotype (24, 25). Finally, CD8� T cells have lowerlevels of CD3� and CD28, features associated with defects in stim-ulation via the TCR (26, 27).
Multiple mechanisms might underlie impaired T cell function,including defects in differentiation (28, 29), impaired signaling viathe TCR (30, 31), and down-modulation and/or modification ofmolecules critical for T cell signaling (26, 27, 32, 33). Signalingdefects have also been found in rhesus macaques after experimen-tal SIV infection (34, 35). However, cellular function and signalingproperties are in large part dictated by the stage of T cell activationand/or differentiation (36–38), making it difficult to discern cell-specific defects when heterogeneous populations of cells are ana-lyzed, e.g., using Western blot analysis to examine phosphoryla-tion events in PBMCs.
The aim of this study was to determine whether signaling alter-ations exist in specific CD4� and CD8� T cells subpopulationsduring the course of HIV disease progression and treatment. Weadapted and optimized a previously described flow cytometric as-say (39–41) to visualize phosphorylation of known intermediatesof cellular signaling pathways in defined T cell subpopulations.We demonstrate that signaling mediated by TCR cross-linking,
*Division of Experimental Medicine and †HIV/AIDS Division, San Francisco Gen-eral Hospital, Department of Medicine, and ‡Department of Epidemiology and Bio-statistics, University of California, San Francisco, CA 94110
Received for publication November 15, 2007. Accepted for publication March6, 2008.
The costs of publication of this article were defrayed in part by the payment of pagecharges. This article must therefore be hereby marked advertisement in accordancewith 18 U.S.C. Section 1734 solely to indicate this fact.1 This work was supported in part by grants from the University-wide AIDS ResearchProgram (F05-GI-219), the National Institutes of Health (R01 AI40312, AI47062,AI52745, K24 AI69994, and M01 RR00083), American Foundation for AIDS Re-search (106710-40-RGRL), the University of California Center for AIDS Research(P30 AI27763, P30 MH59037, and CC99-SF-001), and the University of CaliforniaClinical and Translational Research Institute (UL1 RR024131), a component of theNational Institutes of Health Roadmap for Medical Research. J.M.M. is a recipient ofthe Burroughs Wellcome Fund Clinical Scientist Award in Translational Researchand the National Institutes of Health Director’s Pioneer Award Program, part of theNational Institutes of Health Roadmap for Medical Research, through Grant DPIOD00329.2 Current address: Medizinische Klinik, Klinikum rechts der Isar, Technische Uni-versitat Munchen, Munich, Germany.3 Address correspondence and reprint requests to Dr. Joseph M. McCune, Universityof California, Division of Experimental Medicine, Box 1234, SFGH Building 3, SanFrancisco, CA 94143. E-mail address: [email protected]
Copyright © 2008 by The American Association of Immunologists, Inc. 0022-1767/08/$2.00
The Journal of Immunology
www.jimmunol.org
by guest on January 4, 2019http://w
ww
.jimm
unol.org/D
ownloaded from

IL-2, and PMA/ionomycin is blunted in cells from untreatedsubjects with progressive disease (progressors, PROGs)4 com-pared with long-term nonprogressors (LTNP) and to those whohave been successfully provided antiretroviral treatment (respond-ers, RESPs). These signaling alterations are not restricted to a spe-cific T cell subpopulation and some are correlated with levels ofbasal phosphorylation of proteins involved in various T cell sig-naling cascades, viral load (VL), and/or expression of programmeddeath-1 (PD-1), a CD28 family member that negatively regulatesT cell function in the context of HIV disease (42–46). Of theseinfluences, a high level of basal phosphorylation was found to havethe greatest impact on the magnitude of signaling changes to spe-cific stimuli. Finally, altered signaling found in PROGs was ob-served to be reversible with antiretroviral treatment.
Materials and MethodsStudy participants
HIV-infected people were recruited from the San Francisco Bay Area intothe Study of the Consequences of the Protease Inhibitor Era. Samples ofPBMCs for the current study were taken from three distinct groups: (i)LTNP with a CD4 T cell count � 500 cells/�l despite at least 10 years ofuntreated HIV infection, and a plasma VL � 2,000 copies/ml; (ii) PROGswith a CD4 T cell count � 200 cells/�l, plasma VL � 10,000 copies/ml,and no antiretroviral therapy (ART) at the time of blood sampling; and (iii)RESPs who were on a stable antiretroviral regimen, had an undetectableVL, and had a previous CD4 T cell count nadir � 200/�l, but at the timeof sampling had a CD4 count � 500/�l. Analyses were conducted onarchived PBMCs that had been viably frozen and stored at the Universityof California-San Francisco AIDS Specimen Bank. PBMCs from HIV-uninfected individual controls were isolated from buffy coats from wholeblood (Stanford Blood Center) and viably frozen for subsequent analyses.
Measurements
Plasma HIV RNA levels were determined by the branched DNA assay(Quantiplex HIV RNA, version 3.0; Chiron Corporation). CD4 cell countswere determined by flow cytometry.
Cell culture and flow cytometric analyses
Before analysis and stimulation, frozen PBMCs were thawed in 15 mlRPMI 1640 cell culture medium (Mediatech) containing 5% FBS (Hy-Clone; RPMI�), washed in PBS containing 2% FBS (PBS�), and thenrested at 5 � 106 cells/ml in RPMI� at 37°C, 5% CO2, overnight. Thefollowing day, cells were washed with ice-cold PBS� and transferred to a96-well V-bottom plate. Each sample was stained for expression of the cellsurface markers CD3, CD4, CD8, CD27, CD45RA, and PD-1. An amine-reactive dye (violet Live/Dead; Invitrogen) was used to stain dead cells.Expression levels of cell surface markers were measured in terms of me-dian fluorescence intensity (MFI). To account for interassay variability,MFI-values of HIV-infected patients were normalized by subtraction ofMFI-values of an HIV-uninfected standard control (�MFI), which wasincluded in all experiments.
For signaling analysis in T cell subpopulations, cells were initiallystained on ice with Abs detecting CD3, CD8, CD27, and Live/Dead cellmarkers. The anti-CD45RA Ab was not included in the initial cell surfacestain, as this Ab gives reasonable staining results only after fixation/per-meabilization of the cells. To activate the TCR complex, cells were firstpreincubated with biotin-conjugated anti-CD3 (clone HIT3a) and anti-CD28 Abs, either alone or in combination with either biotin-conjugatedanti-CD4 or anti-CD8 CD8 Ab for 20 min on ice. Subsequently, cells weretransferred to streptavidin in PBS� at 37°C, thereby cross-linking andactivating TCR-mediated signaling. To activate cytokine- or mitogen-in-duced signaling, cells were transferred to PBS� containing IL-2, IL-4, orPMA/ionomycin at 37°C. Signaling was arrested after 15 min by imme-diate fixation, adding 4% paraformaldehyde to a final concentration of 2%.After 20 min of fixation and subsequent wash, cells were permeabilized in70% ice-cold methanol for 20 min on ice. Cells were washed and stainedwith an Ab mixture containing phospho- (p-) and CD45RA-specific Abs
for 60 min on ice. Before analysis, cells were washed and resuspended inPBS� containing 0.05% formaldehyde. Unstimulated control cells under-went the same manipulations. Cells were analyzed on a customized LSR IIFlow Cytometer (BD Biosciences). Analysis of data was performed usingFlowJo (Tree Star). Fold-changes in phosphorylation were calculated as theratio of MFI of stimulated cells over unstimulated cells.
Calcium flux response after TCR cross-linking was assessed with thefluorescent calcium indicator, Indo-1 AM. Calcium release was measuredby flow cytometry over time by the change in emission spectrum from blueto violet. Indo-1 is excited in the UV and fluoresces at different wave-lengths depending on whether it is bound to calcium (�420 nm) or free(�510 nm). The ratio of these two wavelengths indicates changes in in-tracellular calcium concentration. TCR activation was induced by addingstreptavidin during FACS acquisition to cross-link biotinylated Abs: anti-CD3 in combination with anti-CD4 or anti-CD8. The ionophore, ionomy-cin, was used as a positive control and levels before stimulation were usedas negative control baseline level. An average of 2 � 106 total PBMCswere labeled for 30 min at 37°C with 2 �M Indo-1 AM, 0.02% pluronicF-127 in 2 ml of HBSS supplemented with 1% FBS, 1 mM CaCl2, andMgCl2 (HBSS Ca2� buffer). Cells were then washed twice and resus-pended in 500 �l of HBSS Ca2� buffer containing biotinylated anti-CD3and anti-CD8 or anti-CD4 Abs for 5 min at room temperature (RT). Cellswere subsequently stained with a combination of anti-CD3, anti-CD8, andanti-CD4 Abs for 25 min at RT. Cells were washed twice and resuspendedin 500 �l of HBSS Ca2� buffer, then kept on ice until being warmed to RTbefore FACS acquisition on a FACSDiva flow cytometer. After 25 s ofacquisition, 5 �l of 2 �M streptavidin solution or 5 �l of ionomycin at 0.1mg/ml were added, and calcium release was measured during the remain-ing 3–5 min. FACS data were analyzed with the calcium flux platform fromFlowJo software on live (Indo-1) CD3�CD8�CD4� T lymphocytes. Nocross-blocking activity was observed between CD3-, CD4-, or CD8-bio-tinylated and -fluoresceinated murine mAbs with this combination.
Abs and reagents
The following Abs were used for detection of cell surface markers: CD3(clone SP34-2, Alexa700-conjugated at a dilution 1/100, purchased fromInvitrogen or clone UCHT1 from eBiosciences), CD4 (clone S3.5, PE-Cy7,1/100; Invitrogen), CD8 (clone 3B5, PE-Cy5.5, 1/1000; Invitrogen), CD27(clone 0323, 1/100, allophycocyanin-Alexa750; eBioscience), CD45RA(clone 2H4, ECD, 1/100; Beckman Coulter), and PD-1 (clone MIH4, PE).Dead cells were stained with a violet-fluorescent fixable Live/Dead amine-reactive dye (1/1000; Invitrogen). The following Abs (all BD Biosciences),either alone or in combination, were used at a dilution of 1/25 for TCRcross-linking: CD3-biotin (clone HIT3), CD4-biotin (clone RPA-T4),CD8-biotin (clone SK1), and CD28-biotin (clone CD28.2). Streptavidin(Sigma-Aldrich) was used at a final concentration of 80 �g/ml. The fol-lowing p-specific Abs (all BD Biosciences) were used at a dilution of 1/20:Zap70 (phosho-tyrosine (pY)319/Syk pY352, clone 4, Alexa647-conju-gated), lymphocyte specific kinase (Lck) (pY505, PE), linker for activationof T cells (Lat) (pY226; clone J96–1238-58.93, Alexa488), ERK1/2 (p-threonine (pT)202/pY204, Alexa488), p38 (pT180/pY182, Alexa647), Akt(pT308, PE), Stat5 (pY694, PE), and Stat6 (pY641, Alexa647).
For stimulation, IL-2 (Sigma-Aldrich) was used at 100 ng/ml, IL-4(R&D Systems) at 100 ng/ml, PMA (Sigma-Aldrich) at 100 ng/ml, andionomycin calcium salt (Sigma-Aldrich) at 1 �g/ml. For fixation of cells,we used final concentration of 2% paraformaldehyde (Electron MicroscopySciences; 15710). Cells were permeabilized with 70% methanol (FisherScientific). The fluorescent calcium indicator Indo-1 AM (MolecularProbes) was used at a final concentration of 2 �M.
Statistical analyses and heatmaps
To compare expression of cell surface markers, signaling, and levels ofbasal phosphorylation between groups, a nonparametric two-tailed Mann-Whitney U test for unpaired data sets was used. Two-tailed Spearman’srank correlation was used to analyze relationship between signaling andlevels of VL, levels of basal phosphorylation, or expression of PD-1. Dif-ferences were statistically significant with a value of p � 0.05 (�, p � 0.05;��, p � 0.01; ���, p � 0.001). Statistical analyses were performed usingPrism 4 (GraphPad). TIGR MeV v3.1 was used to create heatmaps(www.tm4.org/index.html).
ResultsHIV-infected subjects and study design
This study included 57 HIV-infected individuals at distinct stagesof disease progression, including chronically HIV-infected un-treated LTNP (n � 20), untreated PROGs (n � 18), and RESPs
4 Abbreviations used in this paper: PROG, progressor; LTNP, long-term nonprogres-sor; ART, antiretroviral therapy; RESP, chronically infected subjects responding toART; VL, viral load (plasma HIV RNA copies/ml); PD-1, programmed death-1; p-,phospho-; MFI, median fluorescence intensity; Lck, lymphocyte specific kinase; Lat,linker for activation of T cell; RT, room temperature; GSH, glutathione.
6491The Journal of Immunology
by guest on January 4, 2019http://w
ww
.jimm
unol.org/D
ownloaded from

(n � 19) with treatment-mediated viral suppression (Table I). TheLTNP were selected on the basis of being infected for at least 10years, having a CD4 T cell count � 500 cells/�l (median 770),having a plasma VL � 2000 copies/ml (median 114), and nothaving received ART. PROGs had a low CD4 count (�200 cells/�l; median 55), a high plasma VL (�10,000 copies/ml; median65,864), and were not on treatment at the time of blood sampling.Antiretroviral “RESPs” to treatment were selected on the basis ofhaving had a CD4 nadir of �200/�l, which had increased to over500 cells/�l (median 703) at the time of sampling, and at the sametime having a VL � 75 copies/ml. The median number of CD8�
T cells was slightly reduced (median 770) in HIV PROGs com-pared with LTNP (1146) and RESPs (1088). The median age andyear of having been tested HIV positive were comparable in allgroups. A majority of all participants were men.
Phenotypic analysis of PBMCs
PBMCs from all participants were analyzed for expression levelsof the cell surface markers CD3, CD4, and CD8, and the matura-tion markers CD45RA and CD27 were used to subdivideCD3�CD4� and CD3�CD8� T cells into subpopulations of naive(CD45RA�CD27�), memory (CD45RA�CD27�), memory-ef-fector (CD45RA�CD27�), and effector (CD45RA�CD27�) Tcells (see Fig. 1A for gating strategy). As expected, and whencompared with LTNP and RESPs, those with progressive diseasehad an inverted CD4:CD8 ratio with a very low percentage ofCD4� T cells (mean 7%, 12.9% SD) within their CD3� T cell pool(Fig. 1B, left), a higher frequency of circulating memory/memory-effector T cells, and a lower frequency of naive cells (Fig. 1B,middle for CD4 and right for CD8). Interestingly, LTNP had asignificantly higher representation of effector CD8� T cells thanthe other two groups, whereas RESPs had more naive CD8� Tcells than the other groups ( p � 0.05 for each pairwise compari-son) (Fig. 1B, right). Under the conditions used for staining inthese experiments, the cell surface expression levels of CD3, CD4,and CD8 (measured in terms of MFI) were found to be comparablein all T cell subpopulations in each of the three groups studied(Fig. 1C).
Simultaneous analysis of cellular phenotype and intracellularsignaling events within heterogeneous cell subpopulations byflow cytometry (PhosFlow)
To study cell signaling in defined subpopulations of T cells, thePhosFlow assay (39–41) was adapted so that it could be usedreliably to analyze human PBMC. We systematically tested a se-ries of different protocols and conditions for fixation, permeabili-zation, activation, and cell staining so that the phenotypic markersused to demarcate specific T cell subpopulations could be visual-ized at the same time as intracellular p-proteins (data not shown).
Different cell culture conditions, e.g., resting time, cell density,serum concentration, and origin (e.g., human vs bovine), did notgreatly affect levels of basal phosphorylation or of stimulation.However, resting cells overnight, as compared with resting cellsfor 90 min, resulted in stronger fold-changes in phosphorylationafter stimulation. To establish optimal conditions for the analysisof TCR-mediated signaling, a protocol for cross-linking compo-nents of the TCR complex on the cell surface was developed, usingcombinations of biotinylated anti-CD3, -CD28, -CD4, and -CD8Abs together with streptavidin (see below and Ref. 47). Cross-linking did not alter cell surface expression or detection of CD3,CD4, or CD8 (data not shown).
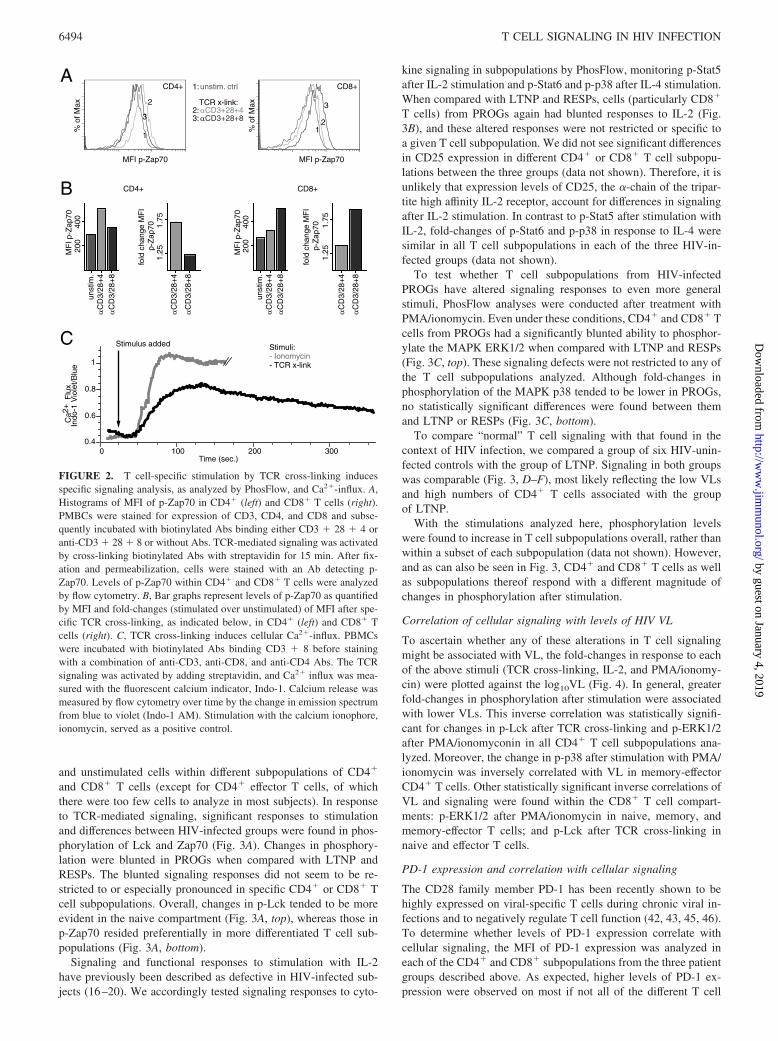
The optimized PhosFlow protocol for TCR-mediated signalingwas validated by incubating heterogeneous cell subpopulations ofPBMCs with or without a combination of biotinylated Abs bindingCD3, CD28, and CD4 (CD3 � 28 � 4) or CD3, CD28, and CD8(CD3 � 28 � 8) for 20 min on ice, followed by a cross-linkingstep with streptavidin at 37°C to activate the TCR. After 15 min,cells were fixed with paraformaldehyde, permeabilized with meth-anol, and stained with a fluorochrome-conjugated p-Zap70-specificAb. Using multicolor flow cytometry, phosphorylation levels ofZap70 (p-Zap70) were then analyzed in CD4� and CD8� T cells.As expected, p-Zap70 was most evident in CD4� T cells aftercross-linking of CD3 � 28 � 4 (Fig. 2A, left). Incubation withanti-CD3 � 28 � 8 Abs still cross-links CD3 � 28 on CD4� Tcells and therefore induced a small change of p-Zap70 when com-pared with unstimulated control. Reciprocal results were obtainedin CD8� T cells, in which cross-linking of CD3 � 28 � 8 resultedin the highest levels of Zap70 phosphorylation (Fig. 2A, right). Tobetter quantify and to visualize changes in levels of phosphoryla-tion, the MFI of the p-specific signal was measured and fold-changes in phosphorylation were calculated as a ratio of MFI instimulated vs unstimulated cells (Fig. 2B). To show that the TCRcross-linking protocol provides a functional response, Ca2� influxwas analyzed after TCR-linking and in comparison with ionomy-cin, a potent stimulator of calcium influx (Fig. 2C). Indeed, TCRcross-linking induced cellular Ca2�-influx, although not as strongas ionomycin, possibly reflecting a more physiological TCR-me-diated stimulation. When used in the absence of cross-linking, thebiotinylated or fluoresceinated Abs did not induce any detectablecalcium release when added to unstained cells (data not shown).Moreover, cross-linking was specific for either CD4 or CD8 T cellpopulations, depending on whether anti-CD4 or anti-CD8 Abs,respectively, were used.
PhosFlow analysis of T cells from HIV-infected patients atdifferent stages of disease progression
Using the PhosFlow protocol as described above, PBMCs fromHIV-infected LTNP, PROGs, and RESPs were stained for cell
Table I. Characteristics of participantsa
Characteristic
LTNP CD4 � 500/�lVL Typical � 2000
Copies/ml � 10 YearsNo Therapy n � 20
PROG CD4 � 200/�lVL � 10,000 Copies/ml No
Therapy n � 18
RESP CD4 � 500/�l,Previously � 200/�lVL Undetectable on
Therapy n � 19
Median CD4 count, cells/�l (IQR) 770 (685 to 955) 55 (22 to 124) 703 (596 to 836)Median CD8 count, cells/�l (IQR) 1146 (935 to 1693) 770 (424 to 973) 1088 (920 to 1476)Median Plasma HIV RNA level, copies/ml (IQR) 114 (�75 to 1438) 65864 (36702 to 154765) �75Median age, years (IQR) 48 (44 to 52) 45 (42 to 51) 49 (42 to 60)Median year 1st HIV� test (IQR) 1988 (1986 to 1990) 1990 (1986 to 1993) 1989 (1987 to 1992)Ethnicity percentage B/AA, W/C, A, M, H/L, PI 50, 35, 5, 10, 0, 0 17, 44, 0, 6, 28, 6 21, 58, 5, 0, 11, 5Female gender 25% 11.1% 21.1%
a IQR, Interquartile range; B/AA, Black/African-American; W/C, White/Caucasian; A, Asian; M, Mixed; H/L, Hispanic/Latino; PI, Pacific Islander.
6492 T CELL SIGNALING IN HIV INFECTION
by guest on January 4, 2019http://w
ww
.jimm
unol.org/D
ownloaded from

surface phenotype, stimulated for 15 min, and tested with a panelof different p-specific Abs. Changes in signaling were detected asa fold-change in phosphorylation, comparing the MFI of selected
phosphoproteins (including the TCR proximal kinases Lck, Zap70,and Lat, the downstream kinases ERK1/2 and p38, as well as Akt,a kinase linked to the costimulatory molecule CD28) in stimulated
lymphocytes singlets live CD3+
CD3+ CD3+CD4+ CD3+CD8+
CD4
CD
8
CD45RAC
D27
CD45RA
CD
27
CD45RA
CD
27
naivemem
mem-eff eff
A
B naive memory mem-eff effector
*** *** * *
25
50
75naive memory effector
**
* *****
25
50
75
LTNP PROG RESP
-4000
-2000
0
2000
-20000
0
20000
40000
-5000
0
5000
10000C
25
50
75
100
*** *** *** ***
Per
cent
ge o
f CD
3+
Per
cent
ge o
f CD
4+
Per
cent
ge o
f CD
8+
∆ M
FI C
D3
∆ M
FI C
D4
∆ M
FI C
D8
LTN
PP
RO
GR
ES
P
LTN
PP
RO
GR
ES
P
LTN
PP
RO
GR
ES
P
LTN
PP
RO
GR
ES
P
LTN
PP
RO
GR
ES
P
LTN
PP
RO
GR
ES
P
LTN
PP
RO
GR
ES
P
LTN
PP
RO
G
RE
SP
LTN
PP
RO
G
RE
SP
LTN
PP
RO
G
RE
SP
LTN
PP
RO
GR
ES
P
LTN
PP
RO
G
RE
SP
LTN
PP
RO
G
RE
SP
LTN
PP
RO
G
RE
SP
LTN
P
PR
OG
RE
SP
LTN
P
PR
OG
RE
SP
mem-eff
naive memory mem-eff naive memory effectormem-eff
LTN
PP
RO
G
RE
SP
FSC
SS
C
amine CD3FCS-A
FS
C-H
SS
C
SS
C
CD4+ CD8+
FIGURE 1. A, Representative flow cytometric plots of staining and gating strategy of fixed/permeabilized cells used in signaling analyses by PhosFlow.Lymphocytes and singlets were identified in forward and sideward scatter dot plots. Dead cells were excluded by amine stain, and live cells were gated forexpression of CD3. The CD3�CD4� and CD3�CD8� T cells were further separated by expression of CD45RA and CD27 to identify naive (CD45RA�CD27�),memory (CD45RA�CD27�), memory-effector (CD45RA�CD27�), and effector (CD45RA�CD27�) T cells as indicated. B, Mean frequencies of CD4� andCD8� T cells within the CD3� compartment (left) and of naive, memory, memory-effector, and effector T cells within CD4� (middle) and CD8� T cells (right)in the three HIV-infected groups of LTNP, PROGs, and RESPs. Error bars indicate SD. C, Cell surface expression levels of CD3 on CD3� T cells (left) and CD4or CD8 on naive, memory, memory-effector, and effector CD4� or CD8� subpopulations (middle and left, respectively) from three HIV-infected groups asindicated. Expression levels of cell surface markers were measured as MFI and normalized (�MFI) to an HIV-uninfected standard control, which was includedin all experiments. For the box-and-whisker graph, the lines in the boxes represent median values, the boxes range from the 25th to 75th percentiles, and the errorbars indicate the lowest and highest values. Groups in B and C were compared using the nonparametric two-tailed Mann-Whitney U test; statistically significantdifferences are indicated by the lines below the plots. �, p � 0.05; ��, p � 0.01; ���, p � 0.001.
6493The Journal of Immunology
by guest on January 4, 2019http://w
ww
.jimm
unol.org/D
ownloaded from
and unstimulated cells within different subpopulations of CD4�
and CD8� T cells (except for CD4� effector T cells, of whichthere were too few cells to analyze in most subjects). In responseto TCR-mediated signaling, significant responses to stimulationand differences between HIV-infected groups were found in phos-phorylation of Lck and Zap70 (Fig. 3A). Changes in phosphory-lation were blunted in PROGs when compared with LTNP andRESPs. The blunted signaling responses did not seem to be re-stricted to or especially pronounced in specific CD4� or CD8� Tcell subpopulations. Overall, changes in p-Lck tended to be moreevident in the naive compartment (Fig. 3A, top), whereas those inp-Zap70 resided preferentially in more differentiated T cell sub-populations (Fig. 3A, bottom).
Signaling and functional responses to stimulation with IL-2have previously been described as defective in HIV-infected sub-jects (16–20). We accordingly tested signaling responses to cyto-
kine signaling in subpopulations by PhosFlow, monitoring p-Stat5after IL-2 stimulation and p-Stat6 and p-p38 after IL-4 stimulation.When compared with LTNP and RESPs, cells (particularly CD8�
T cells) from PROGs again had blunted responses to IL-2 (Fig.3B), and these altered responses were not restricted or specific toa given T cell subpopulation. We did not see significant differencesin CD25 expression in different CD4� or CD8� T cell subpopu-lations between the three groups (data not shown). Therefore, it isunlikely that expression levels of CD25, the �-chain of the tripar-tite high affinity IL-2 receptor, account for differences in signalingafter IL-2 stimulation. In contrast to p-Stat5 after stimulation withIL-2, fold-changes of p-Stat6 and p-p38 in response to IL-4 weresimilar in all T cell subpopulations in each of the three HIV-in-fected groups (data not shown).
To test whether T cell subpopulations from HIV-infectedPROGs have altered signaling responses to even more generalstimuli, PhosFlow analyses were conducted after treatment withPMA/ionomycin. Even under these conditions, CD4� and CD8� Tcells from PROGs had a significantly blunted ability to phosphor-ylate the MAPK ERK1/2 when compared with LTNP and RESPs(Fig. 3C, top). These signaling defects were not restricted to any ofthe T cell subpopulations analyzed. Although fold-changes inphosphorylation of the MAPK p38 tended to be lower in PROGs,no statistically significant differences were found between themand LTNP or RESPs (Fig. 3C, bottom).
To compare “normal” T cell signaling with that found in thecontext of HIV infection, we compared a group of six HIV-unin-fected controls with the group of LTNP. Signaling in both groupswas comparable (Fig. 3, D–F), most likely reflecting the low VLsand high numbers of CD4� T cells associated with the groupof LTNP.
With the stimulations analyzed here, phosphorylation levelswere found to increase in T cell subpopulations overall, rather thanwithin a subset of each subpopulation (data not shown). However,and as can also be seen in Fig. 3, CD4� and CD8� T cells as wellas subpopulations thereof respond with a different magnitude ofchanges in phosphorylation after stimulation.
Correlation of cellular signaling with levels of HIV VL
To ascertain whether any of these alterations in T cell signalingmight be associated with VL, the fold-changes in response to eachof the above stimuli (TCR cross-linking, IL-2, and PMA/ionomy-cin) were plotted against the log10VL (Fig. 4). In general, greaterfold-changes in phosphorylation after stimulation were associatedwith lower VLs. This inverse correlation was statistically signifi-cant for changes in p-Lck after TCR cross-linking and p-ERK1/2after PMA/ionomyconin in all CD4� T cell subpopulations ana-lyzed. Moreover, the change in p-p38 after stimulation with PMA/ionomycin was inversely correlated with VL in memory-effectorCD4� T cells. Other statistically significant inverse correlations ofVL and signaling were found within the CD8� T cell compart-ments: p-ERK1/2 after PMA/ionomycin in naive, memory, andmemory-effector T cells; and p-Lck after TCR cross-linking innaive and effector T cells.
PD-1 expression and correlation with cellular signaling
The CD28 family member PD-1 has been recently shown to behighly expressed on viral-specific T cells during chronic viral in-fections and to negatively regulate T cell function (42, 43, 45, 46).To determine whether levels of PD-1 expression correlate withcellular signaling, the MFI of PD-1 expression was analyzed ineach of the CD4� and CD8� subpopulations from the three patientgroups described above. As expected, higher levels of PD-1 ex-pression were observed on most if not all of the different T cell
Fig. 2
200
400
1.25
1.75
200
400
1.25
1.75
A
B
p-Zap70 MFI p-Zap70
CD4+%
of M
ax
1
2
3
p-Zap70 MFI p-Zap70
CD8+
% o
f Max
12
3
unstim. ctrl
TCR x-link: αCD3+28+4αCD3+28+8
1:
2:3:
0 100 200 300Time (sec.)
0.6
0.8
1
Ca2
+ F
lux
Indo
-1 V
iole
t/Blu
e
0.4
Stimulus added Stimuli:- Ionomycin- TCR x-link
C
MF
I p-Z
ap70
fold
cha
nge
MF
I p
-Zap
70
MF
I p-Z
ap70
fold
cha
nge
MF
I p
-Zap
70
unst
im.
αC
D3/
28+
4α
CD
3/28
+8
unst
im.
αC
D3/
28+
4α
CD
3/28
+8
αC
D3/
28+
4
αC
D3/
28+
8
αC
D3/
28+
4
αC
D3/
28+
8
CD4+ CD8+
FIGURE 2. T cell-specific stimulation by TCR cross-linking inducesspecific signaling analysis, as analyzed by PhosFlow, and Ca2�-influx. A,Histograms of MFI of p-Zap70 in CD4� (left) and CD8� T cells (right).PMBCs were stained for expression of CD3, CD4, and CD8 and subse-quently incubated with biotinylated Abs binding either CD3 � 28 � 4 oranti-CD3 � 28 � 8 or without Abs. TCR-mediated signaling was activatedby cross-linking biotinylated Abs with streptavidin for 15 min. After fix-ation and permeabilization, cells were stained with an Ab detecting p-Zap70. Levels of p-Zap70 within CD4� and CD8� T cells were analyzedby flow cytometry. B, Bar graphs represent levels of p-Zap70 as quantifiedby MFI and fold-changes (stimulated over unstimulated) of MFI after spe-cific TCR cross-linking, as indicated below, in CD4� (left) and CD8� Tcells (right). C, TCR cross-linking induces cellular Ca2�-influx. PBMCswere incubated with biotinylated Abs binding CD3 � 8 before stainingwith a combination of anti-CD3, anti-CD8, and anti-CD4 Abs. The TCRsignaling was activated by adding streptavidin, and Ca2� influx was mea-sured with the fluorescent calcium indicator, Indo-1. Calcium release wasmeasured by flow cytometry over time by the change in emission spectrumfrom blue to violet (Indo-1 AM). Stimulation with the calcium ionophore,ionomycin, served as a positive control.
6494 T CELL SIGNALING IN HIV INFECTION
by guest on January 4, 2019http://w
ww
.jimm
unol.org/D
ownloaded from

subpopulations from PROGs compared with LTNP and RESPs(Fig. 5A). In addition, expression of PD-1 tended to be higher onCD8� T cells (right) when compared with CD4� T cells (left).
We correlated expression levels of PD-1 (Fig. 5B, y-axis) withchanges in cellular signaling (Fig. 5B, x-axis) after stimulation
with TCR cross-linking, IL-2, or PMA/ionomycin. Overall, higherlevels of PD-1 expression were associated with lower fold-changesin protein phosphorylation after stimulation. The strongest corre-lations between the levels of PD-1 expression and blunted signal-ing were found in CD4� T cell subpopulations for p-Lck and
A
B
C*** **
CD4 IL-2 p-Stat5
1.5
2.0
#
** *** * *** **
CD8 IL-2 p-Stat5
CD4 TCR p-Lck
*** ** ** ** ** **
1.5
2.0
2.5
3.0
**** ***** * ** *
CD8 TCR p-Lck
***
CD4 TCR p-Zap70
1.5
2.0
**** * **
CD8 TCR p-Zap70
* ** * ** **
CD4 P+I p-Erk1/2
1.5
2.0
2.5
** ** ** ** ** **
CD8 P+I p-Erk1/2
CD4 P+I p-p38
2
3
CD8 P+I p-p38
D
E
F
CD8 TCR p-LckCD4 TCR p-Lck
CD4 TCR p-Zap70 CD8 TCR p-Zap70
CD8 IL-2 p-Stat5
CD8 P+I p-Erk1/2CD4 P+I p-Erk1/2
* * *
CD8 P+I p-p38CD4 P+I p-p38
Fol
d C
hang
e M
FI
Fol
d C
hang
e M
FI
Fol
d C
hang
e M
FI
Fol
d C
hang
e M
FI
Fol
d C
hang
e M
FI
naive memory mem-eff naive memory effectormem-eff naive memory mem-eff naive memory effectormem-effLT
NP
PR
OG
RE
SP
LTN
PP
RO
GR
ES
P
LTN
PP
RO
GR
ES
P
LTN
PP
RO
GR
ES
P
LTN
PP
RO
GR
ES
P
LTN
PP
RO
GR
ES
P
LTN
PP
RO
GR
ES
P
LTN
P
HIV
-
LTN
P
HIV
-
LTN
P
HIV
-
LTN
P
HIV
-
LTN
P
HIV
-
LTN
P
HIV
-
LTN
P
HIV
-
CD4 IL-2 p-Stat5
FIGURE 3. Signaling is comparable between T cells from HIV-uninfected individuals and HIV-infected LTNP, but blunted in T cells from HIV PROGs.Comparing stimulated over unstimulated cells, fold-changes in phosphorylation were analyzed in naive, memory, memory-effector, and effector subpopu-lations of CD4� (no effector T cells analyzed) and CD8� T cells. Protein phosphorylation after specific stimulation was analyzed between (A–C)HIV-infected individuals and (D–F) LTNP and HIV-uninfected individuals for (A and D) Lck and Zap70 after TCR stimulation, (B and E) Stat5 afterstimulation with IL-2, and (C and F) ERK1/2 and p38 after stimulation with PMA/ionomycin. The groups were compared using the nonparametrictwo-tailed Mann-Whitney U test; statistically significant differences are indicated by the lines below the plots. �, p � 0.05; ��, p � 0.01; ���, p � 0.001.
6495The Journal of Immunology
by guest on January 4, 2019http://w
ww
.jimm
unol.org/D
ownloaded from
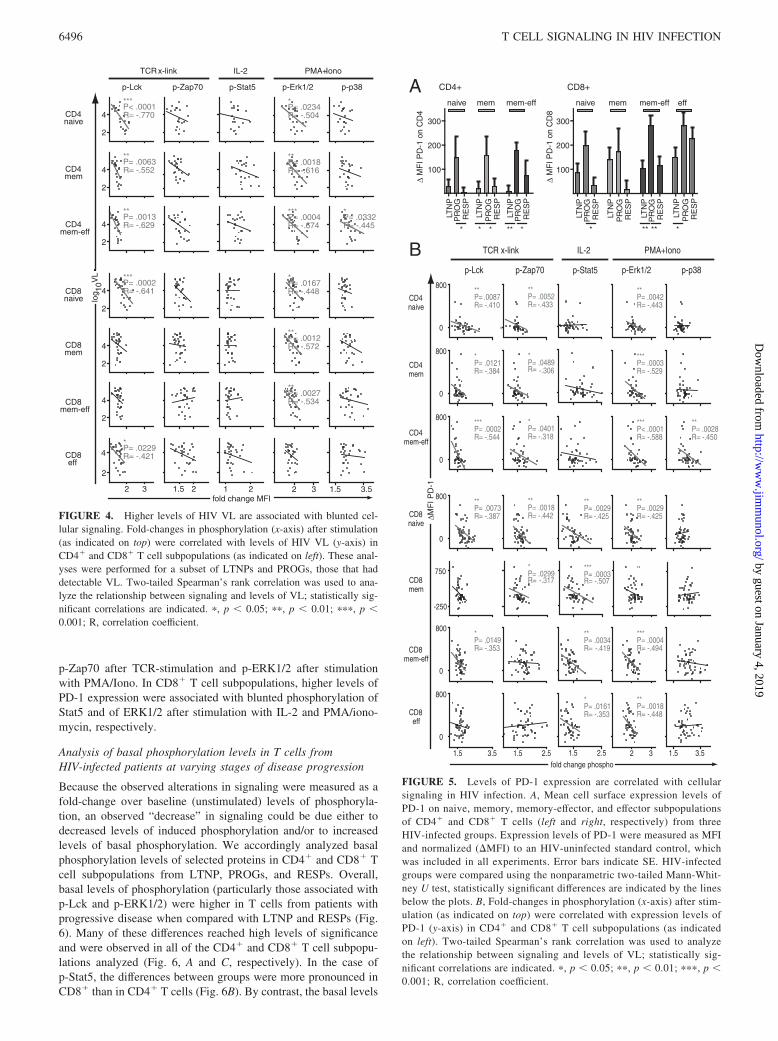
p-Zap70 after TCR-stimulation and p-ERK1/2 after stimulationwith PMA/Iono. In CD8� T cell subpopulations, higher levels ofPD-1 expression were associated with blunted phosphorylation ofStat5 and of ERK1/2 after stimulation with IL-2 and PMA/iono-mycin, respectively.
Analysis of basal phosphorylation levels in T cells fromHIV-infected patients at varying stages of disease progression
Because the observed alterations in signaling were measured as afold-change over baseline (unstimulated) levels of phosphoryla-tion, an observed “decrease” in signaling could be due either todecreased levels of induced phosphorylation and/or to increasedlevels of basal phosphorylation. We accordingly analyzed basalphosphorylation levels of selected proteins in CD4� and CD8� Tcell subpopulations from LTNP, PROGs, and RESPs. Overall,basal levels of phosphorylation (particularly those associated withp-Lck and p-ERK1/2) were higher in T cells from patients withprogressive disease when compared with LTNP and RESPs (Fig.6). Many of these differences reached high levels of significanceand were observed in all of the CD4� and CD8� T cell subpopu-lations analyzed (Fig. 6, A and C, respectively). In the case ofp-Stat5, the differences between groups were more pronounced inCD8� than in CD4� T cells (Fig. 6B). By contrast, the basal levels
CD4naive
CD4mem
CD4mem-eff
CD8naive
CD8mem
CD8mem-eff
CD8eff
TCR x-link PMA+Iono
2 3
p-Erk1/2
*P= .0234R= -.504
**P= .0018R= -.616
***P= .0004R= -.674
*P= .0167R= -.448
**P= .0012R= -.572
**P= .0027R= -.534
p-p38
1.5 3.5
*P= .0332R= -.445
p-Lck
2
4
2
4
2
4
2
4
2
4
2
4
2 3
2
***P< .0001R= -.770
**P= .0063R= -.552
**P= .0013R= -.629
***P= .0002R= -.641
*P= .0229R= -.421
IL-2
p-Stat5
1 2
p-Zap70
1.5 2
fold change MFI
log
V
L10
4
FIGURE 4. Higher levels of HIV VL are associated with blunted cel-lular signaling. Fold-changes in phosphorylation (x-axis) after stimulation(as indicated on top) were correlated with levels of HIV VL (y-axis) inCD4� and CD8� T cell subpopulations (as indicated on left). These anal-yses were performed for a subset of LTNPs and PROGs, those that haddetectable VL. Two-tailed Spearman’s rank correlation was used to ana-lyze the relationship between signaling and levels of VL; statistically sig-nificant correlations are indicated. �, p � 0.05; ��, p � 0.01; ���, p �0.001; R, correlation coefficient.
B TCR x-link PMA+Iono
p-Erk1/2 p-p38p-Lck
IL-2
p-Stat5p-Zap70
CD4naive
CD4mem
CD4mem-eff
CD8naive
CD8mem
CD8mem-eff
fold change phospho 2 3
0
800
0
800
0
800
0
800
-250
750
0
800
1.5 3.5
0
800
1.5 3.51.5 2.5
0
1.5 2.5
**P= .0042R= -.443
***P= .0003R= -.529
***P< .0001R= -.588
**P= .0029R= -.425
**
***P= .0004R= -.494
**P= .0018R= -.448
**P= .0028R= -.450
**P= .0087R= -.410
*P= .0121R= -.384
***P= .0002R= -.544
**P= .0073R= -.387
*P= .0149R= -.353
**P= .0029R= -.425
***P= .0003R= -.507
**P= .0034R= -.419
*P= .0161R= -.353
**P= .0052R= -.433
*P= .0489R= -.306
*P= .0401R= -.318
**P= .0018R= -.442
*P= .0299R= -.317
A
**** **
100
200
300
naive mem
** **
naive mem eff
* *
100
200
300
∆MF
I PD
-1
∆ M
FI P
D-1
on
CD
4
∆ M
FI P
D-1
on
CD
8
mem-effmem-eff
CD4+ CD8+
LTN
PP
RO
GR
ES
P
LTN
PP
RO
GR
ES
P
LTN
PP
RO
GR
ES
P
LTN
PP
RO
GR
ES
P
LTN
PP
RO
GR
ES
P
LTN
PP
RO
GR
ES
P
LTN
PP
RO
GR
ES
P
CD8eff
FIGURE 5. Levels of PD-1 expression are correlated with cellularsignaling in HIV infection. A, Mean cell surface expression levels ofPD-1 on naive, memory, memory-effector, and effector subpopulationsof CD4� and CD8� T cells (left and right, respectively) from threeHIV-infected groups. Expression levels of PD-1 were measured as MFIand normalized (�MFI) to an HIV-uninfected standard control, whichwas included in all experiments. Error bars indicate SE. HIV-infectedgroups were compared using the nonparametric two-tailed Mann-Whit-ney U test, statistically significant differences are indicated by the linesbelow the plots. B, Fold-changes in phosphorylation (x-axis) after stim-ulation (as indicated on top) were correlated with expression levels ofPD-1 (y-axis) in CD4� and CD8� T cell subpopulations (as indicatedon left). Two-tailed Spearman’s rank correlation was used to analyzethe relationship between signaling and levels of VL; statistically sig-nificant correlations are indicated. �, p � 0.05; ��, p � 0.01; ���, p �0.001; R, correlation coefficient.
6496 T CELL SIGNALING IN HIV INFECTION
by guest on January 4, 2019http://w
ww
.jimm
unol.org/D
ownloaded from

of p-Zap70 (Fig. 6A) and p-p38 (Fig. 6C) were more uniform be-tween the three patient groups, with only isolated differences inpatterns found in PROGs compared with LTNP and RESPs.
Higher basal phosphorylation levels, in turn, might contribute to thedysregulated and blunted cellular signaling responses seen in progres-sive stages of HIV infection. To obtain a more global view of thispossibility, basal levels of p-Lck, p-Zap70, p-Stat5, p-ERK1/2, and
p-p38 (Fig. 7, y-axis) were correlated with respective fold-changes inphosphorylation after stimulation (Fig. 7, x-axis). In CD4� and CD8�
T cell subpopulations, high basal phosphorylation levels were asso-ciated with lower changes of phosphorylation for p-Lck after TCR-stimulation, p-ERK1/2 after PMA/Iono, and p-Stat5 after stimulationwith IL-2. No correlations between basal and fold-change in phos-phorylation were apparent for Zap70 and p-38.
DiscussionHIV disease is associated with chronic immune activation andmultiple tiers of T cell dysfunction (16, 20, 48, 49). In this study,we have adapted a multiparameter flow cytometric technique(PhosFlow) (39–41) to interrogate T cell signaling pathways indiscrete subpopulations of CD4� and CD8� T cells obtained fromsubjects in varying stages of HIV disease and treatment. We showthat PhosFlow enables simultaneous analysis of specific signalingpathways within discrete and multiple subpopulations of CD4�
and CD8� T cells. Using this approach, we wished to know: (a)whether and which defects in T cell signaling might be associatedwith advanced disease; (b) whether such defects were generalizedacross the CD4� and/or CD8� T cell lineages; and (c) whether anyobserved defects were reversed by effective antiviral treatment.Our results indicate that, in subjects with advanced disease, T cellsignaling responses to TCR cross-linking, IL-2, and PMA/iono-mycin were blunted within many if not all CD4� and CD8� T cell
naive memory mem-eff
*** ** *** *** *** ***
0
100
#
CD4 p-Lck naive memory mem-eff effector
*** *** *** *** *** *** *** ***
A∆
MF
I bas
al p
hosp
ho
CD8 p-Lck
* * *
-100
0
100
200
#
CD4 p-Zap70
*
CD8 p-Zap70
∆ M
FI b
asal
pho
spho
* *** *** * *
-2500
0
2500
#
CD4 p-Stat5
*** *** *** *** *** ** *** ***
CD8 p-Stat5
** *** *** *** *** ***
-100
0
100
CD4 p-Erk1/2
*** *** *** *** *** ** *** ***
CD8 p-Erk1/2
* **
-100
100
300
### #
CD4 p-p38
*
-100
100
CD8 p-p38
B
C
∆ M
FI b
asal
pho
spho
∆ M
FI b
asal
pho
spho
∆
MF
I bas
al p
hosp
ho
FIGURE 6. Basal phosphorylation levels are elevated in T cells fromHIV PROGs. Levels of basal phosphorylation were analyzed in naive,memory, memory-effector, and effector subpopulations of CD4� (left; noeffector T cells analyzed) and CD8� T cells (right). Protein phosphoryla-tions were analyzed for (A) Lck and Zap70, (B) Stat5, and (C) ERK1/2 andp38. The HIV-infected groups were compared using the nonparametric two-tailed Mann-Whitney U test; statistically significant differences are indicatedby the lines below the plots. �, p � 0.05; ��, p � 0.01; ���, p � 0.001.
2 3
***P< .0001R= -.640
***P< .0001R= -.581
***P< .0001R= -.582
***P< .0001R= -.702
***P< .0001R= -.639
***P< .0001R= -.660
***P< .0001R= -.664
1.5 3.5
2 3
***P< .0001R= -.550
***P= .0002R= -.492
**P= .0060R= -.380
***P< .0001R= -.517
*P= .0338R= -.282
*P= .0258R= -.295
**P= .0075R= -.354
1.5 2
***P< .0001R= -.623
**P= .0025R= -.415
***P< .0001R= -.512
***P= .0003R= -.460
***P< .0001R= -.579
***P< .0001R= -.560
1.5 2
TCR x-link PMA+Iono
p-Erk1/2 p-p38p-Lck
IL-2
p-Stat5p-Zap70
CD4naive
CD4mem
CD4mem-eff
CD8naive
CD8mem
CD8mem-eff
CD8eff
fold change phospho
∆ M
FI b
asal
pho
spho
FIGURE 7. High levels of basal phosphorylation are associated withblunted signaling in HIV infection. Fold-changes in phosphorylation (x-axis) after stimulation (as indicated on top) were correlated with basallevels of phosphorylation (y-axis) in CD4� and CD8� T cell subpopula-tions (as indicated on left). Two-tailed Spearman’s rank correlation wasused to analyze the relationship between signaling and levels of VL; sta-tistically significant correlations are indicated. �, p � 0.05; ��, p � 0.01;���, p � 0.001; R, correlation coefficient.
6497The Journal of Immunology
by guest on January 4, 2019http://w
ww
.jimm
unol.org/D
ownloaded from
subpopulations. Interestingly, changes in phosphorylation of keysignaling intermediates were not so much associated with defectsin induced phosphorylation per se but with an increased level ofbasal phosphorylation. When effective antiviral treatment was ini-tiated, basal phosphorylation levels returned to normal, as did sig-naling responses to multiple T cell stimuli. These observationshighlight the indirect effects that HIV infection has on the T cellcompartment and may in part provide a mechanistic basis to ob-served features of T cell dysfunction found in late-stage disease.
PhosFlow analysis showed that, in response to TCR cross-link-ing, phosphorylation of Lck and Zap70 was most significantly re-duced in PROGs compared with LTNP and RESPs, especially innaive T cells for p-Lck and in more differentiated T cell subpopu-lations for p-Zap70. After stimulation with IL-2, the extent ofphosphorylation of Stat5 in PROGs was also diminished in most Tcell subpopulations, and especially in CD8� T cells. Finally,blunted phosphorylation of ERK1/2 was observed in most T cellsubpopulations after stimulation of cells from PROGs with PMA/ionomycin. These results are consistent with previous reports inthe literature. For example, Cayota et al. (1994) (32) and Stefanovaet al. (1996) (33) showed that HIV disease progression is associ-ated with defective tyrosine phosphorylation and altered levels ofor post-translational modifications of T cell signaling molecules.Likewise, differential display of protein tyrosine kinases in CD4�
T cells revealed dysregulation of multiple protein kinases in thesetting of pathogenic SIV infection (34, 35). Down-regulation ofCD3� and CD28 on CD8� T cells has been associated with defectsin TCR stimulation (26, 27), whereas defects in IL-2 receptor ex-pression in HIV disease have been linked to impaired activation ofStat5 and upstream kinases (19). Of note, all of these findings weremade in the context of heterogeneous populations of CD4� andCD8� T within PBMCs, making it difficult to determine whetherthey might simply reflect changes in the relative frequencies ofindividual T cell subpopulations. In this study, using the single cellanalytical platform provided by Phosflow, we show that abnor-malities in protein phosphorylation and signaling are found in mul-tiple discrete subpopulations of both CD4� and CD8� T cells,suggesting a generalized impact of progressive HIV infection onall. Technical limitations, i.e., primary cells available from HIV�
individuals, did not allow us to directly include more detailed anal-yses of protein expression levels here.
Potential drivers of such generalized dysregulation of T cell sig-naling might include the chronically activated state that attendsprogressive HIV disease (50) and/or circulating virus (or viral pro-teins). For instance, cross-linking of CD4 by HIV envelope gly-coprotein gp120 and/or gp120-specific Abs has been shown to in-hibit CD4� T cell function and activation (51, 52). Moreover,gp120 has been found to induce TCR desensitization and to altersignal transduction through Lck, possibly by affecting its associationwith CD4 (53, 54). Interestingly, in the present study, only changes inp-Lck, but not p-Zap70, after TCR-stimulation were significantly af-fected by VL. This suggests that T cells in the presence of high VLand higher levels of circulating gp120 are more prone to lose activa-tion of the immediate-early Lck-mediated TCR signaling and that thisaltered activation of the CD4-associated Lck kinase does not fullytranslate to the downstream Zap70 kinase. However, signalingthrough Lck is also altered in CD8� T cells, suggesting that gp120alone does not account for blunted signaling. The more pronouncedimpairment of p-ERK1/2 after stimulation with PMA/Iono, whencompared with p-p38, possibly reflects the fact that blunted changes inp-ERK1/2 are associated with higher VLs, whereas p-p38 is less af-fected. High VLs do not seem to be the causative agent of bluntedIL-2 signaling, as analyzed by change in p-Stat5 after stimulation. Tomore directly analyze the effect of cellular activation on signaling in
HIV infection, we correlated basal phosphorylation and signaling withcellular activation, i.e., as measured by expression of the activationmarkers CD38 and/or HLA-DR, for a subset of patients (9 LTNP, 3PROG, and 10 RESP). Data from these patients had all been gatheredwithin 12 mo of the PhosFlow analysis, and the patients had shown nochange in clinical status during the intervening time frame. There wasa clear trend of higher activation correlated with higher basal phos-phorylation and blunted signaling (data not shown). However, withthe limited data set available, the correlations were not statisticallysignificant and we are, at this point, not able to directly show a cor-relation between cellular activation and basal levels of phosphoryla-tion or signaling. However, studies addressing this important questionare underway.
The immunoreceptor PD-1 suppresses TCR signaling, likely viaa recruitment of SHP phosphatase activity, resulting in decreasedphosphorylation of the CD3� activation motifs, attenuated Zap70activation, and inhibition of downstream signal transduction (55).Recently, up-regulation and expression of PD-1 has been associ-ated with T cell dysfunction, and cellular exhaustion in chroniclymphocytic choriomeningitis virus and HIV infections (42–46).Therefore, expression of PD-1 might well account for some of thedecreased signaling seen here. PD-1 expression was highest on cellsfrom patients with progressive disease and elevated levels were as-sociated with blunted changes in p-Lck and p-Zap70 in most T cellsubpopulations after TCR stimulation. Interestingly, high levels ofPD-1 expression were also associated with blunted IL-2 signaling inCD8�, but not CD4�, T cells, possibly reflecting different IL-2 sig-naling networks or requirements in these cell types.
Progressive HIV disease is associated with a chronic inflamma-tory state that induces T cell activation (48, 50) and the secretionof multiple proinflammatory cytokines and chemokines. These me-diators, in turn, can have profound effects on the expression ofcellular proteins involved in cell-cell interactions. For instance,HIV-induced stimulation of IFN� from plasmacytoid dendriticcells results in up-regulation of MHC class I proteins in vivo,which in turn can interact with TCR of circulating cells (56, 57).These more global and indirect factors may affect the basal phos-phorylation state of key signaling intermediates within CD4� andCD8� T cells. Thus, a constitutive activation of Stat1 and Stat5 inPBMCs has previously been reported in the setting of HIV infec-tion (58). Our results show that levels of Stat5 phosphorylation arehighest in CD4� and CD8� T cells from patients with progressivedisease and that these cells are precisely those with impaired sig-naling. Similar results were found for Lck and ERK1/2 (but notZap70 or p38) and, again, high levels of basal phosphorylation ofthese kinases were associated with lower changes in induced phos-phorylation after TCR, IL-2, and PMA/ionomycin stimulation.
To determine whether blunted signaling is the consequence ofelevated basal phosphorylation and/or down-regulated signalingpathways, we also compared the MFI of the p-signals after stim-ulation (data not shown). The results indicate that the “end pointlevels” of phosphorylation are similar in the three groups. Al-though in some instances (most evident for p-Stat5 after stimula-tion with IL-2) PROG had slightly higher end levels, these differ-ences were not as striking and significant as those found in the caseof basal phosphorylation (shown in Fig. 6). These results suggestthat blunted responses can, at least in part, be explained by highlevels of basal phosphorylation in T cells from HIV PROGs andare consistent with a model in which higher basal phosphorylationlevels only allow for blunted changes in phosphorylation of “pre-activated” signaling proteins. Such higher basal phosphorylationmight reflect activation and/or perturbed regulation of cellular
6498 T CELL SIGNALING IN HIV INFECTION
by guest on January 4, 2019http://w
ww
.jimm
unol.org/D
ownloaded from

signaling in the setting of HIV infection. However, other mecha-nisms, such as differential expression of signaling receptors or pro-teins, e.g., down-regulated IL-2R, might also be contributory.
Elevated levels of basal phosphorylation and dysregulated sig-naling might very well be related to or caused by cellular alter-ations in the cellular redox balance. Thus, HIV disease progressionhas been shown to be associated with decreasing levels of gluta-thione (GSH), the major redox buffer in almost all cells (59–62).Alterations in GSH levels affect the activity of redox-sensitive en-zymes, including protein kinases and phosphatases. Such changes, inturn, appear to impact upon cellular signal transduction pathways(63). In the specific case of HIV disease, depletion of GSH was shownto result in elevated levels of basal phosphorylation and in cellulardysfunction, e.g., reduced calcium flux and proliferation in responseto TCR stimulation (61). Importantly, GSH deficiency has also beenassociated with numerous other disease states (64). It is accordinglyconceivable that, in the context of the chronic immune activationfound in late-stage HIV disease, a dysregulated redox balance willresult in increased levels of basal phosphorylation. If so, specific stim-uli may not be able to generate sufficient levels of additional phos-phorylation to transduce appropriate intracellular signals. Interest-ingly, very little is known about how basal phosphorylation levelsaffect signaling networks, their regulation, and cellular function. In asubset of patients with acute myeloid lymphoma, members of the Statproteins have been reported to be constitutively activated, and up-regulated basal state of phosphorylation has been connected to thedisability to activate further signaling past basal phosphorylation lev-els (65). These and our results underscore the need to better under-stand the role of basal levels of phosphorylation in regulating or per-turbing cell signaling in health and in disease.
Finally, we found that the blunted signaling responses in progres-sive disease resolve upon ART. Although we cannot discriminate be-tween normalization due to cell replacement (e.g., cells produced denovo from progenitor pools) or to reversion (e.g., of previously dys-functional cells), this observation indicates that the lesion in signalingis reversible, as long as HIV VLs are brought under control.
In summary, we have demonstrated that, in the setting of HIVinfection, CD4� and CD8� T cell signaling is blunted in cellsfrom untreated subjects with progressive disease compared withLTNP and RESPs. The observed signaling alterations are not re-stricted to or manifest within a specific T cell subpopulation, sug-gesting a generalized state of unresponsiveness. Some alterationsin cellular signaling correlated with levels of basal phosphoryla-tion, VL, and/or expression of signaling-regulatory protein PD-1.Of these influences, it was the level of basal phosphorylation thatappeared to be the most dominant (Fig. 8). Altered signaling foundin PROGs was reversible with antiretroviral treatment, indicatingthat signaling dysfunctions can be restored. More detailed analysesof specific signaling pathways and of levels of basal phosphory-lation might suggest ways to correct these T cell signaling dys-functions and to help restore function of CD4� and CD8� T cells.
AcknowledgmentsWe thank the study volunteers Garry P. Nolan, Andrew W. Lee, and OmarD. Perez for their initial input on setting up the PhosFlow assay and forreviewing the manuscript, and Brinda Emu, Kristin Ladell, Peter Hunt, andJason D. Barbour for insightful discussions.
DisclosuresThe authors have no financial conflict of interest.
References1. Baier, M., A. Werner, N. Bannert, K. Metzner, and R. Kurth. 1995. HIV sup-
pression by interleukin-16. Nature 378: 563.2. Cocchi, F., A. L. DeVico, A. Garzino-Demo, S. K. Arya, R. C. Gallo, and
P. Lusso. 1995. Identification of RANTES, MIP-1 �, and MIP-1 � as the majorHIV-suppressive factors produced by CD8� T cells. Science 270: 1811–1815.
3. Gulzar, N., and K. F. Copeland. 2004. CD8� T-cells: function and response toHIV infection. Curr. HIV Res. 2: 23–37.
4. Koup, R. A., J. T. Safrit, Y. Cao, C. A. Andrews, G. McLeod, W. Borkowsky,C. Farthing, and D. D. Ho. 1994. Temporal association of cellular immune re-sponses with the initial control of viremia in primary human immunodeficiencyvirus type 1 syndrome. J. Virol. 68: 4650–4655.
5. Mackewicz, C. E., D. J. Blackbourn, and J. A. Levy. 1995. CD8� T cells suppresshuman immunodeficiency virus replication by inhibiting viral transcription. Proc.Natl. Acad. Sci. USA 92: 2308–2312.
6. Ogg, G. S., X. Jin, S. Bonhoeffer, P. R. Dunbar, M. A. Nowak, S. Monard,J. P. Segal, Y. Cao, S. L. Rowland-Jones, V. Cerundolo, et al. 1998. Quantitationof HIV-1-specific cytotoxic T lymphocytes and plasma load of viral RNA. Sci-ence 279: 2103–2106.
7. Plata, F., B. Autran, L. P. Martins, S. Wain-Hobson, M. Raphael, C. Mayaud,M. Denis, J. M. Guillon, and P. Debre. 1987. AIDS virus-specific cytotoxic Tlymphocytes in lung disorders. Nature 328: 348–351.
8. Walker, B. D., S. Chakrabarti, B. Moss, T. J. Paradis, T. Flynn, A. G. Durno,R. S. Blumberg, J. C. Kaplan, M. S. Hirsch, and R. T. Schooley. 1987. HIV-specificcytotoxic T lymphocytes in seropositive individuals. Nature 328: 345–348.
9. Walker, C. M., D. J. Moody, D. P. Stites, and J. A. Levy. 1986. CD8� lympho-cytes can control HIV infection in vitro by suppressing virus replication. Science234: 1563–1566.
10. Kalams, S. A., and B. D. Walker. 1998. The critical need for CD4 help in main-taining effective cytotoxic T lymphocyte responses. J. Exp. Med. 188:2199–2204.
11. Hellerstein, M., M. B. Hanley, D. Cesar, S. Siler, C. Papageorgopoulos,E. Wieder, D. Schmidt, R. Hoh, R. Neese, D. Macallan, et al. 1999. Directlymeasured kinetics of circulating T lymphocytes in normal and HIV-1-infectedhumans. Nat. Med. 5: 83–89.
12. McCune, J. M. 2001. The dynamics of CD4� T-cell depletion in HIV disease.Nature 410: 974–979.
13. Sachsenberg, N., A. S. Perelson, S. Yerly, G. A. Schockmel, D. Leduc,B. Hirschel, and L. Perrin. 1998. Turnover of CD4� and CD8� T lymphocytesin HIV-1 infection as measured by Ki-67 antigen. J. Exp. Med. 187: 1295–1303.
14. Wolthers, K. C., G. Bea, A. Wisman, S. A. Otto, A. M. de Roda Husman,N. Schaft, F. de Wolf, J. Goudsmit, R. A. Coutinho, A. G. van der Zee, et al.1996. T cell telomere length in HIV-1 infection: no evidence for increased CD4�
T cell turnover. Science 274: 1543–1547.15. Zhang, Z. Q., D. W. Notermans, G. Sedgewick, W. Cavert, S. Wietgrefe,
M. Zupancic, K. Gebhard, K. Henry, L. Boies, Z. Chen, et al. 1998. Kinetics ofCD4� T cell repopulation of lymphoid tissues after treatment of HIV-1 infection.Proc. Natl. Acad. Sci. USA 95: 1154–1159.
16. Clerici, M., N. I. Stocks, R. A. Zajac, R. N. Boswell, D. R. Lucey, C. S. Via, andG. M. Shearer. 1989. Detection of three distinct patterns of T helper cell dysfunctionin asymptomatic, human immunodeficiency virus-seropositive patients: indepen-dence of CD4� cell numbers and clinical staging. J. Clin. Invest. 84: 1892–1899.
17. Gruters, R. A., F. G. Terpstra, R. De Jong, C. J. Van Noesel, R. A. Van Lier, andF. Miedema. 1990. Selective loss of T cell functions in different stages of HIV
basal phosho log10(VL) PD-1 expression
naive
mem
mem-eff
naive
mem
mem-eff
effector
CD
4+C
D8+
Lck
/ TC
R
Zap
70 /
TC
R
Erk
1/2
/ P+
I
p38
/ P+
I
Sta
t5 /
IL-2
Lck
/ TC
R
Zap
70 /
TC
R
Erk
1/2
/ P+
I
p38
/ P+
I
Sta
t5 /
IL-2
Lck
/ TC
R
Zap
70 /
TC
R
Erk
1/2
/ P+
I
p38
/ P+
I
Sta
t5 /
IL-2
ns P< 0.05 P< 0.01 P< 0.001* ** ***
FIGURE 8. Overview of significances of correlations analyzed using aheat map representation. Values of p from previous correlation analyses arehere color-coded (�, p � 0.05 in dark gray; ��, p � 0.01 in gray; ���, p �0.001 in light gray; not significant (ns) in black). Columns show p valuesfor correlation of signaling (Lck and Zap70 after TCR stimulation; ERK1/2and p38 after stimulation with PMA/ionomycin; and Stat5 after IL-2 stim-ulation) with (i) basal phosphorylation (left; compare Fig. 8), (ii) VL (mid-dle; compare Fig. 4), and (iii) cell surface expression of PD-1 (right; com-pare Fig. 5). Corresponding CD4� and CD8� T cell subpopulationsanalyzed are ordered in rows as indicated on the right.
6499The Journal of Immunology
by guest on January 4, 2019http://w
ww
.jimm
unol.org/D
ownloaded from
infection. Early loss of anti-CD3-induced T cell proliferation followed by de-creased anti-CD3-induced cytotoxic T lymphocyte generation in AIDS-relatedcomplex and AIDS. Eur. J. Immunol. 20: 1039–1044.
18. Imami, N., A. Pires, G. Hardy, J. Wilson, B. Gazzard, and F. Gotch. 2002. Abalanced type 1/type 2 response is associated with long-term nonprogressivehuman immunodeficiency virus type 1 infection. J. Virol. 76: 9011–9023.
19. Kryworuchko, M., V. Pasquier, H. Keller, D. David, C. Goujard, J. Gilquin,J. P. Viard, M. Joussemet, J. F. Delfraissy, and J. Theze. 2004. Defective inter-leukin-2-dependent STAT5 signalling in CD8 T lymphocytes from HIV-positivepatients: restoration by antiretroviral therapy. AIDS 18: 421–426.
20. Musey, L. K., J. N. Krieger, J. P. Hughes, T. W. Schacker, L. Corey, andM. J. McElrath. 1999. Early and persistent human immunodeficiency virus type1 (HIV-1)-specific T helper dysfunction in blood and lymph nodes followingacute HIV-1 infection. J. Infect. Dis. 180: 278–284.
21. Andersson, J., S. Kinloch, A. Sonnerborg, J. Nilsson, T. E. Fehniger, A. L. Spetz,H. Behbahani, L. E. Goh, H. McDade, B. Gazzard, et al. 2002. Low levels of perforinexpression in CD8� T lymphocyte granules in lymphoid tissue during acute humanimmunodeficiency virus type 1 infection. J. Infect. Dis. 185: 1355–1358.
22. Appay, V., D. F. Nixon, S. M. Donahoe, G. M. Gillespie, T. Dong, A. King,G. S. Ogg, H. M. Spiegel, C. Conlon, C. A. Spina, et al. 2000. HIV-specificCD8� T cells produce antiviral cytokines but are impaired in cytolytic function.J. Exp. Med. 192: 63–75.
23. Kamin-Lewis, R., S. F. Abdelwahab, C. Trang, A. Baker, A. L. DeVico, R. C. Gallo,and G. K. Lewis. 2001. Perforin-low memory CD8� cells are the predominant T cellsin normal humans that synthesize the �-chemokine macrophage inflammatory pro-tein-1�. Proc. Natl. Acad. Sci. USA 98: 9283–9288.
24. Appay, V., P. R. Dunbar, M. Callan, P. Klenerman, G. M. Gillespie, L. Papagno,G. S. Ogg, A. King, F. Lechner, C. A. Spina, et al. 2002. Memory CD8� T cellsvary in differentiation phenotype in different persistent virus infections. Nat. Med.8: 379–385.
25. Champagne, P., G. S. Ogg, A. S. King, C. Knabenhans, K. Ellefsen, M. Nobile,V. Appay, G. P. Rizzardi, S. Fleury, M. Lipp, et al. 2001. Skewed maturation ofmemory HIV-specific CD8 T lymphocytes. Nature 410: 106–111.
26. Trimble, L. A., L. W. Kam, R. S. Friedman, Z. Xu, and J. Lieberman. 2000. CD3�and CD28 down-modulation on CD8 T cells during viral infection. Blood 96:1021–1029.
27. Trimble, L. A., and J. Lieberman. 1998. Circulating CD8 T lymphocytes in hu-man immunodeficiency virus-infected individuals have impaired function anddownmodulate CD3 �, the signaling chain of the T-cell receptor complex. Blood91: 585–594.
28. Lieberman, J., P. Shankar, N. Manjunath, and J. Andersson. 2001. Dressed tokill? A review of why antiviral CD8 T lymphocytes fail to prevent progressiveimmunodeficiency in HIV-1 infection. Blood 98: 1667–1677.
29. van Baarle, D., S. Kostense, M. H. van Oers, D. Hamann, and F. Miedema. 2002.Failing immune control as a result of impaired CD8� T-cell maturation: CD27might provide a clue. Trends Immunol. 23: 586–591.
30. Roos, M. T., M. Prins, M. Koot, F. de Wolf, M. Bakker, R. A. Coutinho,F. Miedema, and P. T. Schellekens. 1998. Low T-cell responses to CD3 plusCD28 monoclonal antibodies are predictive of development of AIDS. AIDS 12:1745–1751.
31. Schellekens, P. T., M. T. Roos, F. De Wolf, J. M. Lange, and F. Miedema. 1990.Low T-cell responsiveness to activation via CD3/TCR is a prognostic marker foracquired immunodeficiency syndrome (AIDS) in human immunodeficiency vi-rus-1 (HIV-1)-infected men. J. Clin. Immunol. 10: 121–127.
32. Cayota, A., F. Vuillier, J. Siciliano, and G. Dighiero. 1994. Defective proteintyrosine phosphorylation and altered levels of p59fyn and p56lck in CD4 T cellsfrom HIV-1 infected patients. Int. Immunol. 6: 611–621.
33. Stefanova, I., M. W. Saville, C. Peters, F. R. Cleghorn, D. Schwartz,D. J. Venzon, K. J. Weinhold, N. Jack, C. Bartholomew, W. A. Blattner, et al.1996. HIV infection-induced posttranslational modification of T cell signalingmolecules associated with disease progression. J. Clin. Invest. 98: 1290–1297.
34. Bostik, P., P. Wu, G. L. Dodd, F. Villinger, A. E. Mayne, V. Bostik,B. D. Grimm, D. Robinson, H. J. Kung, and A. A. Ansari. 2001. Identification ofprotein kinases dysregulated in CD4� T cells in pathogenic versus apathogenicsimian immunodeficiency virus infection. J. Virol. 75: 11298–11306.
35. Gale, M. J., Jr., J. A. Ledbetter, G. L. Schieven, M. Jonker, W. R. Morton,R. E. Benveniste, and E. A. Clark. 1990. CD4 and CD8 T cells from SIV-infectedmacaques have defective signaling responses after perturbation of either CD3 orCD2 receptors. Int. Immunol. 2: 849–858.
36. Farber, D. L., O. Acuto, and K. Bottomly. 1997. Differential T cell receptor-mediated signaling in naive and memory CD4 T cells. Eur. J. Immunol. 27:2094–2101.
37. Meyaard, L., S. A. Otto, B. Hooibrink, and F. Miedema. 1994. Quantitativeanalysis of CD4� T cell function in the course of human immunodeficiency virusinfection: gradual decline of both naive and memory alloreactive T cells. J. Clin.Invest. 94: 1947–1952.
38. Seder, R. A., and R. Ahmed. 2003. Similarities and differences in CD4� andCD8� effector and memory T cell generation. Nat. Immunol. 4: 835–842.
39. Krutzik, P. O., and G. P. Nolan. 2003. Intracellular phospho-protein stainingtechniques for flow cytometry: monitoring single cell signaling events. CytometryA 55: 61–70.
40. Perez, O. D., P. O. Krutzik, and G. P. Nolan. 2004. Flow cytometric analysis ofkinase signaling cascades. Methods Mol. Biol. 263: 67–94.
41. Perez, O. D., and G. P. Nolan. 2002. Simultaneous measurement of multipleactive kinase states using polychromatic flow cytometry. Nat. Biotechnol. 20:155–162.
42. Barber, D. L., E. J. Wherry, D. Masopust, B. Zhu, J. P. Allison, A. H. Sharpe,G. J. Freeman, and R. Ahmed. 2006. Restoring function in exhausted CD8 T cellsduring chronic viral infection. Nature 439: 682–687.
43. Day, C. L., D. E. Kaufmann, P. Kiepiela, J. A. Brown, E. S. Moodley, S. Reddy,E. W. Mackey, J. D. Miller, A. J. Leslie, C. DePierres, et al. 2006. PD-1 expres-sion on HIV-specific T cells is associated with T-cell exhaustion and diseaseprogression. Nature 443: 350–354.
44. Freeman, G. J., E. J. Wherry, R. Ahmed, and A. H. Sharpe. 2006. Reinvigoratingexhausted HIV-specific T cells via PD-1-PD-1 ligand blockade. J. Exp. Med. 203:2223–2227.
45. Petrovas, C., J. P. Casazza, J. M. Brenchley, D. A. Price, E. Gostick,W. C. Adams, M. L. Precopio, T. Schacker, M. Roederer, D. C. Douek, andR. A. Koup. 2006. PD-1 is a regulator of virus-specific CD8� T cell survival inHIV infection. J. Exp. Med. 203: 2281–2292.
46. Trautmann, L., L. Janbazian, N. Chomont, E. A. Said, S. Gimmig, B. Bessette,M. R. Boulassel, E. Delwart, H. Sepulveda, R. S. Balderas, et al. 2006. Upregu-lation of PD-1 expression on HIV-specific CD8� T cells leads to reversibleimmune dysfunction. Nat. Med. 12: 1198–1202.
47. Sommers, C. L., C. S. Park, J. Lee, C. Feng, C. L. Fuller, A. Grinberg,J. A. Hildebrand, E. Lacana, R. K. Menon, E. W. Shores, et al. 2002. A LATmutation that inhibits T cell development yet induces lymphoproliferation. Sci-ence 296: 2040–2043.
48. Deeks, S. G., C. M. Kitchen, L. Liu, H. Guo, R. Gascon, A. B. Narvaez, P. Hunt,J. N. Martin, J. O. Kahn, J. Levy, et al. 2004. Immune activation set point duringearly HIV infection predicts subsequent CD4� T-cell changes independent ofviral load. Blood 104: 942–947.
49. Hazenberg, M. D., S. A. Otto, B. H. van Benthem, M. T. Roos, R. A. Coutinho,J. M. Lange, D. Hamann, M. Prins, and F. Miedema. 2003. Persistent immuneactivation in HIV-1 infection is associated with progression to AIDS. AIDS 17:1881–1888.
50. Giorgi, J. V., R. H. Lyles, J. L. Matud, T. E. Yamashita, J. W. Mellors, L. E. Hultin,B. D. Jamieson, J. B. Margolick, C. R. Rinaldo, Jr., J. P. Phair, and R. Detels. 2002.Predictive value of immunologic and virologic markers after long or short duration ofHIV-1 infection. J. Acquired Immune Defic. Syndr. 29: 346–355.
51. Diamond, D. C., B. P. Sleckman, T. Gregory, L. A. Lasky, J. L. Greenstein, andS. J. Burakoff. 1988. Inhibition of CD4� T cell function by the HIV envelopeprotein, gp120. J. Immunol. 141: 3715–3717.
52. Mittler, R. S., and M. K. Hoffmann. 1989. Synergism between HIV gp120 andgp120-specific antibody in blocking human T cell activation. Science 245:1380–1382.
53. Goldman, F., J. Crabtree, C. Hollenback, and G. Koretzky. 1997. Sequestrationof p56(lck) by gp120, a model for TCR desensitization. J. Immunol. 158:2017–2024.
54. Juszczak, R. J., H. Turchin, A. Truneh, J. Culp, and S. Kassis. 1991. Effect ofhuman immunodeficiency virus gp120 glycoprotein on the association of theprotein tyrosine kinase p56lck with CD4 in human T lymphocytes. J. Biol. Chem.266: 11176–11183.
55. Sheppard, K. A., L. J. Fitz, J. M. Lee, C. Benander, J. A. George, J. Wooters,Y. Qiu, J. M. Jussif, L. L. Carter, C. R. Wood, and D. Chaudhary. 2004. PD-1inhibits T-cell receptor induced phosphorylation of the ZAP70/CD3� signalo-some and downstream signaling to PKC�. FEBS Lett. 574: 37–41.
56. Keir, M. E., M. G. Rosenberg, J. K. Sandberg, K. A. Jordan, A. Wiznia, D. F. Nixon,C. A. Stoddart, and J. M. McCune. 2002. Generation of CD3�CD8low thymocytes inthe HIV type 1-infected thymus. J. Immunol. 169: 2788–2796.
57. Keir, M. E., C. A. Stoddart, V. Linquist-Stepps, M. E. Moreno, andJ. M. McCune. 2002. IFN-� secretion by type 2 predendritic cells up-regulatesMHC class I in the HIV-1-infected thymus. J. Immunol. 168: 325–331.
58. Bovolenta, C., L. Camorali, A. L. Lorini, S. Ghezzi, E. Vicenzi, A. Lazzarin, andG. Poli. 1999. Constitutive activation of STATs upon in vivo human immuno-deficiency virus infection. Blood 94: 4202–4209.
59. Droge, W., K. Schulze-Osthoff, S. Mihm, D. Galter, H. Schenk, H. P. Eck,S. Roth, and H. Gmunder. 1994. Functions of glutathione and glutathione disul-fide in immunology and immunopathology. FASEB J. 8: 1131–1138.
60. Lim, J. S., H. P. Eck, H. Gmunder, and W. Droge. 1992. Expression of increasedimmunogenicity by thiol-releasing tumor variants. Cell. Immunol. 140: 345–356.
61. Staal, F. J., M. T. Anderson, G. E. Staal, L. A. Herzenberg, C. Gitler, andL. A. Herzenberg. 1994. Redox regulation of signal transduction: tyrosine phos-phorylation and calcium influx. Proc. Natl. Acad. Sci. USA 91: 3619–3622.
62. Staal, F. J., M. Roederer, D. M. Israelski, J. Bubp, L. A. Mole, D. McShane,S. C. Deresinski, W. Ross, H. Sussman, P. A. Raju, et al. 1992. Intracellularglutathione levels in T cell subsets decrease in HIV-infected individuals. AIDSRes. Hum. Retroviruses 8: 305–311.
63. Kanner, S. B., T. J. Kavanagh, A. Grossmann, S. L. Hu, J. B. Bolen,P. S. Rabinovitch, and J. A. Ledbetter. 1992. Sulfhydryl oxidation down-regu-lates T-cell signaling and inhibits tyrosine phosphorylation of phospholipaseC � 1. Proc. Natl. Acad. Sci. USA 89: 300–304.
64. Atkuri, K. R., J. J. Mantovani, L. A. Herzenberg, and L. A. Herzenberg. 2007.N-Acetylcysteine: a safe antidote for cysteine/glutathione deficiency. Curr. Opin.Pharmacol. 7: 355–359.
65. Irish, J. M., R. Hovland, P. O. Krutzik, O. D. Perez, O. Bruserud, B. T. Gjertsen,and G. P. Nolan. 2004. Single cell profiling of potentiated phospho-protein net-works in cancer cells. Cell 118: 217–228.
6500 T CELL SIGNALING IN HIV INFECTION
by guest on January 4, 2019http://w
ww
.jimm
unol.org/D
ownloaded from