hitachi ratio beam spectrophotometer - merittech · even those users who are new to a...
TRANSCRIPT
Hitachi Ratio Beam Spectrophotometer

E C O - F R I E N D L Y & C L E A NF o r a B e a u t i f u l E a r t h
The concept underlying Hitachi’ s U-5100 UV-Visible Spectrophotometer is
ECO-FRIENDLY & CLEAN.
The U-5100 delivers a compact, lightweight package with remarkable power savings and
a long life light source.
The U-5100 incorporates every aspect of the technological features of Hitachi’ s reliability-proven
spectrophotometers while achieving our ultimate goal -
the creation of a new spectrophotometer that is both
ECO-FRIENDLY & CLEAN and provides SUPERIOR PERFORMANCE.
1* This display is simulated screen.
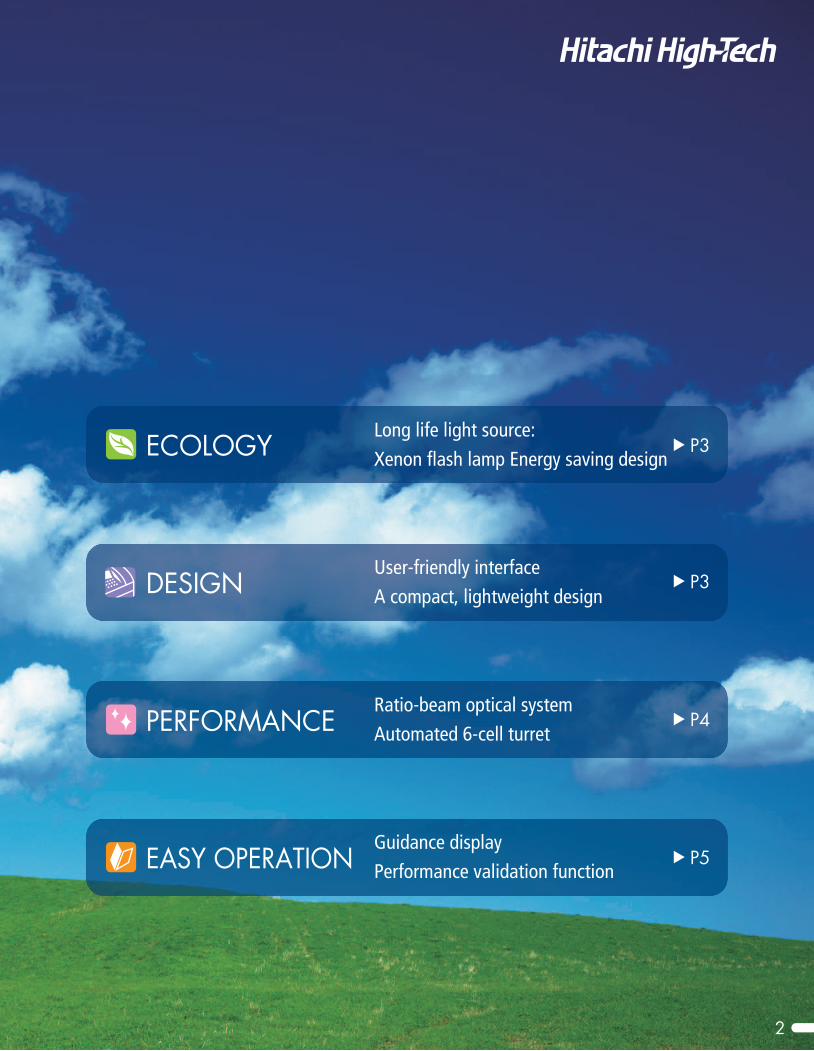
Long life light source:
Xenon flash lamp Energy saving design
User-friendly interface
A compact, lightweight design
Ratio-beam optical system
Automated 6-cell turret
Guidance display
Performance validation function
P3ECOLOGY
DESIGN
PERFORMANCE
EASY OPERATION
P3
P4
P5
2
ECO - FR I ENDLY & C LEAN
DESIGN
ECOLOGY
3
140
120
100
80
60
40
20
0
W s
700
600
500
400
300
200
100
0
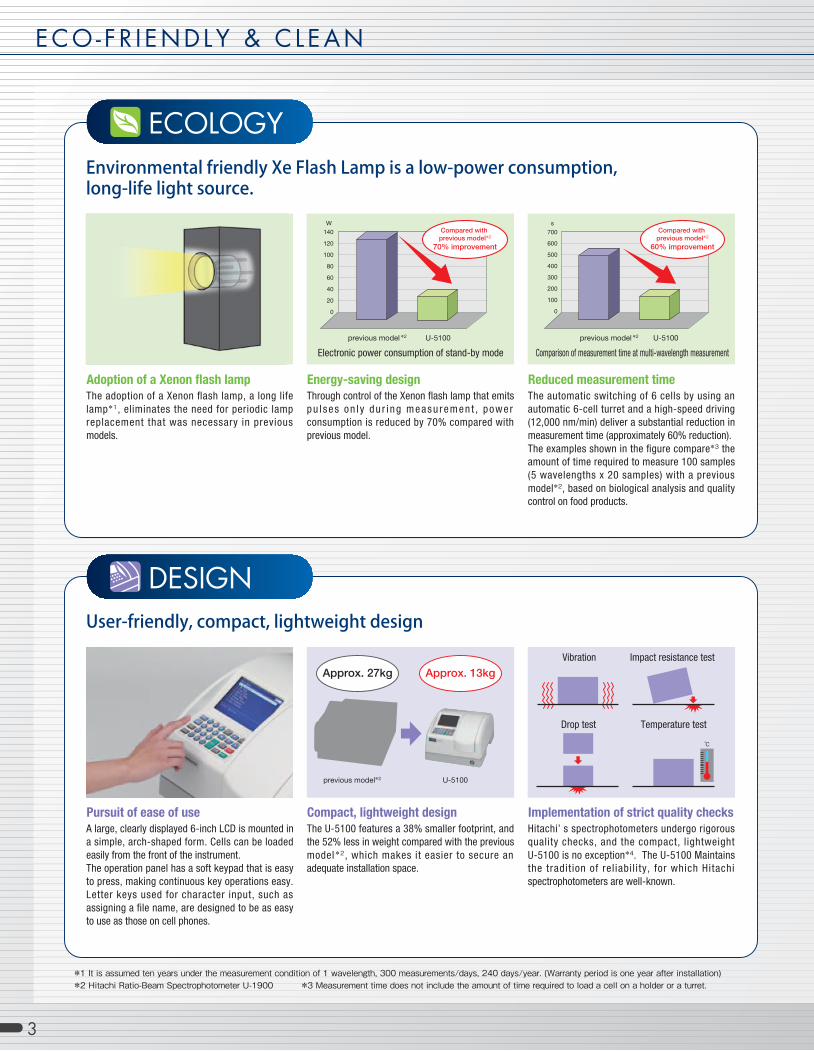
Environmental friendly Xe Flash Lamp is a low-power consumption, long-life light source.
User-friendly, compact, lightweight design
ランプ
Adoption of a Xenon flash lamp
The adoption of a Xenon flash lamp, a long life lamp*1, eliminates the need for periodic lamp replacement that was necessary in previous models.
Energy-saving design
Through control of the Xenon flash lamp that emits pu l ses on l y du r i ng measu remen t , power consumption is reduced by 70% compared with previous model.
Reduced measurement time
The automatic switching of 6 cells by using an automatic 6-cell turret and a high-speed driving (12,000 nm/min) deliver a substantial reduction in measurement time (approximately 60% reduction).The examples shown in the figure compare*3 the amount of time required to measure 100 samples (5 wavelengths x 20 samples) with a previous model*2, based on biological analysis and quality control on food products.
Pursuit of ease of use
A large, clearly displayed 6-inch LCD is mounted in a simple, arch-shaped form. Cells can be loaded easily from the front of the instrument. The operation panel has a soft keypad that is easy to press, making continuous key operations easy. Letter keys used for character input, such as assigning a file name, are designed to be as easy to use as those on cell phones.
Compact, lightweight design
The U-5100 features a 38% smaller footprint, and the 52% less in weight compared with the previous model *2, which makes it easier to secure an adequate installation space.
Implementation of strict quality checks
Hitachi’ s spectrophotometers undergo rigorous quality checks, and the compact, lightweight U-5100 is no exception*4. The U-5100 Maintains the tradit ion of rel iabil i ty, for which Hitachi spectrophotometers are well-known.
*1 It is assumed ten years under the measurement condition of 1 wavelength, 300 measurements/days, 240 days/year. (Warranty period is one year after installation)*2 Hitachi Ratio-Beam Spectrophotometer U-1900 *3 Measurement time does not include the amount of time required to load a cell on a holder or a turret.
U-5100previous model*2
Drop test
Impact resistance test
Temperature test
U-5100previous model*2 previous model*2
Approx. 13kgApprox. 27kgVibration
℃
Comparison of measurement time at multi-wavelength measurementElectronic power consumption of stand-by mode
U-5100
Compared with previous model*2
70% improvement
Compared with previous model*2
60% improvement
PERFORMANCE
4
Hitachi Ratio Beam Spectrophotometer
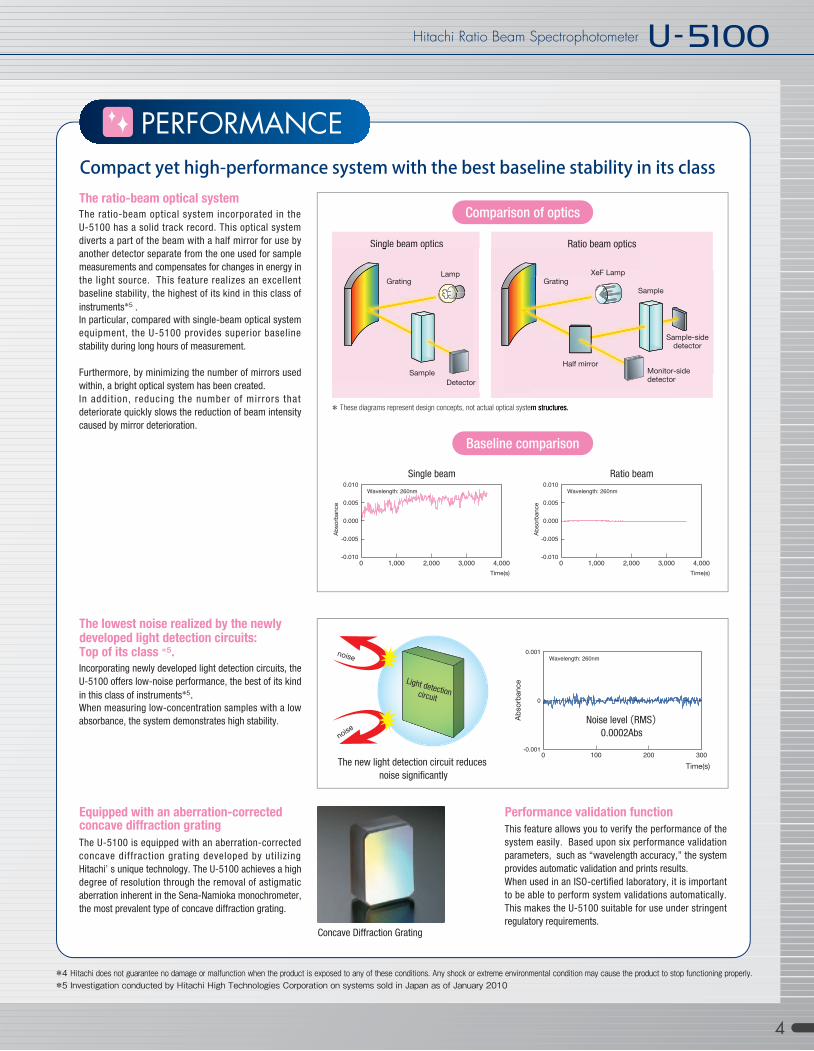
Compact yet high-performance system with the best baseline stability in its classThe ratio-beam optical systemThe ratio-beam optical system incorporated in the U-5100 has a solid track record. This optical system diverts a part of the beam with a half mirror for use by another detector separate from the one used for sample measurements and compensates for changes in energy in the light source. This feature realizes an excellent baseline stability, the highest of its kind in this class of instruments*5 . In particular, compared with single-beam optical system equipment, the U-5100 provides superior baseline stability during long hours of measurement.
Furthermore, by minimizing the number of mirrors used within, a bright optical system has been created. In addit ion, reducing the number of mirrors that deteriorate quickly slows the reduction of beam intensity caused by mirror deterioration.
Equipped with an aberration-correctedconcave diffraction grating
The U-5100 is equipped with an aberration-corrected concave diffraction grating developed by util izing Hitachi’ s unique technology. The U-5100 achieves a high degree of resolution through the removal of astigmatic aberration inherent in the Sena-Namioka monochrometer, the most prevalent type of concave diffraction grating.
Performance validation function
This feature allows you to verify the performance of the system easily. Based upon six performance validation parameters, such as “wavelength accuracy,” the system provides automatic validation and prints results.When used in an ISO-certified laboratory, it is important to be able to perform system validations automatically. This makes the U-5100 suitable for use under stringent regulatory requirements.
The lowest noise realized by the newly developed light detection circuits: Top of its class *5.
Incorporating newly developed light detection circuits, the U-5100 offers low-noise performance, the best of its kind in this class of instruments*5.When measuring low-concentration samples with a low absorbance, the system demonstrates high stability.
* These diagrams represent design concepts, not actual optical system structures.
*4 Hitachi does not guarantee no damage or malfunction when the product is exposed to any of these conditions. Any shock or extreme environmental condition may cause the product to stop functioning properly.*5 Investigation conducted by Hitachi High Technologies Corporation on systems sold in Japan as of January 2010
Comparison of optics
Baseline comparison
The new light detection circuit reduces noise significantly
Concave Diffraction Grating
Single beam
Ab
so
rban
ce
Ab
so
rban
ce
Ab
so
rban
ce
Time(s)
noise
noise
Time(s)
Time(s)
Ratio beam
Wavelength: 260nm
Wavelength: 260nmWavelength: 260nm
0.001
0
-0.0010 100 200 300
Single beam optics Ratio beam optics
Grating Grating
Half mirrorMonitor-sidedetector
Sample
Sample
Sample-sidedetector
Detector
Lamp
Light detection circuit
Noise level(RMS)0.0002Abs
XeF Lamp
0 1,000 2,000 3,000 4,000
0.010
0.005
0.000
-0.005
-0.0100 1,000 2,000 3,000 4,000
0.010
0.005
0.000
-0.005
-0.010

ECO - FR I ENDLY & C LEAN
5
Performing at a Higher LevelThe standard automatic 6-cell turret makes performing measurements a breeze.
As part of its standard configuration, the system is equipped with a 6-cell turret which accommodates up to six 10-mm rectangular cells. The system can measure a maximum of six calibration solutions and sample solutions *6, reducing the measurement time and improving the efficiency of your lab.
Cell-position guidance display
When using the 6-cell turret for automatic sample measurements, the screen displays sample positions and type of sample to be placed for measurement.For example, when performing a quantitative measurement, the operator can set a calibration or sample solution while checking the "guide on the sample position".Even those users who are new to a spectrophotometer can easily set a cell.
By measuring a standard solution and creating a calibration curve, users can perform quantitative analyses on unknown samples. Alternatively, quantitative analysis can be accomplished through the input of coefficients.In addition, the system supports multi-wavelength measurement up to six wavelengths to measure absorbance or transmittance, as well as ratio calculations (calculates the purity of DNA by computing the ratio between two wavelengths (A260/A280 and A260/A230)).
Over the 190 to 1100 nm range, the system can measure absorpt ion spect ra and transmission spectra. After the measurements, the user can verify the spectral data in great detail by using the peak detection function, the tracing function, the expansion of the abscissa, the ordinate, and the reduced display.
Photometric value (absorbance/transmittance) at a fixed wavelength can be measured in a desired measurement time from 60 to 99999 seconds. This feature can be used to measure the decomposition of the sample from a change in absorbance or the analysis of enzyme reactions.
The measurement menu provides the following items, with user-selectable modes:
*6 Including samples for setting an auto zero (the operation of adjusting the absorbance to zero)
Guidance on a sample loading position
6-cell turret
Automatic measurement using a 6-cell turret
EASY OPERATION
Measurement result (calibration curve)
Photometry Wavelength Scan Time Scan Data Display
This is a useful mode for the measurement of either absorbance or transmittance at a single wavelength while reading the results. Wavelength and photometric values can be displayed in large characters.
Automatic Automatic measurement in measurement in
the specimen the specimen chamberchamber
Automatic measurement in
the specimen chamber
Method Menu (up to 50 parameters can be saved)Data Menu (up to 30 data items can be saved)
System SetupPerformance Check
Photometry Wavelength ScanTime Scan Data Display
6
Hitachi Ratio Beam Spectrophotometer
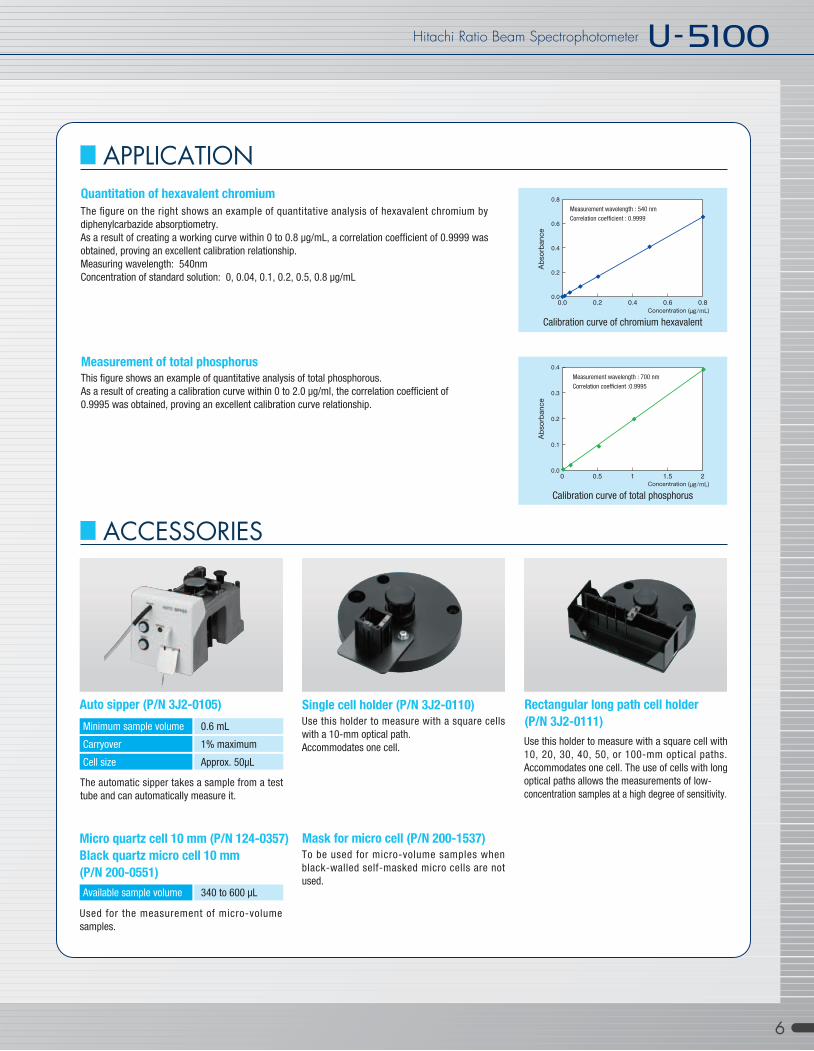
Quantitation of hexavalent chromium
The figure on the right shows an example of quantitative analysis of hexavalent chromium by diphenylcarbazide absorptiometry. As a result of creating a working curve within 0 to 0.8 μg/mL, a correlation coefficient of 0.9999 was obtained, proving an excellent calibration relationship. Measuring wavelength: 540nm Concentration of standard solution: 0, 0.04, 0.1, 0.2, 0.5, 0.8 μg/mL
Measurement of total phosphorus
This figure shows an example of quantitative analysis of total phosphorous.As a result of creating a calibration curve within 0 to 2.0 μg/ml, the correlation coefficient of 0.9995 was obtained, proving an excellent calibration curve relationship.Automatic
measurement in the specimen
chamber
ACCESSORIES
APPLICATION
Auto sipper (P/N 3J2-0105)
Micro quartz cell 10 mm (P/N 124-0357)
Black quartz micro cell 10 mm
(P/N 200-0551)
Rectangular long path cell holder
(P/N 3J2-0111)Minimum sample volume
Carryover
Cell size
0.6 mL
1% maximum
Approx. 50μL
Available sample volume 340 to 600 μL
0.8
0.6
0.4
0.2
0.00.0 0.2 0.4 0.6 0.8
Measurement wavelength : 540 nmCorrelation coefficient : 0.9999
0.4
0.3
0.2
0.1
0.00 0.5 1 1.5 2
Measurement wavelength : 700 nmCorrelation coefficient :0.9995
Single cell holder (P/N 3J2-0110)
Use this holder to measure with a square cells with a 10-mm optical path. Accommodates one cell.
Mask for micro cell (P/N 200-1537)
To be used for micro-volume samples when black-walled self-masked micro cells are not used.
The automatic sipper takes a sample from a test tube and can automatically measure it.
Used for the measurement of micro-volume samples.
Use this holder to measure with a square cell with 10, 20, 30, 40, 50, or 100-mm optical paths. Accommodates one cell. The use of cells with long optical paths allows the measurements of low-concentration samples at a high degree of sensitivity.
Calibration curve of chromium hexavalent
Calibration curve of total phosphorus
Ab
so
rban
ce
Ab
so
rban
ce
Concentration (µg/mL)
Concentration (µg/mL)
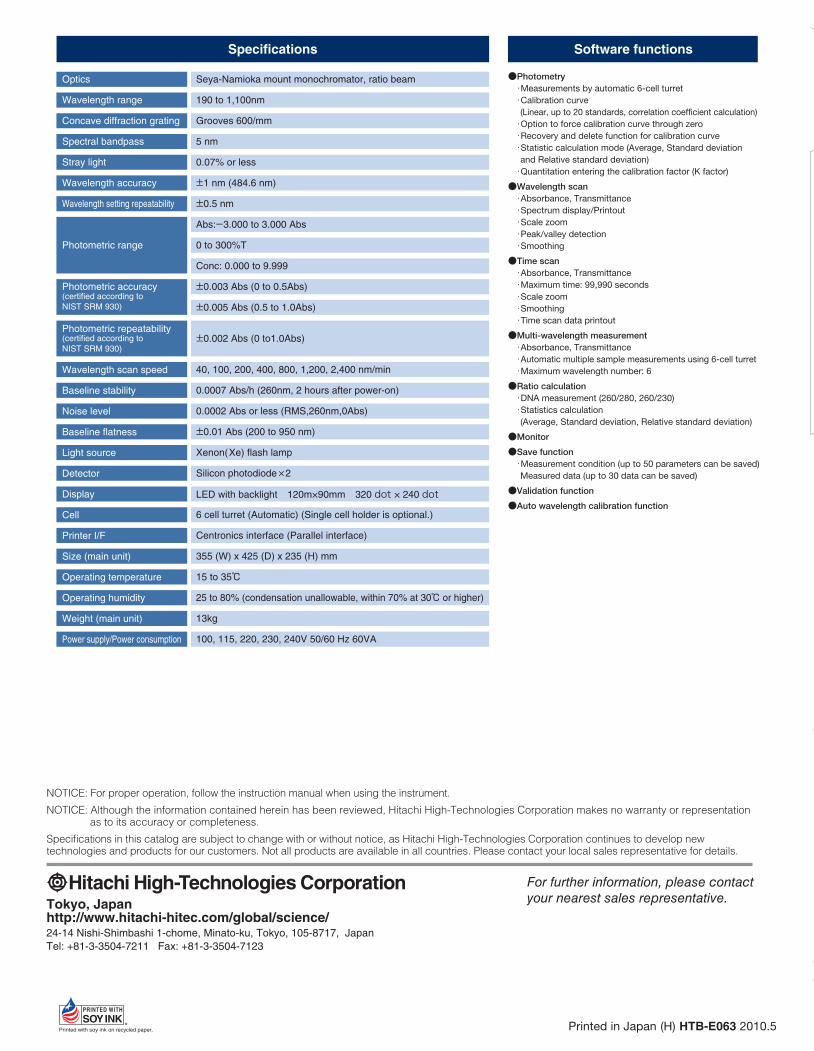
●Photometry ・Measurements by automatic 6-cell turret
・Calibration curve
(Linear, up to 20 standards, correlation coefficient calculation)
・Option to force calibration curve through zero
・Recovery and delete function for calibration curve
・Statistic calculation mode (Average, Standard deviation
and Relative standard deviation)
・Quantitation entering the calibration factor (K factor)
●Wavelength scan ・Absorbance, Transmittance
・Spectrum display/Printout
・Scale zoom
・Peak/valley detection
・Smoothing
●Time scan ・Absorbance, Transmittance
・Maximum time: 99,990 seconds
・Scale zoom
・Smoothing
・Time scan data printout
●Multi-wavelength measurement ・Absorbance, Transmittance
・Automatic multiple sample measurements using 6-cell turret
・Maximum wavelength number: 6
●Ratio calculation ・DNA measurement (260/280, 260/230)
・Statistics calculation
(Average, Standard deviation, Relative standard deviation)
●Monitor
●Save function ・Measurement condition (up to 50 parameters can be saved)
Measured data (up to 30 data can be saved)
●Validation function
●Auto wavelength calibration function
Specifications Software functions
Optics
Wavelength range
Concave diffraction grating
Spectral bandpass
Stray light
Wavelength accuracy
Wavelength setting repeatability
Photometric range
Photometric accuracy(certified according to NIST SRM 930)
Photometric repeatability(certified according to NIST SRM 930)
Wavelength scan speed
Baseline stability
Noise level
Baseline flatness
Light source
Detector
Display
Cell
Printer I/F
Size (main unit)
Operating temperature
Operating humidity
Weight (main unit)
Power supply/Power consumption
Seya-Namioka mount monochromator, ratio beam
190 to 1,100nm
Grooves 600/mm
5 nm
0.07% or less
±1 nm (484.6 nm)
±0.5 nm
Abs:-3.000 to 3.000 Abs
0 to 300%T
Conc: 0.000 to 9.999
±0.003 Abs (0 to 0.5Abs)
±0.005 Abs (0.5 to 1.0Abs)
±0.002 Abs (0 to1.0Abs)
40, 100, 200, 400, 800, 1,200, 2,400 nm/min
0.0007 Abs/h (260nm, 2 hours after power-on)
0.0002 Abs or less (RMS,260nm,0Abs)
±0.01 Abs (200 to 950 nm)
Xenon(Xe) flash lamp
Silicon photodiode×2
LED with backlight 120m×90mm 320 dot × 240 dot
6 cell turret (Automatic) (Single cell holder is optional.)
Centronics interface (Parallel interface)
355 (W) x 425 (D) x 235 (H) mm
15 to 35℃
25 to 80% (condensation unallowable, within 70% at 30℃ or higher)
13kg
100, 115, 220, 230, 240V 50/60 Hz 60VA
NOTICE: For proper operation, follow the instruction manual when using the instrument.
NOTICE: Although the information contained herein has been reviewed, Hitachi High-Technologies Corporation makes no warranty or representation as to its accuracy or completeness.
Specifications in this catalog are subject to change with or without notice, as Hitachi High-Technologies Corporation continues to develop new technologies and products for our customers. Not all products are available in all countries. Please contact your local sales representative for details.
Tokyo, Japanhttp://www.hitachi-hitec.com/global/science/24-14 Nishi-Shimbashi 1-chome, Minato-ku, Tokyo, 105-8717, JapanTel: +81-3-3504-7211 Fax: +81-3-3504-7123
For further information, please contact your nearest sales representative.
Printed in Japan (H) HTB-E063 2010.5