history - cbssports.comgraphics.ocsn.com/photos/schools/usc/sport/m-footbl/02...1964 craig fertig,...
TRANSCRIPT

2002 FOOTBALL MEDIA GUIDE — PAGE 135
HISTORY
USC’S FIRST FOOTBALL TEAM: 1888

PAGE 136 — UNIVERSITY OF SOUTHERN CALIFORNIA
USC FOOTBALL HISTORY
Head Football CoachesW L T PCT.
Henry H. Goddard andFrank H. Suffel, 1888 2 0 0 1.000
Lewis R. Freeman, 1897 (Stanford) 5 1 0 .833Clair S. Tappaan, 1901 (Syracuse) 0 1 1 .000John Walker, 1903 4 2 0 .667Harvey R. Holmes, 1904-07 (Wisconsin) 19 5 3 .759William I. Traeger, 1908 (Stanford) 3 1 1 .700Dean B. Cromwell, 1909-10,
1916-18 (Occidental) 21 8 6 .686Ralph Glaze, 1914-15 (Dartmouth) 7 7 0 .500Elmer C. (“Gloomy Gus”) Henderson,
1919-24 (Oberlin) 45 7 0 .865Howard H. Jones, 1925-40 (Yale) 121 36 13 .750Justin M. (Sam) Barry, 1941 (Wisconsin) 2 6 1 .278Newell J. Cravath, 1942-50 (USC) 54 28 8 .644Jesse T. (Jess) Hill, 1951-56 (USC) 45 17 1 .722Don R. Clark, 1957-59 (USC) 13 16 1 .450John McKay, 1960-75 (Oregon) 127 40 8 .749John Robinson, 1976-82, 1993-97
(Oregon) 104 35 4 .741Ted Tollner, 1983-86 (Cal Poly,
San Luis Obispo) 26 20 1 .564Larry Smith, 1987-92 (Bowling Green) 44 25 3 .632Paul Hackett, 1998-2000 (UC Davis) 19 18 0 .514Pete Carroll, 2001- (Pacific) 6 6 0 .500
Annual Won-Loss RecordYEAR TEAM CAPTAIN G W L T FIN. PTS. OPP.1888 Will Whitcomb 2 2 0 0 -- 20 01889 No Captain 2 2 0 0 -- 66 01890 No Varsity -- -- -- -- -- -- --1891 Frank Lapham 3 1 2 0 -- 48 261892 No Varsity -- -- -- -- -- -- --1893 No Captain 4 3 1 0 -- 56 501894 John A. Gray 1 1 0 0 -- 12 01895 Lee Bradley 2 0 1 1 -- 4 141896 Foster Wright 3 0 3 0 -- 0 741897 Harry Martin 6 5 1 0 -- 100 181898 Foster Wright 7 5 1 1 -- 97 281899 Logan Wheatley 6 2 3 1 -- 22 331900 Harry Woodard 3 1 1 1 -- 5 111901 Logan Wheatley 1 0 1 0 -- 0 61902 Dan Caley 5 2 3 0 -- 29 441903 Dan Caley 6 4 2 0 -- 58 271904 Jay Bickford 7 6 1 0 -- 199 271905 Carl Elliott 10 6 3 1 -- 211 451906 Oliver Best 4 2 0 2 -- 36 01907 Charley Haigler 6 5 1 0 -- 182 201908 Stan Burek 5 3 1 1 -- 63 181909 Hal Paulin 6 3 1 2 -- 133 131910 Jack Malcolm 8 7 0 1 -- 189 241911 Rugby -- -- -- -- -- -- --1912 Rugby -- -- -- -- -- -- --1913 Rugby -- -- -- -- -- -- --1914 Tommy Davis 7 4 3 0 -- 116 881915 Len Livernash 7 3 4 0 -- 132 1191916 Herb Jones 8 5 3 0 -- 129 801917 Frank Malette 7 4 2 1 -- 127 471918 Harold Galloway,
Keith Hunter 6 2 2 2 -- 61 611919 John Fox 5 4 1 0 -- 87 211920 Roy Evans 6 6 0 0 -- 171 211921 Charley Dean 11 10 1 0 -- 362 521922 Leo Calland 11 10 1 0 4 236 311923 Chet Dolley 8 6 2 0 3T 173 621924 John Hawkins 11 9 2 0 4T 269 441925 Hobbs Adams 13 11 2 0 3T 456 551926 Jeff Cravath 10 8 2 0 2 317 521927 Morley Drury 10 8 1 1 1T 287 641928 Jesse Hibbs 10 9 0 1 1 267 591929 Nate Barragar 12 10 2 0 1 492 691930 Marshall Duffield 10 8 2 0 2 382 661931 Stan Williamson 11 10 1 0 1 363 521932 Tay Brown 10 10 0 0 1 201 131933 Ford Palmer 12 10 1 1 3 257 301934 Julie Bescos 11 4 6 1 7 120 1101935 Art Dittberner,
Cliff Propst 12 5 7 0 8 155 1241936 Gil Kuhn 9 4 2 3 3T 129 651937 Chuck Williams 10 4 4 2 7 136 981938 Don McNeil 11 9 2 0 1T 172 651939 Joe Shell 10 8 0 2 1 181 331940 Ed Dempsey 9 3 4 2 7 88 981941 Bob de Lauer 9 2 6 1 8 64 1341942 Don Willer 11 5 5 1 4 184 1281943 Ralph Heywood 10 8 2 0 1 155 581944 Jim Hardy 10 8 0 2 1 240 731945 Jim Callanan 11 7 4 0 1 205 1501946 Doug Essick 10 6 4 0 3 158 1061947 Don Clark 10 7 2 1 1 193 1141948 Bob Bastian 10 6 3 1 3 142 871949 Jim Bird 9 5 3 1 3T 214 1701950 Paul McMurtry,
Volney Peters 9 2 5 2 7 114 182
JOHNMcKAY
HOWARDJONES

2002 FOOTBALL MEDIA GUIDE — PAGE 137
YEAR TEAM CAPTAIN G W L T FIN. PTS. OPP.1951 Pat Cannamela,
Dean Schneider 10 7 3 0 4 224 1681952 Bob Van Doren,
Lou Welsh 11 10 1 0 1 254 471953 George Bozanic,
Tom Nickoloff 10 6 3 1 3 199 1611954 Ed Fouch,
Lindon Crow 12 8 4 0 2 258 1591955 George Galli,
Marv Goux 10 6 4 0 6 265 1581956 Jon Arnett,
Ellsworth Kissinger 10 8 2 0 2T 218 1261957 Jim Conroy,
Mike Henry 10 1 9 0 7T 86 2041958 Ken Antle,
Monte Clark 10 4 5 1 3 151 1201959 Ron Mix,
Willie Wood 10 8 2 0 1T 195 901960 Mike McKeever,
George Van Vliet 10 4 6 0 2 95 1521961 Britt Williams 10 4 5 1 2T 150 1671962 Marv Marinovich,
Ben Wilson 11 11 0 0 1 261 921963 Pete Beathard,
Willie Brown 10 7 3 0 2 207 1141964 Craig Fertig,
Bill Fisk 10 7 3 0 1T 207 1301965 Chuck Arrobio,
Mike Garrett 10 7 2 1 2 262 921966 Nate Shaw,
Rod Sherman 11 7 4 0 1 199 1281967 Tim Rossovich,
Adrian Young 11 10 1 0 1 258 871968 O. J. Simpson,
Steve Sogge 11 9 1 1 1 259 1681969 Jim Gunn,
Bob Jensen 11 10 0 1 1 261 1281970 Charlie Weaver,
Bob Chandler 11 6 4 1 6T 343 2331971 John Vella,
Willie Hall 11 6 4 1 2 229 1641972 Sam Cunningham,
John Grant 12 12 0 0 1 467 1341973 Lynn Swann,
Artimus Parker 12 9 2 1 1 322 2021974 Pat Haden,
Richard Wood 12 10 1 1 1 363 1421975 Kevin Bruce,
Danny Reece 12 8 4 0 5 247 1401976 Ricky Bell,
Vince Evans,Eric Williams 12 11 1 0 1 386 139
1977 Rob Hertel,Clay Matthews 12 8 4 0 2T 357 212
1978 Lynn Cain,Rich Dimler 13 12 1 0 1 318 153
1979 Dennis Johnson,Charles White 12 11 0 1 1 389 171
1980 Ronnie Lott,Keith Van Horne 11 8 2 1 3 265 134
1981 Marcus Allen,Chip Banks 12 9 3 0 2T 294 170
1982 George Achica,Joey Browner,Bruce Matthews 11 8 3 0 3T 302 143
1983 Tony Brewer,Jeff Brown,Keith Browner,Fred Cornwell,Tony Slaton 11 4 6 1 4 210 238
1984 Neil Hope,Ken Ruettgers 12 9 3 0 1 220 173
1985 Matt Koart,Hank Norman 12 6 6 0 4T 223 187
ANNUAL WON-LOSS RECORD, ALL-TIME PAC-10 RECORDS, USC VS. PAC-10
YEAR TEAM CAPTAIN G W L T FIN. PTS. OPP.1986 Jeff Bregel,
Tim McDonald 12 7 5 0 4T 264 2391987 Dave Cadigan,
Greg Coauette 12 8 4 0 1T 321 2291988 Rodney Peete 12 10 2 0 1 370 1841989 Leroy Holt,
Tim Ryan 12 9 2 1 1 336 1321990 Don Gibson 13 8 4 1 2 348 2741991 Matt Gee 11 3 8 0 8 229 2761992 Stephon Pace 12 6 5 1 3T 264 2491993 Craig Gibson,
Willie McGinest,Deon Strother 13 8 5 0 1T 348 252
1994 Tony Boselli,Jeff Kopp,Brian Williams 12 8 3 1 2T 356 243
1995 Terry Barnum,Errick Herrin 12 9 2 1 1T 355 212
1996 John Allred,Sammy Knight 12 6 6 0 5T 325 267
1997 Jonathan Himebauch,Brian Kelly 11 6 5 0 5T 233 233
1998 Adam Abrams,Chris Claiborne,Billy Miller,Chad Morton 13 8 5 0 3T 346 241
1999 David Gibson,Chad Morton,Ifeanyi Ohalete 12 6 6 0 6T 348 278
2000 Ennis Davis,Eric Denmon,Zeke Moreno,Petros Papadakis 12 5 7 0 8T 309 337
2001 Charlie Landrigan,Troy Polamalu,Antuan Simmons 12 6 6 0 5 298 207Total Record 1032 684 294 54
All-Time NCAA Won-Loss Recordsof Pac-10 Teams
W L T PCT.USC 684 294 54 .689Washington 625 341 50 .640Arizona State 495 297 24 .621UCLA 491 318 37 .602Arizona 513 351 33 .590Stanford 527 372 49 .582California 559 439 51 .557Oregon 502 432 46 .536Washington State 447 444 45 .502Oregon State 431 493 50 .468
USC vs. the Pac-10USC OPP.
OPPONENT WINS WINS TIES PCT.
Washington State 50 7 4 .852Oregon State 54 8 4 .848Arizona 20 6 0 .769Stanford 53 24 3 .681Oregon 33 15 2 .680California 55 29 5 .646Washington 42 26 4 .611UCLA 37 27 7 .570Arizona State 9 9 0 .500Totals 353 151 29 .689
PAGE 138 — UNIVERSITY OF SOUTHERN CALIFORNIA
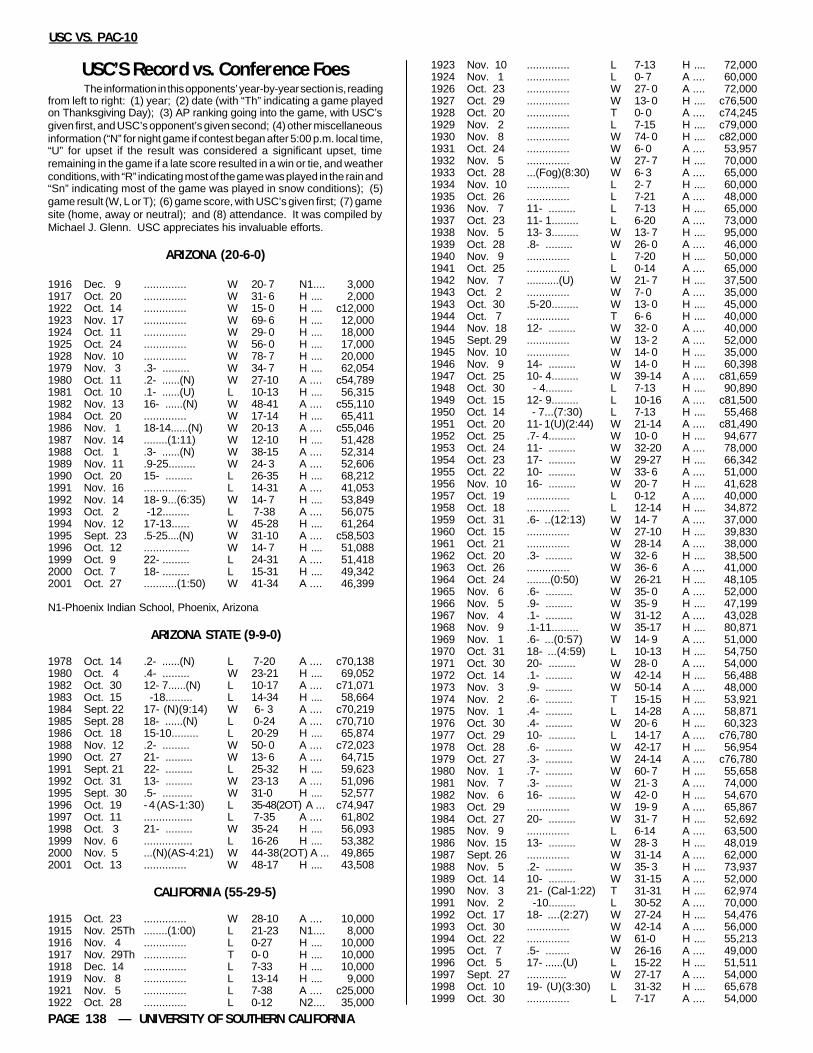
USC’S Record vs. Conference FoesThe information in this opponents’ year-by-year section is, reading
from left to right: (1) year; (2) date (with “Th” indicating a game playedon Thanksgiving Day); (3) AP ranking going into the game, with USC’sgiven first, and USC’s opponent’s given second; (4) other miscellaneousinformation (“N” for night game if contest began after 5:00 p.m. local time,“U” for upset if the result was considered a significant upset, timeremaining in the game if a late score resulted in a win or tie, and weatherconditions, with “R” indicating most of the game was played in the rain and“Sn” indicating most of the game was played in snow conditions); (5)game result (W, L or T); (6) game score, with USC’s given first; (7) gamesite (home, away or neutral); and (8) attendance. It was compiled byMichael J. Glenn. USC appreciates his invaluable efforts.
ARIZONA (20-6-0)
1916 Dec. 9 .............. W 20- 7 N1.... 3,0001917 Oct. 20 .............. W 31- 6 H .... 2,0001922 Oct. 14 .............. W 15- 0 H .... c12,0001923 Nov. 17 .............. W 69- 6 H .... 12,0001924 Oct. 11 .............. W 29- 0 H .... 18,0001925 Oct. 24 .............. W 56- 0 H .... 17,0001928 Nov. 10 .............. W 78- 7 H .... 20,0001979 Nov. 3 .3- ......... W 34- 7 H .... 62,0541980 Oct. 11 .2- ......(N) W 27-10 A .... c54,7891981 Oct. 10 .1- ......(U) L 10-13 H .... 56,3151982 Nov. 13 16- ......(N) W 48-41 A .... c55,1101984 Oct. 20 .............. W 17-14 H .... 65,4111986 Nov. 1 18-14......(N) W 20-13 A .... c55,0461987 Nov. 14 ........(1:11) W 12-10 H .... 51,4281988 Oct. 1 .3- ......(N) W 38-15 A .... 52,3141989 Nov. 11 .9-25......... W 24- 3 A .... 52,6061990 Oct. 20 15- ......... L 26-35 H .... 68,2121991 Nov. 16 .............. L 14-31 A .... 41,0531992 Nov. 14 18- 9...(6:35) W 14- 7 H .... 53,8491993 Oct. 2 -12......... L 7-38 A .... 56,0751994 Nov. 12 17-13...... W 45-28 H .... 61,2641995 Sept. 23 .5-25....(N) W 31-10 A .... c58,5031996 Oct. 12 ............... W 14- 7 H .... 51,0881999 Oct. 9 22- ......... L 24-31 A .... 51,4182000 Oct. 7 18- ......... L 15-31 H .... 49,3422001 Oct. 27 ...........(1:50) W 41-34 A .... 46,399
N1-Phoenix Indian School, Phoenix, Arizona
ARIZONA STATE (9-9-0)
1978 Oct. 14 .2- ......(N) L 7-20 A .... c70,1381980 Oct. 4 .4- ......... W 23-21 H .... 69,0521982 Oct. 30 12- 7......(N) L 10-17 A .... c71,0711983 Oct. 15 -18......... L 14-34 H .... 58,6641984 Sept. 22 17- (N)(9:14) W 6- 3 A .... c70,2191985 Sept. 28 18- ......(N) L 0-24 A .... c70,7101986 Oct. 18 15-10......... L 20-29 H .... 65,8741988 Nov. 12 .2- ......... W 50- 0 A .... c72,0231990 Oct. 27 21- ......... W 13- 6 A .... 64,7151991 Sept. 21 22- ......... L 25-32 H .... 59,6231992 Oct. 31 13- ......... W 23-13 A .... 51,0961995 Sept. 30 .5- .......... W 31-0 H .... 52,5771996 Oct. 19 - 4 (AS-1:30) L 35-48(2OT) A ... c74,9471997 Oct. 11 ................ L 7-35 A .... 61,8021998 Oct. 3 21- ......... W 35-24 H .... 56,0931999 Nov. 6 ................ L 16-26 H .... 53,3822000 Nov. 5 ...(N)(AS-4:21) W 44-38(2OT) A ... 49,8652001 Oct. 13 .............. W 48-17 H .... 43,508
CALIFORNIA (55-29-5)
1915 Oct. 23 .............. W 28-10 A .... 10,0001915 Nov. 25Th ........(1:00) L 21-23 N1.... 8,0001916 Nov. 4 .............. L 0-27 H .... 10,0001917 Nov. 29Th .............. T 0- 0 H .... 10,0001918 Dec. 14 .............. L 7-33 H .... 10,0001919 Nov. 8 .............. L 13-14 H .... 9,0001921 Nov. 5 .............. L 7-38 A .... c25,0001922 Oct. 28 .............. L 0-12 N2.... 35,000
1923 Nov. 10 .............. L 7-13 H .... 72,0001924 Nov. 1 .............. L 0- 7 A .... 60,0001926 Oct. 23 .............. W 27- 0 A .... 72,0001927 Oct. 29 .............. W 13- 0 H .... c76,5001928 Oct. 20 .............. T 0- 0 A .... c74,2451929 Nov. 2 .............. L 7-15 H .... c79,0001930 Nov. 8 .............. W 74- 0 H .... c82,0001931 Oct. 24 .............. W 6- 0 A .... 53,9571932 Nov. 5 .............. W 27- 7 H .... 70,0001933 Oct. 28 ...(Fog)(8:30) W 6- 3 A .... 65,0001934 Nov. 10 .............. L 2- 7 H .... 60,0001935 Oct. 26 .............. L 7-21 A .... 48,0001936 Nov. 7 11- ......... L 7-13 H .... 65,0001937 Oct. 23 11- 1......... L 6-20 A .... 73,0001938 Nov. 5 13- 3......... W 13- 7 H .... 95,0001939 Oct. 28 .8- ......... W 26- 0 A .... 46,0001940 Nov. 9 .............. L 7-20 H .... 50,0001941 Oct. 25 .............. L 0-14 A .... 65,0001942 Nov. 7 ...........(U) W 21- 7 H .... 37,5001943 Oct. 2 .............. W 7- 0 A .... 35,0001943 Oct. 30 .5-20......... W 13- 0 H .... 45,0001944 Oct. 7 .............. T 6- 6 H .... 40,0001944 Nov. 18 12- ......... W 32- 0 A .... 40,0001945 Sept. 29 .............. W 13- 2 A .... 52,0001945 Nov. 10 .............. W 14- 0 H .... 35,0001946 Nov. 9 14- ......... W 14- 0 H .... 60,3981947 Oct. 25 10- 4......... W 39-14 A .... c81,6591948 Oct. 30 - 4......... L 7-13 H .... 90,8901949 Oct. 15 12- 9......... L 10-16 A .... c81,5001950 Oct. 14 - 7...(7:30) L 7-13 H .... 55,4681951 Oct. 20 11- 1(U)(2:44) W 21-14 A .... c81,4901952 Oct. 25 .7- 4......... W 10- 0 H .... 94,6771953 Oct. 24 11- ......... W 32-20 A .... 78,0001954 Oct. 23 17- ......... W 29-27 H .... 66,3421955 Oct. 22 10- ......... W 33- 6 A .... 51,0001956 Nov. 10 16- ......... W 20- 7 H .... 41,6281957 Oct. 19 .............. L 0-12 A .... 40,0001958 Oct. 18 .............. L 12-14 H .... 34,8721959 Oct. 31 .6- ..(12:13) W 14- 7 A .... 37,0001960 Oct. 15 .............. W 27-10 H .... 39,8301961 Oct. 21 .............. W 28-14 A .... 38,0001962 Oct. 20 .3- ......... W 32- 6 H .... 38,5001963 Oct. 26 .............. W 36- 6 A .... 41,0001964 Oct. 24 ........(0:50) W 26-21 H .... 48,1051965 Nov. 6 .6- ......... W 35- 0 A .... 52,0001966 Nov. 5 .9- ......... W 35- 9 H .... 47,1991967 Nov. 4 .1- ......... W 31-12 A .... 43,0281968 Nov. 9 .1-11......... W 35-17 H .... 80,8711969 Nov. 1 .6- ...(0:57) W 14- 9 A .... 51,0001970 Oct. 31 18- ...(4:59) L 10-13 H .... 54,7501971 Oct. 30 20- ......... W 28- 0 A .... 54,0001972 Oct. 14 .1- ......... W 42-14 H .... 56,4881973 Nov. 3 .9- ......... W 50-14 A .... 48,0001974 Nov. 2 .6- ......... T 15-15 H .... 53,9211975 Nov. 1 .4- ......... L 14-28 A .... 58,8711976 Oct. 30 .4- ......... W 20- 6 H .... 60,3231977 Oct. 29 10- ......... L 14-17 A .... c76,7801978 Oct. 28 .6- ......... W 42-17 H .... 56,9541979 Oct. 27 .3- ......... W 24-14 A .... c76,7801980 Nov. 1 .7- ......... W 60- 7 H .... 55,6581981 Nov. 7 .3- ......... W 21- 3 A .... 74,0001982 Nov. 6 16- ......... W 42- 0 H .... 54,6701983 Oct. 29 .............. W 19- 9 A .... 65,8671984 Oct. 27 20- ......... W 31- 7 H .... 52,6921985 Nov. 9 .............. L 6-14 A .... 63,5001986 Nov. 15 13- ......... W 28- 3 H .... 48,0191987 Sept. 26 .............. W 31-14 A .... 62,0001988 Nov. 5 .2- ......... W 35- 3 H .... 73,9371989 Oct. 14 10- ......... W 31-15 A .... 52,0001990 Nov. 3 21- (Cal-1:22) T 31-31 H .... 62,9741991 Nov. 2 -10......... L 30-52 A .... 70,0001992 Oct. 17 18- ....(2:27) W 27-24 H .... 54,4761993 Oct. 30 .............. W 42-14 A .... 56,0001994 Oct. 22 .............. W 61-0 H .... 55,2131995 Oct. 7 .5- ........ W 26-16 A .... 49,0001996 Oct. 5 17- ......(U) L 15-22 H .... 51,5111997 Sept. 27 ............. W 27-17 A .... 54,0001998 Oct. 10 19- (U)(3:30) L 31-32 H .... 65,6781999 Oct. 30 .............. L 7-17 A .... 54,000
USC VS. PAC-10
2002 FOOTBALL MEDIA GUIDE — PAGE 139
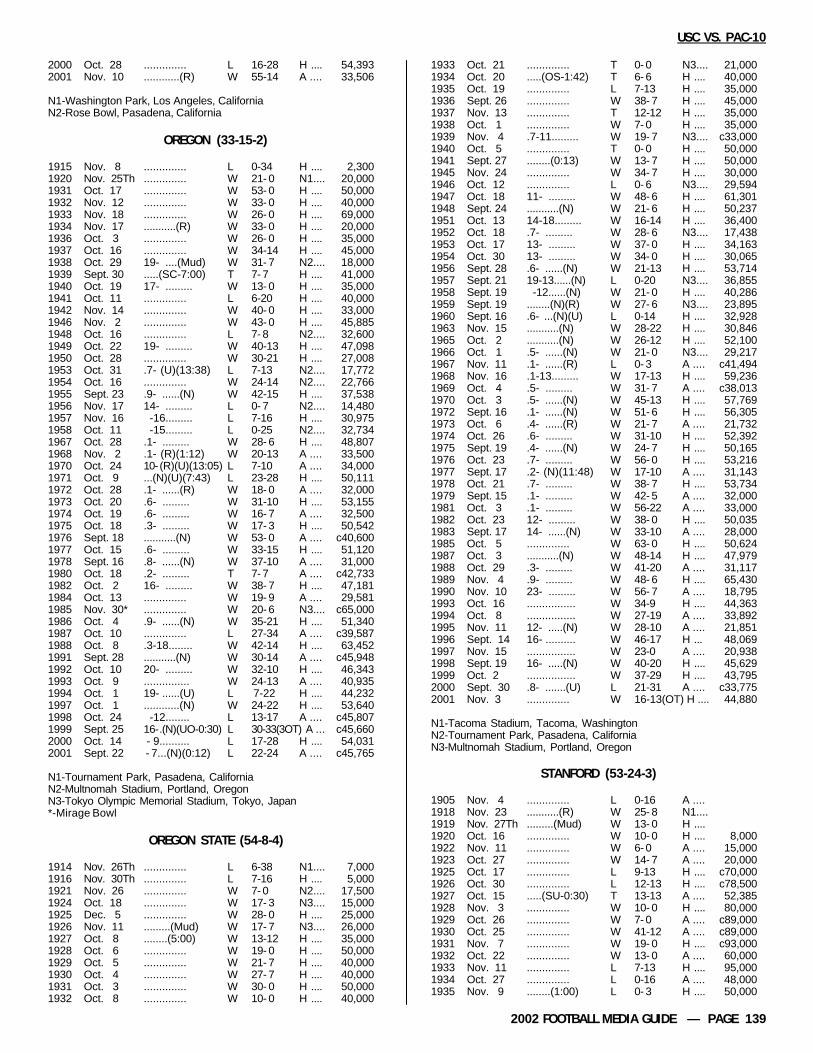
2000 Oct. 28 .............. L 16-28 H .... 54,3932001 Nov. 10 ............(R) W 55-14 A .... 33,506
N1-Washington Park, Los Angeles, CaliforniaN2-Rose Bowl, Pasadena, California
OREGON (33-15-2)
1915 Nov. 8 .............. L 0-34 H .... 2,3001920 Nov. 25Th .............. W 21- 0 N1.... 20,0001931 Oct. 17 .............. W 53- 0 H .... 50,0001932 Nov. 12 .............. W 33- 0 H .... 40,0001933 Nov. 18 .............. W 26- 0 H .... 69,0001934 Nov. 17 ...........(R) W 33- 0 H .... 20,0001936 Oct. 3 .............. W 26- 0 H .... 35,0001937 Oct. 16 .............. W 34-14 H .... 45,0001938 Oct. 29 19- ....(Mud) W 31- 7 N2.... 18,0001939 Sept. 30 .....(SC-7:00) T 7- 7 H .... 41,0001940 Oct. 19 17- ......... W 13- 0 H .... 35,0001941 Oct. 11 .............. L 6-20 H .... 40,0001942 Nov. 14 .............. W 40- 0 H .... 33,0001946 Nov. 2 .............. W 43- 0 H .... 45,8851948 Oct. 16 .............. L 7- 8 N2.... 32,6001949 Oct. 22 19- ......... W 40-13 H .... 47,0981950 Oct. 28 .............. W 30-21 H .... 27,0081953 Oct. 31 .7- (U)(13:38) L 7-13 N2.... 17,7721954 Oct. 16 .............. W 24-14 N2.... 22,7661955 Sept. 23 .9- ......(N) W 42-15 H .... 37,5381956 Nov. 17 14- ......... L 0- 7 N2.... 14,4801957 Nov. 16 -16......... L 7-16 H .... 30,9751958 Oct. 11 -15......... L 0-25 N2.... 32,7341967 Oct. 28 .1- ......... W 28- 6 H .... 48,8071968 Nov. 2 .1- (R)(1:12) W 20-13 A .... 33,5001970 Oct. 24 10- (R)(U)(13:05) L 7-10 A .... 34,0001971 Oct. 9 ...(N)(U)(7:43) L 23-28 H .... 50,1111972 Oct. 28 .1- ......(R) W 18- 0 A .... 32,0001973 Oct. 20 .6- ......... W 31-10 H .... 53,1551974 Oct. 19 .6- ......... W 16- 7 A .... 32,5001975 Oct. 18 .3- ......... W 17- 3 H .... 50,5421976 Sept. 18 ...........(N) W 53- 0 A .... c40,6001977 Oct. 15 .6- ......... W 33-15 H .... 51,1201978 Sept. 16 .8- ......(N) W 37-10 A .... 31,0001980 Oct. 18 .2- ......... T 7- 7 A .... c42,7331982 Oct. 2 16- ......... W 38- 7 H .... 47,1811984 Oct. 13 .............. W 19- 9 A .... 29,5811985 Nov. 30* .............. W 20- 6 N3.... c65,0001986 Oct. 4 .9- ......(N) W 35-21 H .... 51,3401987 Oct. 10 .............. L 27-34 A .... c39,5871988 Oct. 8 .3-18........ W 42-14 H .... 63,4521991 Sept. 28 ...........(N) W 30-14 A .... c45,9481992 Oct. 10 20- ......... W 32-10 H .... 46,3431993 Oct. 9 ............... W 24-13 A .... 40,9351994 Oct. 1 19- ......(U) L 7-22 H .... 44,2321997 Oct. 1 ............(N) W 24-22 H .... 53,6401998 Oct. 24 -12........ L 13-17 A .... c45,8071999 Sept. 25 16- .(N)(UO-0:30) L 30-33(3OT) A ... c45,6602000 Oct. 14 - 9.......... L 17-28 H .... 54,0312001 Sept. 22 - 7...(N)(0:12) L 22-24 A .... c45,765
N1-Tournament Park, Pasadena, CaliforniaN2-Multnomah Stadium, Portland, OregonN3-Tokyo Olympic Memorial Stadium, Tokyo, Japan*-Mirage Bowl
OREGON STATE (54-8-4)
1914 Nov. 26Th .............. L 6-38 N1.... 7,0001916 Nov. 30Th .............. L 7-16 H .... 5,0001921 Nov. 26 .............. W 7- 0 N2.... 17,5001924 Oct. 18 .............. W 17- 3 N3.... 15,0001925 Dec. 5 .............. W 28- 0 H .... 25,0001926 Nov. 11 .........(Mud) W 17- 7 N3.... 26,0001927 Oct. 8 ........(5:00) W 13-12 H .... 35,0001928 Oct. 6 .............. W 19- 0 H .... 50,0001929 Oct. 5 .............. W 21- 7 H .... 40,0001930 Oct. 4 .............. W 27- 7 H .... 40,0001931 Oct. 3 .............. W 30- 0 H .... 50,0001932 Oct. 8 .............. W 10- 0 H .... 40,000
1933 Oct. 21 .............. T 0- 0 N3.... 21,0001934 Oct. 20 .....(OS-1:42) T 6- 6 H .... 40,0001935 Oct. 19 .............. L 7-13 H .... 35,0001936 Sept. 26 .............. W 38- 7 H .... 45,0001937 Nov. 13 .............. T 12-12 H .... 35,0001938 Oct. 1 .............. W 7- 0 H .... 35,0001939 Nov. 4 .7-11......... W 19- 7 N3.... c33,0001940 Oct. 5 .............. T 0- 0 H .... 50,0001941 Sept. 27 ........(0:13) W 13- 7 H .... 50,0001945 Nov. 24 .............. W 34- 7 H .... 30,0001946 Oct. 12 .............. L 0- 6 N3.... 29,5941947 Oct. 18 11- ......... W 48- 6 H .... 61,3011948 Sept. 24 ...........(N) W 21- 6 H .... 50,2371951 Oct. 13 14-18......... W 16-14 H .... 36,4001952 Oct. 18 .7- ......... W 28- 6 N3.... 17,4381953 Oct. 17 13- ......... W 37- 0 H .... 34,1631954 Oct. 30 13- ......... W 34- 0 H .... 30,0651956 Sept. 28 .6- ......(N) W 21-13 H .... 53,7141957 Sept. 21 19-13......(N) L 0-20 N3.... 36,8551958 Sept. 19 -12......(N) W 21- 0 H .... 40,2861959 Sept. 19 ........(N)(R) W 27- 6 N3.... 23,8951960 Sept. 16 .6- ...(N)(U) L 0-14 H .... 32,9281963 Nov. 15 ...........(N) W 28-22 H .... 30,8461965 Oct. 2 ...........(N) W 26-12 H .... 52,1001966 Oct. 1 .5- ......(N) W 21- 0 N3.... 29,2171967 Nov. 11 .1- ......(R) L 0- 3 A .... c41,4941968 Nov. 16 .1-13......... W 17-13 H .... 59,2361969 Oct. 4 .5- ......... W 31- 7 A .... c38,0131970 Oct. 3 .5- ......(N) W 45-13 H .... 57,7691972 Sept. 16 .1- ......(N) W 51- 6 H .... 56,3051973 Oct. 6 .4- ......(R) W 21- 7 A .... 21,7321974 Oct. 26 .6- ......... W 31-10 H .... 52,3921975 Sept. 19 .4- ......(N) W 24- 7 H .... 50,1651976 Oct. 23 .7- ......... W 56- 0 H .... 53,2161977 Sept. 17 .2- (N)(11:48) W 17-10 A .... 31,1431978 Oct. 21 .7- ......... W 38- 7 H .... 53,7341979 Sept. 15 .1- ......... W 42- 5 A .... 32,0001981 Oct. 3 .1- ......... W 56-22 A .... 33,0001982 Oct. 23 12- ......... W 38- 0 H .... 50,0351983 Sept. 17 14- ......(N) W 33-10 A .... 28,0001985 Oct. 5 .............. W 63- 0 H .... 50,6241987 Oct. 3 ...........(N) W 48-14 H .... 47,9791988 Oct. 29 .3- ......... W 41-20 A .... 31,1171989 Nov. 4 .9- ......... W 48- 6 H .... 65,4301990 Nov. 10 23- ......... W 56- 7 A .... 18,7951993 Oct. 16 ................ W 34-9 H .... 44,3631994 Oct. 8 ................ W 27-19 A .... 33,8921995 Nov. 11 12- .....(N) W 28-10 A .... 21,8511996 Sept. 14 16- .......... W 46-17 H ... 48,0691997 Nov. 15 ................ W 23-0 A .... 20,9381998 Sept. 19 16- .....(N) W 40-20 H .... 45,6291999 Oct. 2 ................ W 37-29 H .... 43,7952000 Sept. 30 .8- .......(U) L 21-31 A .... c33,7752001 Nov. 3 .............. W 16-13(OT) H .... 44,880
N1-Tacoma Stadium, Tacoma, WashingtonN2-Tournament Park, Pasadena, CaliforniaN3-Multnomah Stadium, Portland, Oregon
STANFORD (53-24-3)
1905 Nov. 4 .............. L 0-16 A ....1918 Nov. 23 ...........(R) W 25- 8 N1....1919 Nov. 27Th .........(Mud) W 13- 0 H ....1920 Oct. 16 .............. W 10- 0 H .... 8,0001922 Nov. 11 .............. W 6- 0 A .... 15,0001923 Oct. 27 .............. W 14- 7 A .... 20,0001925 Oct. 17 .............. L 9-13 H .... c70,0001926 Oct. 30 .............. L 12-13 H .... c78,5001927 Oct. 15 .....(SU-0:30) T 13-13 A .... 52,3851928 Nov. 3 .............. W 10- 0 H .... 80,0001929 Oct. 26 .............. W 7- 0 A .... c89,0001930 Oct. 25 .............. W 41-12 A .... c89,0001931 Nov. 7 .............. W 19- 0 H .... c93,0001932 Oct. 22 .............. W 13- 0 A .... 60,0001933 Nov. 11 .............. L 7-13 H .... 95,0001934 Oct. 27 .............. L 0-16 A .... 48,0001935 Nov. 9 ........(1:00) L 0- 3 H .... 50,000
USC VS. PAC-10

PAGE 140 — UNIVERSITY OF SOUTHERN CALIFORNIA
1936 Oct. 24 .6- ......... W 14- 7 A .... 35,0001937 Nov. 6 .............. L 6- 7 H .... 55,0001938 Oct. 22 .............. W 13- 2 A .... 35,0001939 Nov. 11 .4- ......... W 33- 0 H .... 50,0001940 Oct. 26 17- 9......... L 7-21 A .... 60,0001941 Nov. 8 - 9......... L 0-13 H .... 86,3051942 Oct. 24 .............. L 6-14 N2.... 25,0001946 Oct. 26 .............. W 28-20 A .... 50,0001947 Nov. 8 .5- ......... W 14- 0 H .... 59,7491948 Oct. 23 .............. W 7- 6 A .... 40,0001949 Nov. 5 12- ......... L 13-34 H .... 70,0411950 Nov. 4 .....(SU-2:20) T 7- 7 A .... 40,0001951 Nov. 10 .6- 7...(2:00) L 20-27 H .... 96,1301952 Nov. 8 .6- ......... W 54- 7 A .... 55,0001953 Nov. 7 17-11...(0:14) W 23-20 H .... 79,0151954 Nov. 6 10- ......... W 21- 7 A .... 28,0001955 Nov. 5 16- ......... L 20-28 H .... 63,2651956 Oct. 27 .6- ......... L 19-27 A .... 70,0001957 Nov. 9 .............. L 7-35 H .... 51,9231958 Nov. 1 .............. W 29- 6 A .... 52,0001959 Oct. 24 .5- ......... W 30-28 H .... 44,2091960 Oct. 29 .............. W 21-10 A .... 29,0001961 Nov. 11 .............. W 30-15 H .... 36,5981962 Nov. 10 .2- ......... W 39-14 A .... 41,0001963 Nov. 9 .............. W 25-11 H .... 57,0351964 Nov. 7 .............. W 15-10 A .... 55,0001965 Oct. 16 .6- ......... W 14- 0 H .... 61,6181966 Oct. 15 .5- ......... W 21- 7 A .... 61,5001967 Oct. 7 .1- ......(N) W 30- 0 H .... 62,5981968 Oct. 12 .2-18..(11:51) W 27-24 A .... c81,0001969 Oct. 11 .4-16(0:00)(N) W 26-24 H .... 82,8121970 Oct. 10 .4-12......... L 14-24 A .... c86,0001971 Oct. 16 -15...(N)(R) L 18-33 H .... 65,3751972 Oct. 7 .1-15......... W 30-21 A .... c84,0001973 Nov. 10 .8- ...(0:03) W 27-26 H .... 63,8061974 Nov. 9 11- ......... W 34-10 A .... c83,5001975 Nov. 8 .9- ...(0:00) L 10-13 H .... 68,2491976 Nov. 6 .4- ......... W 48-24 A .... 76,5001977 Nov. 5 16- ......... W 49- 0 H .... 65,1011978 Nov. 4 .6- ......... W 13- 7 A .... c84,0841979 Oct. 13 .1- (SU-4:30) T 21-21 H .... 76,0671980 Nov. 8 .4- ......... W 34- 9 A .... c84,8921981 Oct. 17 .7- ......... W 25-17 H .... 76,2911982 Oct. 16 14- ......... W 41-21 A .... 75,1851983 Nov. 5 .............. W 30- 7 H .... 50,8671984 Nov. 3 18- ......... W 20-11 A .... 74,4321985 Oct. 19 .............. W 30- 6 H .... 56,8371986 Oct. 25 -19......... W 10- 0 A .... 73,5001987 Nov. 7 .............. W 39-24 H .... 58,9221988 Sept. 10 .6- ...(1:19) W 24-20 A .... 59,0001989 Oct. 28 10- ......... W 19- 0 H .... 67,4111990 Oct. 13 16- ......... W 37-22 A .... 62,0001991 Oct. 19 ........(1:11) L 21-24 H .... 61,2651992 Nov. 7 11-21......... L 9-23 A .... 72,5711993 Nov. 6 ................. W 45-20 H .... 59,3761994 Oct. 15 ................. W 27-20 A .... 60,3451995 Nov. 4 14- ...(0:39) W 31-30 H .... 62,3681996 Nov. 9 ..............(N) L 20-24 A .... 41,9801997 Nov. 8 ................ W 45-21 H .... 58,9001998 Nov. 7 ................ W 34- 9 A .... 43,2501999 Oct. 23 ................ L 31-35 H .... 57,4942000 Oct. 21 ........(0:00) L 30-32 A .... 50,1252001 Sept. 29 .............. L 16-21 H .... 53,962
N1-Tournament Park, Pasadena, CaliforniaN2-Kezar Stadium, San Francisco, California
UCLA (37-27-7)
1929 Sept. 28 .............. W 76- 0 H .... 50,0001930 Sept. 27 .............. W 52- 0 A .... 40,0001936 Nov. 26Th .............. T 7- 7 H .... 90,0001937 Dec. 4 .............. W 19-13 A .... 75,0001938 Nov. 24Th 14- ......... W 42- 7 H .... 65,0001939 Dec. 9 .3- 9......... T 0- 0 A ... c103,3031940 Nov. 30 .............. W 28-12 H .... 70,0001941 Dec. 6 .............. T 7- 7 A .... 65,0001942 Dec. 12 -13......... L 7-14 H .... 90,000
1943 Sept. 25 .............. W 20- 0 A .... 50,0001943 Nov. 27 .............. W 26-13 H .... 35,0001944 Sept. 23 .(TD-UCLA 0:00) T 13-13 H .... 60,0001944 Nov. 25 .8- ......... W 40-13 A .... 77,9031945 Sept. 21 ...........(N) W 13- 6 A .... 81,0001945 Dec. 1 16- ......... W 26-15 H .... c103,0001946 Nov. 23 10- 4......(R) L 6-13 A .... 93,7141947 Nov. 22 .4-18......... W 6- 0 H .... c102,0501948 Nov. 20 .............. W 20-13 A .... 76,5771949 Nov. 19 .............. W 21- 7 H .... 75,0261950 Nov. 25 .............. L 0-39 A .... 51,9061951 Nov. 24 11-18......... L 7-21 H .... 71,7381952 Nov. 22 .4- 3......... W 14-12 A .... 96,8691953 Nov. 21 .9- 5......... L 0-13 H .... 85,3661954 Nov. 20 .7- 2......... L 0-34 A .... c102,5481955 Nov. 19 - 5......... L 7-17 H .... 95,8781956 Nov. 24 .............. W 10- 7 A .... 63,7091957 Nov. 23 .............. L 9-20 H .... 64,8181958 Nov. 22 ..(SC-TD 6:50) T 15-15 A .... 58,5071959 Nov. 21 .4- (U)(8:06) L 3-10 H .... 85,9171960 Nov. 19 -11......(U) W 17- 6 A .... 66,8651961 Nov. 25 ...........(R) L 7-10 H .... 57,5801962 Nov. 24 .1- ......... W 14- 3 A .... 86,7401963 Nov. 30 .............. W 26- 6 H .... 82,4601964 Nov. 21 .............. W 34-13 A .... 62,1081965 Nov. 20 .6- 7...(2:39) L 16-20 H .... c94,0851966 Nov. 19 .7- 8...(6:20) L 7-14 A .... 81,9801967 Nov. 18 .4- 1..(10:38) W 21-20 H .... c90,7721968 Nov. 23 .1- ......... W 28-16 A .... 75,0661969 Nov. 22 .5- 6...(1:32) W 14-12 H .... c90,8141970 Nov. 21 ...........(N) L 20-45 A .... 78,7731971 Nov. 20 15- ......... T 7- 7 H .... 68,4261972 Nov. 18 .1-14......... W 24- 7 A .... 82,9291973 Nov. 24 .9- 8......... W 23-13 H .... 88,0371974 Nov. 23 .8- ......... W 34- 9 A .... 82,4671975 Nov. 28 -14......(N) L 22-25 H .... 80,9271976 Nov. 20 .3- 2......... W 24-14 A .... c90,5191977 Nov. 25 -17(N)(0:02) W 29-27 H .... 86,1681978 Nov. 18 .5-14......... W 17-10 A .... c90,3871979 Nov. 24 .4- ......... W 49-14 H .... c88,2141980 Nov. 22 12-18...(2:07) L 17-20 A .... 83,4911981 Nov. 21 10-15...(2:14) W 22-21 H .... c89,4321982 Nov. 20 15-11......... L 19-20 A .... c95,7631983 Nov. 19 .............. L 17-27 H .... 83,7631984 Nov. 17 .7- ......... L 10-29 A .... 90,0961985 Nov. 23 - 8...(1:13) W 17-13 H .... c90,0641986 Nov. 22 10-18......... L 25-45 A .... c98,3701987 Nov. 21 - 5...(7:59) W 17-13 H .... c92,5161988 Nov. 19 .2- 6......... W 31-22 A .... c100,7411989 Nov. 18 .8- (UC-13:43) T 10-10 H .... c86,6721990 Nov. 17 19- ...(0:16) W 45-42 A .... c98,0881991 Nov. 23 -25......... L 21-24 H .... c84,6231992 Nov. 21 15- ......(U) L 37-38 A .... 80,5681993 Nov. 20 22-16....... L 21-27 H .... c93,4581994 Nov. 19 13- .......... L 19-31 A .... 91,8151995 Nov. 18 11- ......... L 20-24 H .... c91,3631996 Nov. 23 ....(UC-0:39) L 41-48(2OT) A ... 80,6441997 Nov. 22 - 7 ......... L 24-31 H .... c91,3501998 Nov. 21 - 3 ......... L 17-34 A .... c88,0801999 Nov. 20 ................ W 17-7 H .... 91,3842000 Nov. 25 ........(0:09) W 38-35 A .... c80,2272001 Nov. 17 -20............ W 27-0 H .... 88,588
All games at the Los Angeles Memorial Coliseum, except Away gamesafter 1981, which were played at the Rose Bowl, Pasadena, California
WASHINGTON (42-26-4)
1923 Oct. 20 .............. L 0-22 A .... 21,5001927 Dec. 3 .............. W 33-13 H .... 60,0001929 Oct. 12 .............. W 48- 0 A .... 23,5821930 Nov. 27Th .........(Mud) W 32- 0 H .... 45,0001931 Dec. 5 .............. W 44- 7 H .... 40,0001932 Nov. 24Th .........(Mud) W 9- 6 A .... 22,0611933 Dec. 9 .............. W 13- 7 H .... 45,0001934 Dec. 1 .............. L 7-14 H .... 35,0001935 Dec. 7 .............. L 2- 6 H .... 35,0001936 Nov. 14 15-10......... L 0-12 A .... 23,454
USC VS. PAC-10
2002 FOOTBALL MEDIA GUIDE — PAGE 141
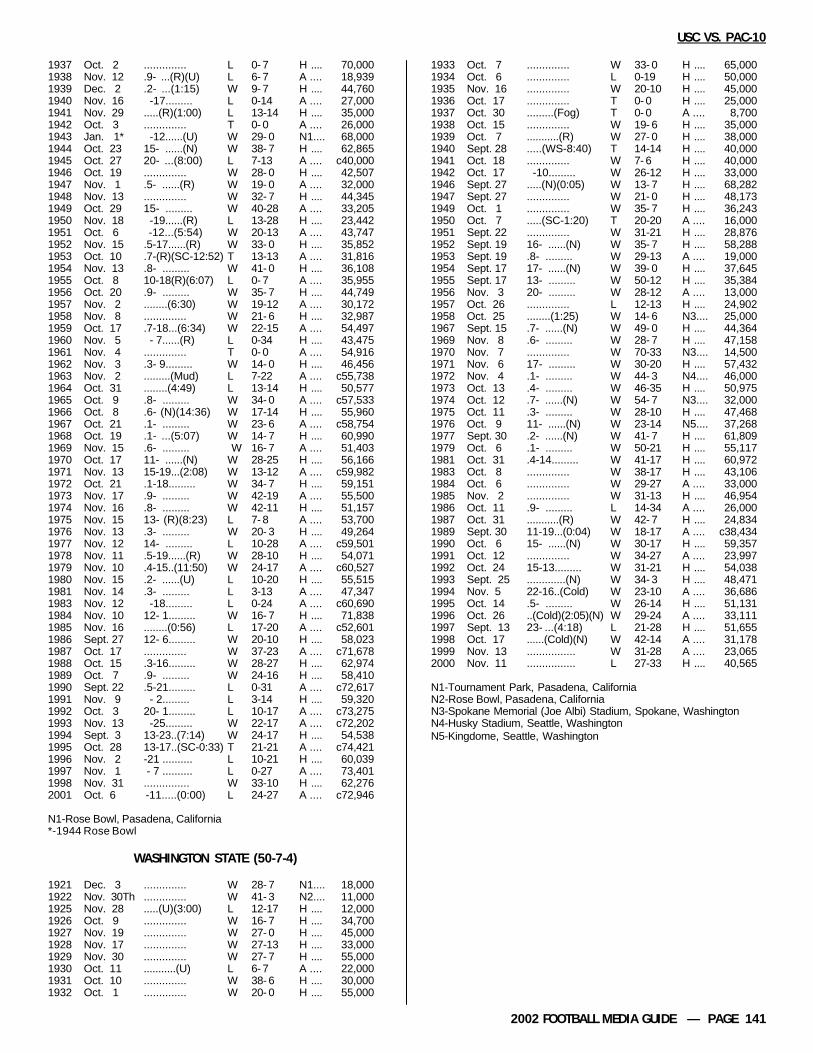
1937 Oct. 2 .............. L 0- 7 H .... 70,0001938 Nov. 12 .9- ...(R)(U) L 6- 7 A .... 18,9391939 Dec. 2 .2- ...(1:15) W 9- 7 H .... 44,7601940 Nov. 16 -17......... L 0-14 A .... 27,0001941 Nov. 29 .....(R)(1:00) L 13-14 H .... 35,0001942 Oct. 3 .............. T 0- 0 A .... 26,0001943 Jan. 1* -12......(U) W 29- 0 N1.... 68,0001944 Oct. 23 15- ......(N) W 38- 7 H .... 62,8651945 Oct. 27 20- ...(8:00) L 7-13 A .... c40,0001946 Oct. 19 .............. W 28- 0 H .... 42,5071947 Nov. 1 .5- ......(R) W 19- 0 A .... 32,0001948 Nov. 13 .............. W 32- 7 H .... 44,3451949 Oct. 29 15- ......... W 40-28 A .... 33,2051950 Nov. 18 -19......(R) L 13-28 H .... 23,4421951 Oct. 6 -12...(5:54) W 20-13 A .... 43,7471952 Nov. 15 .5-17......(R) W 33- 0 H .... 35,8521953 Oct. 10 .7-(R)(SC-12:52) T 13-13 A .... 31,8161954 Nov. 13 .8- ......... W 41- 0 H .... 36,1081955 Oct. 8 10-18(R)(6:07) L 0- 7 A .... 35,9551956 Oct. 20 .9- ......... W 35- 7 H .... 44,7491957 Nov. 2 ........(6:30) W 19-12 A .... 30,1721958 Nov. 8 .............. W 21- 6 H .... 32,9871959 Oct. 17 .7-18...(6:34) W 22-15 A .... 54,4971960 Nov. 5 - 7......(R) L 0-34 H .... 43,4751961 Nov. 4 .............. T 0- 0 A .... 54,9161962 Nov. 3 .3- 9......... W 14- 0 H .... 46,4561963 Nov. 2 .........(Mud) L 7-22 A .... c55,7381964 Oct. 31 ........(4:49) L 13-14 H .... 50,5771965 Oct. 9 .8- ......... W 34- 0 A .... c57,5331966 Oct. 8 .6- (N)(14:36) W 17-14 H .... 55,9601967 Oct. 21 .1- ......... W 23- 6 A .... c58,7541968 Oct. 19 .1- ...(5:07) W 14- 7 H .... 60,9901969 Nov. 15 .6- ......... W 16- 7 A .... 51,4031970 Oct. 17 11- ......(N) W 28-25 H .... 56,1661971 Nov. 13 15-19...(2:08) W 13-12 A .... c59,9821972 Oct. 21 .1-18......... W 34- 7 H .... 59,1511973 Nov. 17 .9- ......... W 42-19 A .... 55,5001974 Nov. 16 .8- ......... W 42-11 H .... 51,1571975 Nov. 15 13- (R)(8:23) L 7- 8 A .... 53,7001976 Nov. 13 .3- ......... W 20- 3 H .... 49,2641977 Nov. 12 14- ......... L 10-28 A .... c59,5011978 Nov. 11 .5-19......(R) W 28-10 H .... 54,0711979 Nov. 10 .4-15..(11:50) W 24-17 A .... c60,5271980 Nov. 15 .2- ......(U) L 10-20 H .... 55,5151981 Nov. 14 .3- ......... L 3-13 A .... 47,3471983 Nov. 12 -18......... L 0-24 A .... c60,6901984 Nov. 10 12- 1......... W 16- 7 H .... 71,8381985 Nov. 16 ........(0:56) L 17-20 A .... c52,6011986 Sept. 27 12- 6......... W 20-10 H .... 58,0231987 Oct. 17 .............. W 37-23 A .... c71,6781988 Oct. 15 .3-16......... W 28-27 H .... 62,9741989 Oct. 7 .9- ......... W 24-16 H .... 58,4101990 Sept. 22 .5-21......... L 0-31 A .... c72,6171991 Nov. 9 - 2......... L 3-14 H .... 59,3201992 Oct. 3 20- 1......... L 10-17 A .... c73,2751993 Nov. 13 -25......... W 22-17 A .... c72,2021994 Sept. 3 13-23..(7:14) W 24-17 H .... 54,5381995 Oct. 28 13-17..(SC-0:33) T 21-21 A .... c74,4211996 Nov. 2 -21 .......... L 10-21 H .... 60,0391997 Nov. 1 - 7 .......... L 0-27 A .... 73,4011998 Nov. 31 ............... W 33-10 H .... 62,2762001 Oct. 6 -11.....(0:00) L 24-27 A .... c72,946
N1-Rose Bowl, Pasadena, California*-1944 Rose Bowl
WASHINGTON STATE (50-7-4)
1921 Dec. 3 .............. W 28- 7 N1.... 18,0001922 Nov. 30Th .............. W 41- 3 N2.... 11,0001925 Nov. 28 .....(U)(3:00) L 12-17 H .... 12,0001926 Oct. 9 .............. W 16- 7 H .... 34,7001927 Nov. 19 .............. W 27- 0 H .... 45,0001928 Nov. 17 .............. W 27-13 H .... 33,0001929 Nov. 30 .............. W 27- 7 H .... 55,0001930 Oct. 11 ...........(U) L 6- 7 A .... 22,0001931 Oct. 10 .............. W 38- 6 H .... 30,0001932 Oct. 1 .............. W 20- 0 H .... 55,000
1933 Oct. 7 .............. W 33- 0 H .... 65,0001934 Oct. 6 .............. L 0-19 H .... 50,0001935 Nov. 16 .............. W 20-10 H .... 45,0001936 Oct. 17 .............. T 0- 0 H .... 25,0001937 Oct. 30 .........(Fog) T 0- 0 A .... 8,7001938 Oct. 15 .............. W 19- 6 H .... 35,0001939 Oct. 7 ...........(R) W 27- 0 H .... 38,0001940 Sept. 28 .....(WS-8:40) T 14-14 H .... 40,0001941 Oct. 18 .............. W 7- 6 H .... 40,0001942 Oct. 17 -10......... W 26-12 H .... 33,0001946 Sept. 27 .....(N)(0:05) W 13- 7 H .... 68,2821947 Sept. 27 .............. W 21- 0 H .... 48,1731949 Oct. 1 .............. W 35- 7 H .... 36,2431950 Oct. 7 .....(SC-1:20) T 20-20 A .... 16,0001951 Sept. 22 .............. W 31-21 H .... 28,8761952 Sept. 19 16- ......(N) W 35- 7 H .... 58,2881953 Sept. 19 .8- ......... W 29-13 A .... 19,0001954 Sept. 17 17- ......(N) W 39- 0 H .... 37,6451955 Sept. 17 13- ......... W 50-12 H .... 35,3841956 Nov. 3 20- ......... W 28-12 A .... 13,0001957 Oct. 26 .............. L 12-13 H .... 24,9021958 Oct. 25 ........(1:25) W 14- 6 N3.... 25,0001967 Sept. 15 .7- ......(N) W 49- 0 H .... 44,3641969 Nov. 8 .6- ......... W 28- 7 H .... 47,1581970 Nov. 7 .............. W 70-33 N3.... 14,5001971 Nov. 6 17- ......... W 30-20 H .... 57,4321972 Nov. 4 .1- ......... W 44- 3 N4.... 46,0001973 Oct. 13 .4- ......... W 46-35 H .... 50,9751974 Oct. 12 .7- ......(N) W 54- 7 N3.... 32,0001975 Oct. 11 .3- ......... W 28-10 H .... 47,4681976 Oct. 9 11- ......(N) W 23-14 N5.... 37,2681977 Sept. 30 .2- ......(N) W 41- 7 H .... 61,8091979 Oct. 6 .1- ......... W 50-21 H .... 55,1171981 Oct. 31 .4-14......... W 41-17 H .... 60,9721983 Oct. 8 .............. W 38-17 H .... 43,1061984 Oct. 6 .............. W 29-27 A .... 33,0001985 Nov. 2 .............. W 31-13 H .... 46,9541986 Oct. 11 .9- ......... L 14-34 A .... 26,0001987 Oct. 31 ...........(R) W 42- 7 H .... 24,8341989 Sept. 30 11-19...(0:04) W 18-17 A .... c38,4341990 Oct. 6 15- ......(N) W 30-17 H .... 59,3571991 Oct. 12 .............. W 34-27 A .... 23,9971992 Oct. 24 15-13......... W 31-21 H .... 54,0381993 Sept. 25 .............(N) W 34- 3 H .... 48,4711994 Nov. 5 22-16..(Cold) W 23-10 A .... 36,6861995 Oct. 14 .5- ......... W 26-14 H .... 51,1311996 Oct. 26 ..(Cold)(2:05)(N) W 29-24 A .... 33,1111997 Sept. 13 23- ...(4:18) L 21-28 H .... 51,6551998 Oct. 17 ......(Cold)(N) W 42-14 A .... 31,1781999 Nov. 13 ................ W 31-28 A .... 23,0652000 Nov. 11 ................ L 27-33 H .... 40,565
N1-Tournament Park, Pasadena, CaliforniaN2-Rose Bowl, Pasadena, CaliforniaN3-Spokane Memorial (Joe Albi) Stadium, Spokane, WashingtonN4-Husky Stadium, Seattle, WashingtonN5-Kingdome, Seattle, Washington
USC VS. PAC-10

PAGE 142 — UNIVERSITY OF SOUTHERN CALIFORNIA
Non-Conference Record
The information in this opponents’ year-by-year section is, readingfrom left to right: (1) year; (2) date (with “Th” indicating a game playedon Thanksgiving Day); (3) AP ranking going into the game, with USC’sgiven first, and USC’s opponent’s given second; (4) other miscellaneousinformation (“N” for night game if contest began after 5:00 p.m. local time,“U” for upset if the result was considered a significant upset, timeremaining in the game if a late score resulted in a win or tie, and weatherconditions, with “R” indicating most of the game was played in the rain and“Sn” indicating most of the game was played in snow conditions); (5)game result (W, L or T); (6) game score, with USC’s given first; (7) gamesite (home, away or neutral); and (8) attendance. It was compiled byMichael J. Glenn. USC appreciates his invaluable efforts.
NOTRE DAME (26-42-5)
1926 Dec. 4 ........(2:00) L 12-13 H .... c74,3781927 Nov. 26 .............. L 6- 7 N1... c120,0001928 Dec. 1 .............. W 27-14 H .... c72,6321929 Nov. 16 .............. L 12-13 N1... c112,9121930 Dec. 6 .............. L 0-27 H .... c73,9671931 Nov. 21 ........(1:00) W 16-14 A .... c50,7311932 Dec. 10 .............. W 13- 0 H .... c93,9241933 Nov. 25 .............. W 19- 0 A .... 25,0371934 Dec. 8 .............. L 0-14 H .... 45,5681935 Nov. 23 ........(Cold) L 13-20 A .... 38,3051936 Dec. 5 - 8......... T 13-13 H .... 71,2011937 Nov. 27 - 9...(1:45) L 6-13 A .... 28,9201938 Dec. 3 .8- 1......(U) W 13- 0 H .... c97,1461939 Nov. 25 .4- 7...(Cold) W 20-12 A .... c54,7991940 Dec. 7 .............. L 6-10 H .... 85,8081941 Nov. 22 - 4......... L 18-20 A .... c54,9671942 Nov. 28 14- 8......... L 0-13 H .... 94,5191946 Nov. 30 16- 2......... L 6-26 A .... c55,2981947 Dec. 6 .3- 1......... L 7-38 H .... c104,9531948 Dec. 4 - 2(ND-0:35) T 14-14 H .... c100,5711949 Nov. 26 17- 1...(Cold) L 0-32 A .... c57,2141950 Dec. 2 .............. W 9- 7 H .... 70,1771951 Dec. 1 20- (R)(6:00) L 12-19 H .... 55,7831952 Nov. 29 .2- 7(U)(Cold) L 0- 9 A .... c58,3941953 Nov. 28 20- 2......... L 14-48 H .... 97,9521954 Nov. 27 17- 4(R)(5:57) L 17-23 A .... c56,4381955 Nov. 26 - 5......(U) W 42-20 H .... 94,8921956 Dec. 1 17- ......... W 28-20 H .... 64,5381957 Nov. 30 -12.....(Sn) L 12-40 A .... 54,7931958 Nov. 29 -18......... L 13-20 H .... 66,9031959 Nov. 28 .7- (U)(Cold) L 6-16 A .... 48,6821960 Nov. 26 ........(U)(R) L 0-17 H .... 28,2971961 Oct. 14 - 8......(R) L 0-30 A .... 50,4271962 Dec. 1 .1- ......... W 25- 0 H .... 81,6761963 Oct. 12 .7- (U)(6:28) L 14-17 A .... c59,1351964 Nov. 28 - 1(U)(1:33) W 20-17 H .... 83,8401965 Oct. 23 .4- 7......(R) L 7-28 A .... c59,2351966 Nov. 26 10- 1......... L 0-51 H .... 88,5201967 Oct. 14 .1- 5......... W 24- 7 A .... c59,0751968 Nov. 30 .2- 9(SC-10:14) T 21-21 H .... 82,6591969 Oct. 18 .3-11(ND-6:51) T 14-14 A .... c59,0751970 Nov. 28 - 4...(R)(U) W 38-28 H .... 64,6941971 Oct. 23 - 6......(U) W 28-14 A .... c59,0751972 Dec. 2 .1-10......... W 45-23 H .... 75,2431973 Oct. 27 .6- 8......(R) L 14-23 A .... c59,0751974 Nov. 30 .6- 5......... W 55-24 H .... 83,5521975 Oct. 25 .3-14......... W 24-17 A .... c59,0751976 Nov. 27 .3-13......... W 17-13 H .... 76,5611977 Oct. 22 .5-11......... L 19-49 A .... c59,0751978 Nov. 25 .3- 8...(0:02) W 27-25 H .... 84,2561979 Oct. 20 .4- 9......... W 42-23 A .... c59,0751980 Dec. 6 17- 2......... W 20- 3 H .... 82,6631981 Oct. 24 .5- ...(4:52) W 14- 7 A .... c59,0751982 Nov. 27 17- ...(0:48) W 17-13 H .... 76,4591983 Oct. 22 .............. L 6-27 A .... c59,075
1984 Nov. 24 14- ......(R) L 7-19 H .... 66,3421985 Oct. 26 .............. L 3-37 A .... c59,0751986 Nov. 29 17- ...(0:00) L 37-38 H .... 70,6141987 Oct. 24 -10......... L 15-26 A .... c59,0751988 Nov. 26 .2- 1......... L 10-27 H .... c93,8291989 Oct. 21 .9- 1...(5:18) L 24-28 A .... c59,0751990 Nov. 24 18- 7......(N) L 6-10 H .... c91,6391991 Oct. 26 - 5......... L 20-24 A .... c59,0751992 Nov. 28 19- 5......(N) L 23-31 H .... c90,0631993 Oct. 23 - 2......... L 13-31 A .... c59,0751994 Nov. 26 17- (N)(Cold)(SC4:53)T 17-17 H .... c90,2171995 Oct. 21 .5-17......(R) L 10-38 A .... c59,0751996 Nov. 30 -10 (N)(U)(SC-1:50) W 27-20(1OT) H .... c90,2961997 Oct. 18 ...........(1:05) W 20-17 A .... c80,2251998 Nov. 28 - 9........(N) W 10- 0 H .... 90,0961999 Oct. 16 ......(R)(2:40) L 24-25 A .... c80,0122000 Nov. 25 -11............. L 21-38 H .... 81,3422001 Oct. 20 ................... L 16-27 A .... c80,795
N1-Soldier Field, Chicago, Illinois
INDEPENDENTS/INACTIVES/OTHERS (23-5-0)(not including Notre Dame or Southland teams)
CARNEGIE TECH (1-0-0)
1929 Dec. 14 .............. W 45-13 H .... 65,000
DENVER (1-0-0)
1930 Nov. 1 .............. W 33-13 H .... 18,000
NAVY (2-1-0)
1949 Sept. 24 .............. W 42-20 H .... 62,7871950 Oct. 21 .............. L 14-27 N1.... 24,3001962 Nov. 17 .2- ......... W 13- 6 H .... 51,701
N1-Memorial Stadium, Baltimore, Maryland
PACIFIC (6-0-0)
1934 Sept. 29 .............. W 6- 0 H .... 35,0001935 Oct. 5 .............. W 19- 7 H .... 35,0001937 Sept. 25 .............. W 40- 0 H .... 35,0001943 Oct. 23 .7- 6......... W 6- 0 H .... 65,0001944 Sept. 30 .............. W 18- 6 H .... 30,0001945 Oct. 20 14- ......... W 52- 0 H .... 10,000
ST. MARY’S (5-4-0)
1915 Oct. 16 .............. W 47- 3 H ....1917 Oct. 27 ........(5:00) L 0- 7 H ....1924 Nov. 8 ...........(U) L 10-14 H .... 35,0001925 Dec. 12 .............. W 12- 0 H .... 25,0001928 Oct. 13 .............. W 19- 6 H .... 40,0001931 Sept. 26 ...........(U) L 7-13 H .... 70,0001933 Oct. 14 .............. W 14- 7 H .... 85,0001944 Oct. 28 .............. W 34- 7 H .... 20,0001945 Nov. 3 - 8......... L 0-26 H .... 76,378
SAN FRANCISCO (1-0-0)
1943 Oct. 16 .8- ......... W 34- 0 A .... 6,000
SANTA CLARA (3-0-0)
1925 Nov. 7 .............. W 29- 9 H .... 25,0001926 Oct. 2 .............. W 42- 0 H .... 27,4001927 Oct. 1 .............. W 52-12 H .... 35,000
NON-CONFERENCE RECORD

2002 FOOTBALL MEDIA GUIDE — PAGE 143
UTAH STATE (4-0-0)
1928 Sept. 29 .............. W 40-12 H .... 31,0001930 Oct. 18 .............. W 65- 0 H .... 25,0001984 Sept. 8 .............. W 42- 7 H .... 45,0671989 Sept. 16 13- ......(N) W 66-10 H .... 50,249
(NOTE: Carnegie Tech merged with the Mellon Institute of Research in1967 and is now known as Carnegie Mellon. The Pittsburgh, Penn., schoolplays Division III football in the University Athletic Association. TheUniversity of Denver discontinued football in 1961. The University ofPacific in Stockton, Calif., dropped football in December of 1995. St.Mary's in Moraga, Calif., plays football as a Division I-AA independent.The University of San Francisco dropped football from 1952 through 1958,and then permanently discontinued the sport after 1971. The Universityof Santa Clara dropped football in 1994. Utah State became a member ofthe Pacific Coast Athletic Association (PCAA) in 1977. The PCAA wasrenamed the Big West in 1988. When the Big West dropped football,Utah State became an independent in 2001.)
ATLANTIC COAST (6-5-0)
CLEMSON (1-0-0)
1966 Oct. 22 .5- ......... W 30- 0 H .... 44,614
DUKE (3-0-0)
1938 Jan. 2* .7- 3...(0:40) W 7- 3 N1.... c89,4521962 Sept. 22 - 8......(U) W 14- 7 H .... 26,4001975 Sept. 12 .4- ......(N) W 35- 7 H .... 56,727
N1-Rose Bowl, Pasadena, California*-1939 Rose Bowl
FLORIDA STATE (0-2-0)
1997 Sept. 6 23- 3(N)(10:40) L 7-14 H .... 72,7831998 Sept. 26 17-10......... L 10-30 A .... 79,815
GEORGIA TECH (2-1-0)
1961 Sept. 22 ...........(N) L 7-27 H .... 36,9501969 Oct. 25 .7- ......... W 29-18 H .... 53,3411973 Sept. 22 .1- ......... W 23- 6 A .... 58,228
NORTH CAROLINA (0-2-0)
1958 Oct. 3 ...........(N) L 7- 8 H .... 43,2381993 Aug. 29* 19-20..(N) L 9-31 N1.... 49,309
N1-Anaheim Stadium, Anaheim, California*-Disneyland Pigskin Classic
(NOTE: Duke, the Southern Conference champion when it played USCin the 1939 Rose Bowl, was a charter member of the Atlantic CoastConference in 1953. Georgia Tech, a 1921 charter member of theSouthern Conference, left to become a charter member of the SoutheasternConference in 1933, withdrew from the Southeastern Conference in1964, and joined the ACC in 1978. Florida State withdrew from theSouthern Independent Conference to join the ACC in 1991.)
BIG EAST (12-5-0)
BOSTON COLLEGE (2-0-0)
1987 Sept. 19 .............. W 23-17 H .... 46,2051988 Sept. 1 .8- ......(N) W 34- 7 A .... c32,000
MIAMI (1-1-0)
1966 Oct. 28 .5- (N)(14:56) L 7-10 A .... 51,1561968 Oct. 5 .2-13......(N) W 28- 3 H .... 71,189
PITTSBURGH (6-4-0)
1929 Jan. 1* .............. W 47-14 N1.... c72,0001932 Jan. 2+ .............. W 35- 0 N1.... 78,8741934 Oct. 13 .............. L 6-20 A .... 55,0001935 Dec. 14 .............. L 7-12 H .... 35,0001954 Sept. 24 15- ......(N) W 27- 7 H .... 50,2531957 Oct. 4 ...........(N) L 14-20 H .... 43,4891959 Sept. 25 11- ......(N) W 23- 0 H .... 34,1721961 Nov. 18 .............. L 9-10 A .... 34,8201965 Nov. 13 .6- ......... W 28- 0 H .... 40,3391974 Sept. 28 18- 8......... W 16- 7 A .... 52,934
N1-Rose Bowl, Pasadena, California*-1930 Rose Bowl+-1933 Rose Bowl
SYRACUSE (2-0-0)
1924 Dec. 6 .............. W 16- 0 H .... 45,0001990 Aug. 31* .9- ......(N) W 34-16 N1.... 57,293
N1-Giants Stadium, East Rutherford, New Jersey*-Kickoff Classic VIII
WEST VIRGINIA (1-0-0)
1959 Nov. 7 .6- ......... W 36- 0 H .... 34,066
(NOTE: Boston College, Miami, Pittsburgh, Syracuse, and West Virginiawere all independents prior to becoming charter members of the Big EastConference in 1991.)
BIG SKY (5-0-0)
MONTANA (5-0-0)
1925 Nov. 14 .............. W 27- 7 H .... 25,0001926 Nov. 25Th .............. W 61- 0 H .... 18,6001931 Nov. 14 .............. W 69- 0 H .... 25,0001935 Sept. 28 .............. W 9- 0 H .... 25,0001942 Dec. 5 .............. W 38- 0 H .... 25,000
(NOTE: Montana, a 1963 charter member of the Division I-AA Big SkyConference, was a member of the Pacific Coast Conference from 1924until 1950.)
BIG TEN (61-27-2)
ILLINOIS (10-2-0)
1935 Oct. 12 .............. L 0-19 H .... 60,0001936 Oct. 10 ...........(R) W 24- 6 A .... 40,0001939 Oct. 14 .............. W 26- 0 H .... 60,0001940 Oct. 12 .............. W 13- 7 A .... 30,1251961 Oct. 28 .............. W 14-10 H .... 28,6941962 Oct. 27 .4- ......... W 28-16 A .... 31,3751971 Sept. 25 16- ......(N) W 28- 0 H .... 49,3901972 Sept. 23 .1- ......... W 55-20 A .... 61,2771985 Sept. 7 .6-11......... W 20-10 A .... c76,3691986 Sept. 13 .............. W 31-16 H .... 51,4961989 Sept. 4 .5-22(N)(2:19) L 13-14 H .... 54,6221996 Sept. 7 19- .......... W 55- 3 A .... 56,504
NON-CONFERENCE RECORD

PAGE 144 — UNIVERSITY OF SOUTHERN CALIFORNIA
INDIANA (4-0-0)
1953 Oct. 2 .7- ......(N) W 27-14 H .... 49,5781967 Jan. 1* .1- 4......... W 14- 3 N1... c102,9461981 Sept. 19 .2- ......... W 21- 0 A .... 51,1671982 Sept. 18 19- ......... W 28- 7 H .... 50,724
N1-Rose Bowl, Pasadena, California*-1968 Rose Bowl
IOWA (6-2-0)
1925 Nov. 21 .............. W 18- 0 H .... 66,0001950 Sept. 29 12-(N)(U)(10:00) L 14-20 H .... 45,1671961 Oct. 7 - 1......... L 34-35 H .... 30,2631962 Oct. 6 .6- ......... W 7- 0 A .... 55,3001970 Sept. 26 .7- ......... W 48- 0 A .... 56,1311974 Oct. 5 .9- ......... W 41- 3 H .... 52,0951975 Oct. 4 .3- ......... W 27-16 A .... 54,6001976 Oct. 2 13- ......(N) W 55- 0 H .... 55,518
MICHIGAN (4-4-0)
1947 Jan. 1* .8- 2......... L 0-49 N1.... c93,0001957 Sept. 28 -10......... L 6-16 H .... 44,7391958 Sept. 27 .............. L 19-20 A .... 77,0051969 Jan. 1* .5- 7......... W 10- 3 N1... c103,8781976 Jan. 1* .3- 2......... W 14- 6 N1... c106,1821978 Jan. 1* .3- 5......... W 17-10 N1... c105,6291988 Jan. 1* .5-11......... L 14-22 N1... c101,6881989 Jan. 1* 12- 3...(1:10) W 17-10 N1... c103,450
N1-Rose Bowl, Pasadena, California*-Rose Bowl of the following calendar year
MICHIGAN STATE (4-4-0)
1963 Oct. 4 .8- (N)(8:03) W 13-10 H .... 59,1371964 Oct. 3 .2- ......... L 7-17 A .... 70,1021967 Sept. 30 .2- ......... W 21-17 A .... c75,2871972 Sept. 30 .1- ......(N) W 51- 6 H .... 63,9341978 Sept. 29 .3- ......(N) W 30- 9 H .... 65,3191987 Sept. 7 19-17......(N) L 13-27 A .... c77,9221987 Jan. 1* 16- 8...(4:14) L 17-20 N1... c103,8471990 Dec. 31+ 21-22......... L 16-17 N2.... 50,562
N1-Rose Bowl, Pasadena, CaliforniaN2-Sun Bowl, El Paso, Texas*-1988 Rose Bowl+-1990 John Hancock Bowl
MINNESOTA (4-1-1)
1953 Sept. 26 .8- ......... W 17- 7 H .... 66,6981955 Oct. 29 10- .....(Sn) L 19-25 A .... c64,5921965 Sept. 17 .7-(N)(SC-6:24) T 20-20 H .... 58,4971968 Sept. 21 .2-16......(R) W 29-20 A .... c60,8201979 Sept. 22 .1- ......... W 48-14 H .... 61,7661980 Sept. 27 .5- ......... W 24- 7 A .... c55,115
NORTHWESTERN (5-0-0)
1952 Sept. 26 16- ......(N) W 31- 0 H .... 59,7561954 Oct. 2 .9............ W 12- 7 A .... 30,7251968 Sept. 28 .3- ......... W 24- 7 A .... 47,2771969 Sept. 27 .5- ......(N) W 48- 6 H .... 56,5891995 Jan. 1* 17- 3....... W 41-32 N1.... c100,102
N1-Rose Bowl, Pasadena, California*1996 Rose Bowl
OHIO STATE (11-9-1)
1937 Oct. 9 ........(9:00) W 13-12 H .... 65,0001938 Oct. 8 .............. W 14- 7 A .... 62,7781941 Oct. 4 .............. L 0-33 H .... 65,0001942 Oct. 10 - 1......... L 12-28 A .... 56,4361946 Oct. 5 .............. L 0-21 H .... 80,0471947 Oct. 11 20- ......... W 32- 0 A .... 76,5591948 Oct. 2 .............. L 0-20 A .... 75,1021949 Oct. 8 .8-11......... T 13-13 H .... 62,8771954 Jan. 1* 17- 1......(R) L 7-20 N1.... 89,1911959 Oct. 2 11-14......(N) W 17- 0 H .... 49,5921960 Oct. 1 - 9......... L 0-20 A .... c83,2041963 Oct. 19 - 4......... W 32- 3 H .... 61,8831964 Oct. 17 - 2......... L 0-17 A .... c84,3151968 Jan. 1* .2- 1......... L 16-27 N1... c102,0631972 Jan. 1* .1- 3......... W 42-17 N1... c106,8691973 Jan. 1* .7- 4......... L 21-42 N1... c105,2671974 Jan. 1* .5- 3...(2:03) W 18-17 N1... c106,7211979 Jan. 1* .3- 1...(1:32) W 17-16 N1... c105,5261984 Jan. 1* 18- 6......... W 20-17 N1... c102,5941989 Sept. 23 12-20......... W 42- 3 H .... 69,8761990 Sept. 29 18-12......(R) W 35-26 A .... c89,422
N1-Rose Bowl, Pasadena, California*-Rose Bowl of the following calendar year
PENN STATE (4-4-0)
1922 Jan. 1* .............. W 14- 3 N1.... 43,0001981 Jan. 1+ .8- 7......... L 10-26 N2.... c71,0531990 Sept. 15 .6- ......... W 19-14 H .... 70,5941991 Sept. 14 - 5...(N)(U) W 21-10 H .... 64,7581993 Sept. 11 -15........ L 20-21 A .... c95,9921994 Sept. 10 24- 8....... L 14-38 A .... c96,4631996 Aug. 25= .7-11....... L 7-24 N3... c77,7162000 Aug. 27% 15-22...... W 29- 5 N3... c78,902
N1-Rose Bowl, Pasadena, CaliforniaN2-Sun Devil Stadium, Tempe, ArizonaN3-Giants Stadium, East Rutherford, New Jersey*-1923 Rose Bowl+-1982 Fiesta Bowl=-Kickoff Classic XIV%-Kickoff Classic XVIII
PURDUE (3-1-0)
1966 Jan. 1* - 7......... L 13-14 N1... c100,8071975 Sept. 27 .3- ......... W 19- 6 H .... 56,1701976 Sept. 25 19- ......... W 31-13 A .... 65,4251998 Aug. 30 ................ W 27-17+ H .... 56,623
N1-Rose Bowl, Pasadena, California*-1967 Rose Bowl+-Pigskin Classic IX
WISCONSIN (6-0-0)
1952 Jan. 1* .5-11......... W 7- 0 N1... c101,5001955 Oct. 14 16- 6......(N) W 33-21 H .... 75,1141956 Oct. 6 10- ......... W 13- 6 A .... 52,9441962 Jan. 1+ .1- 2......... W 42-37 N1.... c98,6981965 Sept. 25 .............. W 26- 6 A .... 52,7061966 Sept. 24 .5- ......(N) W 38- 3 H .... 52,325
N1-Rose Bowl, Pasadena, California*-1953 Rose Bowl+-1963 Rose Bowl
(NOTE: Penn State was an independent until it joined the Big Ten in 1993.)
NON-CONFERENCE RECORD
2002 FOOTBALL MEDIA GUIDE — PAGE 145
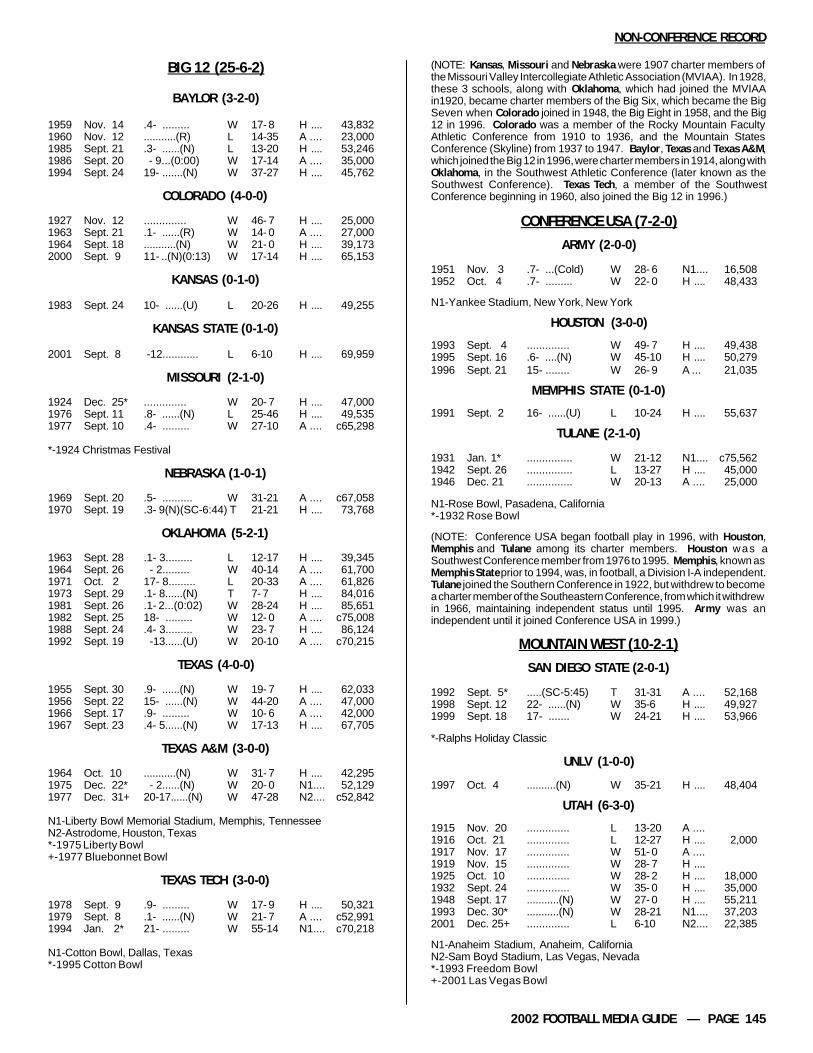
BIG 12 (25-6-2)
BAYLOR (3-2-0)
1959 Nov. 14 .4- ......... W 17- 8 H .... 43,8321960 Nov. 12 ...........(R) L 14-35 A .... 23,0001985 Sept. 21 .3- ......(N) L 13-20 H .... 53,2461986 Sept. 20 - 9...(0:00) W 17-14 A .... 35,0001994 Sept. 24 19- .......(N) W 37-27 H .... 45,762
COLORADO (4-0-0)
1927 Nov. 12 .............. W 46- 7 H .... 25,0001963 Sept. 21 .1- ......(R) W 14- 0 A .... 27,0001964 Sept. 18 ...........(N) W 21- 0 H .... 39,1732000 Sept. 9 11- ..(N)(0:13) W 17-14 H .... 65,153
KANSAS (0-1-0)
1983 Sept. 24 10- ......(U) L 20-26 H .... 49,255
KANSAS STATE (0-1-0)
2001 Sept. 8 -12............ L 6-10 H .... 69,959
MISSOURI (2-1-0)
1924 Dec. 25* .............. W 20- 7 H .... 47,0001976 Sept. 11 .8- ......(N) L 25-46 H .... 49,5351977 Sept. 10 .4- ......... W 27-10 A .... c65,298
*-1924 Christmas Festival
NEBRASKA (1-0-1)
1969 Sept. 20 .5- .......... W 31-21 A .... c67,0581970 Sept. 19 .3- 9(N)(SC-6:44) T 21-21 H .... 73,768
OKLAHOMA (5-2-1)
1963 Sept. 28 .1- 3......... L 12-17 H .... 39,3451964 Sept. 26 - 2......... W 40-14 A .... 61,7001971 Oct. 2 17- 8......... L 20-33 A .... 61,8261973 Sept. 29 .1- 8......(N) T 7- 7 H .... 84,0161981 Sept. 26 .1- 2...(0:02) W 28-24 H .... 85,6511982 Sept. 25 18- ......... W 12- 0 A .... c75,0081988 Sept. 24 .4- 3......... W 23- 7 H .... 86,1241992 Sept. 19 -13......(U) W 20-10 A .... c70,215
TEXAS (4-0-0)
1955 Sept. 30 .9- ......(N) W 19- 7 H .... 62,0331956 Sept. 22 15- ......(N) W 44-20 A .... 47,0001966 Sept. 17 .9- ......... W 10- 6 A .... 42,0001967 Sept. 23 .4- 5......(N) W 17-13 H .... 67,705
TEXAS A&M (3-0-0)
1964 Oct. 10 ...........(N) W 31- 7 H .... 42,2951975 Dec. 22* - 2......(N) W 20- 0 N1.... 52,1291977 Dec. 31+ 20-17......(N) W 47-28 N2.... c52,842
N1-Liberty Bowl Memorial Stadium, Memphis, TennesseeN2-Astrodome, Houston, Texas*-1975 Liberty Bowl+-1977 Bluebonnet Bowl
TEXAS TECH (3-0-0)
1978 Sept. 9 .9- ......... W 17- 9 H .... 50,3211979 Sept. 8 .1- ......(N) W 21- 7 A .... c52,9911994 Jan. 2* 21- ......... W 55-14 N1.... c70,218
N1-Cotton Bowl, Dallas, Texas*-1995 Cotton Bowl
(NOTE: Kansas, Missouri and Nebraska were 1907 charter members ofthe Missouri Valley Intercollegiate Athletic Association (MVIAA). In 1928,these 3 schools, along with Oklahoma, which had joined the MVIAAin1920, became charter members of the Big Six, which became the BigSeven when Colorado joined in 1948, the Big Eight in 1958, and the Big12 in 1996. Colorado was a member of the Rocky Mountain FacultyAthletic Conference from 1910 to 1936, and the Mountain StatesConference (Skyline) from 1937 to 1947. Baylor, Texas and Texas A&M,which joined the Big 12 in 1996, were charter members in 1914, along withOklahoma, in the Southwest Athletic Conference (later known as theSouthwest Conference). Texas Tech, a member of the SouthwestConference beginning in 1960, also joined the Big 12 in 1996.)
CONFERENCE USA (7-2-0)ARMY (2-0-0)
1951 Nov. 3 .7- ...(Cold) W 28- 6 N1.... 16,5081952 Oct. 4 .7- ......... W 22- 0 H .... 48,433
N1-Yankee Stadium, New York, New York
HOUSTON (3-0-0)
1993 Sept. 4 .............. W 49- 7 H .... 49,4381995 Sept. 16 .6- ....(N) W 45-10 H .... 50,2791996 Sept. 21 15- ........ W 26- 9 A ... 21,035
MEMPHIS STATE (0-1-0)
1991 Sept. 2 16- ......(U) L 10-24 H .... 55,637
TULANE (2-1-0)
1931 Jan. 1* ............... W 21-12 N1.... c75,5621942 Sept. 26 ............... L 13-27 H .... 45,0001946 Dec. 21 ............... W 20-13 A .... 25,000
N1-Rose Bowl, Pasadena, California*-1932 Rose Bowl
(NOTE: Conference USA began football play in 1996, with Houston,Memphis and Tulane among its charter members. Houston was aSouthwest Conference member from 1976 to 1995. Memphis, known asMemphis State prior to 1994, was, in football, a Division I-A independent.Tulane joined the Southern Conference in 1922, but withdrew to becomea charter member of the Southeastern Conference, from which it withdrewin 1966, maintaining independent status until 1995. Army was anindependent until it joined Conference USA in 1999.)
MOUNTAIN WEST (10-2-1)SAN DIEGO STATE (2-0-1)
1992 Sept. 5* .....(SC-5:45) T 31-31 A .... 52,1681998 Sept. 12 22- ......(N) W 35-6 H .... 49,9271999 Sept. 18 17- ....... W 24-21 H .... 53,966
*-Ralphs Holiday Classic
UNLV (1-0-0)
1997 Oct. 4 ..........(N) W 35-21 H .... 48,404
UTAH (6-3-0)
1915 Nov. 20 .............. L 13-20 A ....1916 Oct. 21 .............. L 12-27 H .... 2,0001917 Nov. 17 .............. W 51- 0 A ....1919 Nov. 15 .............. W 28- 7 H ....1925 Oct. 10 .............. W 28- 2 H .... 18,0001932 Sept. 24 .............. W 35- 0 H .... 35,0001948 Sept. 17 ...........(N) W 27- 0 H .... 55,2111993 Dec. 30* ...........(N) W 28-21 N1.... 37,2032001 Dec. 25+ .............. L 6-10 N2.... 22,385
N1-Anaheim Stadium, Anaheim, CaliforniaN2-Sam Boyd Stadium, Las Vegas, Nevada*-1993 Freedom Bowl+-2001 Las Vegas Bowl
NON-CONFERENCE RECORD
PAGE 146 — UNIVERSITY OF SOUTHERN CALIFORNIA
TENNESSEE (4-0-0)
1939 Jan. 1* .3- 2......... W 14- 0 N1.... c92,2001944 Jan. 1+ .7-12......... W 25- 0 N1.... c91,0001980 Sept. 13 .5- (N)(0:00) W 20-17 A .... c95,0491981 Sept. 12 .5- ......(N) W 43- 7 H .... 62,147
N1-Rose Bowl, Pasadena, California*-1940 Rose Bowl+-1945 Rose Bowl
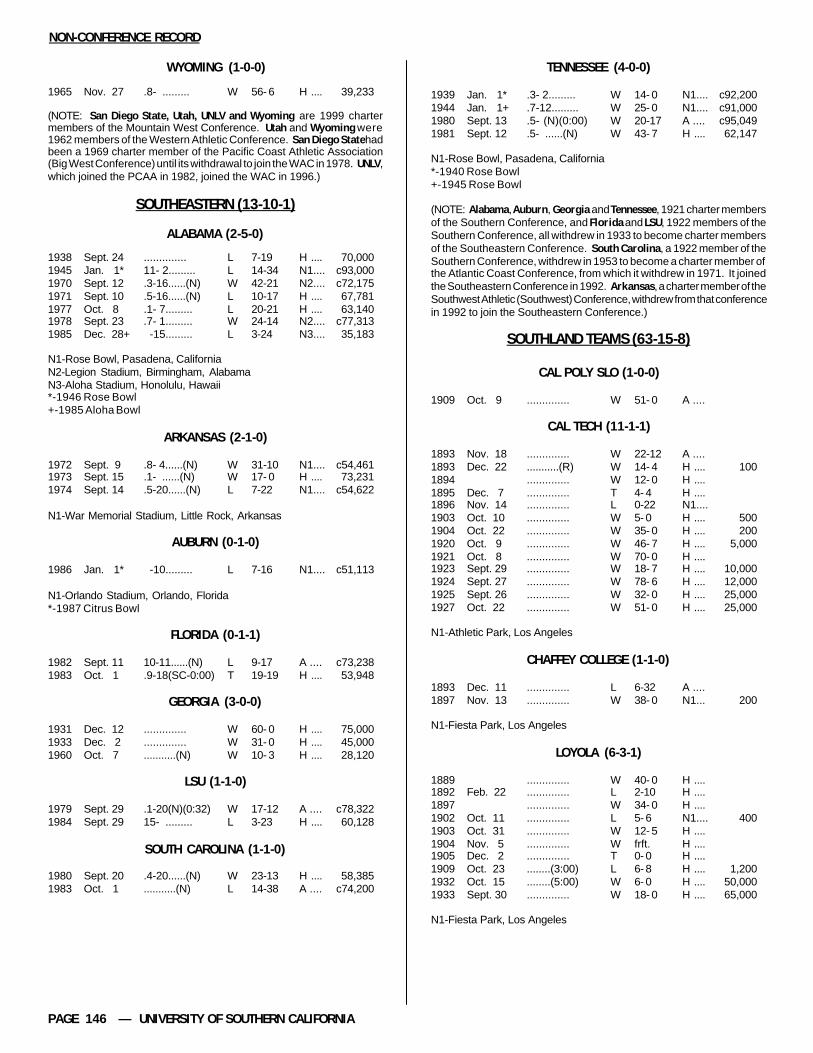
(NOTE: Alabama, Auburn, Georgia and Tennessee, 1921 charter membersof the Southern Conference, and Florida and LSU, 1922 members of theSouthern Conference, all withdrew in 1933 to become charter membersof the Southeastern Conference. South Carolina, a 1922 member of theSouthern Conference, withdrew in 1953 to become a charter member ofthe Atlantic Coast Conference, from which it withdrew in 1971. It joinedthe Southeastern Conference in 1992. Arkansas, a charter member of theSouthwest Athletic (Southwest) Conference, withdrew from that conferencein 1992 to join the Southeastern Conference.)
SOUTHLAND TEAMS (63-15-8)
CAL POLY SLO (1-0-0)
1909 Oct. 9 .............. W 51- 0 A ....
CAL TECH (11-1-1)
1893 Nov. 18 .............. W 22-12 A ....1893 Dec. 22 ...........(R) W 14- 4 H .... 1001894 .............. W 12- 0 H ....1895 Dec. 7 .............. T 4- 4 H ....1896 Nov. 14 .............. L 0-22 N1....1903 Oct. 10 .............. W 5- 0 H .... 5001904 Oct. 22 .............. W 35- 0 H .... 2001920 Oct. 9 .............. W 46- 7 H .... 5,0001921 Oct. 8 .............. W 70- 0 H ....1923 Sept. 29 .............. W 18- 7 H .... 10,0001924 Sept. 27 .............. W 78- 6 H .... 12,0001925 Sept. 26 .............. W 32- 0 H .... 25,0001927 Oct. 22 .............. W 51- 0 H .... 25,000
N1-Athletic Park, Los Angeles
CHAFFEY COLLEGE (1-1-0)
1893 Dec. 11 .............. L 6-32 A ....1897 Nov. 13 .............. W 38- 0 N1... 200
N1-Fiesta Park, Los Angeles
LOYOLA (6-3-1)
1889 .............. W 40- 0 H ....1892 Feb. 22 .............. L 2-10 H ....1897 .............. W 34- 0 H ....1902 Oct. 11 .............. L 5- 6 N1.... 4001903 Oct. 31 .............. W 12- 5 H ....1904 Nov. 5 .............. W frft. H ....1905 Dec. 2 .............. T 0- 0 H ....1909 Oct. 23 ........(3:00) L 6- 8 H .... 1,2001932 Oct. 15 ........(5:00) W 6- 0 H .... 50,0001933 Sept. 30 .............. W 18- 0 H .... 65,000
N1-Fiesta Park, Los Angeles
NON-CONFERENCE RECORD
WYOMING (1-0-0)
1965 Nov. 27 .8- ......... W 56- 6 H .... 39,233
(NOTE: San Diego State, Utah, UNLV and Wyoming are 1999 chartermembers of the Mountain West Conference. Utah and Wyoming were1962 members of the Western Athletic Conference. San Diego State hadbeen a 1969 charter member of the Pacific Coast Athletic Association(Big West Conference) until its withdrawal to join the WAC in 1978. UNLV,which joined the PCAA in 1982, joined the WAC in 1996.)
SOUTHEASTERN (13-10-1)
ALABAMA (2-5-0)
1938 Sept. 24 .............. L 7-19 H .... 70,0001945 Jan. 1* 11- 2......... L 14-34 N1.... c93,0001970 Sept. 12 .3-16......(N) W 42-21 N2.... c72,1751971 Sept. 10 .5-16......(N) L 10-17 H .... 67,7811977 Oct. 8 .1- 7......... L 20-21 H .... 63,1401978 Sept. 23 .7- 1......... W 24-14 N2.... c77,3131985 Dec. 28+ -15......... L 3-24 N3.... 35,183
N1-Rose Bowl, Pasadena, CaliforniaN2-Legion Stadium, Birmingham, AlabamaN3-Aloha Stadium, Honolulu, Hawaii*-1946 Rose Bowl+-1985 Aloha Bowl
ARKANSAS (2-1-0)
1972 Sept. 9 .8- 4......(N) W 31-10 N1.... c54,4611973 Sept. 15 .1- ......(N) W 17- 0 H .... 73,2311974 Sept. 14 .5-20......(N) L 7-22 N1.... c54,622
N1-War Memorial Stadium, Little Rock, Arkansas
AUBURN (0-1-0)
1986 Jan. 1* -10......... L 7-16 N1.... c51,113
N1-Orlando Stadium, Orlando, Florida*-1987 Citrus Bowl
FLORIDA (0-1-1)
1982 Sept. 11 10-11......(N) L 9-17 A .... c73,2381983 Oct. 1 .9-18(SC-0:00) T 19-19 H .... 53,948
GEORGIA (3-0-0)
1931 Dec. 12 .............. W 60- 0 H .... 75,0001933 Dec. 2 .............. W 31- 0 H .... 45,0001960 Oct. 7 ...........(N) W 10- 3 H .... 28,120
LSU (1-1-0)
1979 Sept. 29 .1-20(N)(0:32) W 17-12 A .... c78,3221984 Sept. 29 15- ......... L 3-23 H .... 60,128
SOUTH CAROLINA (1-1-0)
1980 Sept. 20 .4-20......(N) W 23-13 H .... 58,3851983 Oct. 1 ...........(N) L 14-38 A .... c74,200

2002 FOOTBALL MEDIA GUIDE — PAGE 147
OCCIDENTAL (16-5-2)
1895 Nov. 18 .............. L 0-10 N1....1899 Nov. 8 .............. W 11- 0 H ....1899 Nov. 15 .............. T 0- 0 H ....1900 Nov. 10 .............. W 5- 0 A ....1903 Oct. 24 .............. L 0- 5 H .... 6001904 Oct. 29 .............. W 36- 4 H ....1905 Nov. 11 .............. L 0-10 A ....1906 Oct. 13 .............. W 22- 0 H .... 4,0001908 Nov. 7 ...........(U) W 14- 0 H ....1909 Nov. 6 .............. T 3- 3 A .... c3,5001910 Nov. 5 .............. W 6- 0 H .... 5,0001914 Oct. 31 .............. L 13-20 H ....1918 Dec. 21 .............. L 6- 7 H ....1919 Nov. 1 .............. W 27- 0 H .... 5,0001920 Oct. 23 .............. W 48- 7 H ....1921 Oct. 15 .............. W 42- 0 A ....1922 Nov. 4 .............. W 46- 0 H .... 11,0001926 Oct. 16 .............. W 28- 6 H .... 22,0001927 Sept. 24 .............. W 33- 0 H .... 20,0001928 Oct. 27 .............. W 19- 0 H .... 40,0001929 Oct. 19 .............. W 64- 0 H .... 20,0001933 Sept. 23 .............. W 39- 0 H .... 35,0001934 Sept. 22 .............. W 20- 0 H .... 30,000
N1-Athletic Park, Los Angeles
POMONA (13-4-4)
1897 Nov. 25Th .............. W 6- 0 A ....1898 Nov. 24Th .............. W 14-11 N1....1899 Nov. 30Th .............. L 0-12 A .... 2,0001900 Nov. 29Th .............. L 0-11 N2.... 1,2001901 Dec. 7 .......(12:00) L 0- 6 A ....1902 Nov. 15 .............. W 16- 5 N1....1905 Dec. 9 .............. W 6- 4 N1.... 6001906 Nov. 17 .............. W 14- 0 A ....1908 Nov. 14 .....(P-10:00) T 6- 6 A ....1909 Nov. 13 .............. T 0- 0 H ....1910 Nov. 19 ......(P-1:00) T 9- 9 A .... 4,0001914 Nov. 14 .............. L 6-10 A .... 6,0001916 Nov. 25 .............. W 28- 3 H ....1918 Dec. 7 ...........(R) T 0- 0 A ....1919 Oct. 25 .............. W 6- 0 H .... 7,0001920 Oct. 30 .............. W 7- 0 A ....1921 Oct. 29 .............. W 35- 7 H .... 6,0001922 Oct. 7 .............. W 54-13 A ....1923 Oct. 6 .............. W 23- 7 H .... 12,8631924 Oct. 4 .............. W 14- 0 H .... 20,0001925 Oct. 3 .............. W 80- 0 H ....
N1-Fiesta Park, Los AngelesN2-Washington Park, Los Angeles
REDLANDS (4-0-0)
1910 Oct. 29 .............. W 35- 0 A ....1914 Oct. 10 .............. W 41- 0 H ....1914 Nov. 7 .............. W 13- 6 A ....1918 Dec. 25 .............. W 10- 0 H ....
NON-CONFERENCE RECORD
WHITTIER (11-1-0)
1907 Nov. 9 .............. W 46- 0 H .... 8001908 Oct. 17 ...........(R) W 15- 0 H ....1909 Oct. 16 .............. W 22- 2 A ....1910 Nov. 12 .............. W 11- 3 A .... 3001914 Oct. 24 .............. W 17-14 H .... 1,2001915 Dec. 11 .............. L 2-20 N1....1921 Nov. 19 .............. W 14- 0 H .... 12,0001924 Nov. 15 .............. W 51- 0 H .... 15,0001925 Sept. 26 .............. W 74- 0 H .... 25,0001926 Sept. 25 .............. W 74- 0 H .... 15,3001933 Sept. 23 .............. W 51- 0 H .... 35,0001934 Sept. 22 .............. W 40-14 H .... 30,000
(NOTE: Cal Poly San Luis Obispo (SLO) is a member of the Division I-AAAmerican West Conference. Cal Tech in Pasadena, Calif., droppedfootball in 1977. Loyola in Los Angeles, now known as Loyola Marymount,and the successor institution to St. Vincent's College, discontinuedfootball in 1952. Occidental in Los Angeles, Pomona in Claremont, Calif.,now known as Pomona-Pitzer , Redlands in Redlands, Calif., and Whittierin Whittier, Calif., are now members of the Division III Southern CaliforniaIntercollegiate Athletic Conference.)
SUN BELT (7-0-0)
IDAHO (7-0-0)
1922 Nov. 18 .............. W 14- 0 N1.... 12,5001923 Nov. 24 .............. W 9- 0 H .... 30,0001924 Nov. 22 .............. W 13- 0 H .... 45,0001925 Oct. 30 .............. W 51- 7 A .... 5,0001926 Nov. 20 .............. W 28- 6 H .... 17,4001928 Nov. 24 .............. W 28- 7 H .... 10,0001929 Nov. 23 .............. W 72- 0 H .... 20,000
N1-Rose Bowl, Pasadena, California
(NOTE: Idaho, a 1963 charter member of the Division I-AA Big SkyConference, was a member of the Pacific Coast Conference from 1922to 1958, then joined the Division I-A Big West in 1996. When the Big Westdropped football, Idaho joined the Sun Belt Conference in 2001.)
WESTERN ATHLETIC (18-4-1)
FRESNO STATE (0-1-0)
1992 Dec. 29* 23- ...(N)(U) L 7-24 N1.... 58,546
N1-Anaheim Stadium, Anaheim, California*-1992 Freedom Bowl
HAWAI‘I (4-0-0)
1930 Nov. 15 .............. W 52- 0 H .... 17,5001935 Jan. 1* .............. W 38- 6 A .... 12,0001978 Dec. 2 .3- ......(N) W 21- 5 A .... c48,7671999 Sept. 4 21- ......(N) W 62- 7 A .... c50,000
*-Game played January 1, 1936
LOUISIANA TECH (1-0-0)
1998 Nov. 26 -25........ W 45-19 H .... 45,070
PAGE 148 — UNIVERSITY OF SOUTHERN CALIFORNIA
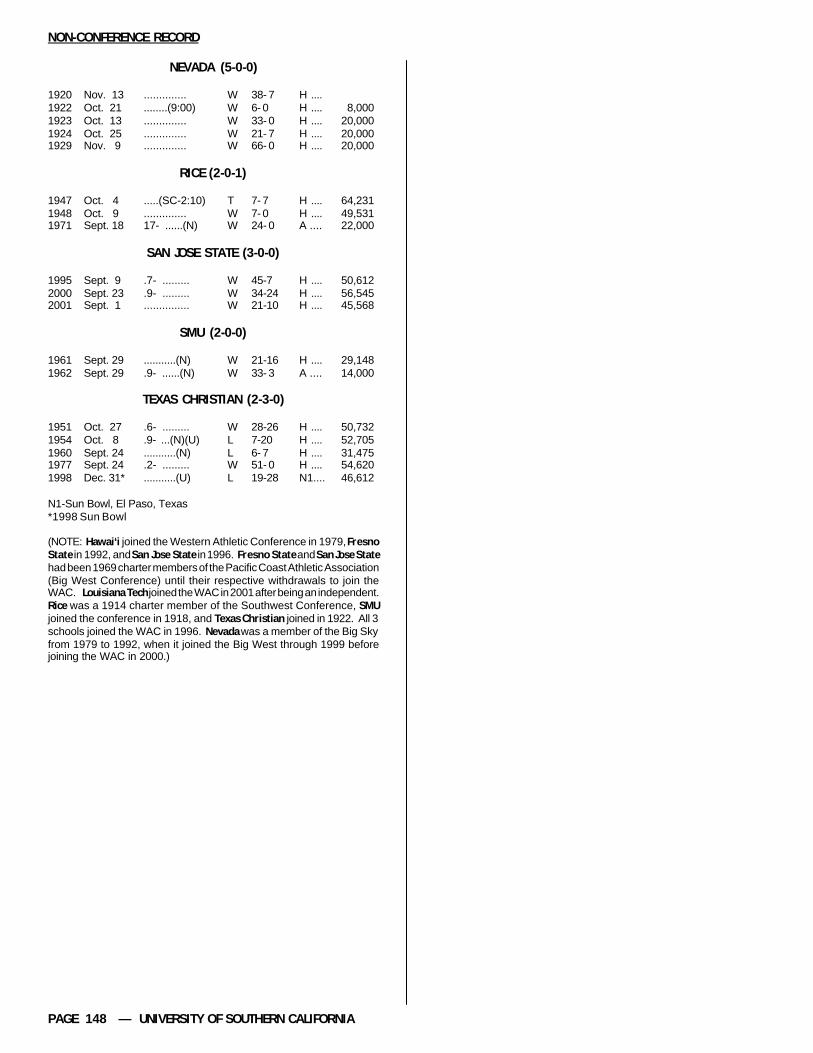
NEVADA (5-0-0)
1920 Nov. 13 .............. W 38- 7 H ....1922 Oct. 21 ........(9:00) W 6- 0 H .... 8,0001923 Oct. 13 .............. W 33- 0 H .... 20,0001924 Oct. 25 .............. W 21- 7 H .... 20,0001929 Nov. 9 .............. W 66- 0 H .... 20,000
RICE (2-0-1)
1947 Oct. 4 .....(SC-2:10) T 7- 7 H .... 64,2311948 Oct. 9 .............. W 7- 0 H .... 49,5311971 Sept. 18 17- ......(N) W 24- 0 A .... 22,000
SAN JOSE STATE (3-0-0)
1995 Sept. 9 .7- ......... W 45-7 H .... 50,6122000 Sept. 23 .9- ......... W 34-24 H .... 56,5452001 Sept. 1 ............... W 21-10 H .... 45,568
SMU (2-0-0)
1961 Sept. 29 ...........(N) W 21-16 H .... 29,1481962 Sept. 29 .9- ......(N) W 33- 3 A .... 14,000
TEXAS CHRISTIAN (2-3-0)
1951 Oct. 27 .6- ......... W 28-26 H .... 50,7321954 Oct. 8 .9- ...(N)(U) L 7-20 H .... 52,7051960 Sept. 24 ...........(N) L 6- 7 H .... 31,4751977 Sept. 24 .2- ......... W 51- 0 H .... 54,6201998 Dec. 31* ...........(U) L 19-28 N1.... 46,612
N1-Sun Bowl, El Paso, Texas*1998 Sun Bowl
(NOTE: Hawai‘i joined the Western Athletic Conference in 1979, FresnoState in 1992, and San Jose State in 1996. Fresno State and San Jose Statehad been 1969 charter members of the Pacific Coast Athletic Association(Big West Conference) until their respective withdrawals to join theWAC. Louisiana Tech joined the WAC in 2001 after being an independent.Rice was a 1914 charter member of the Southwest Conference, SMUjoined the conference in 1918, and Texas Christian joined in 1922. All 3schools joined the WAC in 1996. Nevada was a member of the Big Skyfrom 1979 to 1992, when it joined the Big West through 1999 beforejoining the WAC in 2000.)
NON-CONFERENCE RECORD
2002 FOOTBALL MEDIA GUIDE — PAGE 149
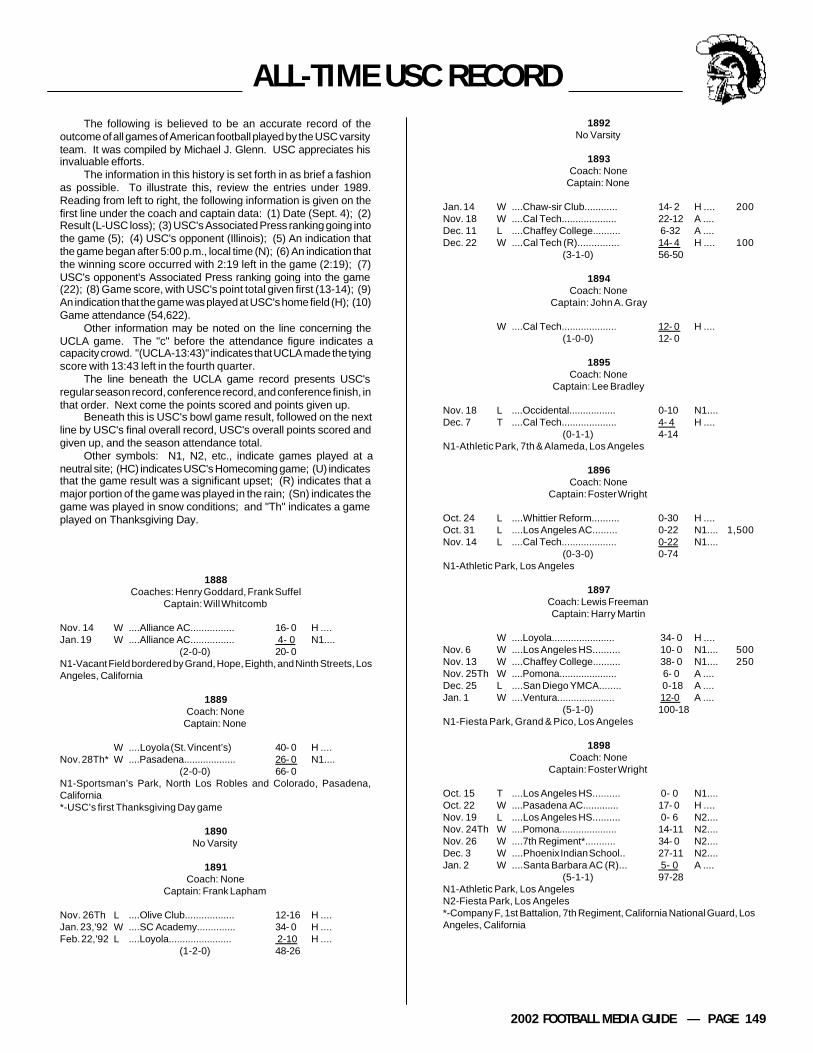
ALL-TIME USC RECORDThe following is believed to be an accurate record of the
outcome of all games of American football played by the USC varsityteam. It was compiled by Michael J. Glenn. USC appreciates hisinvaluable efforts.
The information in this history is set forth in as brief a fashionas possible. To illustrate this, review the entries under 1989.Reading from left to right, the following information is given on thefirst line under the coach and captain data: (1) Date (Sept. 4); (2)Result (L-USC loss); (3) USC's Associated Press ranking going intothe game (5); (4) USC's opponent (Illinois); (5) An indication thatthe game began after 5:00 p.m., local time (N); (6) An indication thatthe winning score occurred with 2:19 left in the game (2:19); (7)USC's opponent's Associated Press ranking going into the game(22); (8) Game score, with USC's point total given first (13-14); (9)An indication that the game was played at USC's home field (H); (10)Game attendance (54,622).
Other information may be noted on the line concerning theUCLA game. The "c" before the attendance figure indicates acapacity crowd. "(UCLA-13:43)" indicates that UCLA made the tyingscore with 13:43 left in the fourth quarter.
The line beneath the UCLA game record presents USC'sregular season record, conference record, and conference finish, inthat order. Next come the points scored and points given up.
Beneath this is USC's bowl game result, followed on the nextline by USC's final overall record, USC's overall points scored andgiven up, and the season attendance total.
Other symbols: N1, N2, etc., indicate games played at aneutral site; (HC) indicates USC's Homecoming game; (U) indicatesthat the game result was a significant upset; (R) indicates that amajor portion of the game was played in the rain; (Sn) indicates thegame was played in snow conditions; and "Th" indicates a gameplayed on Thanksgiving Day.
1888Coaches: Henry Goddard, Frank Suffel
Captain: Will Whitcomb
Nov. 14 W ....Alliance AC................ 16- 0 H ....Jan. 19 W ....Alliance AC................ 4- 0 N1....
(2-0-0) 20- 0N1-Vacant Field bordered by Grand, Hope, Eighth, and Ninth Streets, LosAngeles, California
1889Coach: None
Captain: None
W ....Loyola (St. Vincent’s) 40- 0 H ....Nov. 28Th* W ....Pasadena................... 26- 0 N1....
(2-0-0) 66- 0N1-Sportsman’s Park, North Los Robles and Colorado, Pasadena,California*-USC’s first Thanksgiving Day game
1890No Varsity
1891Coach: None
Captain: Frank Lapham
Nov. 26Th L ....Olive Club.................. 12-16 H ....Jan. 23,'92 W ....SC Academy.............. 34- 0 H ....Feb. 22,'92 L ....Loyola....................... 2-10 H ....
(1-2-0) 48-26
1892No Varsity
1893Coach: None
Captain: None
Jan. 14 W ....Chaw-sir Club............ 14- 2 H .... 200Nov. 18 W ....Cal Tech.................... 22-12 A ....Dec. 11 L ....Chaffey College.......... 6-32 A ....Dec. 22 W ....Cal Tech (R)............... 14- 4 H .... 100
(3-1-0) 56-50
1894Coach: None
Captain: John A. Gray
W ....Cal Tech.................... 12- 0 H ....(1-0-0) 12- 0
1895Coach: None
Captain: Lee Bradley
Nov. 18 L ....Occidental................. 0-10 N1....Dec. 7 T ....Cal Tech.................... 4- 4 H ....
(0-1-1) 4-14N1-Athletic Park, 7th & Alameda, Los Angeles
1896Coach: None
Captain: Foster Wright
Oct. 24 L ....Whittier Reform.......... 0-30 H ....Oct. 31 L ....Los Angeles AC......... 0-22 N1.... 1,500Nov. 14 L ....Cal Tech.................... 0-22 N1....
(0-3-0) 0-74N1-Athletic Park, Los Angeles
1897Coach: Lewis FreemanCaptain: Harry Martin
W ....Loyola....................... 34- 0 H ....Nov. 6 W ....Los Angeles HS.......... 10- 0 N1.... 500Nov. 13 W ....Chaffey College.......... 38- 0 N1.... 250Nov. 25Th W ....Pomona..................... 6- 0 A ....Dec. 25 L ....San Diego YMCA........ 0-18 A ....Jan. 1 W ....Ventura..................... 12-0 A ....
(5-1-0) 100-18N1-Fiesta Park, Grand & Pico, Los Angeles
1898Coach: None
Captain: Foster Wright
Oct. 15 T ....Los Angeles HS.......... 0- 0 N1....Oct. 22 W ....Pasadena AC............. 17- 0 H ....Nov. 19 L ....Los Angeles HS.......... 0- 6 N2....Nov. 24Th W ....Pomona..................... 14-11 N2....Nov. 26 W ....7th Regiment*........... 34- 0 N2....Dec. 3 W ....Phoenix Indian School.. 27-11 N2....Jan. 2 W ....Santa Barbara AC (R)... 5- 0 A ....
(5-1-1) 97-28N1-Athletic Park, Los AngelesN2-Fiesta Park, Los Angeles*-Company F, 1st Battalion, 7th Regiment, California National Guard, LosAngeles, California

PAGE 150 — UNIVERSITY OF SOUTHERN CALIFORNIA
1899Coach: None
Captain: Logan Wheatley
Oct. 21 W ....Whittier Reform.......... 11- 0 H ....Nov. 4 L ....Santa Ana HS............ 0-11 A ....Nov. 8 W ....Occidental................. 11- 0 H ....Nov. 15 T ....Occidental................. 0- 0 H ....Nov. 30Th L ....Pomona..................... 0-12 A .... 2,000Jan. 1 L ....Santa Barbara AC 0-10 A ....
(2-3-1) 22-33
1900Coach: None
Captain: Harry Woodard
Nov. 10 W ....Occidental................. 5- 0 A ....Nov. 24 T ....Los Angeles HS.......... 0- 0 N1....Nov. 29Th L ....Pomona..................... 0-11 N1.... 1,200
(1-1-1) 5-11N1-Washington Park, Washington & Grand, Los Angeles
1901Coach: Clair Tappaan
Captain: Logan Wheatley
Dec. 7 L ....Pomona (12:00)......... 0- 6 A ....(0-1-0) 0- 6
1902Coach: None
Captain: Dan Caley
Oct. 11 L ....Loyola....................... 5- 6 N1 .... 400Oct. 25 L ....Santa Ana................. 2- 5 A ....Nov. 7 W ....Santa Ana................. 6- 0 H ....Nov. 15 W ....Pomona..................... 16- 5 N1....Nov. 22 L ....Sherman Institute....... 0-28 A ....
(2-3-0) 29-44N1-Fiesta Park, Los Angeles
1903Coach: John WalkerCaptain: Dan Caley
Oct. 10 W ....Cal Tech.................... 5- 0 H .... 500Oct. 17 W ....Los Angeles HS.......... 10- 0* H .... 500Oct. 24 L ....Occidental................. 0- 5 H .... 600Oct. 31 W ....Loyola....................... 12- 5 H ....Nov. 7 W ....Orange AC................. 31- 5 H ....Nov. 14 L ....Sherman Institute....... 0-12 H ....
(4-2-0) 58-27All USC home games in 1903 played at Prager Park, near Washington &Grand, Los Angeles*-Los Angeles HS left field of play with several minutes left, in protest overpenalty called by umpire Dean Cromwell; USC awarded five points tomake final score 10-0
1904Coach: Harvey HolmesCaptain: Jay Bickford
Oct. 15 W ....Los Angeles HS.......... 42- 0 N1.... 1,600Oct. 22 W ....Cal Tech.................... 35- 0 H .... 200Oct. 29 W ....Occidental................. 36- 4 H ....Nov. 5 W ....Loyola....................... frft.* H ....Nov. 5 W ....SC Prep..................... 26- 0 H ....Nov. 12 L ....Sherman Institute....... 0-17+ N2....Nov. 19 W ....Whittier Reform.......... 60-6 A.....
(6-1-0) 199-27N1-Fiesta Park, Los AngelesN2-Eagle Park, Long Beach, California*-Opposing coaches could not agree on time of halves, game awarded toUSC; game against USC prep students played instead+-Game called, midway through second half, darkness
1905Coach: Harvey Holmes
Captain: Carl Elliott
Oct. 4 W ....National Guard#......... 28- 0 H ....Oct. 10 W ....Harvard School.......... 12- 0% H .... 300Oct. 16 W ....LA Poly HS................ 27- 0 H ....Oct. 18 W ....Whittier Reform.......... 75- 0+ H ....Nov. 1 W ....Alumni...................... 63- 0 H ....Nov. 4 L ....Stanford.................... 0-16* A ....Nov. 11 L ....Occidental................. 0-10 A ....Nov. 25 L ....Sherman Institute....... 0-15 N1.... 800Dec. 2 T ....Loyola....................... 0- 0 H ....Dec. 9 W ....Pomona.................... 6- 4 N1.... 600
(6-3-1) 211-45N1-Fiesta Park, Los Angeles#-Company F%-Because of “deficiencies” of Harvard roster, Harvard’s coach, USC’scoach, and Dean Cromwell played for Harvard+-15-minute halves*-First USC game played outside Southern California
1906Coach: Harvey Holmes
Captain: Oliver Best
Oct. 6 T ....Los Angeles HS.......... 0- 0 N1....Oct. 13 W ....Occidental................. 22- 0 H .... 4,000Nov. 17 W ....Pomona..................... 14- 0 A ....Nov. 29Th T ....Sherman Institute....... 0- 0 N1.... 4,000
(2-0-2) 36-0N1-Fiesta Park, Los Angeles
1907Coach: Harvey Holmes
Captain: Charley Haigler
Oct. 12 W ....Los Angeles HS.......... 6- 0 N1.... 2,000Oct. 16 W ....Whittier Reform.......... 57- 0 H ....Oct. 26 W ....Santa Ana HS............ 51- 0 A ....Nov. 9 W ....Whittier..................... 46- 0 H .... 800Nov. 15 W ....USS Colorado............ 16- 4 H .... 1,200Dec. 25 L ....Los Angeles HS.......... 6-16 N1.... 2,200
(5-1-0) 182-20N1-Fiesta Park, Los Angeles
1908Coach: Bill TraegerCaptain: Stan Burek
Oct. 10 L ....Los Angeles HS.......... 0-12 N1.... 2,500Oct. 17 W ....Whittier (R)................ 15- 0 H ....Oct. 24 W ....Arrowhead AC........... 28- 0 A ....Nov. 7 W ....Occidental (U)............ 14- 0* H ....Nov. 14 T ....Pomona (P-10:00)...... 6- 6 A ....
(3-1-1) 63-18N1-Fiesta Park, Los Angeles*-50th USC victory
1909Coach: Dean Cromwell
Captain: Hal Paulin
Oct. 9 W ....Cal Poly SLO.............. 51- 0 A ....Oct. 16 W ....Whittier..................... 22- 2 A ....Oct. 23 L ....Loyola (3:00)............. 6- 8 H .... 1,200Oct. 30 W ....Orange AC................. 51- 0 H ....Nov. 6 T ....Occidental................. 3- 3 A .... c3,500Nov. 13 T ....Pomona..................... 0- 0 H ....
(3-1-2) 133-13
ALL-TIME USC RECORD
2002 FOOTBALL MEDIA GUIDE — PAGE 151
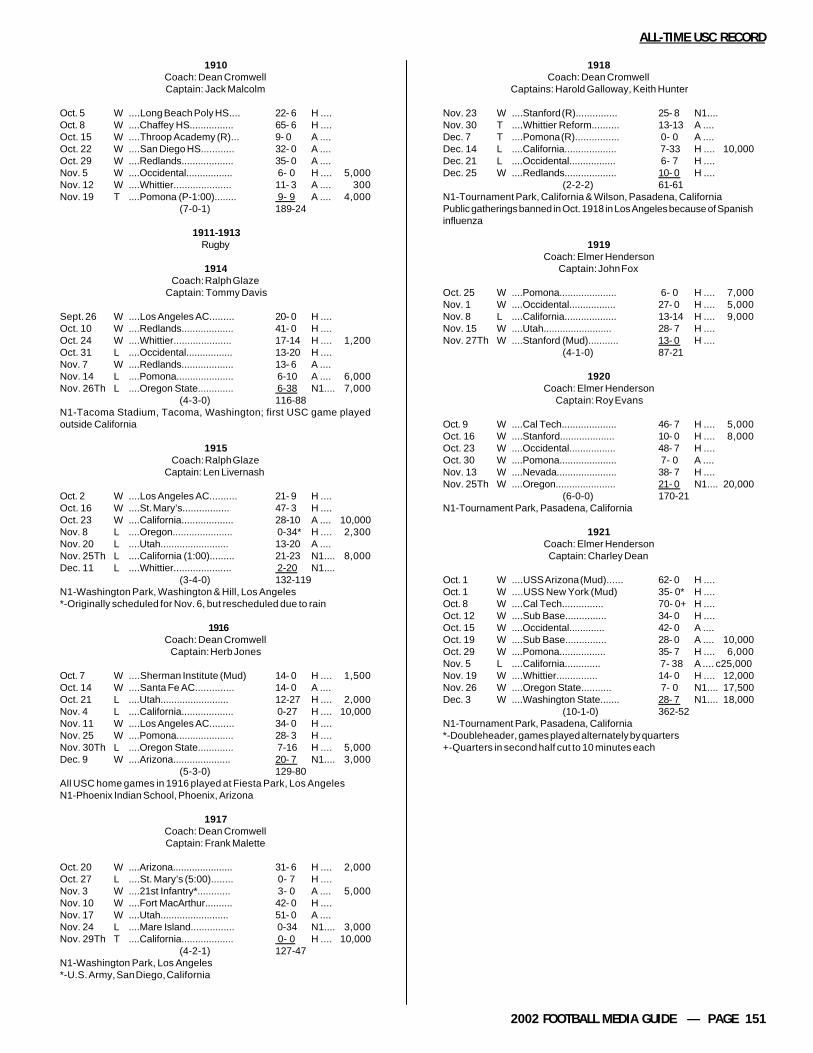
1910Coach: Dean CromwellCaptain: Jack Malcolm
Oct. 5 W ....Long Beach Poly HS.... 22- 6 H ....Oct. 8 W ....Chaffey HS................ 65- 6 H ....Oct. 15 W ....Throop Academy (R)... 9- 0 A ....Oct. 22 W ....San Diego HS............ 32- 0 A ....Oct. 29 W ....Redlands................... 35- 0 A ....Nov. 5 W ....Occidental................. 6- 0 H .... 5,000Nov. 12 W ....Whittier..................... 11- 3 A .... 300Nov. 19 T ....Pomona (P-1:00)........ 9- 9 A .... 4,000
(7-0-1) 189-24
1911-1913Rugby
1914Coach: Ralph Glaze
Captain: Tommy Davis
Sept. 26 W ....Los Angeles AC......... 20- 0 H ....Oct. 10 W ....Redlands................... 41- 0 H ....Oct. 24 W ....Whittier..................... 17-14 H .... 1,200Oct. 31 L ....Occidental................. 13-20 H ....Nov. 7 W ....Redlands................... 13- 6 A ....Nov. 14 L ....Pomona..................... 6-10 A .... 6,000Nov. 26Th L ....Oregon State............. 6-38 N1.... 7,000
(4-3-0) 116-88N1-Tacoma Stadium, Tacoma, Washington; first USC game playedoutside California
1915Coach: Ralph Glaze
Captain: Len Livernash
Oct. 2 W ....Los Angeles AC.......... 21- 9 H ....Oct. 16 W ....St. Mary’s................. 47- 3 H ....Oct. 23 W ....California................... 28-10 A .... 10,000Nov. 8 L ....Oregon...................... 0-34* H .... 2,300Nov. 20 L ....Utah......................... 13-20 A ....Nov. 25Th L ....California (1:00)......... 21-23 N1.... 8,000Dec. 11 L ....Whittier..................... 2-20 N1....
(3-4-0) 132-119N1-Washington Park, Washington & Hill, Los Angeles*-Originally scheduled for Nov. 6, but rescheduled due to rain
1916Coach: Dean Cromwell
Captain: Herb Jones
Oct. 7 W ....Sherman Institute (Mud) 14- 0 H .... 1,500Oct. 14 W ....Santa Fe AC.............. 14- 0 A ....Oct. 21 L ....Utah......................... 12-27 H .... 2,000Nov. 4 L ....California................... 0-27 H .... 10,000Nov. 11 W ....Los Angeles AC......... 34- 0 H ....Nov. 25 W ....Pomona..................... 28- 3 H ....Nov. 30Th L ....Oregon State............. 7-16 H .... 5,000Dec. 9 W ....Arizona..................... 20- 7 N1.... 3,000
(5-3-0) 129-80All USC home games in 1916 played at Fiesta Park, Los AngelesN1-Phoenix Indian School, Phoenix, Arizona
1917Coach: Dean CromwellCaptain: Frank Malette
Oct. 20 W ....Arizona...................... 31- 6 H .... 2,000Oct. 27 L ....St. Mary’s (5:00)........ 0- 7 H ....Nov. 3 W ....21st Infantry*............ 3- 0 A .... 5,000Nov. 10 W ....Fort MacArthur.......... 42- 0 H ....Nov. 17 W ....Utah......................... 51- 0 A ....Nov. 24 L ....Mare Island................ 0-34 N1.... 3,000Nov. 29Th T ....California................... 0- 0 H .... 10,000
(4-2-1) 127-47N1-Washington Park, Los Angeles*-U.S. Army, San Diego, California
1918Coach: Dean Cromwell
Captains: Harold Galloway, Keith Hunter
Nov. 23 W ....Stanford (R)............... 25- 8 N1....Nov. 30 T ....Whittier Reform.......... 13-13 A ....Dec. 7 T ....Pomona (R)................ 0- 0 A ....Dec. 14 L ....California................... 7-33 H .... 10,000Dec. 21 L ....Occidental................. 6- 7 H ....Dec. 25 W ....Redlands................... 10- 0 H ....
(2-2-2) 61-61N1-Tournament Park, California & Wilson, Pasadena, CaliforniaPublic gatherings banned in Oct. 1918 in Los Angeles because of Spanishinfluenza
1919Coach: Elmer Henderson
Captain: John Fox
Oct. 25 W ....Pomona..................... 6- 0 H .... 7,000Nov. 1 W ....Occidental................. 27- 0 H .... 5,000Nov. 8 L ....California................... 13-14 H .... 9,000Nov. 15 W ....Utah......................... 28- 7 H ....Nov. 27Th W ....Stanford (Mud)........... 13- 0 H ....
(4-1-0) 87-21
1920Coach: Elmer Henderson
Captain: Roy Evans
Oct. 9 W ....Cal Tech.................... 46- 7 H .... 5,000Oct. 16 W ....Stanford.................... 10- 0 H .... 8,000Oct. 23 W ....Occidental................. 48- 7 H ....Oct. 30 W ....Pomona..................... 7- 0 A ....Nov. 13 W ....Nevada...................... 38- 7 H ....Nov. 25Th W ....Oregon...................... 21- 0 N1.... 20,000
(6-0-0) 170-21N1-Tournament Park, Pasadena, California
1921Coach: Elmer HendersonCaptain: Charley Dean
Oct. 1 W ....USS Arizona (Mud)...... 62- 0 H ....Oct. 1 W ....USS New York (Mud) 35- 0* H ....Oct. 8 W ....Cal Tech............... 70- 0+ H ....Oct. 12 W ....Sub Base............... 34- 0 H ....Oct. 15 W ....Occidental............. 42- 0 A ....Oct. 19 W ....Sub Base............... 28- 0 A .... 10,000Oct. 29 W ....Pomona................. 35- 7 H .... 6,000Nov. 5 L ....California............. 7- 38 A .... c25,000Nov. 19 W ....Whittier............... 14- 0 H .... 12,000Nov. 26 W ....Oregon State........... 7- 0 N1.... 17,500Dec. 3 W ....Washington State....... 28- 7 N1.... 18,000
(10-1-0) 362-52N1-Tournament Park, Pasadena, California*-Doubleheader, games played alternately by quarters+-Quarters in second half cut to 10 minutes each
ALL-TIME USC RECORD
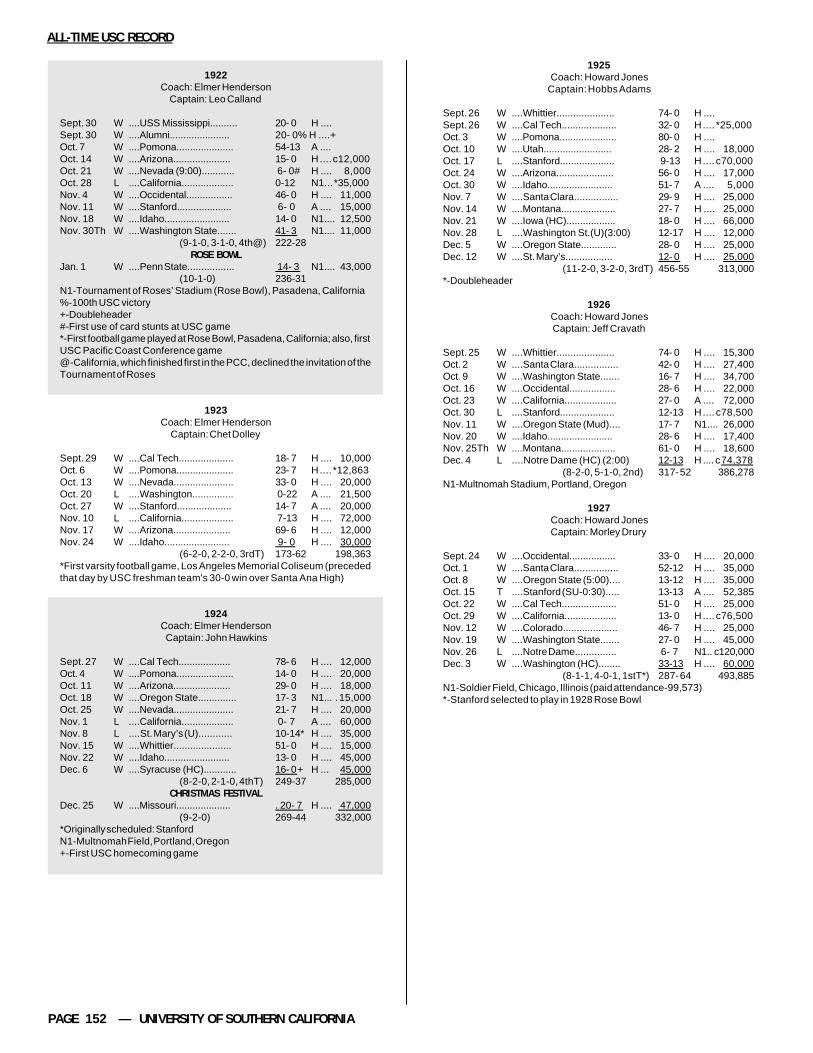
PAGE 152 — UNIVERSITY OF SOUTHERN CALIFORNIA
1922Coach: Elmer Henderson
Captain: Leo Calland
Sept. 30 W ....USS Mississippi.......... 20- 0 H ....Sept. 30 W ....Alumni...................... 20- 0% H ....+Oct. 7 W ....Pomona..................... 54-13 A ....Oct. 14 W ....Arizona..................... 15- 0 H .... c12,000Oct. 21 W ....Nevada (9:00)............ 6- 0# H .... 8,000Oct. 28 L ....California................... 0-12 N1... *35,000Nov. 4 W ....Occidental................. 46- 0 H .... 11,000Nov. 11 W ....Stanford.................... 6- 0 A .... 15,000Nov. 18 W ....Idaho........................ 14- 0 N1.... 12,500Nov. 30Th W ....Washington State....... 41- 3 N1.... 11,000
(9-1-0, 3-1-0, 4th@) 222-28ROSE BOWL
Jan. 1 W ....Penn State................. 14- 3 N1.... 43,000(10-1-0) 236-31
N1-Tournament of Roses’ Stadium (Rose Bowl), Pasadena, California%-100th USC victory+-Doubleheader#-First use of card stunts at USC game*-First football game played at Rose Bowl, Pasadena, California; also, firstUSC Pacific Coast Conference game@-California, which finished first in the PCC, declined the invitation of theTournament of Roses
1923Coach: Elmer Henderson
Captain: Chet Dolley
Sept. 29 W ....Cal Tech.................... 18- 7 H .... 10,000Oct. 6 W ....Pomona..................... 23- 7 H .... *12,863Oct. 13 W ....Nevada...................... 33- 0 H .... 20,000Oct. 20 L ....Washington............... 0-22 A .... 21,500Oct. 27 W ....Stanford.................... 14- 7 A .... 20,000Nov. 10 L ....California................... 7-13 H .... 72,000Nov. 17 W ....Arizona..................... 69- 6 H .... 12,000Nov. 24 W ....Idaho........................ 9- 0 H .... 30,000
(6-2-0, 2-2-0, 3rdT) 173-62 198,363*First varsity football game, Los Angeles Memorial Coliseum (precededthat day by USC freshman team's 30-0 win over Santa Ana High)
1924Coach: Elmer HendersonCaptain: John Hawkins
Sept. 27 W ....Cal Tech................... 78- 6 H .... 12,000Oct. 4 W ....Pomona..................... 14- 0 H .... 20,000Oct. 11 W ....Arizona..................... 29- 0 H .... 18,000Oct. 18 W ....Oregon State.............. 17- 3 N1... . 15,000Oct. 25 W ....Nevada...................... 21- 7 H .... 20,000Nov. 1 L ....California................... 0- 7 A .... 60,000Nov. 8 L ....St. Mary’s (U)............ 10-14* H .... 35,000Nov. 15 W ....Whittier..................... 51- 0 H .... 15,000Nov. 22 W ....Idaho........................ 13- 0 H .... 45,000Dec. 6 W ....Syracuse (HC)............ 16- 0+ H ... 45,000
(8-2-0, 2-1-0, 4thT) 249-37 285,000CHRISTMAS FESTIVAL
Dec. 25 W ....Missouri.................... . 20- 7 H .... 47,000(9-2-0) 269-44 332,000
*Originally scheduled: StanfordN1-Multnomah Field, Portland, Oregon+-First USC homecoming game
1925Coach: Howard Jones
Captain: Hobbs Adams
Sept. 26 W ....Whittier..................... 74- 0 H ....Sept. 26 W ....Cal Tech.................... 32- 0 H .... *25,000Oct. 3 W ....Pomona..................... 80- 0 H ....Oct. 10 W ....Utah......................... 28- 2 H .... 18,000Oct. 17 L ....Stanford.................... 9-13 H .... c70,000Oct. 24 W ....Arizona..................... 56- 0 H .... 17,000Oct. 30 W ....Idaho........................ 51- 7 A .... 5,000Nov. 7 W ....Santa Clara................ 29- 9 H .... 25,000Nov. 14 W ....Montana.................... 27- 7 H .... 25,000Nov. 21 W ....Iowa (HC).................. 18- 0 H .... 66,000Nov. 28 L ....Washington St.(U)(3:00) 12-17 H .... 12,000Dec. 5 W ....Oregon State............. 28- 0 H .... 25,000Dec. 12 W ....St. Mary’s................. 12- 0 H .... 25,000
(11-2-0, 3-2-0, 3rdT) 456-55 313,000*-Doubleheader
1926Coach: Howard JonesCaptain: Jeff Cravath
Sept. 25 W ....Whittier..................... 74- 0 H .... 15,300Oct. 2 W ....Santa Clara................ 42- 0 H .... 27,400Oct. 9 W ....Washington State....... 16- 7 H .... 34,700Oct. 16 W ....Occidental................. 28- 6 H .... 22,000Oct. 23 W ....California................... 27- 0 A .... 72,000Oct. 30 L ....Stanford.................... 12-13 H .... c78,500Nov. 11 W ....Oregon State (Mud).... 17- 7 N1.... 26,000Nov. 20 W ....Idaho........................ 28- 6 H .... 17,400Nov. 25Th W ....Montana.................... 61- 0 H .... 18,600Dec. 4 L ....Notre Dame (HC) (2:00) 12-13 H .... c74,378
(8-2-0, 5-1-0, 2nd) 317- 52 386,278N1-Multnomah Stadium, Portland, Oregon
1927Coach: Howard JonesCaptain: Morley Drury
Sept. 24 W ....Occidental................. 33- 0 H .... 20,000Oct. 1 W ....Santa Clara................ 52-12 H .... 35,000Oct. 8 W ....Oregon State (5:00).... 13-12 H .... 35,000Oct. 15 T ....Stanford (SU-0:30)..... 13-13 A .... 52,385Oct. 22 W ....Cal Tech.................... 51- 0 H .... 25,000Oct. 29 W ....California................... 13- 0 H .... c76,500Nov. 12 W ....Colorado.................... 46- 7 H .... 25,000Nov. 19 W ....Washington State....... 27- 0 H .... 45,000Nov. 26 L ....Notre Dame............... 6- 7 N1.. c120,000Dec. 3 W ....Washington (HC)........ 33-13 H .... 60,000
(8-1-1, 4-0-1, 1stT*) 287- 64 493,885N1-Soldier Field, Chicago, Illinois (paid attendance-99,573)*-Stanford selected to play in 1928 Rose Bowl
ALL-TIME USC RECORD
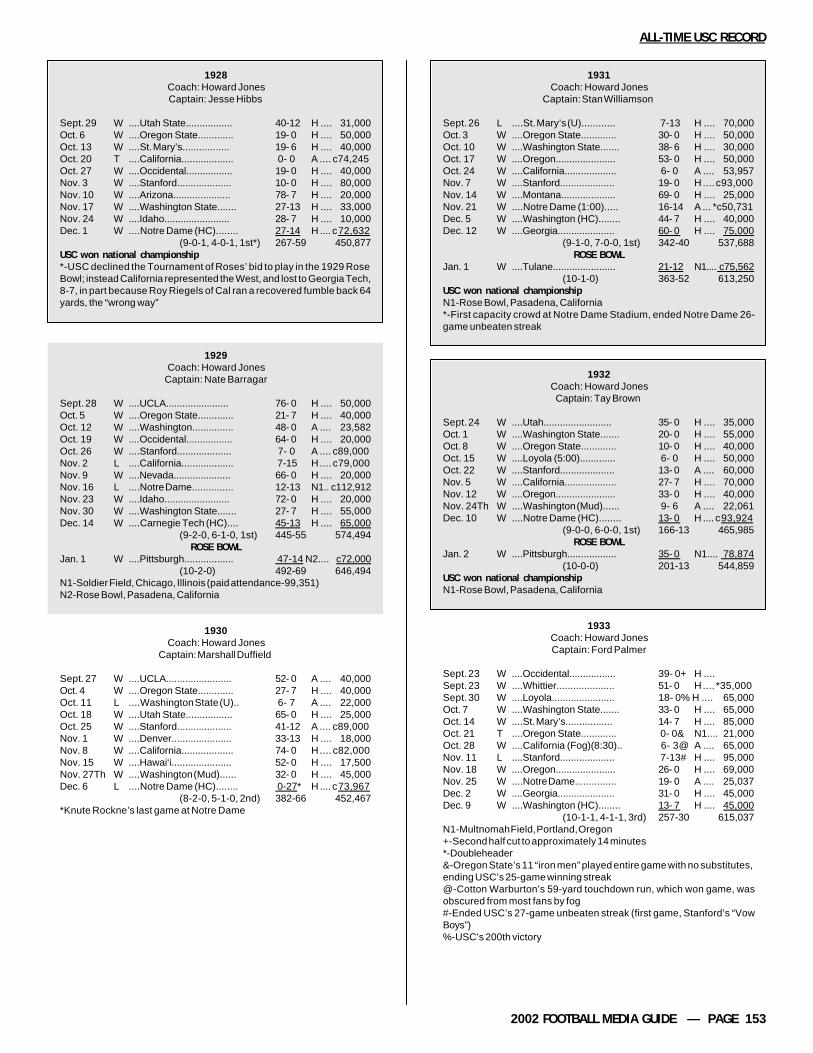
2002 FOOTBALL MEDIA GUIDE — PAGE 153
1928Coach: Howard JonesCaptain: Jesse Hibbs
Sept. 29 W ....Utah State................. 40-12 H .... 31,000Oct. 6 W ....Oregon State............. 19- 0 H .... 50,000Oct. 13 W ....St. Mary’s................. 19- 6 H .... 40,000Oct. 20 T ....California................... 0- 0 A .... c74,245Oct. 27 W ....Occidental................. 19- 0 H .... 40,000Nov. 3 W ....Stanford.................... 10- 0 H .... 80,000Nov. 10 W ....Arizona..................... 78- 7 H .... 20,000Nov. 17 W ....Washington State....... 27-13 H .... 33,000Nov. 24 W ....Idaho........................ 28- 7 H .... 10,000Dec. 1 W ....Notre Dame (HC)........ 27-14 H .... c72,632
(9-0-1, 4-0-1, 1st*) 267-59 450,877USC won national championship*-USC declined the Tournament of Roses’ bid to play in the 1929 RoseBowl; instead California represented the West, and lost to Georgia Tech,8-7, in part because Roy Riegels of Cal ran a recovered fumble back 64yards, the “wrong way”
1931Coach: Howard Jones
Captain: Stan Williamson
Sept. 26 L ....St. Mary’s (U)............ 7-13 H .... 70,000Oct. 3 W ....Oregon State............. 30- 0 H .... 50,000Oct. 10 W ....Washington State....... 38- 6 H .... 30,000Oct. 17 W ....Oregon...................... 53- 0 H .... 50,000Oct. 24 W ....California................... 6- 0 A .... 53,957Nov. 7 W ....Stanford.................... 19- 0 H .... c93,000Nov. 14 W ....Montana.................... 69- 0 H .... 25,000Nov. 21 W ....Notre Dame (1:00)..... 16-14 A ... *c50,731Dec. 5 W ....Washington (HC)........ 44- 7 H .... 40,000Dec. 12 W ....Georgia..................... 60- 0 H .... 75,000
(9-1-0, 7-0-0, 1st) 342-40 537,688ROSE BOWL
Jan. 1 W ....Tulane....................... 21-12 N1.... c75,562(10-1-0) 363-52 613,250
USC won national championshipN1-Rose Bowl, Pasadena, California*-First capacity crowd at Notre Dame Stadium, ended Notre Dame 26-game unbeaten streak
ALL-TIME USC RECORD
1929Coach: Howard Jones
Captain: Nate Barragar
Sept. 28 W ....UCLA....................... 76- 0 H .... 50,000Oct. 5 W ....Oregon State............. 21- 7 H .... 40,000Oct. 12 W ....Washington............... 48- 0 A .... 23,582Oct. 19 W ....Occidental................. 64- 0 H .... 20,000Oct. 26 W ....Stanford.................... 7- 0 A .... c89,000Nov. 2 L ....California................... 7-15 H .... c79,000Nov. 9 W ....Nevada..................... 66- 0 H .... 20,000Nov. 16 L ....Notre Dame............... 12-13 N1.. c112,912Nov. 23 W ....Idaho........................ 72- 0 H .... 20,000Nov. 30 W ....Washington State....... 27- 7 H .... 55,000Dec. 14 W ....Carnegie Tech (HC).... 45-13 H .... 65,000
(9-2-0, 6-1-0, 1st) 445-55 574,494ROSE BOWL
Jan. 1 W ....Pittsburgh.................. 47-14 N2.... c72,000(10-2-0) 492-69 646,494
N1-Soldier Field, Chicago, Illinois (paid attendance-99,351)N2-Rose Bowl, Pasadena, California
1930Coach: Howard Jones
Captain: Marshall Duffield
Sept. 27 W ....UCLA........................ 52- 0 A .... 40,000Oct. 4 W ....Oregon State............. 27- 7 H .... 40,000Oct. 11 L ....Washington State (U).. 6- 7 A .... 22,000Oct. 18 W ....Utah State................. 65- 0 H .... 25,000Oct. 25 W ....Stanford.................... 41-12 A .... c89,000Nov. 1 W ....Denver...................... 33-13 H .... 18,000Nov. 8 W ....California................... 74- 0 H .... c82,000Nov. 15 W ....Hawai‘i...................... 52- 0 H .... 17,500Nov. 27Th W ....Washington (Mud)...... 32- 0 H .... 45,000Dec. 6 L ....Notre Dame (HC)........ 0-27* H .... c73,967
(8-2-0, 5-1-0, 2nd) 382-66 452,467*Knute Rockne’s last game at Notre Dame
1932Coach: Howard JonesCaptain: Tay Brown
Sept. 24 W ....Utah......................... 35- 0 H .... 35,000Oct. 1 W ....Washington State....... 20- 0 H .... 55,000Oct. 8 W ....Oregon State............. 10- 0 H .... 40,000Oct. 15 W ....Loyola (5:00)............. 6- 0 H .... 50,000Oct. 22 W ....Stanford.................... 13- 0 A .... 60,000Nov. 5 W ....California................... 27- 7 H .... 70,000Nov. 12 W ....Oregon...................... 33- 0 H .... 40,000Nov. 24Th W ....Washington (Mud)...... 9- 6 A .... 22,061Dec. 10 W ....Notre Dame (HC)........ 13- 0 H .... c93,924
(9-0-0, 6-0-0, 1st) 166-13 465,985ROSE BOWL
Jan. 2 W ....Pittsburgh.................. 35- 0 N1.... 78,874(10-0-0) 201-13 544,859
USC won national championshipN1-Rose Bowl, Pasadena, California
1933Coach: Howard JonesCaptain: Ford Palmer
Sept. 23 W ....Occidental................. 39- 0+ H ....Sept. 23 W ....Whittier..................... 51- 0 H .... *35,000Sept. 30 W ....Loyola....................... 18- 0% H .... 65,000Oct. 7 W ....Washington State....... 33- 0 H .... 65,000Oct. 14 W ....St. Mary’s................. 14- 7 H .... 85,000Oct. 21 T ....Oregon State............. 0- 0& N1.... 21,000Oct. 28 W ....California (Fog)(8:30).. 6- 3@ A .... 65,000Nov. 11 L ....Stanford.................... 7-13# H .... 95,000Nov. 18 W ....Oregon...................... 26- 0 H .... 69,000Nov. 25 W ....Notre Dame............... 19- 0 A .... 25,037Dec. 2 W ....Georgia..................... 31- 0 H .... 45,000Dec. 9 W ....Washington (HC)........ 13- 7 H .... 45,000
(10-1-1, 4-1-1, 3rd) 257-30 615,037N1-Multnomah Field, Portland, Oregon+-Second half cut to approximately 14 minutes*-Doubleheader&-Oregon State’s 11 “iron men” played entire game with no substitutes,ending USC’s 25-game winning streak@-Cotton Warburton’s 59-yard touchdown run, which won game, wasobscured from most fans by fog#-Ended USC’s 27-game unbeaten streak (first game, Stanford’s “VowBoys”)%-USC’s 200th victory
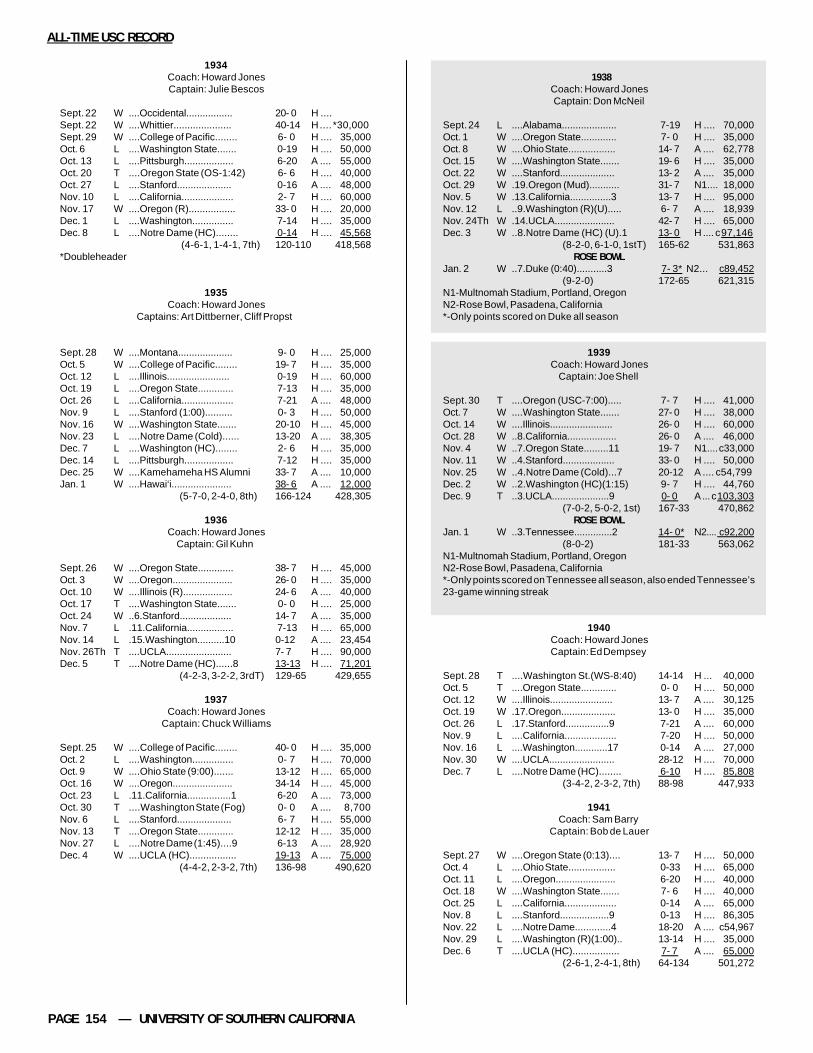
PAGE 154 — UNIVERSITY OF SOUTHERN CALIFORNIA
1934Coach: Howard JonesCaptain: Julie Bescos
Sept. 22 W ....Occidental................. 20- 0 H ....Sept. 22 W ....Whittier..................... 40-14 H .... *30,000Sept. 29 W ....College of Pacific........ 6- 0 H .... 35,000Oct. 6 L ....Washington State....... 0-19 H .... 50,000Oct. 13 L ....Pittsburgh.................. 6-20 A .... 55,000Oct. 20 T ....Oregon State (OS-1:42) 6- 6 H .... 40,000Oct. 27 L ....Stanford.................... 0-16 A .... 48,000Nov. 10 L ....California................... 2- 7 H .... 60,000Nov. 17 W ....Oregon (R)................. 33- 0 H .... 20,000Dec. 1 L ....Washington............... 7-14 H .... 35,000Dec. 8 L ....Notre Dame (HC)........ 0-14 H .... 45,568
(4-6-1, 1-4-1, 7th) 120-110 418,568*Doubleheader
1935Coach: Howard Jones
Captains: Art Dittberner, Cliff Propst
Sept. 28 W ....Montana.................... 9- 0 H .... 25,000Oct. 5 W ....College of Pacific........ 19- 7 H .... 35,000Oct. 12 L ....Illinois....................... 0-19 H .... 60,000Oct. 19 L ....Oregon State............. 7-13 H .... 35,000Oct. 26 L ....California................... 7-21 A .... 48,000Nov. 9 L ....Stanford (1:00).......... 0- 3 H .... 50,000Nov. 16 W ....Washington State....... 20-10 H .... 45,000Nov. 23 L ....Notre Dame (Cold)...... 13-20 A .... 38,305Dec. 7 L ....Washington (HC)........ 2- 6 H .... 35,000Dec. 14 L ....Pittsburgh.................. 7-12 H .... 35,000Dec. 25 W ....Kamehameha HS Alumni 33- 7 A .... 10,000Jan. 1 W ....Hawai‘i...................... 38- 6 A .... 12,000
(5-7-0, 2-4-0, 8th) 166-124 428,305
1936Coach: Howard Jones
Captain: Gil Kuhn
Sept. 26 W ....Oregon State............. 38- 7 H .... 45,000Oct. 3 W ....Oregon...................... 26- 0 H .... 35,000Oct. 10 W ....Illinois (R).................. 24- 6 A .... 40,000Oct. 17 T ....Washington State....... 0- 0 H .... 25,000Oct. 24 W ..6.Stanford................... 14- 7 A .... 35,000Nov. 7 L .11.California................. 7-13 H .... 65,000Nov. 14 L .15.Washington..........10 0-12 A .... 23,454Nov. 26Th T ....UCLA........................ 7- 7 H .... 90,000Dec. 5 T ....Notre Dame (HC)......8 13-13 H .... 71,201
(4-2-3, 3-2-2, 3rdT) 129-65 429,655
1937Coach: Howard Jones
Captain: Chuck Williams
Sept. 25 W ....College of Pacific........ 40- 0 H .... 35,000Oct. 2 L ....Washington............... 0- 7 H .... 70,000Oct. 9 W ....Ohio State (9:00)....... 13-12 H .... 65,000Oct. 16 W ....Oregon...................... 34-14 H .... 45,000Oct. 23 L .11.California................1 6-20 A .... 73,000Oct. 30 T ....Washington State (Fog) 0- 0 A .... 8,700Nov. 6 L ....Stanford.................... 6- 7 H .... 55,000Nov. 13 T ....Oregon State............. 12-12 H .... 35,000Nov. 27 L ....Notre Dame (1:45)....9 6-13 A .... 28,920Dec. 4 W ....UCLA (HC)................. 19-13 A .... 75,000
(4-4-2, 2-3-2, 7th) 136-98 490,620
1938Coach: Howard JonesCaptain: Don McNeil
Sept. 24 L ....Alabama.................... 7-19 H .... 70,000Oct. 1 W ....Oregon State............. 7- 0 H .... 35,000Oct. 8 W ....Ohio State................. 14- 7 A .... 62,778Oct. 15 W ....Washington State....... 19- 6 H .... 35,000Oct. 22 W ....Stanford.................... 13- 2 A .... 35,000Oct. 29 W .19.Oregon (Mud)........... 31- 7 N1.... 18,000Nov. 5 W .13.California...............3 13- 7 H .... 95,000Nov. 12 L ..9.Washington (R)(U)..... 6- 7 A .... 18,939Nov. 24Th W .14.UCLA...................... 42- 7 H .... 65,000Dec. 3 W ..8.Notre Dame (HC) (U).1 13- 0 H .... c97,146
(8-2-0, 6-1-0, 1stT) 165-62 531,863ROSE BOWL
Jan. 2 W ..7.Duke (0:40)...........3 7- 3* N2... c89,452(9-2-0) 172-65 621,315
N1-Multnomah Stadium, Portland, OregonN2-Rose Bowl, Pasadena, California*-Only points scored on Duke all season
1939Coach: Howard Jones
Captain: Joe Shell
Sept. 30 T ....Oregon (USC-7:00)..... 7- 7 H .... 41,000Oct. 7 W ....Washington State....... 27- 0 H .... 38,000Oct. 14 W ....Illinois....................... 26- 0 H .... 60,000Oct. 28 W ..8.California.................. 26- 0 A .... 46,000Nov. 4 W ..7.Oregon State.........11 19- 7 N1.... c33,000Nov. 11 W ..4.Stanford................... 33- 0 H .... 50,000Nov. 25 W ..4.Notre Dame (Cold)...7 20-12 A .... c54,799Dec. 2 W ..2.Washington (HC)(1:15) 9- 7 H .... 44,760Dec. 9 T ..3.UCLA.....................9 0- 0 A ... c103,303
(7-0-2, 5-0-2, 1st) 167-33 470,862ROSE BOWL
Jan. 1 W ..3.Tennessee..............2 14- 0* N2.... c92,200(8-0-2) 181-33 563,062
N1-Multnomah Stadium, Portland, OregonN2-Rose Bowl, Pasadena, California*-Only points scored on Tennessee all season, also ended Tennessee’s23-game winning streak
1940Coach: Howard JonesCaptain: Ed Dempsey
Sept. 28 T ....Washington St.(WS-8:40) 14-14 H ... 40,000Oct. 5 T ....Oregon State............. 0- 0 H .... 50,000Oct. 12 W ....Illinois....................... 13- 7 A .... 30,125Oct. 19 W .17.Oregon.................... 13- 0 H .... 35,000Oct. 26 L .17.Stanford................9 7-21 A .... 60,000Nov. 9 L ....California................... 7-20 H .... 50,000Nov. 16 L ....Washington............17 0-14 A .... 27,000Nov. 30 W ....UCLA........................ 28-12 H .... 70,000Dec. 7 L ....Notre Dame (HC)........ 6-10 H .... 85,808
(3-4-2, 2-3-2, 7th) 88-98 447,933
1941Coach: Sam Barry
Captain: Bob de Lauer
Sept. 27 W ....Oregon State (0:13).... 13- 7 H .... 50,000Oct. 4 L ....Ohio State................. 0-33 H .... 65,000Oct. 11 L ....Oregon...................... 6-20 H .... 40,000Oct. 18 W ....Washington State....... 7- 6 H .... 40,000Oct. 25 L ....California................... 0-14 A .... 65,000Nov. 8 L ....Stanford..................9 0-13 H .... 86,305Nov. 22 L ....Notre Dame.............4 18-20 A .... c54,967Nov. 29 L ....Washington (R)(1:00).. 13-14 H .... 35,000Dec. 6 T ....UCLA (HC)................. 7- 7 A .... 65,000
(2-6-1, 2-4-1, 8th) 64-134 501,272
ALL-TIME USC RECORD

2002 FOOTBALL MEDIA GUIDE — PAGE 155
1942Coach: Jeff CravathCaptain: Don Willer
Sept. 26 L ....Tulane....................... 13-27 H .... 45,000Oct. 3 T ....Washington............... 0- 0 A .... 26,000Oct. 10 L ....Ohio State...............1 12-28 A .... 56,436Oct. 17 W ....Washington State...10 26-12 H .... 33,000Oct. 24 L ....Stanford.................... 6-14 N1.... 25,000Nov. 7 W ....California (U).............. 21- 7 H .... 37,500Nov. 14 W ....Oregon...................... 40- 0 H .... 33,000Nov. 28 L .14.Notre Dame (HC)....8 0-13 H .... 94,519Dec. 5 W ....Montana.................... 38- 0* H .... 25,000Dec. 12 L ....UCLA....................13 7-14 H .... 90,000Dec. 19 W ....St. Mary’s Pre-Flight.. 21-13 H .... 6,643
(5-5-1, 4-2-1, 4th) 184-128 472,098N1-Kezar Stadium, San Francisco, California*-USC’s 250th victory; also, second game of doubleheader; in first game,UCLA defeated Idaho, 40-13
1943Coach: Jeff Cravath
Captain: Ralph Heywood
Sept. 25 W ....UCLA........................ 20- 0 A .... 50,000Oct. 2 W ....California................... 7- 0 A .... 35,000Oct. 9 W .10.St. Mary’s Pre-Flight. 13- 0 H .... 30,000Oct. 16 W ..8.San Francisco........... 34- 0 A .... 6,000Oct. 23 W ..7.College of Pacific.....6 6- 0 H .... 65,000Oct. 30 W ..5.California..............20 13- 0 H .... 45,000Nov. 6 L ..4.San Diego Navy......... 7-10 A .... 6,000Nov. 13 L ..9.March Field*.........15 0-35 H .... 30,000Nov. 27 W ....UCLA (HC)................ 26-13 H .... 35,000
(7-2-0, 5-0-0, 1st) 126-58 302,000ROSE BOWL
Jan. 1 W ....Washington (U)......12 29- 0 N1.... 68,000(8-2-0) 155-58 370,000
N1-Rose Bowl, Pasadena, California*-4th Air Force
1944Coach: Jeff CravathCaptain: Jim Hardy
Sept. 23 T ....UCLA (TD-UCLA 0:00) 13-13 H .... 60,000Sept. 30 W ....College of Pacific........ 18- 6 H .... 30,000Oct. 7 T ....California................... 6- 6 H .... 40,000Oct. 14 W ....St. Mary’s Pre-Flt. (N). 6- 0* N1.... c13,500Oct. 23 W .15.Washington (N)........ 38- 7+ H .... 62,865Oct. 28 W ....St. Mary’s................. 34- 7 H .... 20,000Nov. 4 W .13.San Diego Navy (4:00) 28-21 H .... 28,000Nov. 18 W .12.California................. 32- 0 A .... 40,000Nov. 25 W ..8.UCLA (HC)................ 40-13 A .... 77,903
(7-0-2, 3-0-2, 1st) 215-73 372,268ROSE BOWL
Jan. 1 W ..7.Tennessee.............12 25- 0 N2.... c91,000(8-0-2) 240- 73 463,268
N1-Ratcliffe Stadium, Fresno, CaliforniaN2-Rose Bowl, Pasadena, California*-First USC varsity night game; also first USC home game played outsideColiseum since that stadium was opened (USC served as the home team)+-USC’s first Coliseum night game
1945Coach: Jeff Cravath
Captain: Jim Callanan
Sept. 21 W ....UCLA (N)................... 13- 6 A .... 81,000Sept. 29 W ....California................... 13- 2 A .... 52,000Oct. 6 W ....St. Mary’s Pre-Flight... 26-14 H .... 25,000Oct. 13 L ..6.San Diego Navy (U)... 6-33 A .... 6,000Oct. 20 W .14.College of Pacific...... 52- 0 H .... 10,000Oct. 27 L .20.Washington (8:00).... 7-13 A .... c40,000Nov. 3 L ....St. Mary’s...............8 0-26 H .... 76,378Nov. 10 W ....California................... 14- 0 H .... 35,000Nov. 24 W ....Oregon State............. 34- 7 H .... 30,000Dec. 1 W .16.UCLA (HC)............... 26-15 H ...c103,000
(7-3-0, 5-1-0, 1st) 191-116 458,378ROSE BOWL
Jan. 1 L .11.Alabama................2 14-34 N1.... c93,000(7-4-0) 205-150 551,378
N1-Rose Bowl, Pasadena, California
1946Coach: Jeff Cravath
Captain: Doug Essick
Sept. 27 W ....Washington St.(N)(0:05) 13- 7 H .... 68,282Oct. 5 L ....Ohio State................. 0-21 H .... 80,047Oct. 12 L ....Oregon State............. 0- 6 N1.... 29,594Oct. 19 W ....Washington............... 28- 0 H .... 42,507Oct. 26 W ....Stanford.................... 28-20 A .... 50,000Nov. 2 W ....Oregon...................... 43- 0 H .... 45,885Nov. 9 W .14.California................. 14- 0 H .... 60,398Nov. 23 L .10.UCLA (HC) (R)........4 6-13 A .... 93,714Nov. 30 L .16.Notre Dame............2 6-26 A .... c55,298Dec. 21 W ....Tulane....................... 20-13 A .... 25,000
(6-4-0, 5-2-0, 3rd) 158-106 550,725N1-Multnomah Stadium, Portland, Oregon
1947Coach: Jeff CravathCaptain: Don Clark
Sept. 27 W ....Washington State....... 21- 0 H .... 48,173Oct. 4 T ....Rice (SC-2:10)........... 7- 7 H .... 64,231Oct. 11 W .20.Ohio State............... 32- 0 A .... 76,559Oct. 18 W .11.Oregon State........... 48- 6 H .... 61,301Oct. 25 W .10.California...............4 39-14 A .... c81,659Nov. 1 W ..5.Washington (R)......... 19- 0 A .... 32,000Nov. 8 W ..5.Stanford................... 14- 0 H .... 59,749Nov. 22 W ..4.UCLA...................18 6- 0 H ...c102,050Dec. 6 L ..3.Notre Dame (HC).....1 7-38 H ..*c104,953
(7-1-1, 6-0-0, 1st) 193-65 630,675ROSE BOWL
Jan. 1 L ..8.Michigan................2 0-49 N1.... c93,000(7-2-1) 193-114 723,675
N1-Rose Bowl, Pasadena, California*-Largest crowd for football, Los Angeles Memorial Coliseum
1948Coach: Jeff CravathCaptain: Bob Bastian
Sept. 17 W ....Utah (N).................... 27- 0 H .... 55,211Sept. 24 W ....Oregon State (N)........ 21- 6 H .... 50,237Oct. 2 L ....Ohio State................. 0-20 A .... 75,102Oct. 9 W ....Rice.......................... 7- 0 H .... 49,531Oct. 16 L ....Oregon...................... 7- 8+ N1.... 32,600Oct. 23 W ....Stanford.................... 7- 6 A .... 40,000Oct. 30 L ....California.................4 7-13 H .... 90,890Nov. 13 W ....Washington............... 32- 7 H .... 44,345Nov. 20 W ....UCLA........................ 20-13 A .... 76,577Dec. 4 T ....Notre Dame(HC)(ND-0:35).2 14-14* H ...c100,571
(6-3-1, 4-2-0, 3rd) 142-87 615,064N1-Multnomah Stadium, Portland, Oregon*-Ended Notre Dame’s 21-game winning streak+-First time USC travelled by airplane to a game
ALL-TIME USC RECORD
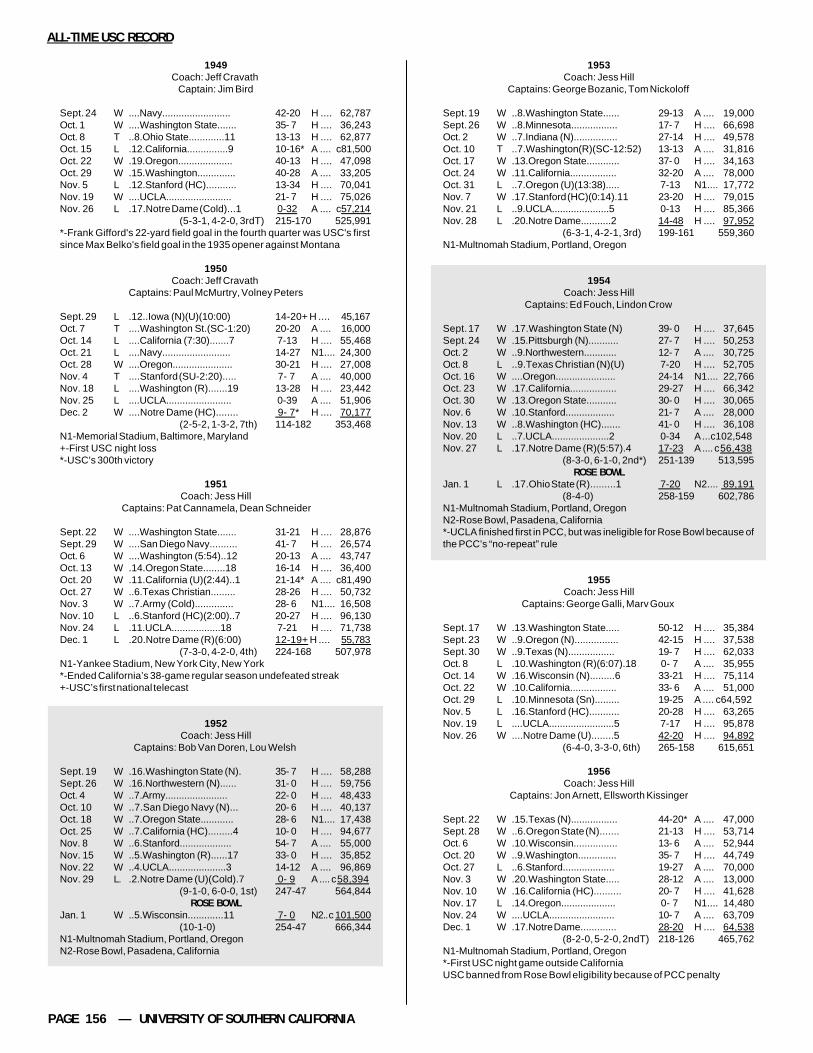
PAGE 156 — UNIVERSITY OF SOUTHERN CALIFORNIA
1953Coach: Jess Hill
Captains: George Bozanic, Tom Nickoloff
Sept. 19 W ..8.Washington State...... 29-13 A .... 19,000Sept. 26 W ..8.Minnesota................. 17- 7 H .... 66,698Oct. 2 W ..7.Indiana (N)................ 27-14 H .... 49,578Oct. 10 T ..7.Washington(R)(SC-12:52) 13-13 A .... 31,816Oct. 17 W .13.Oregon State............ 37- 0 H .... 34,163Oct. 24 W .11.California................. 32-20 A .... 78,000Oct. 31 L ..7.Oregon (U)(13:38)..... 7-13 N1.... 17,772Nov. 7 W .17.Stanford (HC)(0:14).11 23-20 H .... 79,015Nov. 21 L ..9.UCLA.....................5 0-13 H .... 85,366Nov. 28 L .20.Notre Dame...........2 14-48 H .... 97,952
(6-3-1, 4-2-1, 3rd) 199-161 559,360N1-Multnomah Stadium, Portland, Oregon
1954Coach: Jess Hill
Captains: Ed Fouch, Lindon Crow
Sept. 17 W .17.Washington State (N) 39- 0 H .... 37,645Sept. 24 W .15.Pittsburgh (N)........... 27- 7 H .... 50,253Oct. 2 W ..9.Northwestern............ 12- 7 A .... 30,725Oct. 8 L ..9.Texas Christian (N)(U) 7-20 H .... 52,705Oct. 16 W ....Oregon...................... 24-14 N1.... 22,766Oct. 23 W .17.California................. 29-27 H .... 66,342Oct. 30 W .13.Oregon State........... 30- 0 H .... 30,065Nov. 6 W .10.Stanford.................. 21- 7 A .... 28,000Nov. 13 W ..8.Washington (HC)....... 41- 0 H .... 36,108Nov. 20 L ..7.UCLA.....................2 0-34 A ...c102,548Nov. 27 L .17.Notre Dame (R)(5:57).4 17-23 A .... c56,438
(8-3-0, 6-1-0, 2nd*) 251-139 513,595ROSE BOWL
Jan. 1 L .17.Ohio State (R).........1 7-20 N2.... 89,191(8-4-0) 258-159 602,786
N1-Multnomah Stadium, Portland, OregonN2-Rose Bowl, Pasadena, California*-UCLA finished first in PCC, but was ineligible for Rose Bowl because ofthe PCC’s “no-repeat” rule
1955Coach: Jess Hill
Captains: George Galli, Marv Goux
Sept. 17 W .13.Washington State..... 50-12 H .... 35,384Sept. 23 W ..9.Oregon (N)................ 42-15 H .... 37,538Sept. 30 W ..9.Texas (N)................. 19- 7 H .... 62,033Oct. 8 L .10.Washington (R)(6:07).18 0- 7 A .... 35,955Oct. 14 W .16.Wisconsin (N).........6 33-21 H .... 75,114Oct. 22 W .10.California................. 33- 6 A .... 51,000Oct. 29 L .10.Minnesota (Sn)......... 19-25 A .... c64,592Nov. 5 L .16.Stanford (HC)........... 20-28 H .... 63,265Nov. 19 L ....UCLA........................5 7-17 H .... 95,878Nov. 26 W ....Notre Dame (U)........5 42-20 H .... 94,892
(6-4-0, 3-3-0, 6th) 265-158 615,651
1956Coach: Jess Hill
Captains: Jon Arnett, Ellsworth Kissinger
Sept. 22 W .15.Texas (N)................. 44-20* A .... 47,000Sept. 28 W ..6.Oregon State (N)....... 21-13 H .... 53,714Oct. 6 W .10.Wisconsin................ 13- 6 A .... 52,944Oct. 20 W ..9.Washington.............. 35- 7 H .... 44,749Oct. 27 L ..6.Stanford................... 19-27 A .... 70,000Nov. 3 W .20.Washington State..... 28-12 A .... 13,000Nov. 10 W .16.California (HC).......... 20- 7 H .... 41,628Nov. 17 L .14.Oregon.................... 0- 7 N1.... 14,480Nov. 24 W ....UCLA........................ 10- 7 A .... 63,709Dec. 1 W .17.Notre Dame............. 28-20 H .... 64,538
(8-2-0, 5-2-0, 2ndT) 218-126 465,762N1-Multnomah Stadium, Portland, Oregon*-First USC night game outside CaliforniaUSC banned from Rose Bowl eligibility because of PCC penalty
ALL-TIME USC RECORD
1949Coach: Jeff Cravath Captain: Jim Bird
Sept. 24 W ....Navy......................... 42-20 H .... 62,787Oct. 1 W ....Washington State....... 35- 7 H .... 36,243Oct. 8 T ..8.Ohio State.............11 13-13 H .... 62,877Oct. 15 L .12.California...............9 10-16* A .... c81,500Oct. 22 W .19.Oregon.................... 40-13 H .... 47,098Oct. 29 W .15.Washington.............. 40-28 A .... 33,205Nov. 5 L .12.Stanford (HC)........... 13-34 H .... 70,041Nov. 19 W ....UCLA........................ 21- 7 H .... 75,026Nov. 26 L .17.Notre Dame (Cold)...1 0-32 A .... c57,214
(5-3-1, 4-2-0, 3rdT) 215-170 525,991*-Frank Gifford's 22-yard field goal in the fourth quarter was USC's firstsince Max Belko's field goal in the 1935 opener against Montana
1950Coach: Jeff Cravath
Captains: Paul McMurtry, Volney Peters
Sept. 29 L .12..Iowa (N)(U)(10:00) 14-20+ H .... 45,167Oct. 7 T ....Washington St.(SC-1:20) 20-20 A .... 16,000Oct. 14 L ....California (7:30).......7 7-13 H .... 55,468Oct. 21 L ....Navy......................... 14-27 N1.... 24,300Oct. 28 W ....Oregon...................... 30-21 H .... 27,008Nov. 4 T ....Stanford (SU-2:20)..... 7- 7 A .... 40,000Nov. 18 L ....Washington (R).......19 13-28 H .... 23,442Nov. 25 L ....UCLA........................ 0-39 A .... 51,906Dec. 2 W ....Notre Dame (HC)........ 9- 7* H .... 70,177
(2-5-2, 1-3-2, 7th) 114-182 353,468N1-Memorial Stadium, Baltimore, Maryland+-First USC night loss*-USC’s 300th victory
1951Coach: Jess Hill
Captains: Pat Cannamela, Dean Schneider
Sept. 22 W ....Washington State....... 31-21 H .... 28,876Sept. 29 W ....San Diego Navy.......... 41- 7 H .... 26,574Oct. 6 W ....Washington (5:54)..12 20-13 A .... 43,747Oct. 13 W .14.Oregon State........18 16-14 H .... 36,400Oct. 20 W .11.California (U)(2:44)..1 21-14* A .... c81,490Oct. 27 W ..6.Texas Christian......... 28-26 H .... 50,732Nov. 3 W ..7.Army (Cold).............. 28- 6 N1.... 16,508Nov. 10 L ..6.Stanford (HC)(2:00)..7 20-27 H .... 96,130Nov. 24 L .11.UCLA..................18 7-21 H .... 71,738Dec. 1 L .20.Notre Dame (R)(6:00) 12-19+ H .... 55,783
(7-3-0, 4-2-0, 4th) 224-168 507,978N1-Yankee Stadium, New York City, New York*-Ended California’s 38-game regular season undefeated streak+-USC’s first national telecast
1952Coach: Jess Hill
Captains: Bob Van Doren, Lou Welsh
Sept. 19 W .16.Washington State (N). 35- 7 H .... 58,288Sept. 26 W .16.Northwestern (N)...... 31- 0 H .... 59,756Oct. 4 W ..7.Army....................... 22- 0 H .... 48,433Oct. 10 W ..7.San Diego Navy (N)... 20- 6 H .... 40,137Oct. 18 W ..7.Oregon State............ 28- 6 N1.... 17,438Oct. 25 W ..7.California (HC).........4 10- 0 H .... 94,677Nov. 8 W ..6.Stanford................... 54- 7 A .... 55,000Nov. 15 W ..5.Washington (R)......17 33- 0 H .... 35,852Nov. 22 W ..4.UCLA.....................3 14-12 A .... 96,869Nov. 29 L. .2.Notre Dame (U)(Cold).7 0- 9 A .... c58,394
(9-1-0, 6-0-0, 1st) 247-47 564,844ROSE BOWL
Jan. 1 W ..5.Wisconsin.............11 7- 0 N2.. c 101,500(10-1-0) 254-47 666,344
N1-Multnomah Stadium, Portland, OregonN2-Rose Bowl, Pasadena, California

2002 FOOTBALL MEDIA GUIDE — PAGE 157
1957Coach: Don Clark
Captains: Jim Conroy, Mike Henry
Sept. 21 L .19.Oregon State (N)...13 0-20 N1.... 36,855Sept. 28 L ....Michigan................10 6-16 H .... 44,739Oct. 4 L ....Pittsburgh (N)............. 14-20 H .... 43,489Oct. 19 L ....California................... 0-12 A .... 40,000Oct. 26 L ....Washington State....... 12-13 H .... 24,902Nov. 2 W ....Washington (6:30)...... 19-12 A .... 30,172Nov. 9 L ....Stanford (HC)............. 7-35 H .... 51,923Nov. 16 L ....Oregon..................16 7-16 H .... 30,975Nov. 23 L ....UCLA........................ 9-20 H .... 64,818Nov. 30 L ....Notre Dame (Sn).....12 12-40 A .... 54,793
(1-9-0, 1-6-0, 7thT) 86-204 422,666N1-Multnomah Stadium, Portland, OregonUSC banned from Rose Bowl eligibility because of PCC penalty
1958Coach: Don Clark
Captains: Ken Antle, Monte Clark
Sept. 19 W ....Oregon State (N)....12 21- 0 H .... 40,286Sept. 27 L ....Michigan................... 19-20 A .... 77,005Oct. 3 L ....North Carolina (N)...... 7- 8 H .... 43,238Oct. 11 L ....Oregon..................15 0-25 N1.... 32,734Oct. 18 L ....California (HC)........... 12-14 H .... 34,872Oct. 25 W ....Washington State (1:25) 14- 6 N2.... 25,000Nov. 1 W ....Stanford.................... 29- 6 A .... 52,000Nov. 8 W ....Washington............... 21- 6 H .... 32,987Nov. 22 T ....UCLA (USC-TD 6:50).. 15-15 A .... 58,507Nov. 29 L ....Notre Dame...........18 13-20 H .... 66,903
(4-5-1, 4-2-1, 3rd) 151-120 463,532N1-Multnomah Stadium, Portland, OregonN2-Spokane Memorial Stadium, Spokane, Washington
1959Coach: Don Clark
Captains: Ron Mix, Willie Wood
Sept. 19 W ....Oregon State (N)(R).... 27- 6 N1.... 23,895Sept. 25 W .11.Pittsburgh (N)........... 23- 0 H .... 34,172Oct. 2 W .11.Ohio State (N).......14 17- 0 H .... 49,592Oct. 17 W ..7.Washington (6:34).18 22-15 A .... 54,497Oct. 24 W ..5.Stanford................... 30-28 H .... 44,209Oct. 31 W ..6.California (12:13)...... 14- 7 A .... 37,000Nov. 7 W ..6.West Virginia............ 36- 0 H .... 34,066Nov. 14 W ..4.Baylor...................... 17- 8 H .... 43,832Nov. 21 L ..4.UCLA (HC)(U)(8:06)... 3-10 H .... 85,917Nov. 28 L ..7.Notre Dame (U)(Cold) 6-16 A .... 48,682
(8-2-0, 3-1-0, 1stT) 195-90 455,862N1-Multnomah Stadium, Portland, OregonUSC banned from post-season bowls because of NCAA penalty
1960Coach: John McKay
Captains: Mike McKeever, George Van Vliet
Sept. 16 L ..6.Oregon State (N)(U)... 0-14 H .... 32,928Sept. 24 L ....Texas Christian (N)..... 6- 7 H .... 31,475Oct. 1 L ....Ohio State...............9 0-20 A .... c83,204Oct. 7 W ....Georgia (N)................ 10- 3 H .... 28,120Oct. 15 W ....California................... 27-10 H .... 39,830Oct. 29 W ....Stanford.................... 21-10 A .... 29,000Nov. 5 L ....Washington (R).........7 0-34 H .... 43,475Nov. 12 L ....Baylor (R).................. 14-35 A .... 23,000Nov. 19 W ....UCLA (HC)(U).........11 17- 6 A .... 66,865Nov. 26 L ....Notre Dame (U)(R)...... 0-17 H .... 28,297
(4-6-0, 3-1-0, 2nd) 95-152 406,194
1961Coach: John McKay
Captain: Britt Williams
Sept. 22 L ....Georgia Tech (N)........ 7-27 H .... 36,950Sept. 29 W ....Southern Methodist (N) 21-16 H .... 29,148Oct. 7 L ....Iowa...........................1 34-35* H .... 30,263Oct. 14 L ....Notre Dame (R).........8 0-30 A .... 50,427Oct. 21 W ....California................... 28-14 A .... 38,000Oct. 28 W ....Illinois....................... 14-10 H .... 28,694Nov. 4 T ....Washington............... 0- 0 A .... 54,916Nov. 11 W ....Stanford (HC)............. 30-15 H .... 36,598Nov. 18 L ....Pittsburgh.................. 9-10 A .... 34,820Nov. 25 L ....UCLA (R)................... 7-10 H .... 57,580
(4-5-1, 2-1-1, 2ndT) 150-167 397,396*-USC scored touchdown with 0:48 left in game, but 2-point conversionattempt was unsuccessful
1962Coach: John McKay
Captains: Marv Marinovich, Ben Wilson
Sept. 22 W ....Duke (U)..................8 14- 7 H .... 26,400Sept. 29 W ..9.Southern Methodist (N) 33- 3 A .... 14,000Oct. 6 W ..6.Iowa........................ 7- 0 A .... 55,300Oct. 20 W ..3.California.................. 32- 6 H .... 38,500Oct. 27 W ..4.Illinois...................... 28-16 A .... 31,375Nov. 3 W ..3.Washington (HC).....9 14- 0 H .... 46,456Nov. 10 W ..2.Stanford................... 39-14 A .... 41,000Nov. 17 W ..2.Navy........................ 13- 6 H .... 51,701Nov. 24 W ..1.UCLA....................... 14- 3 A .... 86,740Dec. 1 W ..1.Notre Dame.............. 25- 0 H .... 81,676
(10-0-0, 4-0-0, 1st) 219- 55 473,148ROSE BOWL
Jan. 1 W ..1.Wisconsin..............2 42-37 N1 c98,698(11-0-0) 261- 92 571,846
USC won national championshipN1-Rose Bowl, Pasadena, California
1963Coach: John McKay
Captains: Pete Beathard, Willie Brown
Sept. 21 W ..1.Colorado (R).............. 14- 0 A .... 27,000Sept. 28 L ..1.Oklahoma...............3 12-17 H .... 39,345Oct. 4 W ..8.Michigan State(N)(8:03) 13-10 H .... 59,137Oct. 12 L ..7.Notre Dame (U)(6:28) 14-17 A .... c59,135Oct. 19 W ....Ohio State...............4 32- 3 H .... 61,883Oct. 26 W ....California................... 36- 6 A .... 41,000Nov. 2 L ....Washington (Mud)...... 7-22 A .... c55,738Nov. 9 W ....Stanford (HC)............. 25-11 H .... 57,035Nov. 15 W ....Oregon State (N)........ 28-22 H .... 30,846Nov. 30 W ....UCLA........................ 26- 6* H .... 82,460
(7-3-0, 3-1-0, 2nd) 207-114 513,579*-Originally scheduled for Nov. 23, but postponed because of assassinationof President Kennedy
1964Coach: John McKay
Captains: Craig Fertig, Bill Fisk
Sept. 18 W ....Colorado (N).............. 21- 0 H .... 39,173Sept. 26 W ....Oklahoma................2 40-14 A .... 61,700Oct. 3 L ..2.Michigan State.......... 7-17 A .... 70,102Oct. 10 W ....Texas A&M (N).......... 31- 7 H .... 42,295Oct. 17 L ....Ohio State...............2 0-17 A .... c84,315Oct. 24 W ....California (0:50)......... 26-21 H .... 48,105Oct. 31 L ....Washington (HC)(4:49) 13-14 H .... 50,577Nov. 7 W ....Stanford.................... 15-10 A .... 55,000Nov. 21 W ....UCLA........................ 34-13 A .... 62,108Nov. 28 W ....Notre Dame (U)(1:33).1 20-17 H .... 83,840
(7-3-0, 3-1-0, 1stT*) 207-130 597,215*-Oregon State selected as AAWU representative in Rose Bowl
ALL-TIME USC RECORD
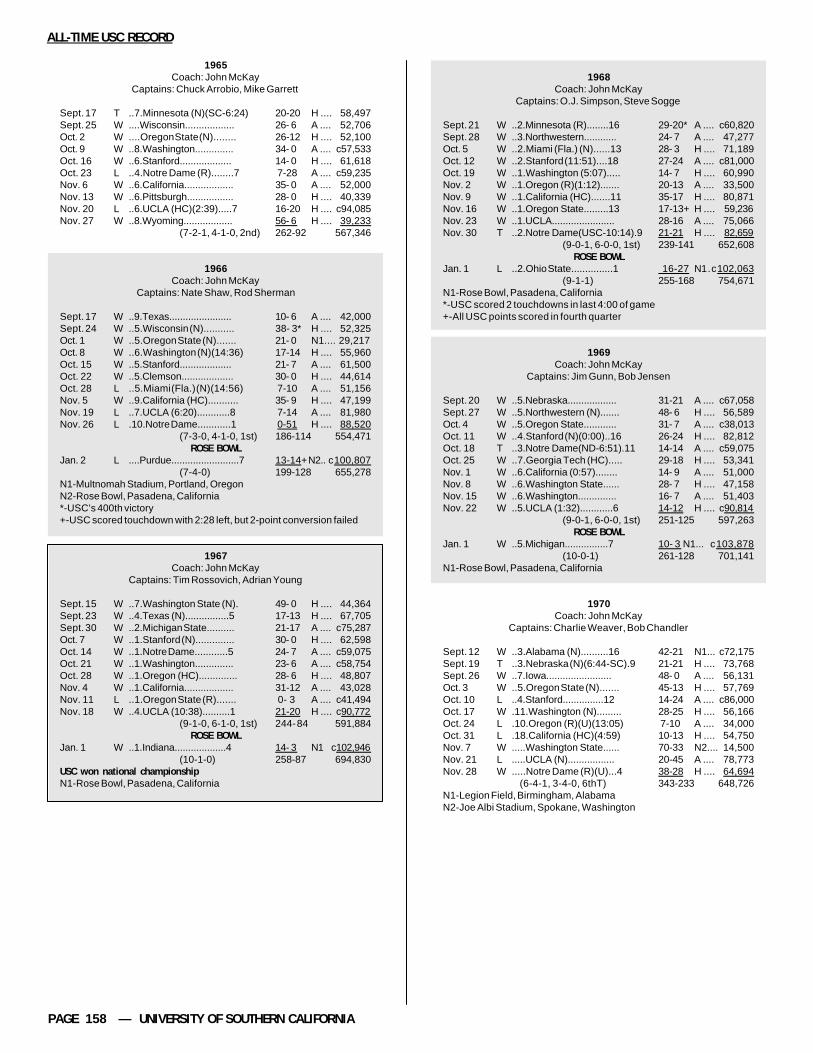
PAGE 158 — UNIVERSITY OF SOUTHERN CALIFORNIA
ALL-TIME USC RECORD
1965Coach: John McKay
Captains: Chuck Arrobio, Mike Garrett
Sept. 17 T ..7.Minnesota (N)(SC-6:24) 20-20 H .... 58,497Sept. 25 W ....Wisconsin.................. 26- 6 A .... 52,706Oct. 2 W ....Oregon State (N)........ 26-12 H .... 52,100Oct. 9 W ..8.Washington.............. 34- 0 A .... c57,533Oct. 16 W ..6.Stanford................... 14- 0 H .... 61,618Oct. 23 L ..4.Notre Dame (R)........7 7-28 A .... c59,235Nov. 6 W ..6.California.................. 35- 0 A .... 52,000Nov. 13 W ..6.Pittsburgh................. 28- 0 H .... 40,339Nov. 20 L ..6.UCLA (HC)(2:39).....7 16-20 H .... c94,085Nov. 27 W ..8.Wyoming.................. 56- 6 H .... 39,233
(7-2-1, 4-1-0, 2nd) 262-92 567,346
1966Coach: John McKay
Captains: Nate Shaw, Rod Sherman
Sept. 17 W ..9.Texas....................... 10- 6 A .... 42,000Sept. 24 W ..5.Wisconsin (N)........... 38- 3* H .... 52,325Oct. 1 W ..5.Oregon State (N)....... 21- 0 N1.... 29,217Oct. 8 W ..6.Washington (N)(14:36) 17-14 H .... 55,960Oct. 15 W ..5.Stanford................... 21- 7 A .... 61,500Oct. 22 W ..5.Clemson................... 30- 0 H .... 44,614Oct. 28 L ..5.Miami (Fla.) (N)(14:56) 7-10 A .... 51,156Nov. 5 W ..9.California (HC)........... 35- 9 H .... 47,199Nov. 19 L ..7.UCLA (6:20)............8 7-14 A .... 81,980Nov. 26 L .10.Notre Dame............1 0-51 H .... 88,520
(7-3-0, 4-1-0, 1st) 186-114 554,471ROSE BOWL
Jan. 2 L ....Purdue.........................7 13-14+ N2.. c100,807(7-4-0) 199-128 655,278
N1-Multnomah Stadium, Portland, OregonN2-Rose Bowl, Pasadena, California*-USC’s 400th victory+-USC scored touchdown with 2:28 left, but 2-point conversion failed
1967Coach: John McKay
Captains: Tim Rossovich, Adrian Young
Sept. 15 W ..7.Washington State (N). 49- 0 H .... 44,364Sept. 23 W ..4.Texas (N)................5 17-13 H .... 67,705Sept. 30 W ..2.Michigan State.......... 21-17 A .... c75,287Oct. 7 W ..1.Stanford (N).............. 30- 0 H .... 62,598Oct. 14 W ..1.Notre Dame............5 24- 7 A .... c59,075Oct. 21 W ..1.Washington.............. 23- 6 A .... c58,754Oct. 28 W ..1.Oregon (HC).............. 28- 6 H .... 48,807Nov. 4 W ..1.California.................. 31-12 A .... 43,028Nov. 11 L ..1.Oregon State (R)....... 0- 3 A .... c41,494Nov. 18 W ..4.UCLA (10:38)..........1 21-20 H .... c90,772
(9-1-0, 6-1-0, 1st) 244- 84 591,884ROSE BOWL
Jan. 1 W ..1.Indiana...................4 14- 3 N1 c102,946(10-1-0) 258-87 694,830
USC won national championshipN1-Rose Bowl, Pasadena, California
1968Coach: John McKay
Captains: O.J. Simpson, Steve Sogge
Sept. 21 W ..2.Minnesota (R)........16 29-20* A .... c60,820Sept. 28 W ..3.Northwestern............ 24- 7 A .... 47,277Oct. 5 W ..2.Miami (Fla.) (N)......13 28- 3 H .... 71,189Oct. 12 W ..2.Stanford (11:51)....18 27-24 A .... c81,000Oct. 19 W ..1.Washington (5:07)..... 14- 7 H .... 60,990Nov. 2 W ..1.Oregon (R)(1:12)....... 20-13 A .... 33,500Nov. 9 W ..1.California (HC).......11 35-17 H .... 80,871Nov. 16 W ..1.Oregon State.........13 17-13+ H .... 59,236Nov. 23 W ..1.UCLA....................... 28-16 A .... 75,066Nov. 30 T ..2.Notre Dame(USC-10:14).9 21-21 H .... 82,659
(9-0-1, 6-0-0, 1st) 239-141 652,608ROSE BOWL
Jan. 1 L ..2.Ohio State...............1 16-27 N1 . c102,063(9-1-1) 255-168 754,671
N1-Rose Bowl, Pasadena, California*-USC scored 2 touchdowns in last 4:00 of game+-All USC points scored in fourth quarter
1969Coach: John McKay
Captains: Jim Gunn, Bob Jensen
Sept. 20 W ..5.Nebraska.................. 31-21 A .... c67,058Sept. 27 W ..5.Northwestern (N)....... 48- 6 H .... 56,589Oct. 4 W ..5.Oregon State............ 31- 7 A .... c38,013Oct. 11 W ..4.Stanford (N)(0:00)..16 26-24 H .... 82,812Oct. 18 T ..3.Notre Dame(ND-6:51).11 14-14 A .... c59,075Oct. 25 W ..7.Georgia Tech (HC)..... 29-18 H .... 53,341Nov. 1 W ..6.California (0:57)........ 14- 9 A .... 51,000Nov. 8 W ..6.Washington State...... 28- 7 H .... 47,158Nov. 15 W ..6.Washington.............. 16- 7 A .... 51,403Nov. 22 W ..5.UCLA (1:32)............6 14-12 H .... c90,814
(9-0-1, 6-0-0, 1st) 251-125 597,263ROSE BOWL
Jan. 1 W ..5.Michigan................7 10- 3 N1... c103,878(10-0-1) 261-128 701,141
N1-Rose Bowl, Pasadena, California
1970Coach: John McKay
Captains: Charlie Weaver, Bob Chandler
Sept. 12 W ..3.Alabama (N)..........16 42-21 N1... c72,175Sept. 19 T ..3.Nebraska (N)(6:44-SC).9 21-21 H .... 73,768Sept. 26 W ..7.Iowa........................ 48- 0 A .... 56,131Oct. 3 W ..5.Oregon State (N)....... 45-13 H .... 57,769Oct. 10 L ..4.Stanford...............12 14-24 A .... c86,000Oct. 17 W .11.Washington (N)......... 28-25 H .... 56,166Oct. 24 L .10.Oregon (R)(U)(13:05) 7-10 A .... 34,000Oct. 31 L .18.California (HC)(4:59) 10-13 H .... 54,750Nov. 7 W .....Washington State...... 70-33 N2.... 14,500Nov. 21 L .....UCLA (N)................. 20-45 A .... 78,773Nov. 28 W .....Notre Dame (R)(U)...4 38-28 H .... 64,694
(6-4-1, 3-4-0, 6thT) 343-233 648,726N1-Legion Field, Birmingham, AlabamaN2-Joe Albi Stadium, Spokane, Washington

2002 FOOTBALL MEDIA GUIDE — PAGE 159
1971Coach: John McKay
Captains: John Vella, Willie Hall
Sept. 10 L ..5.Alabama (N)..........16 10-17 H .... 67,781Sept. 18 W .17.Rice (N)................... 24- 0 A .... 22,000Sept. 25 W .16.Illinois (N)................ 28- 0 H .... 49,390Oct. 2 L .17.Oklahoma..............8 20-33 A .... 61,826Oct. 9 L ....Oregon (N)(U)(7:43).... 23-28 H .... 50,111Oct. 16 L ....Stanford (N)(R).......15 18-33 H .... 65,375Oct. 23 W ....Notre Dame (U)........6 28-14 A .... c59,075Oct. 30 W .20.California................. 28- 0 A .... 54,000Nov. 6 W .17.Washington State (HC) 30-20 H .... 57,432Nov. 13 W .15.Washington (2:08).19 13-12 A .... c59,982Nov. 20 T .15.UCLA...................... 7- 7 H .... 68,426
(6-4-1, 3-2-1, 2nd) 229-164 615,034
1972Coach: John McKay
Captains: Sam Cunningham, John Grant
Sept. 9 W ..8.Arkansas (N)...........4 31-10 N1... c54,461Sept. 16 W ..1.Oregon State (N)....... 51- 6 H .... 56,305Sept. 23 W ..1.Illinois...................... 55-20 A .... 61,277Sept. 30 W ..1.Michigan State (N)..... 51- 6 H .... 63,934Oct. 7 W ..1.Stanford...............15 30-21 A .... c84,000Oct. 14 W ..1.California.................. 42-14 H .... 56,488Oct. 21 W ..1.Washington (HC)...18 34- 7 H .... 59,151Oct. 28 W ..1.Oregon (R)................ 18- 0 A .... 32,000Nov. 4 W ..1.Washington State...... 44- 3 N2.... 46,000Nov. 18 W ..1.UCLA (N)..............14 24- 7 A .... 82,929Dec. 2 W ..1.Notre Dame..........10 45-23 H .... 75,243
(11-0-0, 7-0-0, 1st) 425-117 671,788ROSE BOWL
Jan. 1 W ..1.Ohio State............3 42-17 N3... c106,869(12-0-0) 467-134 778,657
USC won national championshipN1-War Memorial Stadium, Little Rock, ArkansasN2-Husky Stadium, Seattle, WashingtonN3-Rose Bowl, Pasadena, California
1973Coach: John McKay
Captains: Lynn Swann, Artimus Parker
Sept. 15 W ..1.Arkansas (N)............. 17- 0 H .... 73,231Sept. 22 W ..1.Georgia Tech............ 23- 6 A .... 58,228Sept. 29 T ..1.Oklahoma (N)..........8 7- 7 H .... 84,016Oct. 6 W ..4.Oregon State (R)....... 21- 7 A .... 21,732Oct. 13 W ..4.Washington State...... 46-35 H .... 50,975Oct. 20 W ..6.Oregon (HC).............. 31-10 H .... 53,155Oct. 27 L ..6.Notre Dame (R).......8 14-23 A .... c59,075Nov. 3 W ..9.California.................. 50-14 A .... 48,000Nov. 10 W ..8.Stanford (0:03)......... 27-26* H .... 63,806Nov. 17 W ..9.Washington.............. 42-19 A .... 55,500Nov. 24 W ..9.UCLA.....................8 23-13 H .... 88,037
(9-1-1, 7-0-0, 1st) 301-160 655,755ROSE BOWL
Jan. 1 L ..7.Ohio State..............4 21-42 N1... c105,267(9-2-1) 322-202 761,510
N1-Rose Bowl, Pasadena, California*-USC scored 10 points in last 2:10
1974Coach: John McKay
Captains: Pat Haden, Richard Wood
Sept. 14 L ..5.Arkansas (N).........20 7-22 N1... c54,622Sept. 28 W .18.Pittsburgh..............8 16- 7 A .... 52,934Oct. 5 W ..9.Iowa........................ 41- 3 H .... 52,095Oct. 12 W ..7.Washington State (N). 54- 7 N2.... 32,000Oct. 19 W ..6.Oregon..................... 16- 7 A .... 32,500Oct. 26 W ..6.Oregon State (HC)..... 31-10 H .... 52,392Nov. 2 T ..6.California.................. 15-15 H .... 53,921Nov. 9 W .11.Stanford.................. 34-10 A .... c83,500Nov. 16 W ..8.Washington.............. 42-11 H .... 51,157Nov. 23 W ..8.UCLA....................... 34- 9 A .... 82,467Nov. 30 W ..6.Notre Dame............5 55-24* H .... 83,552
(9-1-1, 6-0-1, 1st) 345-125 631,140ROSE BOWL
Jan. 1 W ..5.Ohio State (2:03)....3 18-17 N3 c106,721(10-1-1) 363-142 737,861
USC won national championshipN1-War Memorial Stadium, Little Rock, ArkansasN2-Joe Albi Stadium, Spokane, WashingtonN3-Rose Bowl, Pasadena, California*-USC trailed 24-0 late in second quarter before scoring 55 unansweredpoints in less than 17 minutes
1975Coach: John McKay
Captains: Kevin Bruce, Danny Reece
Sept. 12 W ..4.Duke (N)................... 35- 7 H .... 56,727Sept. 19 W ..4.Oregon State (N)....... 24- 7 H .... 50,165Sept. 27 W ..3.Purdue..................... 19- 6 H .... 56,170Oct. 4 W ..3.Iowa........................ 27-16 A .... 54,600Oct. 11 W ..3.Washington State...... 28-10 H .... 47,468Oct. 18 W ..3.Oregon (HC).............. 17- 3 H .... 50,542Oct. 25 W ..3.Notre Dame..........14 24-17 A .... c59,075Nov. 1 L ..4.California.................. 14-28 A .... 58,871Nov. 8 L ..9.Stanford (0:00)......... 10-13 H .... 68,249Nov. 15 L .13.Washington (R)(8:23) 7- 8 A .... 53,700Nov. 28 L ....UCLA (N)...............14 22-25 H .... 80,927
(7-4-0, 3-4-0, 5th) 227-140 636,494LIBERTY BOWL
Dec. 22 W ....Texas A&M (U)(N)....2 20- 0 N1.... 52,129(8-4-0) 247-140 688,623
N1-Liberty Bowl Memorial Stadium, Memphis, Tennessee
1976Coach: John Robinson
Captains: Ricky Bell, Vince Evans, Eric Williams
Sept. 11 L ..8.Missouri (N).............. 25-46 H .... 49,535Sept. 18 W ....Oregon (N)................. 53- 0 A .... c40,600Sept. 25 W .19.Purdue.................... 31-13 A .... 65,425Oct. 2 W .13.Iowa (N).................. 55- 0 H .... 55,518Oct. 9 W .11.Washington State (N) 23-14 N1.... 37,268Oct. 23 W ..7.Oregon State (HC)..... 56- 0 H .... 53,216Oct. 30 W ..4.California.................. 20- 6 H .... 60,323Nov. 6 W ..4.Stanford................... 48-24 A .... 76,500Nov. 13 W ..3.Washington.............. 20- 3 H .... 49,264Nov. 20 W ..3.UCLA.....................2 24-14 A .... c90,519Nov. 27 W ..3.Notre Dame..........13 17-13 H .... 76,561
(10-1-0, 7-0-0, 1st) 372-133 654,729ROSE BOWL
Jan. 1 W ..3.Michigan................2 14- 6 N2. c106,182(11-1-0) 386-139 760,911
N1-Kingdome, Seattle, WashingtonN2-Rose Bowl, Pasadena, California
ALL-TIME USC RECORD
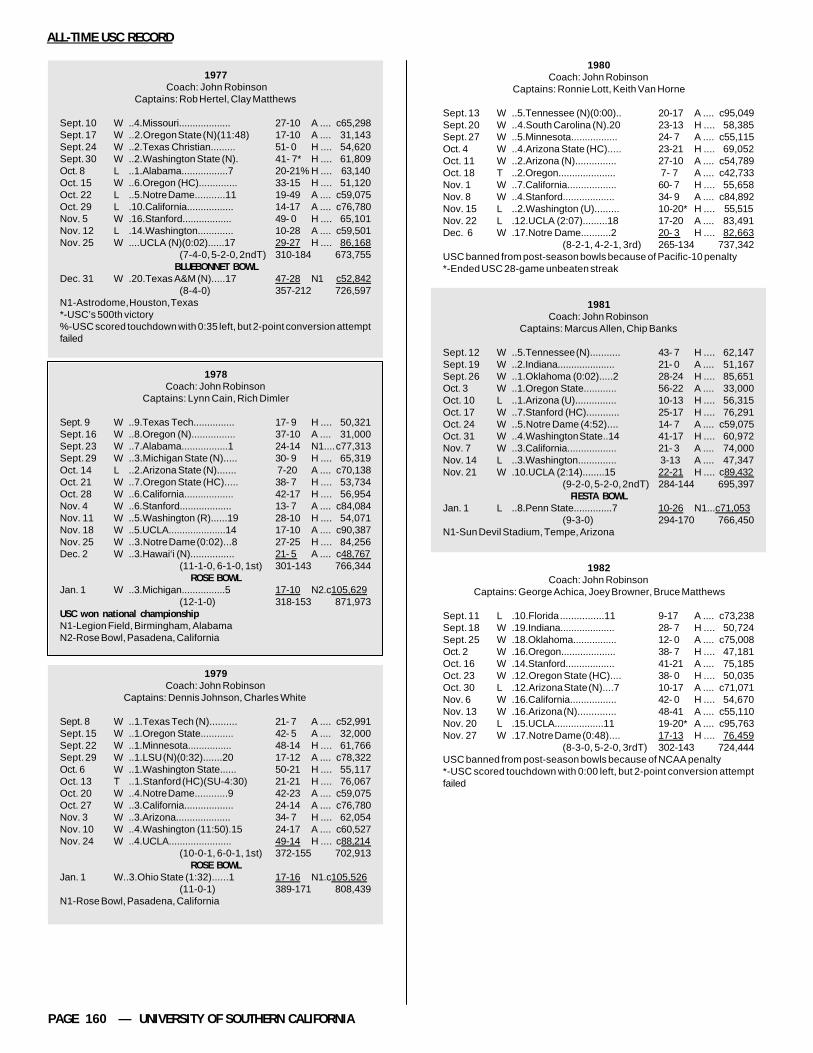
PAGE 160 — UNIVERSITY OF SOUTHERN CALIFORNIA
1977 Coach: John Robinson
Captains: Rob Hertel, Clay Matthews
Sept. 10 W ..4.Missouri................... 27-10 A .... c65,298Sept. 17 W ..2.Oregon State (N)(11:48) 17-10 A .... 31,143Sept. 24 W ..2.Texas Christian......... 51- 0 H .... 54,620Sept. 30 W ..2.Washington State (N). 41- 7* H .... 61,809Oct. 8 L ..1.Alabama.................7 20-21% H .... 63,140Oct. 15 W ..6.Oregon (HC).............. 33-15 H .... 51,120Oct. 22 L ..5.Notre Dame...........11 19-49 A .... c59,075Oct. 29 L .10.California................. 14-17 A .... c76,780Nov. 5 W .16.Stanford.................. 49- 0 H .... 65,101Nov. 12 L .14.Washington............. 10-28 A .... c59,501Nov. 25 W ....UCLA (N)(0:02)......17 29-27 H .... 86,168
(7-4-0, 5-2-0, 2ndT) 310-184 673,755BLUEBONNET BOWL
Dec. 31 W .20.Texas A&M (N).....17 47-28 N1 c52,842(8-4-0) 357-212 726,597
N1-Astrodome, Houston, Texas*-USC’s 500th victory%-USC scored touchdown with 0:35 left, but 2-point conversion attemptfailed
1978Coach: John Robinson
Captains: Lynn Cain, Rich Dimler
Sept. 9 W ..9.Texas Tech............... 17- 9 H .... 50,321Sept. 16 W ..8.Oregon (N)................ 37-10 A .... 31,000Sept. 23 W ..7.Alabama.................1 24-14 N1.... c77,313Sept. 29 W ..3.Michigan State (N)..... 30- 9 H .... 65,319Oct. 14 L ..2.Arizona State (N)....... 7-20 A .... c70,138Oct. 21 W ..7.Oregon State (HC)..... 38- 7 H .... 53,734Oct. 28 W ..6.California.................. 42-17 H .... 56,954Nov. 4 W ..6.Stanford................... 13- 7 A .... c84,084Nov. 11 W ..5.Washington (R)......19 28-10 H .... 54,071Nov. 18 W ..5.UCLA.....................14 17-10 A .... c90,387Nov. 25 W ..3.Notre Dame (0:02)...8 27-25 H .... 84,256Dec. 2 W ..3.Hawai‘i (N)................ 21- 5 A .... c48,767
(11-1-0, 6-1-0, 1st) 301-143 766,344ROSE BOWL
Jan. 1 W ..3.Michigan................5 17-10 N2.c105,629(12-1-0) 318-153 871,973
USC won national championshipN1-Legion Field, Birmingham, AlabamaN2-Rose Bowl, Pasadena, California
1979Coach: John Robinson
Captains: Dennis Johnson, Charles White
Sept. 8 W ..1.Texas Tech (N).......... 21- 7 A .... c52,991Sept. 15 W ..1.Oregon State............ 42- 5 A .... 32,000Sept. 22 W ..1.Minnesota................ 48-14 H .... 61,766Sept. 29 W ..1.LSU (N)(0:32).......20 17-12 A .... c78,322Oct. 6 W ..1.Washington State...... 50-21 H .... 55,117Oct. 13 T ..1.Stanford (HC)(SU-4:30) 21-21 H .... 76,067Oct. 20 W ..4.Notre Dame............9 42-23 A .... c59,075Oct. 27 W ..3.California.................. 24-14 A .... c76,780Nov. 3 W ..3.Arizona.................... 34- 7 H .... 62,054Nov. 10 W ..4.Washington (11:50).15 24-17 A .... c60,527Nov. 24 W ..4.UCLA....................... 49-14 H .... c88,214
(10-0-1, 6-0-1, 1st) 372-155 702,913ROSE BOWL
Jan. 1 W..3.Ohio State (1:32)......1 17-16 N1.c105,526(11-0-1) 389-171 808,439
N1-Rose Bowl, Pasadena, California
1980Coach: John Robinson
Captains: Ronnie Lott, Keith Van Horne
Sept. 13 W ..5.Tennessee (N)(0:00).. 20-17 A .... c95,049Sept. 20 W ..4.South Carolina (N).20 23-13 H .... 58,385Sept. 27 W ..5.Minnesota................. 24- 7 A .... c55,115Oct. 4 W ..4.Arizona State (HC)..... 23-21 H .... 69,052Oct. 11 W ..2.Arizona (N)............... 27-10 A .... c54,789Oct. 18 T ..2.Oregon..................... 7- 7 A .... c42,733Nov. 1 W ..7.California.................. 60- 7 H .... 55,658Nov. 8 W ..4.Stanford................... 34- 9 A .... c84,892Nov. 15 L ..2.Washington (U)......... 10-20* H .... 55,515Nov. 22 L .12.UCLA (2:07).........18 17-20 A .... 83,491Dec. 6 W .17.Notre Dame...........2 20- 3 H .... 82,663
(8-2-1, 4-2-1, 3rd) 265-134 737,342USC banned from post-season bowls because of Pacific-10 penalty*-Ended USC 28-game unbeaten streak
1981Coach: John Robinson
Captains: Marcus Allen, Chip Banks
Sept. 12 W ..5.Tennessee (N)........... 43- 7 H .... 62,147Sept. 19 W ..2.Indiana..................... 21- 0 A .... 51,167Sept. 26 W ..1.Oklahoma (0:02).....2 28-24 H .... 85,651Oct. 3 W ..1.Oregon State............ 56-22 A .... 33,000Oct. 10 L ..1.Arizona (U)............... 10-13 H .... 56,315Oct. 17 W ..7.Stanford (HC)............ 25-17 H .... 76,291Oct. 24 W ..5.Notre Dame (4:52).... 14- 7 A .... c59,075Oct. 31 W ..4.Washington State..14 41-17 H .... 60,972Nov. 7 W ..3.California.................. 21- 3 A .... 74,000Nov. 14 L ..3.Washington.............. 3-13 A .... 47,347Nov. 21 W .10.UCLA (2:14)........15 22-21 H .... c89,432
(9-2-0, 5-2-0, 2ndT) 284-144 695,397FIESTA BOWL
Jan. 1 L ..8.Penn State..............7 10-26 N1...c71,053(9-3-0) 294-170 766,450
N1-Sun Devil Stadium, Tempe, Arizona
1982Coach: John Robinson
Captains: George Achica, Joey Browner, Bruce Matthews
Sept. 11 L .10.Florida ................11 9-17 A .... c73,238Sept. 18 W .19.Indiana.................... 28- 7 H .... 50,724Sept. 25 W .18.Oklahoma................ 12- 0 A .... c75,008Oct. 2 W .16.Oregon.................... 38- 7 H .... 47,181Oct. 16 W .14.Stanford.................. 41-21 A .... 75,185Oct. 23 W .12.Oregon State (HC).... 38- 0 H .... 50,035Oct. 30 L .12.Arizona State (N)....7 10-17 A .... c71,071Nov. 6 W .16.California................. 42- 0 H .... 54,670Nov. 13 W .16.Arizona (N).............. 48-41 A .... c55,110Nov. 20 L .15.UCLA..................11 19-20* A .... c95,763Nov. 27 W .17.Notre Dame (0:48).... 17-13 H .... 76,459
(8-3-0, 5-2-0, 3rdT) 302-143 724,444USC banned from post-season bowls because of NCAA penalty*-USC scored touchdown with 0:00 left, but 2-point conversion attemptfailed
ALL-TIME USC RECORD

2002 FOOTBALL MEDIA GUIDE — PAGE 161
1986Coach: Ted Tollner
Captains: Jeff Bregel, Tim McDonald
Sept. 13 W ....Illinois....................... 31-16 H .... 51,496Sept. 20 W ....Baylor (0:00)...........9 17-14* A .... 35,000Sept. 27 W .12.Washington...........6 20-10 H .... 58,023Oct. 4 W ..9.Oregon (N)................ 35-21 H .... 51,340Oct. 11 L ..9.Washington State...... 14-34 A .... 26,000Oct. 18 L .15.Arizona State (HC).10 20-29 H .... 65,874Oct. 25 W ....Stanford................19 10- 0 A .... 73,500Nov. 1 W .18.Arizona (N)..........14 20-13 A .... c55,046Nov. 15 W .13.California................. 28- 3 H .... 48,019Nov. 22 L .10.UCLA..................18 25-45 A .... c98,370Nov. 29 L .17.Notre Dame (0:00).... 37-38 H .... 70,614
(7-4-0, 5-3-0, 4thT) 257-223 633,282CITRUS BOWL
Jan. 1 L ....Auburn..................10 7-16 N1 c51,113(7-5-0) 264-239 684,395
N1-Orlando Stadium, Orlando, Florida*-Final six minutes of the fourth quarter played in heavy rainstorm
1987Coach: Larry Smith
Captains: Dave Cadigan, Greg Coauette
Sept. 7 L ..19.Michigan State (N).17 13-27 A .... c77,922Sept. 19 W ....Boston College........... 23-17 H .... 46,205Sept. 26 W ....California................... 31-14 A .... 62,000Oct. 3 W ....Oregon State (N)........ 48-14 H .... 47,979Oct. 10 L ....Oregon...................... 27-34 A .... c39,587Oct. 17 W ....Washington............... 37-23 A .... c71,678Oct. 24 L ....Notre Dame...........10 15-26 A .... c59,075Oct. 31 W ....Washington State (R).. 42- 7 H .... 24,834Nov. 7 W ....Stanford (HC)............. 39-24 H .... 58,922Nov. 14 W ....Arizona (1:11)............ 12-10 H .... 51,428Nov. 21 W ....UCLA (7:59)............5 17-13 H .... c92,516
(8-3-0, 7-1-0, 1stT*) 304-209 632,146ROSE BOWL
Jan. 1 L .16.Michigan State (4:14).8 17-20 N1.c103,847(8-4-0) 321-229 735,993
N1-Rose Bowl, Pasadena, California*-USC received Rose Bowl bid by virtue of victory over UCLA
1988Coach: Larry Smith
Captain: Rodney Peete
Sept. 1 W ..8.Boston College (N)..... 34- 7 A .... c32,000Sept. 10 W ..6.Stanford (1:19)......... 24-20 A .... 59,000Sept. 24 W ..4.Oklahoma...............3 23- 7 H .... 86,124Oct. 1 W ..3.Arizona (N)............... 38-15 A .... 52,314Oct. 8 W ..3.Oregon (HC)..........18 42-14 H .... 63,452Oct. 15 W ..3.Washington...........16 28-27 H .... 62,974Oct. 29 W ..3.Oregon State............ 41-20 A .... 31,117Nov. 5 W ..2.California.................. 35- 3 H .... 73,937Nov. 12 W ..2.Arizona State............ 50- 0 A .... c72,023Nov. 19 W ..2.UCLA.....................6 31-22 A ...c100,741Nov. 26 L ..2.Notre Dame.............1 10-27 H .... c93,829
(10-1-0, 8-0-0, 1st) 356-162 727,511ROSE BOWL
Jan. 2 L ..5.Michigan...............11 14-22 N1 .c101,688(10-2-0) 370-184 829,199
N1-Rose Bowl, Pasadena, CaliforniaNote: USC celebrated its Athletic Centennial in 1988
ALL-TIME USC RECORD
1983Coach: Ted Tollner
Captains: Tony Brewer, Jeff Brown, Keith Browner,Fred Cornwell, Tony Slaton
Sept. 10 T ..9.Florida (USC-0:00).18 19-19 H .... 53,948Sept. 17 W .14.Oregon State (N)...... 33-10 A .... 28,000Sept. 24 L .10.Kansas (U)............... 20-26 H .... 49,255Oct. 1 L ....South Carolina (N)...... 14-38 A .... c74,200Oct. 8 W ....Washington State....... 38-17 H .... 43,106Oct. 15 L ....Arizona State (HC)..18 14-34 H .... 58,664Oct. 22 L ....Notre Dame............... 6-27 A .... c59,075Oct. 29 W ....California................... 19- 9 A .... 65,867Nov. 5 W ....Stanford.................... 30- 7 H .... 50,867Nov. 12 L ....Washington...........18 0-24* A .... c60,690Nov. 19 L ....UCLA........................ 17-27 H .... 83,763
(4-6-1, 4-3-0, 4th) 210-238 624,435USC banned from post-season bowls because of NCAA penalty*-First shutout of USC in 187 games
1984Coach: Ted Tollner
Captains: Neil Hope, Ken Ruettgers
Sept. 8 W ....Utah State................. 42- 7 H .... 45,067Sept. 22 W .17.Arizona State (N)(9:14) 6- 3 A .... c70,219Sept. 29 L .15.LSU........................ 3-23 H .... 60,128Oct. 6 W ....Washington State....... 29-27 A .... 33,000Oct. 13 W ....Oregon...................... 19- 9 A .... 29,581Oct. 20 W ....Arizona (HC).............. 17-14 H .... 65,411Oct. 27 W .20.California................. 31- 7 H .... 52,692Nov. 3 W .18.Stanford.................. 20-11 A .... 74,432Nov. 10 W .12.Washington............1 16- 7 H .... 71,838Nov. 17 L ..7.UCLA....................... 10-29 A .... 90,096Nov. 24 L .14.Notre Dame (R)........ 7-19 H .... 66,342
(8-3-0, 7-1-0, 1st) 200-156 658,806ROSE BOWL
Jan. 1 W .18.Ohio State.............6 20-17 N1.c102,594(9-3-0) 220-173 761,400
N1-Rose Bowl, Pasadena, California
1985Coach: Ted Tollner
Captains: Matt Koart, Hank Norman
Sept. 7 W ..6.Illinois...................11 20-10 A .... c76,369Sept. 21 L ..3.Baylor (N)(U)............. 13-20 H .... 53,246Sept. 28 L .18.Arizona State (N)...... 0-24 A .... c70,710Oct. 5 W ....Oregon State (HC)...... 63- 0 H .... 50,624Oct. 19 W ....Stanford.................... 30- 6 H .... 56,837Oct. 26 L ....Notre Dame............... 3-37 A .... c59,075Nov. 2 W ....Washington State....... 31-13 H .... 46,954Nov. 9 L ....California................... 6-14 A .... 63,500Nov. 16 L ....Washington (0:56)...... 17-20 A .... c52,601Nov. 23 W ....UCLA (1:13)............8 17-13 H .... c90,064Nov. 30 W ....Oregon...................... 20- 6* N1 c65,000
(6-5-0, 5-3-0, 4thT) 220-163 684,980ALOHA BOWL
Dec. 28 L ....Alabama................15 3-24 N2 35,183(6-6-0) 223-187 720,163
N1-Tokyo Olympic Memorial Stadium, Tokyo, JapanN2-Aloha Stadium, Honolulu, Hawaii*-Mirage Bowl
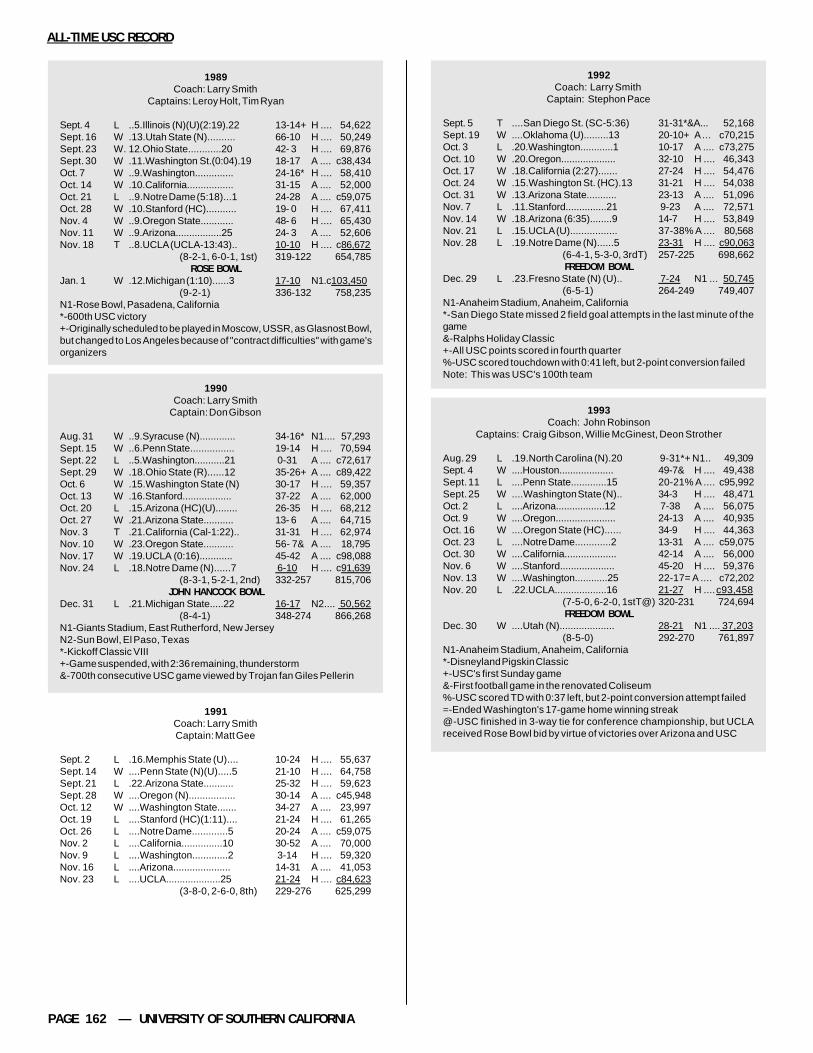
PAGE 162 — UNIVERSITY OF SOUTHERN CALIFORNIA
1989Coach: Larry Smith
Captains: Leroy Holt, Tim Ryan
Sept. 4 L ..5.Illinois (N)(U)(2:19).22 13-14+ H .... 54,622Sept. 16 W .13.Utah State (N).......... 66-10 H .... 50,249Sept. 23 W. 12.Ohio State............20 42- 3 H .... 69,876Sept. 30 W .11.Washington St.(0:04).19 18-17 A .... c38,434Oct. 7 W ..9.Washington.............. 24-16* H .... 58,410Oct. 14 W .10.California................. 31-15 A .... 52,000Oct. 21 L ..9.Notre Dame (5:18)...1 24-28 A .... c59,075Oct. 28 W .10.Stanford (HC)........... 19- 0 H .... 67,411Nov. 4 W ..9.Oregon State............ 48- 6 H .... 65,430Nov. 11 W ..9.Arizona.................25 24- 3 A .... 52,606Nov. 18 T ..8.UCLA (UCLA-13:43).. 10-10 H .... c86,672
(8-2-1, 6-0-1, 1st) 319-122 654,785ROSE BOWL
Jan. 1 W .12.Michigan (1:10)......3 17-10 N1.c103,450(9-2-1) 336-132 758,235
N1-Rose Bowl, Pasadena, California*-600th USC victory+-Originally scheduled to be played in Moscow, USSR, as Glasnost Bowl,but changed to Los Angeles because of "contract difficulties" with game'sorganizers
1990Coach: Larry Smith
Captain: Don Gibson
Aug. 31 W ..9.Syracuse (N)............. 34-16* N1.... 57,293Sept. 15 W ..6.Penn State................ 19-14 H .... 70,594Sept. 22 L ..5.Washington...........21 0-31 A .... c72,617Sept. 29 W .18.Ohio State (R)......12 35-26+ A .... c89,422Oct. 6 W .15.Washington State (N) 30-17 H .... 59,357Oct. 13 W .16.Stanford.................. 37-22 A .... 62,000Oct. 20 L .15.Arizona (HC)(U)........ 26-35 H .... 68,212Oct. 27 W .21.Arizona State........... 13- 6 A .... 64,715Nov. 3 T .21.California (Cal-1:22).. 31-31 H .... 62,974Nov. 10 W .23.Oregon State........... 56- 7& A .... 18,795Nov. 17 W .19.UCLA (0:16)............ 45-42 A .... c98,088Nov. 24 L .18.Notre Dame (N)......7 6-10 H .... c91,639
(8-3-1, 5-2-1, 2nd) 332-257 815,706JOHN HANCOCK BOWL
Dec. 31 L .21.Michigan State.....22 16-17 N2.... 50,562(8-4-1) 348-274 866,268
N1-Giants Stadium, East Rutherford, New JerseyN2-Sun Bowl, El Paso, Texas*-Kickoff Classic VIII+-Game suspended, with 2:36 remaining, thunderstorm&-700th consecutive USC game viewed by Trojan fan Giles Pellerin
1991Coach: Larry SmithCaptain: Matt Gee
Sept. 2 L .16.Memphis State (U).... 10-24 H .... 55,637Sept. 14 W ....Penn State (N)(U).....5 21-10 H .... 64,758Sept. 21 L .22.Arizona State........... 25-32 H .... 59,623Sept. 28 W ....Oregon (N)................. 30-14 A .... c45,948Oct. 12 W ....Washington State....... 34-27 A .... 23,997Oct. 19 L ....Stanford (HC)(1:11).... 21-24 H .... 61,265Oct. 26 L ....Notre Dame.............5 20-24 A .... c59,075Nov. 2 L ....California...............10 30-52 A .... 70,000Nov. 9 L ....Washington.............2 3-14 H .... 59,320Nov. 16 L ....Arizona..................... 14-31 A .... 41,053Nov. 23 L ....UCLA....................25 21-24 H .... c84,623
(3-8-0, 2-6-0, 8th) 229-276 625,299
ALL-TIME USC RECORD
1992Coach: Larry Smith
Captain: Stephon Pace
Sept. 5 T ....San Diego St. (SC-5:36) 31-31*&A... 52,168Sept. 19 W ....Oklahoma (U).........13 20-10+ A ... c70,215Oct. 3 L .20.Washington............1 10-17 A .... c73,275Oct. 10 W .20.Oregon.................... 32-10 H .... 46,343Oct. 17 W .18.California (2:27)....... 27-24 H .... 54,476Oct. 24 W .15.Washington St. (HC).13 31-21 H .... 54,038Oct. 31 W .13.Arizona State........... 23-13 A .... 51,096Nov. 7 L .11.Stanford...............21 9-23 A .... 72,571Nov. 14 W .18.Arizona (6:35)........9 14-7 H .... 53,849Nov. 21 L .15.UCLA (U)................. 37-38% A .... 80,568Nov. 28 L .19.Notre Dame (N)......5 23-31 H .... c90,063
(6-4-1, 5-3-0, 3rdT) 257-225 698,662FREEDOM BOWL
Dec. 29 L .23.Fresno State (N) (U).. 7-24 N1 ... 50,745(6-5-1) 264-249 749,407
N1-Anaheim Stadium, Anaheim, California*-San Diego State missed 2 field goal attempts in the last minute of thegame&-Ralphs Holiday Classic+-All USC points scored in fourth quarter%-USC scored touchdown with 0:41 left, but 2-point conversion failedNote: This was USC's 100th team
1993Coach: John Robinson
Captains: Craig Gibson, Willie McGinest, Deon Strother
Aug. 29 L .19.North Carolina (N).20 9-31*+ N1.. 49,309Sept. 4 W ....Houston.................... 49-7& H .... 49,438Sept. 11 L ....Penn State.............15 20-21% A .... c95,992Sept. 25 W ....Washington State (N).. 34-3 H .... 48,471Oct. 2 L ....Arizona..................12 7-38 A .... 56,075Oct. 9 W ....Oregon...................... 24-13 A .... 40,935Oct. 16 W ....Oregon State (HC)...... 34-9 H .... 44,363Oct. 23 L ....Notre Dame.............2 13-31 A .... c59,075Oct. 30 W ....California................... 42-14 A .... 56,000Nov. 6 W ....Stanford.................... 45-20 H .... 59,376Nov. 13 W ....Washington............25 22-17= A .... c72,202Nov. 20 L .22.UCLA...................16 21-27 H .... c93,458
(7-5-0, 6-2-0, 1stT@) 320-231 724,694FREEDOM BOWL
Dec. 30 W ....Utah (N).................... 28-21 N1 .... 37,203(8-5-0) 292-270 761,897
N1-Anaheim Stadium, Anaheim, California*-Disneyland Pigskin Classic+-USC's first Sunday game&-First football game in the renovated Coliseum%-USC scored TD with 0:37 left, but 2-point conversion attempt failed=-Ended Washington's 17-game home winning streak@-USC finished in 3-way tie for conference championship, but UCLAreceived Rose Bowl bid by virtue of victories over Arizona and USC

2002 FOOTBALL MEDIA GUIDE — PAGE 163
1994Coach: John Robinson
Captains: Tony Boselli, Jeff Kopp, Brian Williams
Sept. 3 W .13.Washington (7:14).23 24-17* H .... 54,538Sept. 10 L .14.Penn State..............8 14-38 A .... c96,463Sept. 24 W .19.Baylor (N)..............24 37-27 H .... 45,762Oct. 1 L .19.Oregon (U)................ 7-22 H .... 44,232Oct. 8 W ....Oregon State.............. 27-19% A .... 33,892Oct. 15 W ....Stanford..................... 27-20 A .... 60,345Oct. 22 W ....California (HC)............. 61-0 H .... 55,213Nov. 5 W .22.Washington State(Cold).16 23-10 A .... 36,686Nov. 12 W .17.Arizona.................13 45-28 H .... 61,264Nov. 19 L .13.UCLA....................... 19-31 A .... 91,815Nov. 26 T .17.Notre Dame(N)(Cold)(SC-4:53) 17-17& H .... c90,217
(7-3-1, 6-2-0, 2ndT) 301-229 670,427COTTON BOWL
Jan. 2 W .21.Texas Tech.................. 55-14 N1 ....c70,218(8-3-1) 356-243 740,645
N1-Cotton Bowl, Dallas, Texas*-First football game in the post-earthquake renovated Coliseum%-Micah Phillips scored USC's first-ever defensive extra point&-750th consecutive USC game viewed by Trojan fan Giles Pellerin
1995Coach: John Robinson
Captains: Terry Barnum, Errick Herrin
Sept. 9 W ..7.San Jose State.......... 45-7 H .... 50,612Sept. 16 W ..6.Houston (N)............... 45-10 H .... 50,279Sept. 23 W ..5.Arizona (N).............25 31-10 A .... c58,503Sept. 30 W ..5.Arizona State............. 31-0 H .... 52,577Oct. 7 W ..5.California................... 26-16 A .... 49,000Oct. 14 W ..5.Washington State...... 26-14 H .... 51,131Oct. 21 L ..5.Notre Dame (R)......17 10-38 A .... c59,075Oct. 28 T .13.Washington (USC-0:33).17 21-21* A .... c74,421Nov. 4 W .14.Stanford (HC)(0:39).. 31-30 H .... 62,368Nov. 11 W .12.Oregon State (N)...... 28-10 A .... 21,851Nov. 18 L .11.UCLA ........................... 20-24 H .... c91,363
(8-2-1, 6-1-1, 1stT@) 314-180 621,183ROSE BOWL
Jan. 1 W .17.Northwestern ..........3 41-32+ N1 ..c100,102(9-2-1) 355-212 721,285
N1-Rose Bowl, Pasadena, California*-Trailing 21-0, USC scored 21 unanswered points in fourth quarter+-50th anniversary of Pac-10/Big Ten Rose Bowl agreement@-USC won Pac-10 bid to Rose Bowl on basis of better overall record thanWashington
1996Coach: John Robinson
Captains: John Allred, Sammy Knight
Aug. 25 L ..7.Penn State..............11 7-24* N1... c77,716Sept. 7 W .19.Illinois......................... 55-3 A.... 56,504Sept. 14 W .16.Oregon State............. 46-17 H.... 48,069Sept. 21 W .15.Houston.................... 26-9 A.... 21,035Oct. 5 L .17.California (U)............ 15-22 H.... 51,511Oct. 12 W ....Arizona....................... 14-7 H.... 51,088Oct. 19 L ....Arizona State (AS-1:30).4 35-48+ A.... c74,947Oct. 26 W ....Washington St. (Cold)(2:05)(N) 29-24 A.... 33,111Nov. 2 L ....Washington (HC).....21 10-21 H.... 60,039Nov. 9 L ....Stanford (N)................ 20-24 A.... 41,980Nov. 23 L ....UCLA (UCLA-0:39).... 41-48& A.... 80,644Nov. 30 W ....Notre Dame (N)(U)(SC-1:50).10 27-20@ H.... c90,296
(6-6, 3-5, 5thT) 325-267 686,940N1-Giants Stadium, East Rutherford, New Jersey*-Kickoff Classic XIV+-Two overtimes; USC's first overtime game&-Two overtimes; UCLA scored 17 points in the final 6:12 of fourth quarterto erase 17-point deficit@-One overtime; USC's first overtime game at the Coliseum
1997Coach: John Robinson
Captains: Jonathan Himebauch, Brian Kelly
Sept. 6 L .23.Florida State (N)(10:40).5 7-14 H.... 72,783Sept. 13 L .23.Washington State (4:18) 21-28 H.... 51,655Sept. 27 W ....California..................... 27-17 A.... 54,000Oct. 4 W ....UNLV (N)..................... 35-21* H.... 48,404Oct. 11 L ....Arizona State.............. 7-35 A.... 61,802Oct. 18 W ....Notre Dame (1:05)....... 20-17 A.... c80,225Oct. 25 W ....Oregon (HC)(N)........... 24-22 H.... 53,640Nov. 1 L ....Washington................7 0-27 A.... 73,401Nov. 8 W ....Stanford...................... 45-21 H.... 58,900Nov. 15 W ....Oregon State............... 23-0+ A.... 20,938Nov. 22 L ....UCLA.........................7 24-31 H.... c91,350
(6-5, 4-4, 5thT) 233-233 667,098*-100th collegiate victory for USC coach John Robinson; USC scoredgame's final 21 points+Ended USC's streak of 111 consecutive live football telecasts
1998Coach: Paul Hackett
Captains: Adam Abrams, Chris Claiborne, Billy Miller, Chad Morton
Aug. 30 W ....Purdue (a.m.)............... 27-17*+H.... 56,623Sept. 12 W .22.San Diego State (N).. 35-6 H.... 49,927Sept. 19 W .18.Oregon State (N)....... 40-20 H.... 45,629Sept. 26 L .18.Florida State...........10 10-30 A.... 79,815Oct. 3 W .21.Arizona State............. 35-24@ H.... 56,093Oct. 10 L .19.California (U)(3:30).... 31-32 H.... 65,678Oct. 17 W ....Washington State (Cold)(N) 42-14 A.... 31,178Oct. 24 L ....Oregon.....................12 13-17 A.... c45,807Oct. 31 W ....Washington (HC)......... 33-10 H.... 62,276Nov. 7 W ....Stanford...................... 34-9 A.... 43,250Nov. 21 L ....UCLA.........................3 17-34% A.... c88,080Nov. 28 W ....Notre Dame (N)..........9 10-0& H.... 90,069
(8-4, 5-3, 3rd T) 327-213 714,452SUN BOWL
Dec. 31 L ....TCU (U)....................... 19-28 N1... 46,612(8-5) 346-241 761,064
N1-Sun Bowl, El Paso, Texas*-Pigskin Classic IX+-118 degrees on the field; USC scored 17 points in last 2:11 of game@-USC outscored ASU 22-0 in fourth quarter%-91-year-old USC "Super Fan" Giles Pellerin, who was viewing his 797thconsecutive Trojan game, died of cardiac arrest at halftime in the RoseBowl parking lot&-First time Notre Dame was shut out since 1987Note: This was the 75th anniversary of USC football in the Coliseum
This was Jack Ward's 40th anniversary as USC's head trainer
1999Coach: Paul Hackett
Captains: David Gibson, Chad Morton, Ifeanyi Ohalete
Sept. 4 W .21.Hawaii (N)................. 62-7 A.... c50,000Sept. 18 W .17.San Diego State........ 24-21 H.... 53,966Sept. 25 L .16.Oregon (N)(UO-0:30) 30-33+ A.... c45,660Oct. 2 W ....Oregon State............... 37-29* H.... 43,795Oct. 9 L .22.Arizona...................... 24-31 A.... 51,418Oct. 16 L ....Notre Dame (R)(2:40). 24-25% A.... c80,012Oct. 23 L ....Stanford (14:56).......... 31-35** H.... 57,494Oct. 30 L ....California..................... 7-17 A.... 54,000Nov. 6 L ....Arizona State (HC)...... 16-26 H.... 53,382Nov. 13 W ....Washington State........ 31-28 A.... 23,065Nov. 20 W ....UCLA........................... 17-7 H.... 91,384Nov. 26 W ....Louisiana Tech.......25 45-19 H.... 45,070
(6-6, 3-5, 6thT) 348-278 649,246+-Three overtimes; USC's longest game ever*-USC's 1,000th game%-Trailing 24-3, Notre Dame scored 22 unanswered points in second half**-USC led 21-0 in first quarter
ALL-TIME USC RECORD
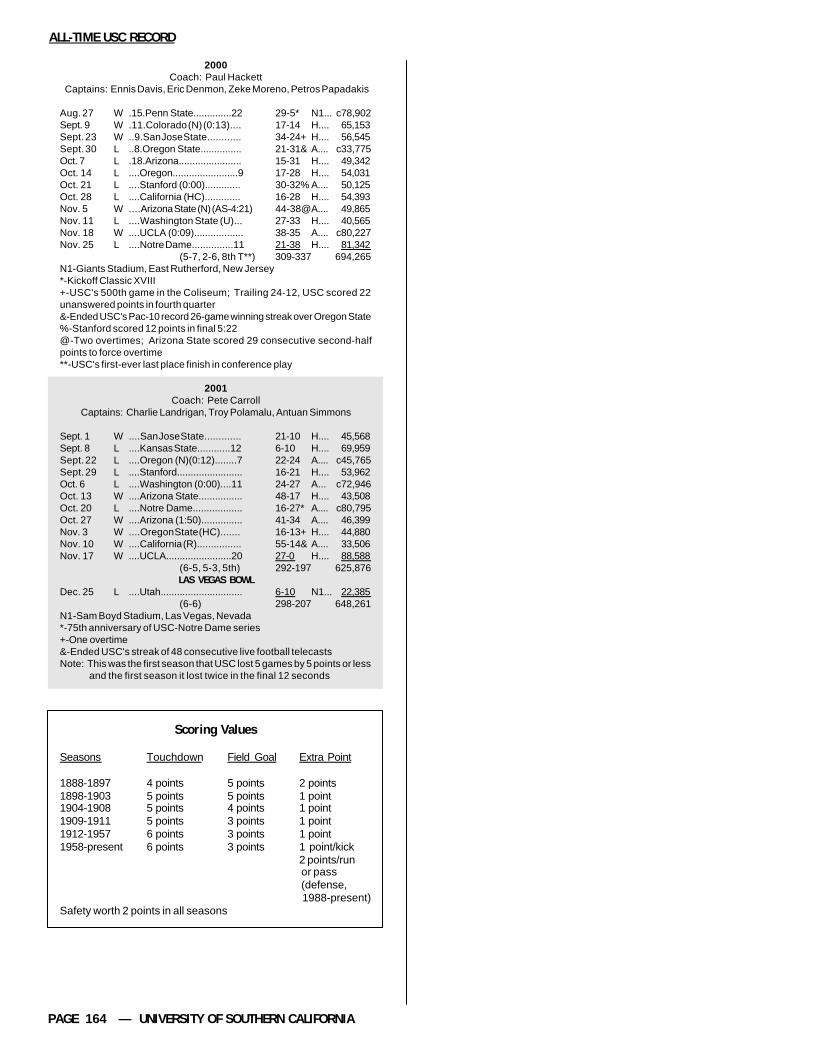
PAGE 164 — UNIVERSITY OF SOUTHERN CALIFORNIA
2000Coach: Paul Hackett
Captains: Ennis Davis, Eric Denmon, Zeke Moreno, Petros Papadakis
Aug. 27 W .15.Penn State..............22 29-5* N1... c78,902Sept. 9 W .11.Colorado (N) (0:13).... 17-14 H.... 65,153Sept. 23 W ..9.San Jose State............ 34-24+ H.... 56,545Sept. 30 L ..8.Oregon State............... 21-31& A.... c33,775Oct. 7 L .18.Arizona....................... 15-31 H.... 49,342Oct. 14 L ....Oregon........................9 17-28 H.... 54,031Oct. 21 L ....Stanford (0:00)............. 30-32% A.... 50,125Oct. 28 L ....California (HC)............. 16-28 H.... 54,393Nov. 5 W ....Arizona State (N) (AS-4:21) 44-38@A.... 49,865Nov. 11 L ....Washington State (U)... 27-33 H.... 40,565Nov. 18 W ....UCLA (0:09).................. 38-35 A.... c80,227Nov. 25 L ....Notre Dame...............11 21-38 H.... 81,342
(5-7, 2-6, 8th T**) 309-337 694,265N1-Giants Stadium, East Rutherford, New Jersey*-Kickoff Classic XVIII+-USC's 500th game in the Coliseum; Trailing 24-12, USC scored 22unanswered points in fourth quarter&-Ended USC's Pac-10 record 26-game winning streak over Oregon State%-Stanford scored 12 points in final 5:22@-Two overtimes; Arizona State scored 29 consecutive second-halfpoints to force overtime**-USC's first-ever last place finish in conference play
2001Coach: Pete Carroll
Captains: Charlie Landrigan, Troy Polamalu, Antuan Simmons
Sept. 1 W ....San Jose State............. 21-10 H.... 45,568Sept. 8 L ....Kansas State............12 6-10 H.... 69,959Sept. 22 L ....Oregon (N)(0:12)........7 22-24 A.... c45,765Sept. 29 L ....Stanford........................ 16-21 H.... 53,962Oct. 6 L ....Washington (0:00)....11 24-27 A... c72,946Oct. 13 W ....Arizona State................ 48-17 H.... 43,508Oct. 20 L ....Notre Dame.................. 16-27* A.... c80,795Oct. 27 W ....Arizona (1:50)............... 41-34 A.... 46,399Nov. 3 W ....Oregon State (HC)....... 16-13+ H.... 44,880Nov. 10 W ....California (R)................ 55-14& A.... 33,506Nov. 17 W ....UCLA........................20 27-0 H.... 88,588
(6-5, 5-3, 5th) 292-197 625,876LAS VEGAS BOWL
Dec. 25 L ....Utah.............................. 6-10 N1... 22,385(6-6) 298-207 648,261
N1-Sam Boyd Stadium, Las Vegas, Nevada*-75th anniversary of USC-Notre Dame series+-One overtime&-Ended USC's streak of 48 consecutive live football telecastsNote: This was the first season that USC lost 5 games by 5 points or less
and the first season it lost twice in the final 12 seconds
Scoring Values
Seasons Touchdown Field Goal Extra Point
1888-1897 4 points 5 points 2 points1898-1903 5 points 5 points 1 point1904-1908 5 points 4 points 1 point1909-1911 5 points 3 points 1 point1912-1957 6 points 3 points 1 point1958-present 6 points 3 points 1 point/kick
2 points/run or pass (defense, 1988-present)
Safety worth 2 points in all seasons
ALL-TIME USC RECORD
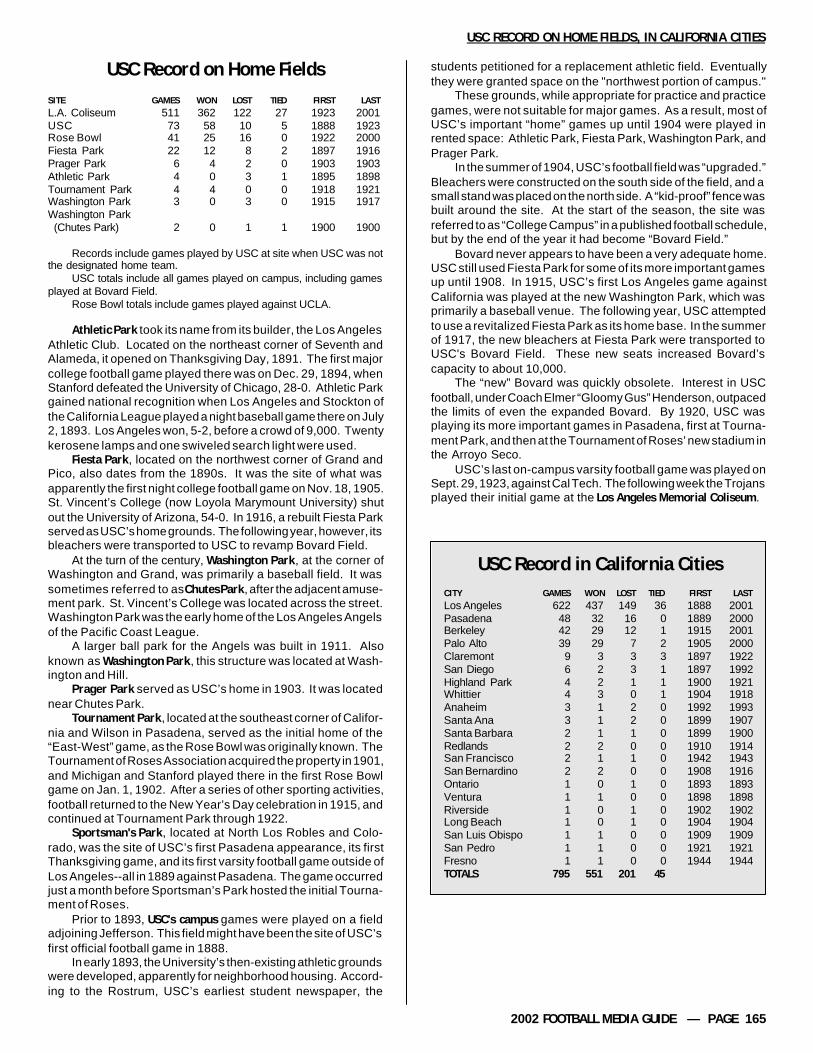
2002 FOOTBALL MEDIA GUIDE — PAGE 165
USC RECORD ON HOME FIELDS, IN CALIFORNIA CITIES
USC Record on Home FieldsSITE GAMES WON LOST TIED FIRST LASTL.A. Coliseum 511 362 122 27 1923 2001USC 73 58 10 5 1888 1923Rose Bowl 41 25 16 0 1922 2000Fiesta Park 22 12 8 2 1897 1916Prager Park 6 4 2 0 1903 1903Athletic Park 4 0 3 1 1895 1898Tournament Park 4 4 0 0 1918 1921Washington Park 3 0 3 0 1915 1917Washington Park (Chutes Park) 2 0 1 1 1900 1900
Records include games played by USC at site when USC was notthe designated home team.
USC totals include all games played on campus, including gamesplayed at Bovard Field.
Rose Bowl totals include games played against UCLA.
Athletic Park took its name from its builder, the Los AngelesAthletic Club. Located on the northeast corner of Seventh andAlameda, it opened on Thanksgiving Day, 1891. The first majorcollege football game played there was on Dec. 29, 1894, whenStanford defeated the University of Chicago, 28-0. Athletic Parkgained national recognition when Los Angeles and Stockton ofthe California League played a night baseball game there on July2, 1893. Los Angeles won, 5-2, before a crowd of 9,000. Twentykerosene lamps and one swiveled search light were used.
Fiesta Park, located on the northwest corner of Grand andPico, also dates from the 1890s. It was the site of what wasapparently the first night college football game on Nov. 18, 1905.St. Vincent’s College (now Loyola Marymount University) shutout the University of Arizona, 54-0. In 1916, a rebuilt Fiesta Parkserved as USC’s home grounds. The following year, however, itsbleachers were transported to USC to revamp Bovard Field.
At the turn of the century, Washington Park, at the corner ofWashington and Grand, was primarily a baseball field. It wassometimes referred to as Chutes Park, after the adjacent amuse-ment park. St. Vincent’s College was located across the street.Washington Park was the early home of the Los Angeles Angelsof the Pacific Coast League.
A larger ball park for the Angels was built in 1911. Alsoknown as Washington Park, this structure was located at Wash-ington and Hill.
Prager Park served as USC’s home in 1903. It was locatednear Chutes Park.
Tournament Park, located at the southeast corner of Califor-nia and Wilson in Pasadena, served as the initial home of the“East-West” game, as the Rose Bowl was originally known. TheTournament of Roses Association acquired the property in 1901,and Michigan and Stanford played there in the first Rose Bowlgame on Jan. 1, 1902. After a series of other sporting activities,football returned to the New Year’s Day celebration in 1915, andcontinued at Tournament Park through 1922.
Sportsman's Park, located at North Los Robles and Colo-rado, was the site of USC’s first Pasadena appearance, its firstThanksgiving game, and its first varsity football game outside ofLos Angeles--all in 1889 against Pasadena. The game occurredjust a month before Sportsman’s Park hosted the initial Tourna-ment of Roses.
Prior to 1893, USC's campus games were played on a fieldadjoining Jefferson. This field might have been the site of USC’sfirst official football game in 1888.
In early 1893, the University’s then-existing athletic groundswere developed, apparently for neighborhood housing. Accord-ing to the Rostrum, USC’s earliest student newspaper, the
students petitioned for a replacement athletic field. Eventuallythey were granted space on the "northwest portion of campus."
These grounds, while appropriate for practice and practicegames, were not suitable for major games. As a result, most ofUSC’s important “home” games up until 1904 were played inrented space: Athletic Park, Fiesta Park, Washington Park, andPrager Park.
In the summer of 1904, USC’s football field was “upgraded.”Bleachers were constructed on the south side of the field, and asmall stand was placed on the north side. A “kid-proof” fence wasbuilt around the site. At the start of the season, the site wasreferred to as “College Campus” in a published football schedule,but by the end of the year it had become “Bovard Field.”
Bovard never appears to have been a very adequate home.USC still used Fiesta Park for some of its more important gamesup until 1908. In 1915, USC’s first Los Angeles game againstCalifornia was played at the new Washington Park, which wasprimarily a baseball venue. The following year, USC attemptedto use a revitalized Fiesta Park as its home base. In the summerof 1917, the new bleachers at Fiesta Park were transported toUSC's Bovard Field. These new seats increased Bovard’scapacity to about 10,000.
The “new” Bovard was quickly obsolete. Interest in USCfootball, under Coach Elmer “Gloomy Gus” Henderson, outpacedthe limits of even the expanded Bovard. By 1920, USC wasplaying its more important games in Pasadena, first at Tourna-ment Park, and then at the Tournament of Roses’ new stadium inthe Arroyo Seco.
USC’s last on-campus varsity football game was played onSept. 29, 1923, against Cal Tech. The following week the Trojansplayed their initial game at the Los Angeles Memorial Coliseum.
USC Record in California CitiesCITY GAMES WON LOST TIED FIRST LASTLos Angeles 622 437 149 36 1888 2001Pasadena 48 32 16 0 1889 2000Berkeley 42 29 12 1 1915 2001Palo Alto 39 29 7 2 1905 2000Claremont 9 3 3 3 1897 1922San Diego 6 2 3 1 1897 1992Highland Park 4 2 1 1 1900 1921Whittier 4 3 0 1 1904 1918Anaheim 3 1 2 0 1992 1993Santa Ana 3 1 2 0 1899 1907Santa Barbara 2 1 1 0 1899 1900Redlands 2 2 0 0 1910 1914San Francisco 2 1 1 0 1942 1943San Bernardino 2 2 0 0 1908 1916Ontario 1 0 1 0 1893 1893Ventura 1 1 0 0 1898 1898Riverside 1 0 1 0 1902 1902Long Beach 1 0 1 0 1904 1904San Luis Obispo 1 1 0 0 1909 1909San Pedro 1 1 0 0 1921 1921Fresno 1 1 0 0 1944 1944TOTALS 795 551 201 45
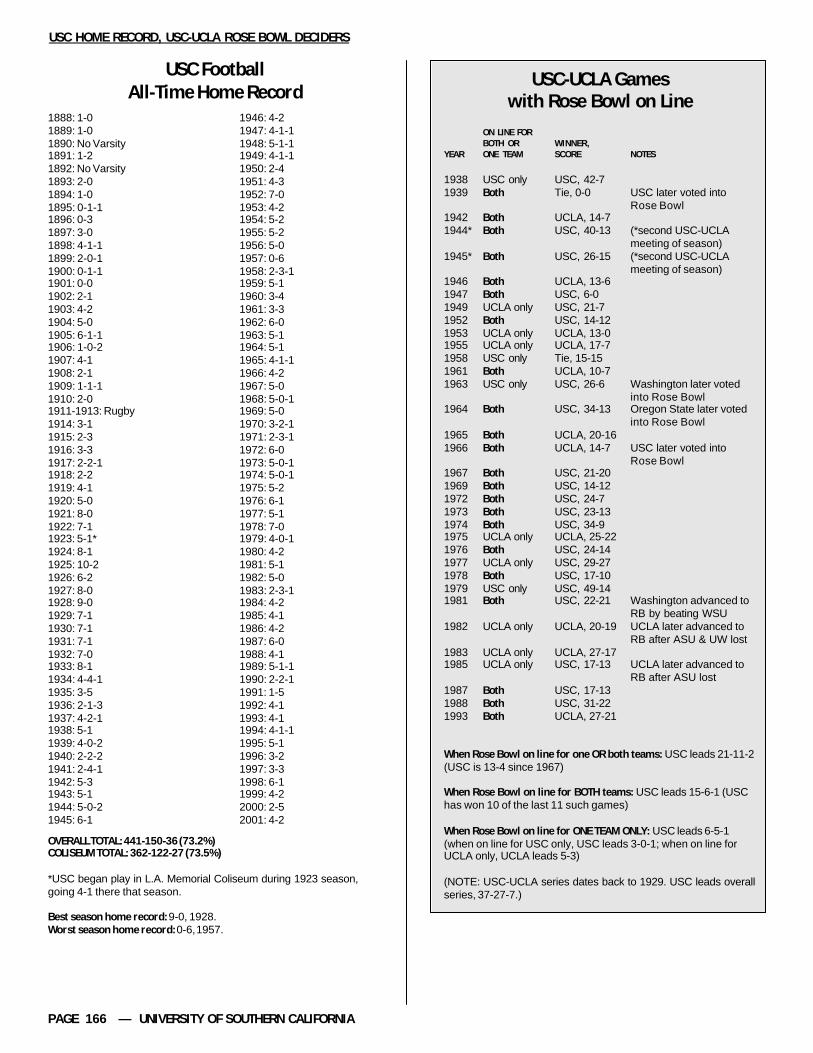
PAGE 166 — UNIVERSITY OF SOUTHERN CALIFORNIA
1946: 4-21947: 4-1-11948: 5-1-11949: 4-1-11950: 2-41951: 4-31952: 7-01953: 4-21954: 5-21955: 5-21956: 5-01957: 0-61958: 2-3-11959: 5-11960: 3-41961: 3-31962: 6-01963: 5-11964: 5-11965: 4-1-11966: 4-21967: 5-01968: 5-0-11969: 5-01970: 3-2-11971: 2-3-11972: 6-01973: 5-0-11974: 5-0-11975: 5-21976: 6-11977: 5-11978: 7-01979: 4-0-11980: 4-21981: 5-11982: 5-01983: 2-3-11984: 4-21985: 4-11986: 4-21987: 6-01988: 4-11989: 5-1-11990: 2-2-11991: 1-51992: 4-11993: 4-11994: 4-1-11995: 5-11996: 3-21997: 3-31998: 6-11999: 4-22000: 2-52001: 4-2
USC-UCLA Gameswith Rose Bowl on Line
ON LINE FORBOTH OR WINNER,
YEAR ONE TEAM SCORE NOTES
1938 USC only USC, 42-71939 Both Tie, 0-0 USC later voted into
Rose Bowl1942 Both UCLA, 14-71944* Both USC, 40-13 (*second USC-UCLA
meeting of season)1945* Both USC, 26-15 (*second USC-UCLA
meeting of season)1946 Both UCLA, 13-61947 Both USC, 6-01949 UCLA only USC, 21-71952 Both USC, 14-121953 UCLA only UCLA, 13-01955 UCLA only UCLA, 17-71958 USC only Tie, 15-151961 Both UCLA, 10-71963 USC only USC, 26-6 Washington later voted
into Rose Bowl1964 Both USC, 34-13 Oregon State later voted
into Rose Bowl1965 Both UCLA, 20-161966 Both UCLA, 14-7 USC later voted into
Rose Bowl1967 Both USC, 21-201969 Both USC, 14-121972 Both USC, 24-71973 Both USC, 23-131974 Both USC, 34-91975 UCLA only UCLA, 25-221976 Both USC, 24-141977 UCLA only USC, 29-271978 Both USC, 17-101979 USC only USC, 49-141981 Both USC, 22-21 Washington advanced to
RB by beating WSU1982 UCLA only UCLA, 20-19 UCLA later advanced to
RB after ASU & UW lost1983 UCLA only UCLA, 27-171985 UCLA only USC, 17-13 UCLA later advanced to
RB after ASU lost1987 Both USC, 17-131988 Both USC, 31-221993 Both UCLA, 27-21
When Rose Bowl on line for one OR both teams: USC leads 21-11-2(USC is 13-4 since 1967)
When Rose Bowl on line for BOTH teams: USC leads 15-6-1 (USChas won 10 of the last 11 such games)
When Rose Bowl on line for ONE TEAM ONLY: USC leads 6-5-1(when on line for USC only, USC leads 3-0-1; when on line forUCLA only, UCLA leads 5-3)
(NOTE: USC-UCLA series dates back to 1929. USC leads overallseries, 37-27-7.)
USC HOME RECORD, USC-UCLA ROSE BOWL DECIDERS
1888: 1-01889: 1-01890: No Varsity1891: 1-21892: No Varsity1893: 2-01894: 1-01895: 0-1-11896: 0-31897: 3-01898: 4-1-11899: 2-0-11900: 0-1-11901: 0-01902: 2-11903: 4-21904: 5-01905: 6-1-11906: 1-0-21907: 4-11908: 2-11909: 1-1-11910: 2-01911-1913: Rugby1914: 3-11915: 2-31916: 3-31917: 2-2-11918: 2-21919: 4-11920: 5-01921: 8-01922: 7-11923: 5-1*1924: 8-11925: 10-21926: 6-21927: 8-01928: 9-01929: 7-11930: 7-11931: 7-11932: 7-01933: 8-11934: 4-4-11935: 3-51936: 2-1-31937: 4-2-11938: 5-11939: 4-0-21940: 2-2-21941: 2-4-11942: 5-31943: 5-11944: 5-0-21945: 6-1
USC FootballAll-Time Home Record
OVERALL TOTAL: 441-150-36 (73.2%)COLISEUM TOTAL: 362-122-27 (73.5%)
*USC began play in L.A. Memorial Coliseum during 1923 season,going 4-1 there that season.
Best season home record: 9-0, 1928.Worst season home record: 0-6, 1957.

2002 FOOTBALL MEDIA GUIDE — PAGE 167
Over the years, USC has been involved in many games featuringdramatic finishes at the end. Here’s a sampling of some of the morefamous such contests.
1931--USC 16, Notre Dame 14. Johnny Baker kicked a game-winning 33-yard field goal with 1:00 remaining. All of USC’s pointscame in the fourth quarter. The win snapped Notre Dame’s 26-gameunbeaten streak and was USC’s first-ever win in South Bend. Troywon the national championship.
1938--USC 7, Duke 3 (1939 Rose Bowl). Al Krueger, a second-team end, and fourth-string quarterback Doyle Nave came off thebench to connect on 4 straight passes, the last a 19-yard TD withabout 40 seconds left to upset previously unbeaten, untied andunscored-upon Duke.
1939--USC 0, UCLA 0. Bobby Robertson knocked down NedMatthews’ 4-yard pass in the end zone with less than 5 minutes to playto preserve the tie for USC, sending the Trojans to the Rose Bowl.
1941--USC 13, Oregon State 7. Doug Essick caught a game-winning 6-yard pass from Ray Woods with 13 seconds to play.
1951--USC 21, California 14. Leon Sellers scored on a 2-yard runwith 2:44 left to snap Cal’s 38-game regular season winning streak.
1953--USC 23, Stanford 20. Sam Tsagalakis kicked a victorious38-yard field goal with 13 seconds left.
1958--USC 15, UCLA 15. Luther Hayes returned a kickoff 74 yardsfor a TD and Tom Maudlin ran in for the 2-point conversion with 6:50to play to get the Trojans a tie.
1964--USC 26, California 21. Behind 21-14 in the fourth quarter,USC scored twice late, the second time (while trailing 21-20) on a 22-yard pass from Craig Fertig to Rod Sherman with 50 seconds toculminate a 95-yard drive.
1964--USC 20, Notre Dame 17. Rod Sherman caught a 15-yard TDpass from Craig Fertig with 1:33 to play to upset unbeaten and top-ranked Notre Dame. USC was down, 17-0, at halftime.
1967--USC 21, UCLA 20. O.J. Simpson ran 64 yards for a TD with10:38 left in the fourth quarter to give USC a Rose Bowl berth and thenational championship. It is one of the most famous runs in collegefootball history.
1969--USC 26, Stanford 24. Ron Ayala kicked a game-winning 34-yard field goal with 0:00 on the clock.
1969--USC 14, UCLA 12. Jimmy Jones hit Sam Dickerson with a32-yard TD pass in the corner of the end zone with 1:32 left, puttingUSC in the Rose Bowl.
1973--USC 27, Stanford 26. Chris Limahelu kicked a game-winning 34-yard field goal with 3 seconds to play.
1974--USC 18, Ohio State 17 (1975 Rose Bowl). Johnny McKaycaught a 38-yard TD pass from Pat Haden with 2:03 remaining to pullUSC to within a point of Ohio State. Then Shelton Diggs grabbed thesubsequent 2-point conversion pass from Haden for the victory,which wrapped up a national championship for USC.
1977--USC 29, UCLA 27. Frank Jordan kicked a 38-yard field goalwith 2 seconds remaining, knocking UCLA out of the Rose Bowl.
1978--USC 27, Notre Dame 25. A year after his late game-winneragainst UCLA, Frank Jordan kicked a nearly-identical 37-yard fieldgoal with 2 seconds remaining to beat Notre Dame.
1979--USC 17, LSU 12. Kevin Williams caught a game-winning 8-yard TD pass from Paul McDonald with 32 seconds to play.
1979--USC 17, Ohio State 16 (1980 Rose Bowl). Charles Whitescored on a 1-yard run with 1:32 remaining. USC drove 83 yards in8 plays on the winning drive, with White carrying 6 times for 71 yards.
1980--USC 20, Tennessee 17. Eric Hipp kicked a victorious 47-yard field goal with 0:00 left.
1981--USC 28, Oklahoma 24. Fred Cornwell caught a 7-yard TDpass from John Mazur with 2 seconds to play to give No. 1 USC thewin over No. 2 Oklahoma.
1981--USC 14, Notre Dame 7. Todd Spencer ran 26 yards for thegame-winning TD with 4:52 to play.
1981--USC 22, UCLA 21. George Achica broke through the line onthe final play of the game to block Norm Johnson’s 46-yard field goaltry, preserving the win and knocking UCLA out of the Rose Bowl.
1982--USC 17, Notre Dame 13. Michael Harper, fumbling as hedove over the goal line, scored on a controversial winning 1-yard runwith 48 seconds to play. It was coach John Robinson’s last game ofhis first tenure at USC.
1983--USC 19, Florida 19. Timmie Ware caught a 25-yard passfrom Sean Salisbury with no time on the clock, but USC botched theextra point attempt as coach Ted Tollner’s debut ended in a tie.
1985--USC 17, UCLA 13. Rodney Peete scored the winning pointson a 1-yard sneak at 1:13 to go.
1986--USC 17, Baylor 14. Don Shafer kicked a game-winning 32-yard field goal in a driving rainstorm with 0:00 on the clock.
1987--USC 12, Arizona 10. Quin Rodriguez kicked an 18-yard fieldgoal with 1:11 remaining, his fourth three-pointer of the game.
1987--USC 17, UCLA 13. Erik Affholter made a juggling, corner-of-the-end zone 33-yard TD catch of a Rodney Peete pass with 7:59 toplay in the game, bringing USC all the way back from a 13-0 thirdquarter deficit. The win put USC in the Rose Bowl.
1988--USC 24, Stanford 20. John Jackson caught a game-winning 10-yard TD pass from Rodney Peete with 1:19 remaining.USC trailed, 13-0, in the second quarter.
1989--USC 18, Washington State 17. Known as “The Drive,” ToddMarinovich guided USC 91 yards in 18 plays (all through the air) with3:31 remaining, culminating with a 2-yard TD pass to Ricky Ervinswith 4 seconds to play. Marinovich then hit Gary Wellman for thewinning 2-point conversion.
1989--USC 10, UCLA 10. A 54-yard field goal try by UCLA’s AlfredoVelasco with 2 seconds to play hit the crossbar and bounced away,preserving the tie.
1989--USC 17, Michigan 10 (1990 Rose Bowl). Rose Bowl MVPRicky Ervins ran 14 yards for the winning TD with 1:10 to play to capa 75-yard drive.
1990--USC 35, Ohio State 26. The second half was played inheavy rain with thunder and lightning, getting so bad that officialssuspended the game with 2:36 to play after USC recovered an onsidekick.
1990--USC 31, California 31. Cal’s Robbie Keen missed a 43-yard field goal try with 4 seconds remaining, ending the game in a tie.
1990--USC 45, UCLA 42. In the highest-scoring and perhaps mostthrilling USC-UCLA game, Todd Marinovich threw a game-winning23-yard TD pass to Johnnie Morton with 16 seconds left. The contestfeatured a 42-point fourth quarter (including 3 TD’s in the final 3:09)with 4 lead changes. Morton also caught a 21-yard scoring TD fromMarinovich with 3:09 to play to give USC a short-lived 38-35 lead, butKevin Smith scored on a 1-yard run with 1:19 to go to put the Bruinsup 42-38.
1992--USC 31, San Diego State 31. San Diego State's Andy Trakasmissed 2 field goals (30 and 55 yards) in the last 0:54 to allow USCto hold onto the tie.
1992--USC 27, California 24. Down 24-13, Estrus Crayton scoredtwice in the final 5:45 on 2- and 1-yard runs, the second with 2:27 toplay to give USC the win. Brian Williams' interception with 2:19 to gosealed Troy's victory.
1995--USC 21, Washington 21. Down 21-0 going into the fourthquarter, USC scored 3 touchdowns, the last a 2-yard pass from BradOtton to Johnny McWilliams with 33 seconds to go (Adam Rendon'sPAT tied it), thus allowing the Trojans to keep hold of the inside trackin the Rose Bowl race.
1995--USC 31, Stanford 30. A week after the dramatic Washing-ton tie, USC--behind 16-0 in the second quarter--scored with 39
DRAMATIC FINISHES
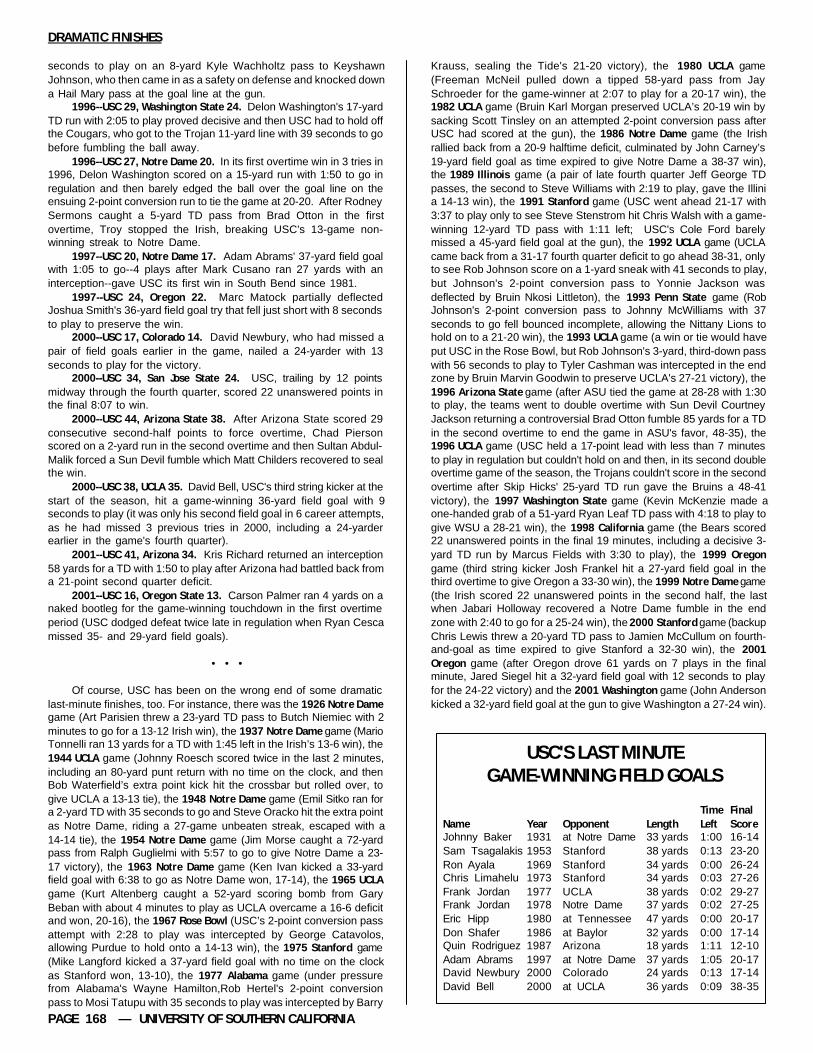
PAGE 168 — UNIVERSITY OF SOUTHERN CALIFORNIA
seconds to play on an 8-yard Kyle Wachholtz pass to KeyshawnJohnson, who then came in as a safety on defense and knocked downa Hail Mary pass at the goal line at the gun.
1996--USC 29, Washington State 24. Delon Washington's 17-yardTD run with 2:05 to play proved decisive and then USC had to hold offthe Cougars, who got to the Trojan 11-yard line with 39 seconds to gobefore fumbling the ball away.
1996--USC 27, Notre Dame 20. In its first overtime win in 3 tries in1996, Delon Washington scored on a 15-yard run with 1:50 to go inregulation and then barely edged the ball over the goal line on theensuing 2-point conversion run to tie the game at 20-20. After RodneySermons caught a 5-yard TD pass from Brad Otton in the firstovertime, Troy stopped the Irish, breaking USC's 13-game non-winning streak to Notre Dame.
1997--USC 20, Notre Dame 17. Adam Abrams' 37-yard field goalwith 1:05 to go--4 plays after Mark Cusano ran 27 yards with aninterception--gave USC its first win in South Bend since 1981.
1997--USC 24, Oregon 22. Marc Matock partially deflectedJoshua Smith's 36-yard field goal try that fell just short with 8 secondsto play to preserve the win.
2000--USC 17, Colorado 14. David Newbury, who had missed apair of field goals earlier in the game, nailed a 24-yarder with 13seconds to play for the victory.
2000--USC 34, San Jose State 24. USC, trailing by 12 pointsmidway through the fourth quarter, scored 22 unanswered points inthe final 8:07 to win.
2000--USC 44, Arizona State 38. After Arizona State scored 29consecutive second-half points to force overtime, Chad Piersonscored on a 2-yard run in the second overtime and then Sultan Abdul-Malik forced a Sun Devil fumble which Matt Childers recovered to sealthe win.
2000--USC 38, UCLA 35. David Bell, USC's third string kicker at thestart of the season, hit a game-winning 36-yard field goal with 9seconds to play (it was only his second field goal in 6 career attempts,as he had missed 3 previous tries in 2000, including a 24-yarderearlier in the game's fourth quarter).
2001--USC 41, Arizona 34. Kris Richard returned an interception58 yards for a TD with 1:50 to play after Arizona had battled back froma 21-point second quarter deficit.
2001--USC 16, Oregon State 13. Carson Palmer ran 4 yards on anaked bootleg for the game-winning touchdown in the first overtimeperiod (USC dodged defeat twice late in regulation when Ryan Cescamissed 35- and 29-yard field goals).
• • •
Of course, USC has been on the wrong end of some dramaticlast-minute finishes, too. For instance, there was the 1926 Notre Damegame (Art Parisien threw a 23-yard TD pass to Butch Niemiec with 2minutes to go for a 13-12 Irish win), the 1937 Notre Dame game (MarioTonnelli ran 13 yards for a TD with 1:45 left in the Irish’s 13-6 win), the1944 UCLA game (Johnny Roesch scored twice in the last 2 minutes,including an 80-yard punt return with no time on the clock, and thenBob Waterfield’s extra point kick hit the crossbar but rolled over, togive UCLA a 13-13 tie), the 1948 Notre Dame game (Emil Sitko ran fora 2-yard TD with 35 seconds to go and Steve Oracko hit the extra pointas Notre Dame, riding a 27-game unbeaten streak, escaped with a14-14 tie), the 1954 Notre Dame game (Jim Morse caught a 72-yardpass from Ralph Guglielmi with 5:57 to go to give Notre Dame a 23-17 victory), the 1963 Notre Dame game (Ken Ivan kicked a 33-yardfield goal with 6:38 to go as Notre Dame won, 17-14), the 1965 UCLAgame (Kurt Altenberg caught a 52-yard scoring bomb from GaryBeban with about 4 minutes to play as UCLA overcame a 16-6 deficitand won, 20-16), the 1967 Rose Bowl (USC’s 2-point conversion passattempt with 2:28 to play was intercepted by George Catavolos,allowing Purdue to hold onto a 14-13 win), the 1975 Stanford game(Mike Langford kicked a 37-yard field goal with no time on the clockas Stanford won, 13-10), the 1977 Alabama game (under pressurefrom Alabama's Wayne Hamilton,Rob Hertel's 2-point conversionpass to Mosi Tatupu with 35 seconds to play was intercepted by Barry
Krauss, sealing the Tide's 21-20 victory), the 1980 UCLA game(Freeman McNeil pulled down a tipped 58-yard pass from JaySchroeder for the game-winner at 2:07 to play for a 20-17 win), the1982 UCLA game (Bruin Karl Morgan preserved UCLA’s 20-19 win bysacking Scott Tinsley on an attempted 2-point conversion pass afterUSC had scored at the gun), the 1986 Notre Dame game (the Irishrallied back from a 20-9 halftime deficit, culminated by John Carney’s19-yard field goal as time expired to give Notre Dame a 38-37 win),the 1989 Illinois game (a pair of late fourth quarter Jeff George TDpasses, the second to Steve Williams with 2:19 to play, gave the Illinia 14-13 win), the 1991 Stanford game (USC went ahead 21-17 with3:37 to play only to see Steve Stenstrom hit Chris Walsh with a game-winning 12-yard TD pass with 1:11 left; USC's Cole Ford barelymissed a 45-yard field goal at the gun), the 1992 UCLA game (UCLAcame back from a 31-17 fourth quarter deficit to go ahead 38-31, onlyto see Rob Johnson score on a 1-yard sneak with 41 seconds to play,but Johnson's 2-point conversion pass to Yonnie Jackson wasdeflected by Bruin Nkosi Littleton), the 1993 Penn State game (RobJohnson's 2-point conversion pass to Johnny McWilliams with 37seconds to go fell bounced incomplete, allowing the Nittany Lions tohold on to a 21-20 win), the 1993 UCLA game (a win or tie would haveput USC in the Rose Bowl, but Rob Johnson's 3-yard, third-down passwith 56 seconds to play to Tyler Cashman was intercepted in the endzone by Bruin Marvin Goodwin to preserve UCLA's 27-21 victory), the1996 Arizona State game (after ASU tied the game at 28-28 with 1:30to play, the teams went to double overtime with Sun Devil CourtneyJackson returning a controversial Brad Otton fumble 85 yards for a TDin the second overtime to end the game in ASU's favor, 48-35), the1996 UCLA game (USC held a 17-point lead with less than 7 minutesto play in regulation but couldn't hold on and then, in its second doubleovertime game of the season, the Trojans couldn't score in the secondovertime after Skip Hicks' 25-yard TD run gave the Bruins a 48-41victory), the 1997 Washington State game (Kevin McKenzie made aone-handed grab of a 51-yard Ryan Leaf TD pass with 4:18 to play togive WSU a 28-21 win), the 1998 California game (the Bears scored22 unanswered points in the final 19 minutes, including a decisive 3-yard TD run by Marcus Fields with 3:30 to play), the 1999 Oregongame (third string kicker Josh Frankel hit a 27-yard field goal in thethird overtime to give Oregon a 33-30 win), the 1999 Notre Dame game(the Irish scored 22 unanswered points in the second half, the lastwhen Jabari Holloway recovered a Notre Dame fumble in the endzone with 2:40 to go for a 25-24 win), the 2000 Stanford game (backupChris Lewis threw a 20-yard TD pass to Jamien McCullum on fourth-and-goal as time expired to give Stanford a 32-30 win), the 2001Oregon game (after Oregon drove 61 yards on 7 plays in the finalminute, Jared Siegel hit a 32-yard field goal with 12 seconds to playfor the 24-22 victory) and the 2001 Washington game (John Andersonkicked a 32-yard field goal at the gun to give Washington a 27-24 win).
DRAMATIC FINISHES
USC'S LAST MINUTEGAME-WINNING FIELD GOALS
Time FinalName Year Opponent Length Left ScoreJohnny Baker 1931 at Notre Dame 33 yards 1:00 16-14Sam Tsagalakis 1953 Stanford 38 yards 0:13 23-20Ron Ayala 1969 Stanford 34 yards 0:00 26-24Chris Limahelu 1973 Stanford 34 yards 0:03 27-26Frank Jordan 1977 UCLA 38 yards 0:02 29-27Frank Jordan 1978 Notre Dame 37 yards 0:02 27-25Eric Hipp 1980 at Tennessee 47 yards 0:00 20-17Don Shafer 1986 at Baylor 32 yards 0:00 17-14Quin Rodriguez 1987 Arizona 18 yards 1:11 12-10Adam Abrams 1997 at Notre Dame 37 yards 1:05 20-17David Newbury 2000 Colorado 24 yards 0:13 17-14David Bell 2000 at UCLA 36 yards 0:09 38-35

2002 FOOTBALL MEDIA GUIDE — PAGE 169
“THE COMEBACK”1974: USC 55, Notre Dame 24
In what is regarded as one of the most dramatic andincredible comebacks in the history of college football, the 1974Trojans erased a 24-point deficit to beat Notre Dame, 55-24, inthe Coliseum. In a December 1998 list by SPORT magazine, thegame was ranked as the No. 6 top college football moment of the20th century.
USC trailed the Irish, 24-0, late in the first half, and theTrojans’ chances looked bleak because Notre Dame sported thenation’s top-ranked defense. But with 10 seconds remainingbefore halftime, Anthony Davis scored on a 7-yard pass from PatHaden (Troy missed the 2-point conversion) to send the Trojansinto the lockerroom behind 24-6...but with a glimmer of hope.
Davis took the opening kickoff of the second half and raced102 yards for a score, opening the floodgates as USC rallied for35 points in the third quarter. Davis scored 2 more times thatquarter, both on short runs, and Haden threw TD passes of 18and 45 yards to Johnny McKay.
Then, before 2 minutes had elapsed in the fourth quarter,Haden hit Shelton Diggs for a 16-yard score and Charles Phillipsreturned an interception 58 yards for a touchdown.
In all, USC blitzed to its 55 points in under 17 minutes.“We turned into madmen,” was how Davis described
the comeback.Added receiver Johnny McKay, son of USC coach John
McKay, right after the game: “I can’t understand it. I’mgonna sit down tonight and have a beer and think about it.Against Notre Dame? Maybe against Kent State...but NotreDame?”
The victory propelled USC, which then beat Ohio State inthe Rose Bowl, 18-17, to the national championship.
Interestingly, that Rose Bowl win was dramatic, too. USCtrailed, 17-10, with just minutes left. Then Haden teamed withMcKay on a 38-yard TD pass with 2:03 to go, and followed thatwith a 2-point conversion toss to Diggs for the victory.
THE COMEBACK
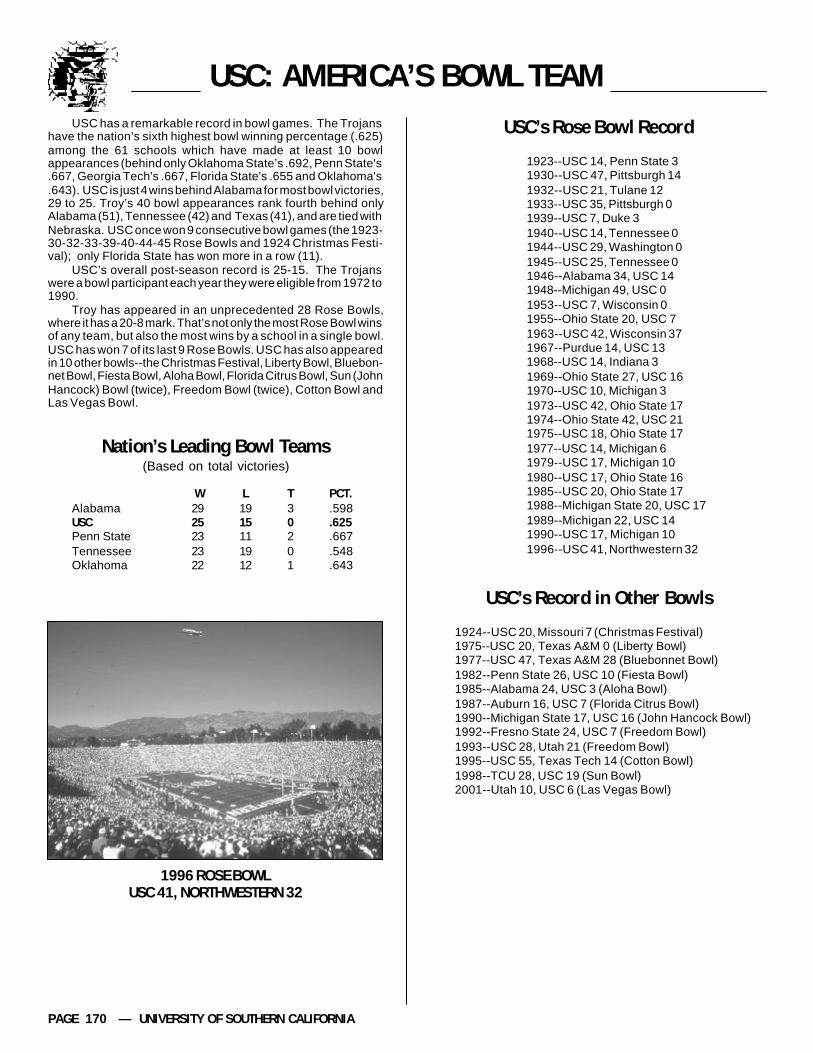
PAGE 170 — UNIVERSITY OF SOUTHERN CALIFORNIA
USC: AMERICA’S BOWL TEAMUSC has a remarkable record in bowl games. The Trojans
have the nation’s sixth highest bowl winning percentage (.625)among the 61 schools which have made at least 10 bowlappearances (behind only Oklahoma State’s .692, Penn State's.667, Georgia Tech's .667, Florida State's .655 and Oklahoma's.643). USC is just 4 wins behind Alabama for most bowl victories,29 to 25. Troy’s 40 bowl appearances rank fourth behind onlyAlabama (51), Tennessee (42) and Texas (41), and are tied withNebraska. USC once won 9 consecutive bowl games (the 1923-30-32-33-39-40-44-45 Rose Bowls and 1924 Christmas Festi-val); only Florida State has won more in a row (11).
USC’s overall post-season record is 25-15. The Trojanswere a bowl participant each year they were eligible from 1972 to1990.
Troy has appeared in an unprecedented 28 Rose Bowls,where it has a 20-8 mark. That’s not only the most Rose Bowl winsof any team, but also the most wins by a school in a single bowl.USC has won 7 of its last 9 Rose Bowls. USC has also appearedin 10 other bowls--the Christmas Festival, Liberty Bowl, Bluebon-net Bowl, Fiesta Bowl, Aloha Bowl, Florida Citrus Bowl, Sun (JohnHancock) Bowl (twice), Freedom Bowl (twice), Cotton Bowl andLas Vegas Bowl.
Nation’s Leading Bowl Teams(Based on total victories)
W L T PCT.Alabama 29 19 3 .598USC 25 15 0 .625Penn State 23 11 2 .667Tennessee 23 19 0 .548Oklahoma 22 12 1 .643
USC’s Rose Bowl Record
1923--USC 14, Penn State 31930--USC 47, Pittsburgh 141932--USC 21, Tulane 121933--USC 35, Pittsburgh 01939--USC 7, Duke 31940--USC 14, Tennessee 01944--USC 29, Washington 01945--USC 25, Tennessee 01946--Alabama 34, USC 141948--Michigan 49, USC 01953--USC 7, Wisconsin 01955--Ohio State 20, USC 71963--USC 42, Wisconsin 371967--Purdue 14, USC 131968--USC 14, Indiana 31969--Ohio State 27, USC 161970--USC 10, Michigan 31973--USC 42, Ohio State 171974--Ohio State 42, USC 211975--USC 18, Ohio State 171977--USC 14, Michigan 61979--USC 17, Michigan 101980--USC 17, Ohio State 161985--USC 20, Ohio State 171988--Michigan State 20, USC 171989--Michigan 22, USC 141990--USC 17, Michigan 101996--USC 41, Northwestern 32
USC’s Record in Other Bowls
1924--USC 20, Missouri 7 (Christmas Festival)1975--USC 20, Texas A&M 0 (Liberty Bowl)1977--USC 47, Texas A&M 28 (Bluebonnet Bowl)1982--Penn State 26, USC 10 (Fiesta Bowl)1985--Alabama 24, USC 3 (Aloha Bowl)1987--Auburn 16, USC 7 (Florida Citrus Bowl)1990--Michigan State 17, USC 16 (John Hancock Bowl)1992--Fresno State 24, USC 7 (Freedom Bowl)1993--USC 28, Utah 21 (Freedom Bowl)1995--USC 55, Texas Tech 14 (Cotton Bowl)1998--TCU 28, USC 19 (Sun Bowl)2001--Utah 10, USC 6 (Las Vegas Bowl)
1996 ROSE BOWLUSC 41, NORTHWESTERN 32

2002 FOOTBALL MEDIA GUIDE — PAGE 171
1923 Rose BowlUSC 14, Penn State 3
In the first Rose Bowl game played in the present Rose Bowl stadium,USC, a substitute Western entry for California, which had declined theinvitation, defeated Penn State, 14-3. USC’s first touchdown was set upby Harold Galloway, who caught a pass while flat on his back at the two-yard line. Penn State arrived at the game 45 minutes late after beingcaught in a traffic jam, and the game concluded in moonlight assportswriters had to strike matches to complete their stories.
USC 0 7 7 0 -- 14Penn State 3 0 0 0 -- 3
Scoring: USC--Touchdowns, Campbell, Baker. PAT,Hawkins (2).Penn State--Field Goal, Palm.
Attendance: 43,000 Date: Jan. 1
1924 Christmas FestivalUSC 20, Missouri 7
Played on Christmas Day in the Coliseum, USC posted one of its biggestwins in its early history, 20-7 over Missouri. The Trojans stopped theTigers early, then dominated the latter part of the contest, with HaydenPythian, Wallace Newman and Henry Lefebvre starring.
Missouri 0 0 0 7 -- 7USC 0 0 20 0 -- 20
Scoring: USC--Touchdowns, Lefebvre, Badgro, Pythian.PAT, Hawkins (2).Missouri--Touchdown, Walsh. PAT, Unknown.
Attendance: 47,000 Date: Dec. 25
1930 Rose BowlUSC 47, Pittsburgh 14
Quarterbacks Russ Saunders and Marshall Duffield combined to pass for279 yards and four touchdowns to lead Coach Howard Jones’ first USCRose Bowl team past Pittsburgh, 47-14. Saunders’ first three passeswent for touchdowns, two to Trojan end Harry Edelson. USC built a 26-0 halftime lead in coasting to the triumph.
USC 13 13 14 7 -- 47Pittsburgh 0 0 7 7 -- 14
Scoring: USC--Touchdowns, Edelson (2), Duffield (2),Pinckert, Saunders, Wilcox. PAT, Shaver (2),Baker (2), Duffield.Pittsburgh--Touchdowns, Walinchus, Collins.PAT, Parkinson (2).
Attendance: 72,000 Date: Jan. 1
1932 Rose BowlUSC 21, Tulane 12
Erny Pinckert ran for touchdowns of 25 and 30 yards to lead USC’sThundering Herd to a 21-0 halftime lead, and the Trojans held off BernieBierman’s Tulane team in the second half for a 21-12 victory. Six USCplayers on that team were named All-American during their collegecareers.
USC 0 7 14 0 -- 21Tulane 0 0 6 6 -- 12
Scoring: USC--Touchdowns, Sparling, Pinckert (2). PAT,Baker (3).Tulane--Touchdowns, Haynes, Glover.
Attendance: 75,562 Date: Jan. 1
1933 Rose BowlUSC 35, Pittsburgh 0
Quarterback Cotton Warburton scored two touchdowns as USC woredown a lighter Pittsburgh team for a 35-0 win. Warburton, a 145-pounderwho went on to become one of the Trojans’ greatest backs, broke thegame open in the second half.
USC 7 0 7 21 -- 35Pittsburgh 0 0 0 0 -- 0
Scoring: USC--Touchdowns, Palmer, Griffith, Warburton(2), Barber. PAT, Smith (4), Lady.
Attendance: 78,874 Date: Jan. 2
1939 Rose BowlUSC 7, Duke 3
A fourth-string quarterback, Doyle Nave, who had played only 281/2minutes all year, came off the bench to fire four straight passes to secondteam end Al Krueger, the last a 19-yard touchdown aerial, in the last twominutes to edge Duke, 7-3. Those were the only points scored onpreviously undefeated Duke all season.
USC 0 0 0 7 -- 7Duke 0 0 0 3 -- 3
Scoring: USC--Touchdown, Krueger. PAT, Gaspar.Duke--Field Goal, Ruffa.
Attendance: 89,452 Date: Jan. 2
USC BOWL GAME SUMMARIES

PAGE 172 — UNIVERSITY OF SOUTHERN CALIFORNIA
1940 Rose BowlUSC 14, Tennessee 0
USC overpowered Tennessee, which hadn’t been scored upon in 15consecutive games, 14-0, to hand the Volunteers their first loss in 24games and to give Trojan coach Howard Jones, who died in the summerof 1941, a perfect 5-0 record in the Rose Bowl. USC’s final touchdown wasscored on a pass from Amby Schindler to Al Krueger, who had caught thewinning TD pass in 1939.
USC 0 7 0 7 -- 14Tennessee 0 0 0 0 -- 0
Scoring: USC--Touchdown, Schindler, Krueger. PAT,Jones, Gaspar.
Attendance: 92,200 Date: Jan. 1
1944 Rose BowlUSC 29, Washington 0
In the only Rose Bowl game which was not intersectional (because ofwartime travel restrictions), USC raced past Washington, 29-0.Quarterback Jim Hardy led the Trojans, throwing three touchdownpasses. Washington entered the game as a strong favorite.
USC 0 7 13 9 -- 29Washington 0 0 0 0 -- 0
Scoring: USC--Touchdowns, G. Callanan (2). G. Gray(2). PAT, Jamison (3). Safety, Planck blockedAustin's punt which was recovered in endzone by Washington.
Attendance: 68,000 Date: Jan. 1
1945 Rose BowlUSC 25, Tennessee 0
Quarterback Jim Hardy passed for two touchdowns and ran for a third asUSC defeated Tennessee, 25-0. Hardy thus in two games threw for fivetouchdowns and scored a sixth. Tennessee fielded a predominantlyfreshman team.
USC 6 6 0 13 -- 25Tennessee 0 0 0 0 -- 0
Scoring: USC--Touchdowns, J. Callanan, Salata, J.Hardy, MacLachlan. PAT, West.
Attendance: 91,000 Date: Jan. 1
1946 Rose BowlAlabama 34, USC 14
Harry Gilmer, known more as a passer, ran for 113 yards while Alabama’sdefense choked off USC to give the Crimson Tide a 34-14 victory.Alabama allowed USC just six yards of rushing and 35 passing. It wasUSC’s first loss in the Rose Bowl following eight victories.
Alabama 7 13 7 7 -- 34USC 0 0 0 14 -- 14
Scoring: Alabama--Touchdowns, Self (2), Gilmer, Tew,Hodges. PAT, Morrow (4).USC--Touchdowns, Adelman, Clark. PAT,Lillywhite (2).
Attendance: 93,000 Date: Jan. 1
1948 Rose BowlMichigan 49, USC 0
Michigan, under Coach Fritz Crisler gunning for the national championship,defeated USC, 49-0, to duplicate its 1902 triumph over Stanford. HalfbackRobert Chappuis ran for 91 yards, passed for 188, and made six key playswhich set up or scored five touchdowns.
Michigan 7 14 7 21 -- 49USC 0 0 0 0 -- 0
Scoring: Michigan--Touchdowns, Weisenburger (3), C.Elliott, Yerges, Derricotte, Rifenburg. PAT,Brieske (7).
Attendance: 93,000 Date: Jan. 1
1953 Rose BowlUSC 7, Wisconsin 0
Substitute quarterback Rudy Bukich threw a 22-yard touchdown pass toAl “Hoagy” Carmichael in the third quarter which held up for a 7-0 USCtriumph over Wisconsin to give the Pacific Coast its first victory over theBig Ten since the two conferences began their agreement in 1947. JessHill, the Trojan coach who played on the 1929 USC team, became the firstman to have played on and coached winning Rose Bowl teams.
USC 0 0 7 0 -- 7Wisconsin 0 0 0 0 -- 0
Scoring: USC--Touchdown, Carmichael. PAT,Tsagalakis.
Attendance: 101,500 Date: Jan. 1
BOWL GAME SUMMARIES
2002 FOOTBALL MEDIA GUIDE — PAGE 173
1955 Rose BowlOhio State 20, USC 7
Woody Hayes made his first trek to the Rose Bowl as a coach and hisnational champion Ohio State team defeated USC, 20-7, in the mud andrain. Dave Leggett quarterbacked the Buckeyes to three touchdowns andUSC’s Aramis Dandoy returned a punt 86 yards for a touchdown. UCLAwas PCC champion, but was barred from returning by the conference’s“no-repeat” rule.
Ohio State 0 14 0 6 -- 20USC 0 7 0 0 -- 7
Scoring: Ohio State--Touchdowns, Leggett, Watkins,Harkrader. PAT, Weed, Watkins.USC--Touchdown, Dandoy. PAT, Tsagalakis.
Attendance: 89,191 Date: Jan. 1
1963 Rose BowlUSC 42, Wisconsin 37
John McKay made his debut in the Rose Bowl as USC coach and saw hisundefeated national champion Trojans outscore Wisconsin, 42-37. USC,with Pete Beathard throwing four touchdown passes, ran up a 42-14 lead.Then Wisconsin’s Ron VanderKelen got hot, bringing the Badgers towithin five points when time ran out. VanderKelen completed 33 of 48passes for 401 yards, and 11 Rose Bowl records were broken.
USC 7 14 14 7 -- 42Wisconsin 7 0 7 23 -- 37
Scoring: USC--Touchdowns, Bedsole (2), Butcher,Wilson, Heller, F. Hill. PAT, Lupo (6).Wisconsin--Touchdowns, Kurek, VanderKelen,Holland, Korner, Richter. PAT, Korner (5).Safety, USC bad center snap downed in endzone by USC.
Attendance: 98,698 Date: Jan. 1
1967 Rose BowlPurdue 14, USC 13
A two-point conversion attempt by USC with less than three minutesremaining was foiled and Purdue emerged a 14-13 victor. After TroyWinslow flipped a 19-yard touchdown pass to Rod Sherman, Boilermakerback George Catavolos intercepted the conversion pass. Perry Williamsscored both Purdue touchdowns on short bursts.
Purdue 0 7 7 0 -- 14USC 0 7 0 6 -- 13
Scoring: Purdue--Touchdowns, P. Williams (2). PAT,Griese (2).USC--Touchdowns, McCall, Sherman. PAT,Rossovich.
Attendance: 100,807 Date: Jan. 2
1968 Rose BowlUSC 14, Indiana 3
O.J. Simpson ran for 128 yards and scored both USC touchdowns onshort blasts as the Trojans defeated Indiana, 14-3, to wrap up the nationalfootball title. USC started the game without five regulars and lost two moreduring the game, but had enough depth to prevail.
USC 7 0 7 0 -- 14Indiana 0 3 0 0 -- 3
Scoring: USC--Touchdowns, Simpson (2). PAT,Aldridge (2)Indiana--Field Goal, Kornowa.
Attendance: 102,946 Date: Jan. 1
1969 Rose BowlOhio State 27, USC 16
Rex Kern quarterbacked national champion Ohio State to a 27-16 defeatof USC, overcoming a 10-0 deficit and heroics by Trojan O.J. Simpson.Simpson, the Heisman Trophy winner, rushed for 171 yards, including an80-yard touchdown scamper. But five USC turnovers and Ohio State’spower proved too much.
Ohio State 0 10 3 14 -- 27USC 0 10 0 6 -- 16
Scoring: Ohio State--Touchdowns, Otis, Hayden,Gillian. Field Goals, Roman (2). PAT, Roman(2).USC--Touchdowns, Simpson, Dickerson. PAT,Ayala. Field Goal, Ayala.
Attendance: 102,063 Date: Jan. 1
1970 Rose BowlUSC 10, Michigan 3
A record fourth straight appearance by USC was culminated in a 10-3victory over Michigan, whose coach Bo Schembechler suffered a heartattack and missed the game. The Trojans’ “Wild Bunch” on defense heldMichigan to a field goal while a 33-yard pass from Jimmy Jones to BobbyChandler was the margin of victory.
USC 3 0 7 0 -- 10Michigan 0 3 0 0 -- 3
Scoring: USC--Touchdown, Chandler. PAT, Ayala. FieldGoal, Ayala.Michigan--Field Goal, Gillian.
Attendance: 103,878 Date: Jan. 1
BOWL GAME SUMMARIES

PAGE 174 — UNIVERSITY OF SOUTHERN CALIFORNIA
1973 Rose BowlUSC 42, Ohio State 17
Fullback Sam Cunningham, known primarily for his superb blocking,dived for four touchdowns, a modern era Rose Bowl record, as USCdefeated Ohio State, 42-17, to win the national title. USC broke away aftera 7-7 halftime tie as Anthony Davis ran for 157 yards and Mike Rae threwfor 229.
USC 7 0 21 14 -- 42Ohio State 0 7 3 7 -- 17
Scoring: USC--Touchdowns, Swann, Cunningham (4),Davis. PAT, Rae (6).Ohio State--Touchdowns, Keith, Bledsoe. PAT,Conway (2). Field Goal, Conway.
Attendance: 106,869 Date: Jan. 1
1974 Rose BowlOhio State 42, USC 21
The 1974 game was a reverse of the 1973 contest as Ohio State, held toa 14-14 tie at halftime, exploded in the second half for a 42-21 win overUSC. Freshman fullback Pete Johnson scored three touchdowns andArchie Griffin ran for 149 yards. But the Player of the Game was OSUquarterback Cornelius Greene, who completed six of eight passes for 129yards and scrambled effectively.
Ohio State 7 7 13 15 -- 42USC 3 11 7 0 -- 21
Scoring: Ohio State--Touchdowns, Johnson (3), Greene,Elia, Griffin. PAT, Conway (4). Greene (2-pointer).USC--Touchdowns, McKay, Davis. PAT,Limahelu, McKay (2-pointer). Field Goals,Limahelu (2).
Attendance: 105,267 Date: Jan. 1
1975 Rose BowlUSC 18, Ohio State 17
Rhodes scholar Pat Haden threw a 38-yard touchdown pass late in thegame to John McKay, the coach’s son, then fired a two-point conversionpass to Shelton Diggs to give USC a narrow 18-17 win over Ohio Stateand the national title. Haden threw for 181 yards and two touchdowns tooffset the loss of Anthony Davis, who suffered a rib injury.
USC 3 0 0 15 -- 18Ohio State 0 7 0 10 -- 17
Scoring: USC--Touchdowns, Obradovich, McKay. PAT,Limahelu, Diggs (2-pointer). Field Goal,Limahelu.Ohio State--Touchdowns, Henson, Greene.PAT, Klaban (2). Field Goal, Klaban.
Attendance: 106,721 Date: Jan. 1
1975 Liberty BowlUSC 20, Texas A&M 0
In coach John McKay’s final game at USC, his Trojans shook off a four-game losing streak and surprised favored Texas A&M in Memphis, 20-0.USC’s defense came up with many big plays, while the offense was ableto move against the nationally-ranked Aggie defense. Vince Evans threwa 65-yard bomb to Randy Simmrin to set up one touchdown and LibertyBowl MVP Ricky Bell ran 76 yards with a screen pass for another TD.
USC 3 17 0 0 -- 20Texas A&M 0 0 0 0 -- 0
Scoring: USC--Touchdowns, Tatupu, Bell. PAT, Walker(2). Field Goal, Walker.
Attendance: 52,129 Date: Dec. 22
1977 Rose BowlUSC 14, Michigan 6
After an opening game loss, USC won its 11th-straight game by grindingout a 14-6 win over Michigan. Michigan’s Rob Lytle opened the scoringwith a one-yard plunge, but Trojan quarterback Vince Evans got that backwith a one-yard rollout. Freshman tailback Charles White, filling in for theinjured Ricky Bell, rushed for 122 yards, including a seven-yard scoringjaunt that closed out the scoring for USC. John Robinson became only thesecond rookie coach from the Pac-8 to capture a Rose Bowl.
Michigan 0 6 0 0 -- 6USC 0 7 0 7 -- 14
Scoring: Michigan--Touchdown, Lytle.USC--Touchdowns, Evans, White. PAT, Walker(2).
Attendance: 106,182 Date: Jan. 1
1977 Bluebonnet BowlUSC 47, Texas A&M 28
In a wild game in Houston’s Astrodome, USC beat Texas A&M, 47-28.Down 14-0 in the first quarter, the Trojans scored the next 34 points andcoasted to victory. Both teams combined for 1,139 yards of total offense,including 620 by USC. Dwight Ford raced 94 yards for a score, a USCrecord, while Rob Hertel threw four touchdown passes (including two toCalvin Sweeney).
USC 7 13 14 13 -- 47Texas A&M 14 0 0 14 -- 28
Scoring: USC--Touchdowns, Sweeney (2), White,Simmrin, Ford, Tatupu. PAT, Jordan (3), Burns(2-pointer). Field Goals, Jordan (2).Texas A&M--Touchdowns, Woodard (2),Moseley, Armstrong. PAT, Franklin (4).
Attendance: 52,842 Date: Dec. 31
BOWL GAME SUMMARIES
2002 FOOTBALL MEDIA GUIDE — PAGE 175
1979 Rose BowlUSC 17, Michigan 10
In a tough defensive struggle, the Pac-10 ran its victory string to five in arow as USC outlasted Michigan 17-10. Trojan tailback Charles Whiterushed for 99 yards and scored what proved to be the decisive touchdownon a disputed three-yard plunge in the second quarter. Michiganquarterback Rick Leach almost brought the Wolverines back from a 14-point halftime deficit by completing eight of 11 second-half passes,including a 44-yard scoring bomb to Roosevelt Smith. White and Leachshared Player of the Game honors.
USC 7 10 0 0 -- 17Micigan 0 3 7 0 -- 10
Scoring: USC--Touchdowns, Brenner, White. PAT,Jordan (2). Field Goal, Jordan.Michigan--Touchdown, R. Smith. PAT, Willner.Field Goal, Willner.
Attendance: 105,629 Date: Jan. 1
1980 Rose BowlUSC 17, Ohio State 16
USC’s Heisman Trophy winning tailback Charles White stole the show ashe led the Trojans to a come-from-behind win in one of the most excitinggames in Rose Bowl history. White, named Player of the Game for thesecond straight year, rushed for a Rose Bowl record 247 yards, includinga one-yard touchdown dive with 1:32 remaining in the game that gaveUSC the win. The Trojans jumped out to an early 10-0 lead, but Ohio Statecame back to take a 16-10 lead in the fourth quarter. Then White tookover. With 5:21 remaining in the game, the Trojans got the ball on theirown 17-yard line. USC marched 83 yards in eight plays, all on the ground.On the winning drive, White carried six times for 71 yards.
USC 3 7 0 7 -- 17Ohio State 0 10 3 3 -- 16
Scoring: USC--Touchdowns, K. Williams, White. PAT,Hipp (2). Field Goal, Hipp.Ohio State--Touchdown, G. Williams. PAT,Janakievski. Field Goals, Janakievski (3).
Attendance: 105,526 Date: Jan. 1
1982 Fiesta BowlPenn State 26, USC 10
Penn State’s fine defense and key Trojan miscues led to USC’s first non-Rose Bowl post-season defeat, 26-10. Marcus Allen, who was held to 85yards, fumbled away the ball on USC’s first possession and the Lions’Curt Warner, who gained 145 yards, went in to score several plays later.USC’s only touchdown came on a 20-yard interception by Chip Banks.
Penn State 7 10 9 0 -- 26USC 7 0 3 0 -- 10
Scoring: Penn State--Touchdowns, Warner (2), Garrity.PAT, Franco (3). Field Goal, Franco. Safety,Paffenroth blocked punt out of end zone.USC--Touchdown, Banks. PAT, Jordan. FieldGoal, Jordan.
Attendance: 71,053 Date: Jan. 1
1985 Rose BowlUSC 20, Ohio State 17
USC’s defense prevailed over Ohio State’s potent offense featuringHeisman Trophy runnerup Keith Byars, 20-17. Interceptions set up USC’stwo touchdowns and the Trojan defense also stopped two key Buckeyedrives--one early in the contest that got to the four-yard line and one latein the game which ended up at the 38. For USC, Tim Green threwtouchdown passes to Joe Cormier and Timmie Ware while Steve Jordankicked two 51-yard field goals. Most of Ohio State’s points were providedby Rich Spangler, who hit three field goals.
Ohio State 3 3 3 8 -- 17USC 10 7 3 0 -- 20
Scoring: Ohio State--Touchdown, Carter. PAT, Tomczak(2-pointer). Field Goals, Spangler (3).USC--Touchdowns, Cormier, Ware. PAT,Jordan (2). Field Goals, Jordan (2).
Attendance: 102,594 Date: Jan. 1
1985 Aloha BowlAlabama 24, USC 3
The nation’s top two bowl teams (USC with the most wins and Alabamawith the most appearances) faced off in balmy Honolulu. The score wastied at halftime, 3-3, but the Crimson Tide rolled in the second half to win,24-3. USC managed only 197 total yards (just 61 rushing) and 10 firstdowns. On the other hand, Alabama had 317 total yards, 205 coming onthe ground. Mike Shula, Al Bell, Gene Jelks, Cornelius Bennett and JonHand starred for the Crimson Tide.
USC 0 3 0 0 -- 3Alabama 3 0 7 14 -- 24
Scoring: USC--Field Goal, Shafer.Alabama--Touchdowns, Turner, Whitehurst,Bell. PAT, Tiffin (3). Field Goal, Tiffin.
Attendance: 35,183 Date: Dec. 28
1987 Florida Citrus BowlAuburn 16, USC 7
In Ted Tollner’s final game as USC’s head coach, his Trojan defense helddown a high-powered Auburn offense (led by Brent Fullwood, the nation’stop runner). But Troy’s offense was ineffective and the Tigers won, 16-7,in chilly Orlando. Outside linebacker Marcus Cotton provided USC with itsonly score on a spectacular 24-yard scoring interception return early inthe game. Two long second-quarter drives by Auburn, plus a safety latein the game, gave Auburn its only points. USC made it interesting at theend after Louis Brock blocked a Tiger punt, but the Trojans couldn’t scoreon fourth-and-inches at the goal line. Fullwood had 152 yards rushing andone TD for Auburn, which had just 290 total yards on the day.
Auburn 0 14 0 2 -- 16USC 7 0 0 0 -- 7
Scoring: Auburn--Touchdowns, Reeves, Fullwood. PAT,Knapp (2). Safety, Peete called for intentionallygrounding in end zone.USC--Touchdown, Cotton. PAT, Shafer.
Attendance: 51,113 Date: Jan. 1
BOWL GAME SUMMARIES
PAGE 176 — UNIVERSITY OF SOUTHERN CALIFORNIA
1988 Rose BowlMichigan State 20, USC 17
For just the fifth time ever, teams that had played each other earlier in theseason (Michigan State had beaten USC in the 1988 season opener, 27-13) faced off in the Rose Bowl. The Spartans prevailed again, this time20-17, breaking a six-game Big Ten losing streak in Pasadena. Despitegetting more total yards (410 to 276) and first downs (21 to 11) thanMichigan State, the Trojans were hurt by five turnovers, including a lostfumble on a mishandled snap on the Spartan 30 with 1:37 to play as Troywas marching downfield on an impressive drive. USC trailed 14-3 athalftime, but two touchdowns passes from quarterback Rodney Peete tosplit end Ken Henry eventually evened the score at 17-17 midway throughthe last quarter. On the next series, Michigan State moved into its winningfield goal position with the help of a spectacular 36-yard jump pass fromquarterback Bobby McAllister to split end Andre Rison. USC had to playMichigan State for the second time that season without star Trojantailback Steven Webster (he sat out the opener with a sprained ankle andtore knee ligaments in the regular season finale against UCLA).
USC 3 0 7 7 -- 17Michigan State 7 7 0 6 -- 20
Scoring: USC--Touchdowns, Henry (2). PAT, Rodriguez(2). Field Goal, Rodriguez.Michigan State--Touchdowns, White (2). PAT,Langeloh (2). Field Goals, Langeloh (2).
Attendance: 103,847 Date: Jan. 1
1989 Rose BowlMichigan 22, USC 14
In a “teacher-versus-pupil” matchup (USC coach Larry Smith servedunder Wolverine coach Bo Schembechler at both Miami of Ohio andMichigan), the teacher got the better of it as Michigan came back from a14-3 halftime deficit to win 22-14. It was a disappointing way for USC toconclude its 100th anniversary of football. After falling behind 3-0 on aMike Gillette field goal, USC charged back as quarterback Rodney Peeteran for a pair of short touchdowns (1 and 4 yards) in the second quarter.But it was all Michigan in the second half, as the Wolverines amassed 230of their 352 total yards then. They scored 3 times on long drives, the firston a 6-yard Demetrius Brown-to-Chris Calloway aerial that capped a 67-yard drive to open the third quarter. Then Rose Bowl MVP Leroy Hoardscored twice for Michigan on 1-yard runs in the final period, coming off of92 and 70-yard drives. Hoard had 142 yards rushing (the first time anyonebroke the century rushing mark against the Trojans all year), including akey 61-yard run to set up the Wolverines’ final score. USC, whichmanaged a season-low 296 total yards, didn’t help its cause with 5turnovers, 11 penalties and numerous missed tackles. The win was onlySchembechler’s second in 9 tries in Pasadena.
Michigan 3 0 6 13 -- 22USC 0 14 0 0 -- 14
Scoring: Michigan--Touchdowns, Calloway, Hoard (2).PAT, Gillette. Field Goal, Gillette.USC--Touchdowns, Peete (2). PAT, Rodriguez(2).
Attendance: 101,688 Date: Jan. 2
1990 Rose BowlUSC 17, Michigan 10
After losing the previous 2 Rose Bowls, USC beat Michigan, 17-10, in arematch of the 1989 game. The win, in Bo Schembechler’s final game asWolverine coach, ended Michigan’s national title hopes. It was a bittersweetvictory for USC coach Larry Smith, who served 6 years as an assistantunder Schembechler at Miami of Ohio and Michigan. Trojan tailbackRicky Ervins, the Rose Bowl MVP, scored the game-winning TD on a 14-yard run with 1:10 to play. Ervins, who lives 5 minutes from the Rose Bowland used to park cars there on New Year’s Day, ran for 126 yards on 30carries and caught 5 passes for 44 yards. USC, which dominated thestats, pulled off a key play early in the second quarter when defensiveguard Dan Owens blocked a punt. Six plays later, quarterback ToddMarinovich, who was 22-of-31 passing for 178 yards, scored on a 1-yardrun. Kickers J.D. Carlson of Michigan (19 yards) and USC’s QuinRodriguez (34 yards) then matched field goals prior to halftime. Michigantied the score on a 2-yard run then matched field goals prior to halftime.Michigan tied the score on a 2-yard run by tailback Allen Jefferson in thethird quarter and the game looked like it would end deadlocked. But, withless than 6 minutes to go, Michigan was called for holding on a successfulWolverine fake punt and USC took over at its 25-yard line. Troy then went75 yards in 11 plays for the winning score. Michigan tailback Leroy Hoardbecame the first player to run for 100-plus yards against USC all season(he had 108 yards on 17 carries).
USC 0 10 0 7 -- 17Michigan 0 3 7 0 -- 10
Scoring: USC--Touchdowns, Marinovich, Ervins. PAT,Rodriguez (2). Field Goal, Rodriguez.Michigan--Touchdown, Jefferson. PAT,Carlson. Field Goal, Carlson.
Attendance: 103,450 Date: Jan. 1
1990 John Hancock BowlMichigan State 17, USC 16
Playing in its eighth different bowl, USC lost to Michigan State, 17-16, inthe John Hancock Bowl in El Paso, Tex., on New Year’s Eve day. It wasthe 900th game in Trojan gridiron history. USC dominated the stats,getting more total yards (336-215), plays (76-52), first downs (21-12) andpossession time (35:45-24:15). Troy limited the powerful Spartan rushingattack (which averaged 253.9 yards a game to rank 10th nationally) to anMSU season-low 84 yards. Big Ten rushing champ tailback Tico Duckettgot just 18 yards. But Troy had 4 costly turnovers (including 2 in MSU’send zone) and converted only 5 of 14 first downs. USC scored first whenquarterback Todd Marinovich hit flanker Gary Wellman with a 7-yard TDpass late in the opening quarter. Marinovich was 18-of-30 for 174 yards,but threw 3 interceptions (including 1 in the end zone) and also fumbledthe ball on fourth-and-goal at the Spartan 1-yard line in the middle of thesecond quarter (which MSU recovered in the end zone). Michigan Statemarched 80 yards to a TD after that fumble recovery, with tailback HylandHickson scoring on an 18-yard run to tie the score at 7-7 at halftime. Afterplacekicker Quin Rodriguez hit a 20-yard field goal on USC’s openingpossession of the second half (which ended on the MSU 3-yard line), theSpartans countered with a 21-yard TD pass from quarterback Dan Enosto flanker Courtney Hawkins (the first TD reception by a MSU widereceiver all year), who was the game’s MVP with 6 catches for a season-high 106 yards, and a career-long 52-yard field goal by John Langeloh.Rodriguez capped USC’s next series with a career-long 54-yard field goalearly in the fourth quarter. Then, down 17-13, cornerback Stephon Paceintercepted an Enos pass to give USC the ball near midfield. But theTrojans could get no closer than the MSU 17 before backup quarterbackShane Foley’s errant pitch stalled the drive and USC had to settle foranother Rodriguez field goal, this one 43 yards with 5:54 to play. Troy,however, could never get the ball back. Tailback Mazio Royster had agame-high 125 yards on 32 carries, only the second player to break thecentury rushing mark against Michigan State in 1990. USC rushed for 156
BOWL GAME SUMMARIES
2002 FOOTBALL MEDIA GUIDE — PAGE 177
yards versus an MSU defense which was ranked 17th nationally againstthe run (allowing just 113.2 yards a game). Trojan outside linebackerCraig Hartsuyker, who had 2 quarterback sacks and forced a fumble, wasnamed the game’s Most Valuable Lineman.
USC 7 0 3 6 -- 16Michigan State 0 7 10 0 -- 17
Scoring: USC--Touchdown, Wellman. PAT, Rodriguez.Field Goals, Rodriguez (3).Michigan State--Touchdowns, Hickson,Hawkins. PAT, Langeloh (2). Field Goal,Langeloh.
Attendance: 50,562 Date: Dec. 31
1992 Freedom BowlFresno State 24, USC 7
USC, making its 35th bowl appearance, was stunned by unranked, 8-point underdog Fresno State, 24-7, in the ninth Freedom Bowl in AnaheimStadium. It was the first meeting ever between the Trojans and Bulldogs.Fresno State dominated, particularly in the second half. FSU, with thenation’s No. 1 scoring offense (40.5) and No. 2 total offense (482.9), heldthe ball 15-plus minutes more (37:32-22:28), had 322 more total yards(405-183), 10 more first downs (24-14) and 34 more plays (84-50). USC’s183 total yards were its fewest since getting 163 at Washington in 1990and its 95 passing yards were its fewest since getting 74 at Oregon in1991. The Trojans had 4 turnovers (FSU had none) and converted just1-of-9 third downs. The first half, played in a steady rain, ended in a 7-7 tie. It was the fewest points FSU had scored in a half all season (andit was the first time the Bulldogs were shut out in the first quarter in 1992).USC tailback Deon Strother opened the scoring with a 1-yard plunge earlyin the second quarter, but FSU answered when fullback Lorenzo Neal ranfor a 1-yard TD. While attempting to catch a pass on the last play of thehalf, USC flanker Curtis Conway sprained his right knee and missed thesecond half (it was the first time in 23 games that he didn’t catch a pass).After a 43-yard field goal by placekicker Derek Mahoney in the thirdquarter, FSU scored twice late in the game on runs by tailbacks AnthonyDaigle (2 yards) and Ron Rivers (5 yards). Rivers had a game-high 104yards on 19 carries, while Freedom Bowl MVP Neal had 75 yards on 19tries. Bulldog quarterback Trent Dilfer was 13-of-28 for 164 yards.Tailback Estrus Crayton, USC’s game MVP, led Troy with 79 yards on 19attempts. Defensively, safety Jason Sehorn had a game-high 10 tackles,while inside linebacker Brian Williams added 9 stops, cornerback JeraldHenry had 8, and cornerback Jason Oliver had 7 along with a blocked fieldgoal.
Fresno State 0 7 3 14 -- 24USC 0 7 0 0 -- 7
Scoring: Fresno State--Touchdowns, Neal, Daigle, Rivers.PAT, Mahoney (3). Field Goal, Mahoney.USC--Touchdown, Strother. PAT, Ford.
Attendance: 50,745 Date: Dec. 29
1993 Freedom BowlUSC 28, Utah 21
USC, exorcising the demons of Anaheim Stadium, scored 28 points in thefirst 17 minutes of the game and then held off a furious Utah second-halfrally to win Freedom Bowl X, 28-21, before 43,150 fans and a nationalRaycom television audience. The Trojans, making their 36th bowlappearance, were playing in Anaheim Stadium for the third time in 14games, but had yet to win there (losing in the 1992 Freedom Bowl toFresno State and the 1993 season-opening Disneyland Pigskin Classicto North Carolina). It was the first USC-Utah meeting in 45 years. USC,a 17-point favorite, scored easily on its first 4 possessions. In the firstquarter, quarterback Rob Johnson hit All-American wide receiver Johnnie
Morton on TD throws of 31 and 9 yards, and tailback David Dotson doveover from 2 yards out. Then, Johnson connected with tight endJohnnyMcWilliams on a 5-yard scoring toss just 1:26 into the second quarter. Butafter that, USC’s offense--hampered by an ineffective running game (theTrojans ran for just 91 yards)--stalled. Utah, playing in just its fourth bowlgame, came alive after halftime, scoring on 3 of its first 5 possessions: a59-yard TD pass from quarterback Mike McCoy to slotback Henry Lusk,a 34-yard run by fullback Jamal Anderson and a 1-yard run by tailbackKeith Williams. But USC got the ball with 3:19 to play and held it until just8 seconds remained, when McCoy’s desperation pass was interceptedby cornerback John Herpin (Herpin’s second pick of the game). Mortonwas named the game’s MVP as he caught a Freedom Bowl-record 10passes for 147 yards and the 2 scores (to tie a Freedom Bowl TD catchmark) despite playing weakened with the flu (7 of his catches for 121 yardsand both TDs were in the first half). Johnson, who also had come downwith a slight case of the flu, completed a Freedom Bowl-record 30 passesin 44 attempts for 345 yards and the 3 TD aerials (in the first half, he was17-of-25 for 255 with the 3 TDs). Morton became the Pac-10’s No. 2career receiver with 201 grabs, while Johnson set USC’s season passcompletion percentage mark (68.6%). USC tailback Shawn Walters ranfor a game-high 70 yards on 19 carries, while fullback Deon Strotheradded 50 rushing yards on 9 attempts and caught 6 passes for 63 yards.USC wide receiver Ken Grace, who had 4 catches for 48 yards, returneda punt 31 yards, a Freedom Bowl mark. USC generated 436 yards of totaloffense on 82 plays and held the ball 32:14. Utah threatened 3 timesinside the USC 30-yard line in the opening half, but USC’s defense heldeach time, including an impressive goal line stand and an interception inthe end zone by cornerback Jason Sehorn. Utah came into the gameaveraging 484.6 total yards (fifth in the U.S.), 324.3 passing yards(seventh in the U.S.) and 30.8 points, but was limited to 350 total yards(286 through the air). McCoy, who was second nationally in total offense(330.8), was 23-of-40 for 286 yards, 1 TD and 3 interceptions (at the half,he was 10-of-20 for 81 yards with 2 picks). Lusk had 6 catches for 140yards and the TD, while Anderson ran for 67 yards and the TD on 16carries and caught 7 passes for 61 yards. Outside linebacker BrianWilliams and safety Mike Salmon topped USC in tackles with 9 each (bothhad 2 for losses). USC coach John Robinson, who has led USC to at least8 wins in each of his 8 seasons there, upped his bowl record to 5-1.
Utah 0 0 13 8 -- 21USC 20 8 0 0 -- 28
Scoring: Utah--Touchdowns, He. Lusk, Anderson, Williams.PAT, Yergerson, Anderson (2-pointer).USC--Touchdowns, Morton (2), Dotson,McWilliams. PAT, Ford (2), Banta (2-pointer).
Attendance: 37,203 Date: Dec. 30
1995 Cotton BowlUSC 55, Texas Tech 14
USC (ranked 20th by UPI, 21st by AP and 22nd by USA Today/CNN)made quite an impression in its first visit to the Mobil Cotton Bowl Classic,smashing Texas Tech, 55-14, in a record-filled performance before asellout crowd of 70,218 and an NBC-TV national audience. It was USC’s24th bowl victory, its 37th bowl appearance (in 10 different bowls), its 17thwin in the last 19 games against Southwest Conference opponents, itsthird win in 3 tries over Texas Tech, and coach John Robinson’s sixth bowlwin in 7 trips (giving Robinson at least 8 wins in each of his 9 seasons atTroy). After 59 years, it was also the last Cotton Bowl where an SWC teamserved as host. Texas Tech was making only its second visit to the CottonBowl (the first was in 1939). The game was over quickly, as it was 28-0after the first quarter and 34-0 at halftime. USC led 48-0 before TexasTech scored against the Trojan reserves late in the third quarter. USC setCotton Bowl records for most points in a game, most points in a quarter(USC’s most since also scoring 28 in the second quarter againstCalifornia in 1978) and most touchdowns (7), while scoring its most pointsever in a bowl and posting its biggest bowl victory margin (second inCotton Bowl history). It was the most points scored against Texas Techsince Miami had 61 in 1986. Troy’s first 3 scores came in a 1:16 span.After tailback Shawn Walters, 1 of 8 Texans on the Trojan roster, ran 11
BOWL GAME SUMMARIES

PAGE 178 — UNIVERSITY OF SOUTHERN CALIFORNIA
yards for a TD, USC recovered a fumble on the ensuing kickoff and, onthe next play, quarterback Rob Johnson hit fullback Terry Barnum for a19-yard score. Three plays later, cornerback John Herpin, another Texasnative, intercepted a Zebbie Lethridge pass and returned it 26 yards fora TD. Herpin, who intercepted another pass in the second quarter to setup a field goal, was named the game’s Outstanding Defensive Player.USC’s next 3 TDs came on aerials to wide receiver Keyshawn Johnsonof 12, 22 and 86 yards (the 86-yarder was 1 yard shy of the longest passin Cotton Bowl and USC history), the first 2 from Rob Johnson and thethird from quarterback Brad Otton. Keyshawn Johnson, selected as thegame’s Outstanding Offensive Player, had 8 catches overall for a CottonBowl-record 222 yards (just 7 yards shy of the Trojan single game record).His 3 TD catches set a Cotton Bowl record and equalled a Trojan mark.Rob Johnson, who became USC’s career passing yardage leader and thePac-10 and USC recordholder for career completion percentage, was 16-of-21 for 289 yards (the second most yards in Cotton Bowl history). Theother Trojan scores came on a late 2-yard Otton pass to tight end Jeff Diltzand second quarter field goals by placekicker Cole Ford of 39 and acareer-best 42 yards. Ford’s 7 PAT kicks was a Cotton Bowl record.Walters ran for a game-best 82 yards on 14 carries. Otton was 8-of-14for 146 yards. USC thoroughly dominated the statistics, more thandoubling Texas Tech in total yardage (578-260) and possession time(40:02-19:58) while also having more first downs (21-14) and plays (80-63). USC, which averaged 7.2 yards per play, set Cotton Bowl recordsfor total yards, passing yards (a USC record 435) and completions (24).USC did this against a Texas Tech defense which entered the game thirdnationally in pass efficiency defense (88.6), 10th in scoring defense (17.4)and 22nd in total defense (311.0). The Red Raiders had held 5 foes tosingle digits in scoring and had given up just 47 points in their previous5 games. Inside linebacker Jeff Kopp led USC in tackles with 7, whilesafety Sammy Knight added 6. Texas Tech, which punted 10 times,advanced into USC territory on just 4 of its 16 possessions.
USC 28 6 14 7 -- 55Texas Tech 0 0 7 7 -- 14
Scoring: USC--Touchdowns, K. Johnson (3), Herpin, Walters,Barnum, Diltz. PAT, Ford (7). Field Goals, Ford (2).Texas Tech--Touchdowns, Lethridge, Mitchell.PAT, Davis (2).
Attendance: 70,218 Date: Jan. 2
1996 Rose BowlUSC 41, Northwestern 32
Behind the stellar play of wide receiver Keyshawn Johnson and quarter-back Brad Otton, USC (ranked 15th by UPI and 17th by USA Today/CNNand AP) put an end to No. 3-ranked Northwestern’s Cinderella seasonwith an exciting 41-32 Rose Bowl win before a sellout crowd of 100,102and a national ABC-TV audience. It was the 50th anniversary of the Pac-10/Big Ten agreement in the Rose Bowl. It was USC’s 20th victory in itsunprecedented 28th trip to Pasadena (but its first since the 1990 game)and Troy’s first win over a Top 3 team since defeating Michigan in that1990 Rose Bowl, while Northwestern--having its first winning seasonsince 1971 (the Wildcats came in with a 10-1 record)--was playing in onlyits second-ever bowl (its first since winning the 1949 Rose Bowl). It alsogave USC coach John Robinson a 4-0 Rose Bowl record (and 7-1 in allbowls). The Trojans jumped off to a quick start, driving 83 yards with theopening kickoff while using a no-huddle offense as running back LaValeWoods scored on a 1-yard plunge. But Northwestern answered on its firstpossession, as running back Darnell Autry ran 3 yards for a TD to cap a68-yard drive. USC then scored 17 unanswered second quarter points:a scrambling 21-yard TD pass from Otton to running back Terry Barnum,a 30-yard field goal by placekicker Adam Abrams and, on Northwestern’snext possession, cornerback Daylon McCutcheon’s 53-yard fumblereturn after safety Sammy Knight knocked the ball loose from Wildcatwide receiver Brian Musso. Northwestern got a 29-yard field goal fromplacekicker Brian Gowins with 2 seconds to go in the half following aTrojan fumble, but Troy led 24-10 at intermission (it was USC’s most firsthalf points since scoring 34 against Texas Tech in the 1995 Cotton Bowl).The Wildcats then scored on their first 4 possessions of the second half:
another Gowins field goal (this one from 28 yards), a 9-yard Autry run(after Northwestern recovered a surprise on-side kick), a 1-yard sneak byquarterback Steve Schnur (which followed a 56-yard Trojan scoring strikefrom Otton to Johnson), and a 2-yard Autry run early in the fourth quarterthat gave Northwestern its first lead of the day, 32-31. But USC came rightback, getting a 46-yard Abrams field goal (the longest by a Trojan sinceQuin Rodriguez hit a 54-yarder against Michigan State in the 1990 JohnHancock Bowl). Safety Jesse Davis then sealed the victory for USC withan interception which led to a 5-yard TD by running back Delon Washing-ton. Johnson, who served as a Trojan ballboy at the 1985 Rose Bowl, wasnamed the Rose Bowl MVP, as he grabbed 12 passes (all for first downs)for a Rose Bowl record 216 yards (his 17th 100-yard outing in his careerand the eighth of 1995). Otton played the entire game for the first timein the 1995 season, hitting 29-of-44 passes for 391 yards (all careerhighs) with 2 TDs and no interceptions; the yardage was 1 yard shy of RobJohnson’s USC record and was the third most in Rose Bowl history. Autryhad his 13th consecutive 100-yard rushing game, getting 110 yards on 32carries with the 3 TDs, while Schnur was 23-of-39 for a career-best 336yards (including 7 completions for 145 yards to wide receiver D’WayneBates). Northwestern outgained USC in total yards, 475-520, and limitedTroy to just 29 rushing yards (its fewest since getting 7 yards againstUCLA in 1993), but the Wildcats’ uncharacteristic 2 turnovers led to 14Trojan points, proving costly to a team which was third nationally inturnover margin (1.82). The Wildcats also had a TD pass called backbecause of a penalty late in the game and missed 2 field goals, includinga 49-yard attempt that hit the upright with 35 seconds to go. USC, on theother hand, had 11 penalties (including 9 in the second half). Trojancornerback Brian Kelly had a game-high 11 tackles (along with 2deflections), while Knight and linebacker Scott Fields added 7 stopseach.
USC 7 17 7 10 -- 41Northwestern 7 3 16 6 -- 32
Scoring: USC--Touchdowns, L. Woods, Barnum,McCutcheon, K. Johnson, Washington. PAT,Abrams (5). Field Goals, Abrams (2).Northwestern--Touchdowns, D. Autry (3), Schnur.PAT, Gowins (2). Field Goals, Gowins (2).
Attendance: 100,102 Date: Jan. 1
1998 Sun BowlTCU 28, USC 19
In a stunning upset, 16-point underdog TCU—which barely qualified forpost-season play with a 6-5 record—used a potent option attack and astingy run defense to beat USC, 28-19, in the 65th Norwest Sun Bowlbefore 46,612 fans and a national CBS-TV audience. The Horned Frogs’option offense gained 314 yards on the ground (the most against theTrojans since Notre Dame had 330 in 1992) and their defense limited Troyto a USC and Sun Bowl record low -23 rushing yards. It was TCU’s firstbowl win since 1957. TCU, which scored touchdowns on its first 3possessions of the opening half on runs of 3 and 60 yards by TB BasilMitchell and 7 yards by QB Patrick Batteaux, led 21-3 at intermission.USC’s only first-half points came on a 35-yard field goal by PK AdamAbrams late in the second quarter. The Horned Frogs opened up a 25-point lead on their initial drive of the second half as Batteaux scored ona 3-yard run. USC battled back by scoring on its first 3 drives of the secondhalf, first on a 23-yard pass from QB Carson Palmer to WR Billy Miller,then on a 1-yard run by TB Petros Papadakis and a 46-yard Abrams fieldgoal early in the fourth quarter (Abrams was the game’s Special TeamsMVP). The Trojans got the ball back twice more, but those drives resultedin a loss of 30 yards as Palmer was sacked 3 times. Mitchell, the game’sMVP rushed for 185 yards on 19 carries (including 114 in the first half) fora 9.7 average per carry. Batteaux added 94 yards on 28 tries whileexecuting the option to perfection (he also completed 4-of-5 passes for51 yards). TCU stayed mainly on the ground, as 61 of its 67 plays wereruns (the most rushes against USC since Penn State had 66 in 1993). TheHorned Frogs threw for only 51 yards (the fewest allowed by USC sinceOregon State had 29 in 1995). TCU amassed 365 total yards, converted10-of-16 third downs (including 7-of-9 in the first half) and held the ball
BOWL GAME SUMMARIES
2002 FOOTBALL MEDIA GUIDE — PAGE 179
35:51. USC managed just 257 total yards and 12 first downs on only 49plays. Troy converted just 1-of-11 third downs (that came in the firstquarter). Palmer was 17-of-28 for a career-best 280 yards, but wassacked 6 times (all in the second half). WR R. Jay Soward had a game-best 6 catches for 64 yards, WR Larry Parker added 4 for 104 yards andMiller had 3 for 67 yards. LB Chris Claiborne had a game-best 13 tacklesand S Grant Pearsall added 11 stops.
USC 0 3 13 3 -- 19TCU 14 7 7 0 -- 28
Scoring: USC--Touchdowns, Miller, Papadakis. PAT,Abrams. Field Goals, Abrams (2).TCU--Touchdowns, Mitchell (2), Batteaux (2).PAT, Kaylakie(4).
Attendance: 46,612 Date: Dec. 31
2001 Las Vegas BowlUtah 10, USC 6
Behind a time-consuming, powerful running attack and a dominatingdefense, Utah beat USC, 10-6, in the 10th Sega Sports Las Vegas Bowlbefore 22,385 fans and a national ABC-TV audience. The outcome–theTrojans’ fifth loss of 2001 by 5 or less points–snapped USC’s 4-gamewinning streak and Utah’s 2-game losing skid. It also ended the Utes’ 6-game losing streak to USC (Utah last beat Troy in 1916). The defensivestruggle produced the lowest scoring Las Vegas Bowl ever. But thatfigured, as both squads were highly-ranked nationally in scoring defense(USC was 11th at 17.9 and Utah was 13th at 18.6). Utah, which enteredthe game ranked in the Top 25 nationally in all 4 defensive categories,limited the Trojans to just 151 total yards, including only 1 yard rushing.It was USC’s fewest total yards since getting 124 against Washington in1996 and its fewest rushing yards since having -20 at Arizona in 1999.USC had just 12 first downs, converted only 2-of-12 third downs and wassacked 4 times (including twice by ROV Sheldon Deckart, who had ateam-high 6 tackles). USC punted on 8 of its 11 possessions (includingon its first 4 drives and its final 4), went 3-and-out 5 times and penetratedUtah territory only 4 times (getting inside the 30 just once). At halftime,USC had just 15 total yards (with -53 on the ground) and 3 first downs. Onoffense, Utah–which was 12th nationally in rushing offense at 218.9–controlled the clock (holding the ball 16 minutes more than USC, 38:01to 21:59) by running 54 times for 222 of its 358 total yards. The Utes ranoff 75 plays (USC had just 51). HB Adam Tate ran for a game-best 103yards on 23 carries, while fellow HB Dameon Hunter (a 1,000-yard runnerin 2001) rushed for 94 yards on 17 tries and was named Utah’s gameMVP. Utah QB Lance Rice was 12-of-21 for 136 yards while hitting sometimely passes, including a game-best 4 to WR Josh Lyman (for 41 yards)and 3 to TE Michael Richardson (for 35 yards). Utah scored on its secondpossession of the game as Tate ran for a 3-yard TD to cap a 7-play, 48-yard drive late in the first quarter. Then, after USC PK David Davis–thePac-10’s most accurate field goal kicker in 2001–missed a 47-yarder(breaking his string of 12 consecutive successful field goals), the Utesdrove 61 yards in 12 plays to set up PK Ryan Kaneshiro’s 26-yard fieldgoal with 29 seconds to play in the half. USC came alive to start thesecond half, taking the opening kickoff and driving 80 yards in 12 plays,finishing with a 2-yard scoring run by FB Sunny Byrd (but Davis missedthe PAT). But despite getting a pair of turnovers–CB Kris Richardrecovered a fumble and LB John Cousins intercepted a pass–on Utah’snext 2 possessions, the Trojans couldn’t get any closer than the Ute 40-yard line the rest of the way. Trojan QB Carson Palmer was 15-of-26 for150 yards, while WRs Kareem Kelly (33 yards) and Devin Pitts (32 yards)each had 3 receptions. Trojan All-American safety Troy Polamalu–picked as USC’s game MVP–had a Las Vegas Bowl record and career-high 20 tackles (with a game record 12 solo), including 3 for losses, whileS DeShaun Hill (14 stops and a forced fumble) and LB Frank Strong (12tackles, including 4 for losses) also posted career bests in tackles. It wasUSC’s first game in the state of Nevada and its sixth contest on ChristmasDay (but its first since 1934). The crowd was the smallest ever to see USCin a bowl and the fewest at a Trojan game since 20,938 showed up atOregon State in 1997.
BOWL GAME SUMMARIES
Utah 7 3 0 0 -- 10USC 0 0 6 0 -- 6
Scoring: Utah--Touchdown, Tate. PAT, Kaneshiro.Field Goal, Kaneshiro.USC--Touchdown, Byrd.
Attendance: 22,385 Date: Dec. 25
PAGE 180 — UNIVERSITY OF SOUTHERN CALIFORNIA
2002 BOWL INFORMATIONRose Bowl Selection Procedures
The Pacific-10 Rose Bowl representative shall be that member’steam with the best record in the loss and tie columns (a tie beingcounted as one-half loss) in all Conference games. If, however, thelowest loss-tie totals of two or more members are identical, determi-nation of the Rose Bowl representative shall be as follows:
a. Two-Team Tie. If the tied teams played one another, thewinner of their game shall be the representative. If they tied or did notplay one another, if either team is ranked first or second inthe nationin the Associated Press or the USA Today/ESPN American FootballCoaches Association which immediately follow the final regular-season game played by the Conference's members, then it shall bethe Rose Bowl representative. If they tied or did not play and are notso ranked, then the following formula shall be used:
(1) 4 points for a Conference win.(2) 3 points for a non-Conference win against a Div. I-A team.(3) 2 points for a non-Conference win against a non-Div. I-A team.(4) 2 points for a Conference tie.(5) 1 1/2 points for a non-Conference tie against a Div. 1-A team.(6) 1 point for a non-Conference tie against a non-Div. 1-A team.The team with the highest point total for all games shall be the
Rose Bowl representative.If a tie remains, the last team appearing in the Rose Bowl shall
be eliminated.b. Multiple Ties. When three or more teams are tied in the loss-
tie column in Conference play, if one has defeated all others, that teamshall be the Rose Bowl representative. If that is not the case, and oneof the teams is ranked first or second in the nation by the AssociatedPress or the USA Today/ESPN American Football Coaches Associa-tion which immediately follow the final regular-season game playedby the Conference's members, then it shall be the Rose Bowlrepresentative. If that is not the case, a team defeated by all other tiedteams shall be eliminated. If one team has not defeated the others, thepoint formula above shall be computed. Only the top two teams on thepoint system shall thereafter be considered. If a tie for the secondposition occurs upon application of the point formula, the secondteam shall be the winner of the game between the tied teams, or, if theteams did not play each other or played a tie game, the team whichhas not played in the Rose Bowl for the longest period of time shall bethe second team. If the remaining two teams played one another, thewinner shall be the representative. If they tied or did not play oneanother, the team with the highest point total for all games shall be theRose Bowl representative as in paragraph “a” above. If a tie remains,the last team appearing in the Rose Bowl shall be eliminated.
NOTES: Teams ineligible to participate in the Rose Bowl shallnot be included in the tie-breaking formula. Games in Alaska orHawaii shall not be counted in the point system if they are “12thgames” permitted under NCAA legislation. Participation in theNACDA Kickoff Classic or the Pigskin Classic shall not be counted inthe point system.
Pac-10 Bowl ArrangementsCollege football entered a new era in 1998 as the Pac-10, Big
Ten and Rose Bowl become associated with the Bowl ChampionshipSeries or BCS (formerly known as the Bowl Alliance).
In 2002, the Pac-10 champion will go to the Rose Bowl, unlessit is ranked as one of the top 2 teams in the nation at the conclusionof the regular season. In that case, the Pac-10 champ would play inthe National Championship Game (this season at the Tostitos FiestaBowl). If so, the Rose Bowl will fill that berth with another team fromthe BCS pool. That could be a second Pac-10 team, but would notnecessarily be so. The traditional opponent in the Rose Bowl is theBig Ten champion.
Regardless of the disposition of the Pac-10 champ, a secondPac-10 team may be selected for an at-large berth in the BCS in anygiven year. Pac-10 agreements with its other bowl partners providefor that occurence.
Agreements are in place with the Holiday, Wells Fargo Sun,Insight.com and Las Vegas Bowls to place 4 other Pac-10 teams inbowls (besides the Pac-10 champ).
After the Pac-10 champion goes to the Rose Bowl (or BCSChampionship Game), the Holiday Bowl receives the highest remain-ing team in the Pac-10 standings. If there is a tie for that position, theHoliday Bowl has the right to select from the tied teams. The opponentin the Holiday Bowl is the Big 12's No. 3 team.
The Sun Bowl then receives the highest remaining team in thePac-10 standings. If there is a tie for that position, the Sun Bowl hasthe right to select from the tied teams. The Big Ten's No. 5 team willbe the opponent in the Sun Bowl.
The Insight.com Bowl will host the next highest remaining Pac-10 team. If there is a tie for that position, the Insight.com Bowl has theright to select from the tied teams. The Big East Conference's No. 3team will fill the opponent's slot.
Finally, the next highest remaining Pac-10 team will play in theLas Vegas Bowl against the second pick from the Mountain WestConference. If there is a tie for that position, the Las Vegas Bowl hasthe right to select from the tied teams.
Bowl Championship SeriesThe Bowl Championship Series, in its fifth year, guarantees a
matchup between college football's top two teams in a true nationalchampionship game. The BCS consists of the Rose, Nokia Sugar,Tostitos Fiesta and FedEx Orange Bowls. Conferences with automaticberths are the Pac-10, Big Ten, Atlantic Coast, Big East, Big 12 andSoutheastern. Any Division I-A independent team or the champion ofany other Division I-A conference ranked sixth or higher in the BCSstandings also will be included in the BCS. Otherwise, any DivisionI-A team can qualify for the at-large selection pool if it has won ninegames and is ranked in the Top 12 of the BCS rankings. The BCSutilizes its own ranking system, which includes four major components:(1) media polls; (2) computer rankings; (3) strength of schedulerankings; (4) won-loss record. At the end of the regular season, theNational Championship contest will match the top two teams rankedin the BCS final regular season rankings.
2002 Bowl GamesDec. 17 New Orleans Bowl, New Orleans, La.Dec. 18 GMAC Alabama Bowl, Mobile, Ala.Dec. 23 Tangerine Bowl, Orlando, Fla.Dec. 25 Sega Sports Las Vegas Bowl, Las Vegas, Nev.Dec. 25 Hawaii Bowl, Honolulu, Hi.Dec. 26 Motor City Bowl, Pontiac, Mich.Dec. 26 Insight.com Bowl, Phoenix, Ariz.Dec. 27 Houston Bowl, Houston, Tex.Dec. 27 Mainstay Independence Bowl, Shreveport, La.Dec. 27 Holiday Bowl, San Diego, Calif.Dec. 28 Alamo Bowl, San Antonio, Tex.Dec. 28 Continental Tire Bowl, Charlotte, N.C.Dec. 30 Seattle Bowl, Seattle, Wash.Dec. 30 Gaylord Hotels Music City Bowl, Nashville, Tenn.Dec. 31 Crucial.com Humanitarian Bowl, Boise, Ida.Dec. 31 Wells Fargo Sun Bowl, El Paso, Tex.Dec. 31 Silicon Valley Football Classic, San Jose, Calif.Dec. 31 AXA Liberty Bowl, Memphis, Tenn.Dec. 31 Chick-Fil-A Peach Bowl, Atlanta, Ga.Dec. 31 San Francisco Bowl, San Francisco, Calif.Jan. 1 Outback Bowl, Tampa, Fla.Jan. 1 SBC Cotton Bowl, Dallas, Tex.Jan. 1 Toyota Gator Bowl, Jacksonville, Fla.Jan. 1 Capital One Florida Citrus Bowl, Orlando, Fla.Jan. 1 Rose Bowl, Pasadena, Calif.Jan. 1 Nokia Sugar Bowl, New Orleans, La.Jan. 2 FedEx Orange Bowl, Miami, Fla.Jan. 3 Tostitos Fiesta Bowl, Tempe, Ariz.
(Note: Subject to change)