historical vicariance and male-mediated gene flow in the...
TRANSCRIPT

Molecular Ecology (2009) 18, 3714–3729 doi: 10.1111/j.1365-294X.2009.04310.x
Historical vicariance and male-mediated gene flow inthe toad-headed lizards Phrynocephalus przewalskii
JOHN URQUHART,* YUEZHAO WANG† and JINZHONG FU*
*Department of Integrative Biology, University of Guelph, Guelph, Ontario N1G 2W1, Canada, †Chengdu Institute of Biology,
Chinese Academy of Sciences, Chengdu, Sichuan 610041, China
Corresponde
E-mail: jfu@u
Abstract
Using mitochondrial and microsatellite DNA data and a population genetic approach, we
tested male-mediated gene flow in the toad-headed lizards Phrynocephalus przewalskii.The mitochondrial DNA (ND2 gene), on the one hand, revealed two major lineages and a
strong population genetic structure (FST = 0.692; FST¢ = 0.995). The pairwise differences
between the two lineages ranged from 2.1% to 6.4% and the geographical division of the
two lineages coincided with a mountain chain consisting of the Helan and Yin
Mountains, suggesting a historical vicariant pattern. On the other hand, the nuclear
microsatellite DNA revealed a significant but small population genetic structure
(FST = 0.017; FST¢ = 0.372). The pairwise FST among the nine populations examined with
seven microsatellite DNA loci ranged from 0.0062 to 0.0266; the assignment test failed to
detect any naturally occurring population clusters. Furthermore, the populations
demonstrated a weak isolation by distance and a northeast to southwest clinal variation,
rather than a vicariant pattern. A historical vicariant event followed by male-mediated
gene flow appears to be the best explanation for the data. Approximately 2–5 Ma,
climatic change may have created an uninhabitable zone along the Helan-Yin mountain
chain and initiated the divergence between the two mitochondrial lineages. With further
climatic changes, males were able to disperse across the mountain chain, causing
sufficient gene flow that eventually erased the vicariant pattern and drastically reduced
the population genetic structure, while females remained philopatric and maintained the
mitochondrial DNA (mtDNA) divergence. Although polygyny mating system and female
philopatry may partially contribute to the reduced movement of females, other
hypotheses, such as female intrasexual aggression, should also be explored.
Keywords: male-mediated gene flow, microsatellite DNA, mtDNA, Phrynocephalus, population
genetic structure, vicariance
Received 12 March 2009; revision received 24 June 2009; accepted 29 June 2009
Introduction
Sex-biased dispersal is a common phenomenon in
mammals and birds; whereas male-biased dispersal pre-
vails in mammals, female-biased dispersal dominates in
birds (Greenwood 1980; Wolff 1994; Clarke et al. 1997).
Several nonmutually exclusive hypotheses have been
proposed and tested, including competition between
related females for resources, competition between
related males for mates, different fecundity costs of
nce: Jinzhong Fu, Fax: 1-519-767 1656;
oguelph.ca
dispersal between sexes, avoidance of inbreeding and
kin competition (Greenwood 1980; Dobson 1982; Pusey
1987; Perrin & Mazalov 2000; Devillard et al. 2004).
Most of these hypotheses linked the biased dispersal to
a species’ mating system: male-biased dispersal with
polygyny and female-biased dispersal with monogamy
(e.g. Greenwood 1980). However, these hypotheses are
primarily derived from studies of birds and mammals,
which are endothermic and generally have extensive
parental care. Whether ectothermic species without
extensive parental care, which comprise the majority of
animal species, follow the same rules is largely unex-
plored. Ectotherms have very different energy allocation
� 2009 Blackwell Publishing Ltd

MALE-MED IATED GENE FLOW IN PHRYNOCEPHALUS 3 71 5
from endotherms, and may have very different fecun-
dity costs of dispersal. Furthermore, parental care
increases the parental investment, which is a leading
factor in determining sexual selection. Species without
parental care probably have different intra- and inter-
sexual competition patterns. So far, studies on ecto-
therms are limited and revealed patterns are equivocal
(Johansson et al. 2008 and reference therein).
Besides birds and mammals, lizards as a group are
probably the most commonly used model organisms for
ecological and evolutionary studies. They are ecto-
therms and generally lack parental care. Extensive work
has been conducted on lizard foraging mode, mating
behaviour and community structure (Vitt & Pianka
1994; Reilly et al. 2007). A few cases of sex-biased dis-
persals have been reported in lizards. For example,
using mark and re-capture, Clobert et al. (1994)
reported male-biased dispersals in the common lizard
(Lacerta vivipara) and Olsson et al. (1996) found female-
biased dispersal in sand lizards (Lacerta agilis). Most
recently, using population genetic methods, Stenson
et al. (2002), Johansson et al. (2008) and Ujvari et al.
(2008) reported male-biased dispersal in the Dominican
anole (Anolis oculatus), the Caribbean lizard (Anolis ro-
quet) and the Frillneck lizard (Chlamydosaurus kingii),
respectively. With a wealth of background knowledge,
lizards provide us the best opportunity to test the
hypotheses derived from mammals and birds, and per-
haps to generate new ones for ectothermic species.
Due to difficulties associated with directly measuring
the dispersal rates by tracking individual animals, such
as mark and re-capture (e.g. Baker et al. 1995; Koenig
et al. 1996; Berry et al. 2004), ‘indirect’ methods to infer
sex-biased dispersal from population genetic tools pres-
ent attractive alternatives (Goudet et al. 2002; Prugnolle
& de Meeus 2002). In addition, sex-biased dispersal
may not necessarily lead to sex-biased gene flow, which
makes genetic-based methods more appealing if the
research focus is on the genetic consequence of the dis-
persal, not the dispersal itself (Riley et al. 2006). Two
groups of genetic methods have been established. One
group uses bi-parentally inherited markers and com-
pares differences in genetic structure between males
and females, and the other group compares markers
with different modes of inheritance (Prugnolle & de
Meeus 2002). Interestingly, of the two most recent stud-
ies on lizards, each used a different population genetic
method (Johansson et al. 2008; Ujvari et al. 2008).
Toad-headed lizards of the genus Phrynocephalus are
common species in central Asian desert. Similar to other
desert lizards, they can reach very high population den-
sity, which makes them excellent model systems for
ecological and evolutionary studies. One species,
Phrynocephalus przewalskii, has a large distribution range
� 2009 Blackwell Publishing Ltd
in northern China and the adjacent Mongolia, and has
been subjected to extensive systematic and ecological
studies (e.g. Liu et al. 1993; Xu & Yang 1993, 1995).
Juveniles of this species may reach sexual maturity
within a year from birth and a large number of individ-
uals may reach five years of age (Xu & Yang 1993; Zhao
et al. 1999). Recently, Gozdzik & Fu (2009) compared
their morphology as well as their mitochondrial DNA
(mtDNA) data. Although two deeply diverged mtDNA
lineages were found, a principle component analysis of
24 morphological characters revealed no significant dif-
ference between the two lineages. The observed contra-
diction between the mtDNA and the morphological
data provides an opportunity for further investigating
the potential male-mediated gene flow in this species.
In this study, we used an ‘indirect’ population genetic
approach to examine the potential male-mediated gene
flow in the species Phrynocephalus przewalskii. Of the
two groups of population genetic methods, Goudet
et al. (2002) found that methods using only bi-paren-
tally inherited markers and comparing female and male
differences in genetic structure were very conservative
and were limited to animals where dispersal occurs
mostly at the juvenile stage. Considering its long adult
life, this group of methods may not be suitable for
P. przewalskii. Therefore, we used both maternally
inherited mtDNA and bi-parentally inherited microsat-
ellite DNA data to detect potential male-biased gene
flow. If gene flow in P. przewalskii is dominantly male-
mediated, we would expect mtDNA data to show a
strong genetic structure and the microsatellite DNA
data to demonstrate a high level of gene flow across
populations.
Materials and methods
Sampling
Samples were collected throughout the range of P. prze-
walskii, including the Gobi, Tengger and Ordos deserts
(Fig. 1). A total of 694 specimens were collected from
55 sites in 2002, 2005 and 2006. The most distant sites
were separated by approximately 1000 km. To maxi-
mize the sensitivity of detecting genetic structure, we
used two different sampling strategies for mtDNA and
microsatellite DNA. For mtDNA, we sequenced sam-
ples from all 55 sites but only a few samples (1–21)
from each site. The microsatellite DNA analysis requires
large sample sizes from each site, so we examined nine
sites with sample sizes of 38–48. The nine populations
were chosen based on the results of Gozdzik & Fu
(2009); representatives from both mtDNA lineages and
the overlap zone were sampled (Fig. 1). All samples
used for microsatellite DNA analysis were collected

Fig. 1 Distribution map and sampling
sites of Phrynocephalus przewalskii. The
black, dashed line outlines the species
distribution. The red, dashed line indi-
cates the division between the two mito-
chondrial lineages. Solid circle represents
population with all members from mito-
chondrial clade I and empty circles rep-
resent populations with all members
from mitochondrial clade II. Half solid
circles represent mixed populations.
Populations 5, 12, 20, 29, 31, 32, 35, 50
and 54 (in bold) were subjected to micro-
satellite DNA analysis.
3716 J . URQUHART, Y . WANG and J . FU
between 2005 and 2006. We assumed that annual varia-
tion in population genetic makeup was minimal. Sam-
pling site and sample size information are presented in
Appendix I and depicted in Fig. 1. Six additional
sequences from three closely related species, P. guttatus,
P. versicolor and an undescribed species (as of Wang &
Fu 2004), were obtained from Wang & Fu (2004), which
were used as outgroup taxa for the phylogenetic analy-
sis of the mtDNA.
Laboratory protocols
Genomic DNA was extracted from muscle or liver tis-
sue using a standard phenol–chloroform protocol
(Palumbi 1996). Extracted DNA was re-suspended
in 200 ll TE buffer (10 mM Tris-HCl, pH 8.0, 1 mM
EDTA).
An 850 base pair (bp) fragment of the ND2 gene from
the mitochondrial genome was targeted for sequencing
with primers L4447 (5¢-AAGCAGTTGGGCCCATGCCC-
CAAAAACGG-3¢) and H5622 (5¢-TATTTTAATTAAA
ATATCTGAGTTGCA-3¢; Wang & Fu 2004). Standard
polymerase chain reactions (PCR) were performed with
annealing temperature optimized at 50 �C. PCR prod-
ucts were purified using the QIAquick PCR purification
kits with the manufacturer’s protocol (Qiagen). DNA
sequencing was conducted with BigDye terminator
sequencing chemistry (Applied Biosystems) in conjunc-
tion with an ABI 3730. Sequences were checked and
edited with Sequencher version 4.5 (Genecode Corp)
and imported into MacClade version 4.08 (Maddison &
Maddison 2003), where they were aligned.
Twelve polymorphic microsatellite DNA loci from
Urquhart et al. (2005) were examined. PCR optimization
generally followed the procedures described by Urqu-
hart et al. (2005). One primer pair was modified; the
reverse primer of locus Phry75 was changed to 5¢-AG-
TTGTAAAAGGTCCAGGTGCTC-3¢ to reduce the length
of the PCR products. One primer from each pair was
labelled with tetrachloro-6-carboxy-fluorescein (TET).
The labelled PCR products and TAMRA� size standard
marker (GeneScan� 350; Applied Biosystems) were elec-
trophoresed on 6% denaturing polyacrylamide gels.
The gels were then visualized on a FMBIO II laser scan-
ner (Hitachi) to determine the lengths of the microsatel-
lite DNA fragments.
mtDNA analysis
A phylogenetic tree was used to represent the diver-
gence patterns among the mtDNA and a Bayesian infer-
ence with computer program MrBayes version 3.2
(Ronquist & Huelsenbeck 2003) was employed. The
best-fit model (GTR+I+G) was selected by hLRT in
MrModelTest version 2.1 (Nylander 2004) and a flat
‘prior’ setting was used. Four Markov chains were exe-
cuted and the data set was run for ten million genera-
tions to allow adequate time for convergence. Tracer
version 1.4 (Rambaut & Drummond 2007) was used to
plot the resulting likelihood values and to determine
when the Markov chains reached convergence. Trees
were sampled every 500 generations and we used the
last 10 000 sample trees to estimate the consensus tree
and the Bayesian posterior probabilities. All other sam-
pled trees were designated as ‘burn-in’. Two separate
runs, which included a total of four independent tree
searches, were conducted and the resulting trees were
compared and pooled.
� 2009 Blackwell Publishing Ltd

MALE-MED IATED GENE FLOW IN PHRYNOCEPHALUS 3 71 7
An analysis of molecular variance (AMOVA) using Arle-
quin version 3.1 (Excoffier et al. 2005) was conducted.
Populations were divided into two groups following
the designation of the phylogenetic tree and their geo-
graphical distribution. Permutation tests were per-
formed at three hierarchical levels: among groups,
among sites within groups and among individuals
within sites.
Pairwise percentage differences (uncorrected p-dis-
tance) were used to represent the magnitude of the
mtDNA divergence. The distances were calculated
using PAUP* version b10 (Swofford 2002). A divergence
time estimate was also carried out. Studies of ND2 gene
divergence in other agamid lizards (genus Laudakia)
provided an estimate of approximately 0.65% change
per lineage per million years (Macey et al. 1998). We
used this clock rate to estimate approximate divergence
time. We did not pursue a more elaborated test because
of the lack of appropriate calibration points.
Microsatellite DNA analysis
All loci were screened using Micro-Checker version 2.2
(Van Oosterhout et al. 2004) for large allele dropout
and the presence of null alleles. All loci were tested for
linkage equilibrium and Hardy–Weinberg equilibrium
(HWE) using Arlequin.
Pairwise FST was used to evaluate the degree of pop-
ulation subdivision. Weir & Cockerham’s (1984) h was
calculated using Arlequin. As an estimator of FST, hprobably has a smaller variance than Slatkin’s (1995)
RST when the number of loci is small (Balloux & Gou-
det 2002), and it does not require that all loci follow a
single stepwise mutation model. Significance tests for
pairwise h were performed by permutation of multi-
locus genotype data among pairs of samples. A total of
10 000 permutations were performed to allow for the
significance at the 1% nominal level after Bonferroni
corrections. Exact tests of population differentiation
based on allele frequencies (Raymond & Rousset 1995)
were also conducted with Arlequin. A total of 100 000
Markov chain steps and a burn-in of 10 000 were used.
A locus by locus analysis of molecular variance
(AMOVA) using Arlequin was conducted. The nine popu-
lations were divided into two groups, following the
designation of the mtDNA. Permutation tests with
10 000 replicates were performed at four hierarchical
levels: among groups, among sites within groups,
among individuals within sites and within individuals.
Patterns of isolation by distance (IBD) were evaluated
by examining the correlation between Rousset’s (1997)
FST ⁄ (1)FST) and geographical distance. A Mantel test
was conducted using Genepop web version (Raymond
& Rousset 2003). The linear distances between sampling
� 2009 Blackwell Publishing Ltd
sites were estimated from their coordinates using a web
service at http://jan.ucc.nau.edu/~cvm/latlongdist.
html. For testing of statistical significance, 10 000 per-
mutations in Mantel tests were used to test the null
hypothesis that genetic distance is not associated with
geographical distance.
An assignment test was also applied to the data with
the computer program Structure version 2.2 (Pritchard
et al. 2007), which does not assume a drift-migration
equilibrium. The admixture model was used and the
number of clusters (k) was varied from 1 to 6. For each
k, 50 runs were executed with 100 000 iterations after
100 000 iterations as ‘burn-in’. An average over the ten
highest likelihood values [lnP(D)] was obtained for each
k. The lnP(D) values were plotted against the k value to
determine the best k.
Comparison between mtDNA and microsatellite DNA
As a result of the different modes of inheritance of
mtDNA (haploid and uniparental) and microsatellite
DNA (diploid and bi-parental), a fourfold greater level
of genetic structure in the mtDNA is expected (e.g. Pa-
lumbi et al. 2001; but see Hudson & Turelli 2003). The
ratio of mtDNA divergence to microsatellite DNA
divergence should be approximately four, all else being
equal. Crease et al. (1990) presented a formula for
calculating the ratio of mtDNA divergence to micro-
satellite DNA divergence (k). The parameter
k = ln(1)N) ⁄ ln(1)G), where N is the genetic divergence
in mtDNA genes and G is the genetic divergence in
microsatellite DNA. We used FST¢ (Meirmans 2006), a
standardized FST, to represent the genetic divergence
of the markers. Thus, k = ln[1) FST¢(mtDNA)] ⁄ ln[1)FST¢(microsatelliteDNA)]. FST¢ is derived from AMOVA and
standardized (FST¢ = FST ⁄ FST(max); Meirmans 2006). FST¢for microsatellite DNA was calculated with GenoDive
version 2.0b14 (Meirmans 2009) and FST¢ for mtDNA
was calculated with Arlequin, following the recommen-
dation of Meirmans (2006).
Results
mtDNA sequence data
A total of 370 sequences of P. przewalskii were gathered,
including 154 new sequences from this study. The other
216 sequences of P. przewalskii and 6 sequences of three
outgroup taxa were from two previous studies (Wang
& Fu 2004; Gozdzik & Fu 2009). All new sequences are
deposited in GenBank (accession no. GQ302988–
GQ303142). A total of 850 bp of DNA sequences of the
ND2 gene were confidently resolved and 176 haplo-
types were identified, including 6 outgroup taxa. Of the
3718 J . URQUHART, Y . WANG and J . FU
850 nucleotide sites, 196 were variable across the
ingroup members.
Figure 2 presents the Bayesian tree along with the
Bayesian posterior probabilities. The tree resolved two
major clades; whereas clade I spanned from the south-
west to the northeast of the distribution, clade II was
mostly restricted to the Ordos Desert. The geographi-
cal division of the two clades coincided with a moun-
tain chain including the Helan and Yin Mountains
(Fig. 1). At the contact zone, several populations had
haplotypes from both clades (e.g. 11, 12, 32–37 and
39–42; Fig. 1).
There was a clear population genetic structure within
both clades. Within clade I, there were several groups.
At the top, clade (Ia+Ib) included haplotypes from sites
1–11, 13–15 and 17–20 (Fig. 2). All members of these
populations were in this clade except one specimen of
population 11, which was grouped in clade II, and sev-
eral specimens of population 20. The phylogenetic posi-
tion of each haplotype displayed a clear association
with its geographical location. At the base of the clade,
all haplotypes were from the western sites (17–20) and
the eastern most populations were all located at the tip
of the clade. An accelerated rate of molecular evolution
was also observed (Fig. 2). At the base of clade I, there
were H105 from population 34 and H104 from popula-
tion 42. Both populations were located at the contact
zone, and most of their co-habitants were from clade II.
The last group, Ic, was a paraphyletic assemblage com-
prising most samples from the southwestern popula-
tions. Within this group, haplotypes from different
populations were intertwined, and had no clear associa-
tion with their geographical locations.
Within clade II, there were several deeply diverged
clades. Some of the clades demonstrated relationships
with the geographical locations of the haplotypes. For
example, samples in clade IId (exclusively populations
42–44) were restricted to the northern end of the Helan
Mountains.
For AMOVA, populations were divided into two
groups, following the division of the Helan and Yin
Mountains and the division of the mtDNA gene tree.
Group 1 included populations from clade I (1–11, 13–
15, 17–31 and 38–41), and group 2 included populations
from clade II (12, 16, 32–37 and 42–55). Several popula-
tions from the contact zone had haplotypes from both
clades I and II (e.g. 32–37, 39–42; Fig. 1), and the group-
ing of these populations was determined by their
majority. All three levels were statistically significant,
and the largest component of variation was among the
groups (46.56%; Table 1). This is not surprising because
the grouping was based on the divergence patterns
revealed by the tree. The among-populations-within-
groups and within-populations components each
accounted for approximately half of the remaining vari-
ation (27.41% and 26.02%).
Pairwise differences between clade I and II ranged
from 2.1% to 6.4%, while the majority was 4–5%.
Applying the molecular clock hypothesis and Macey
et al.’s (1998) calibration that 0.65% sequence diver-
gence is expected to accumulate over 1 Myr within each
lineage (1.3% between lineages), the divergence
between clade I and II is found to have occurred
approximately 2–5 Ma, placing this divergence in the
Pliocene.
Microsatellite DNA data
Of the 12 loci published in Urquhart et al. (2005), only
seven were used in the analysis. The other five loci suf-
fered from either inconsistent PCR amplification after
optimization, or significant large allele dropout or pres-
ence of null alleles detected by Micro-Checker.
A majority of the HWE tests significantly deviated
from expectation. In all cases, there was significant het-
erozygote deficiency (Table 2). This deficiency did not
appear to correlate with the location of contact zones
between mtDNA clades. While some linkage disequilib-
rium tests were significant, there were no two loci that
were consistently associated across populations. There-
fore, all loci were included in the subsequent analyses.
Other indices, the average number of alleles (A), the
observed heterozygosity (HO) and the expected hetero-
zygosity (HE) across populations for each locus, are also
presented in Table 2.
Pairwise FST values are presented in Table 3. The val-
ues varied from 0.0062 to 0.0266 and all except one
were statistically significant after Bonferroni correction
for multiple comparisons (P < 0.01). The low FST values
indicated that there was a small population genetic
structure among the populations, despite geographical
distances between some of the populations being
1000 km. Exact tests of population differentiation based
on haplotype frequencies showed nondifferentiation
both globally and pairwisely (P = 1.000). This was con-
cordant with the observation that not a single unique
allele existed in any populations.
The isolation by distance test revealed a significant
but weak correlation (R2 = 0.1672, PMantel = 0.0307). This
was not surprising considering the low FST values. A
linear correlation best-fit line is presented in Fig. 3.
Following the mtDNA data, the nine populations
examined for microsatellite DNA were also divided into
two groups. Group 1 included populations 5, 20, 29 and
31; group 2 included populations 12, 32, 35, 50 and 54.
The AMOVA results of the microsatellite DNA data are
presented in Table 1. Most of the variation was allo-
cated to the within-individual component (81.7%),
� 2009 Blackwell Publishing Ltd

H6H7H8H9H10
H5H4
H3
H1H2
H11H12
H13H14
H15H16
H17H18
H19H20
H21H22
H23H24
H25H26H27
H28H29
H30H31
H32H33
H34H35
H36H37H38
H39H40
H41H42H43
H44H45
H46H47H48
H49H50
H51H52
H53H54
H55H56
H57H58
H59H60
H61H62H63
H64H65
H66H67
H68H69
H70H71
H72H73
H74H75
H76H77
H78H79H80
H81H82
H83H84
H85H86
H87H88H89
H90H91H92
H93H94
H95H96
H97H98
H99H100H101
H102H103
H104H105
0.001 substitutions/site
100
100
100
100
100
98
72
Gro
up
Ia
Group Ibpopulations 17–20
Gro
up
Ic
populations33,35
populations20,21,22,23,24
populations 32
populations30,31
populations 27,28
populations20,21,24,25,27,29,30,31,32,36,37,39,40,41
populations24,25
populations12,24,25,26,29,31,42
pop. 42 Group Idpop. 34 Group Ie
86
98
100
94
94
95
94
100
97
po
pul
atio
ns 1
3–
15
po
pul
atio
ns 1
–1
1
Ic Id
H106H107
H108H109
H110H111
H112H113
H114H115
H116H117
H118H119
H120H121
H122H123H124
H125H126
H127H128H129
H130H131
H132H133
H134H135
H136H137H138H139H140
H141H142
H143H144
H145H146
H147H148
H149H150
H151H152
H153H154
H155H156
H157H158
H159H160
H161H162
H163H164
H165H166
H167H168
H169H170
P. versicolor -1P. versicolor -2
P. sp. -1P. sp. -2
Phrynocephalus guttatus -1Phrynocephalus guttatus -2
IbIa
100
100
100100
98
100
98
99
100
100
100
96
po
pul
atio
ns
32
–4
1,4
3–
46
,48
–5
1p
op
ulat
ions
1
2,1
6,4
5,4
6,4
8,5
1,5
3,5
4,5
5
po
ps.
4
5–
48
,52
,5
4,5
5p
op
ulat
ions
4
2,4
3,4
4
Ie
Gro
up
IIa
Gro
up
IIb
Gro
up
IIc
Gro
up
IId
Clade I
Clade II
100
Fig. 2 A gene tree derived from mtDNA sequence data using Bayesian inference. Numbers above the branches are Bayesian poster-
ior probabilities. Taxa are haplotypes; all haplotype designations are listed in Appendix I.
MALE-MED IATED GENE FLOW IN PHRYNOCEPHALUS 3 71 9
� 2009 Blackwell Publishing Ltd
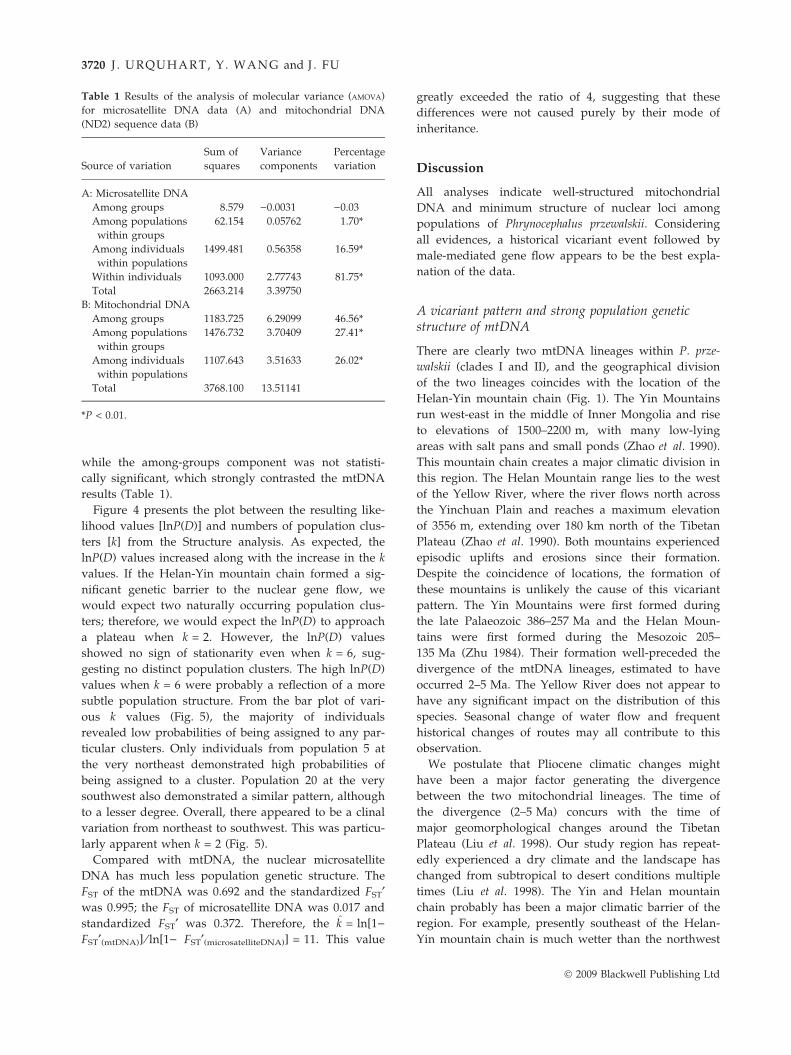
Table 1 Results of the analysis of molecular variance (AMOVA)
for microsatellite DNA data (A) and mitochondrial DNA
(ND2) sequence data (B)
Source of variation
Sum of
squares
Variance
components
Percentage
variation
A: Microsatellite DNA
Among groups 8.579 )0.0031 )0.03
Among populations
within groups
62.154 0.05762 1.70*
Among individuals
within populations
1499.481 0.56358 16.59*
Within individuals 1093.000 2.77743 81.75*
Total 2663.214 3.39750
B: Mitochondrial DNA
Among groups 1183.725 6.29099 46.56*
Among populations
within groups
1476.732 3.70409 27.41*
Among individuals
within populations
1107.643 3.51633 26.02*
Total 3768.100 13.51141
*P < 0.01.
3720 J . URQUHART, Y . WANG and J . FU
while the among-groups component was not statisti-
cally significant, which strongly contrasted the mtDNA
results (Table 1).
Figure 4 presents the plot between the resulting like-
lihood values [lnP(D)] and numbers of population clus-
ters [k] from the Structure analysis. As expected, the
lnP(D) values increased along with the increase in the k
values. If the Helan-Yin mountain chain formed a sig-
nificant genetic barrier to the nuclear gene flow, we
would expect two naturally occurring population clus-
ters; therefore, we would expect the lnP(D) to approach
a plateau when k = 2. However, the lnP(D) values
showed no sign of stationarity even when k = 6, sug-
gesting no distinct population clusters. The high lnP(D)
values when k = 6 were probably a reflection of a more
subtle population structure. From the bar plot of vari-
ous k values (Fig. 5), the majority of individuals
revealed low probabilities of being assigned to any par-
ticular clusters. Only individuals from population 5 at
the very northeast demonstrated high probabilities of
being assigned to a cluster. Population 20 at the very
southwest also demonstrated a similar pattern, although
to a lesser degree. Overall, there appeared to be a clinal
variation from northeast to southwest. This was particu-
larly apparent when k = 2 (Fig. 5).
Compared with mtDNA, the nuclear microsatellite
DNA has much less population genetic structure. The
FST of the mtDNA was 0.692 and the standardized FST¢was 0.995; the FST of microsatellite DNA was 0.017 and
standardized FST¢ was 0.372. Therefore, the k = ln[1)FST¢(mtDNA)] ⁄ ln[1) FST¢(microsatelliteDNA)] = 11. This value
greatly exceeded the ratio of 4, suggesting that these
differences were not caused purely by their mode of
inheritance.
Discussion
All analyses indicate well-structured mitochondrial
DNA and minimum structure of nuclear loci among
populations of Phrynocephalus przewalskii. Considering
all evidences, a historical vicariant event followed by
male-mediated gene flow appears to be the best expla-
nation of the data.
A vicariant pattern and strong population geneticstructure of mtDNA
There are clearly two mtDNA lineages within P. prze-
walskii (clades I and II), and the geographical division
of the two lineages coincides with the location of the
Helan-Yin mountain chain (Fig. 1). The Yin Mountains
run west-east in the middle of Inner Mongolia and rise
to elevations of 1500–2200 m, with many low-lying
areas with salt pans and small ponds (Zhao et al. 1990).
This mountain chain creates a major climatic division in
this region. The Helan Mountain range lies to the west
of the Yellow River, where the river flows north across
the Yinchuan Plain and reaches a maximum elevation
of 3556 m, extending over 180 km north of the Tibetan
Plateau (Zhao et al. 1990). Both mountains experienced
episodic uplifts and erosions since their formation.
Despite the coincidence of locations, the formation of
these mountains is unlikely the cause of this vicariant
pattern. The Yin Mountains were first formed during
the late Palaeozoic 386–257 Ma and the Helan Moun-
tains were first formed during the Mesozoic 205–
135 Ma (Zhu 1984). Their formation well-preceded the
divergence of the mtDNA lineages, estimated to have
occurred 2–5 Ma. The Yellow River does not appear to
have any significant impact on the distribution of this
species. Seasonal change of water flow and frequent
historical changes of routes may all contribute to this
observation.
We postulate that Pliocene climatic changes might
have been a major factor generating the divergence
between the two mitochondrial lineages. The time of
the divergence (2–5 Ma) concurs with the time of
major geomorphological changes around the Tibetan
Plateau (Liu et al. 1998). Our study region has repeat-
edly experienced a dry climate and the landscape has
changed from subtropical to desert conditions multiple
times (Liu et al. 1998). The Yin and Helan mountain
chain probably has been a major climatic barrier of the
region. For example, presently southeast of the Helan-
Yin mountain chain is much wetter than the northwest
� 2009 Blackwell Publishing Ltd
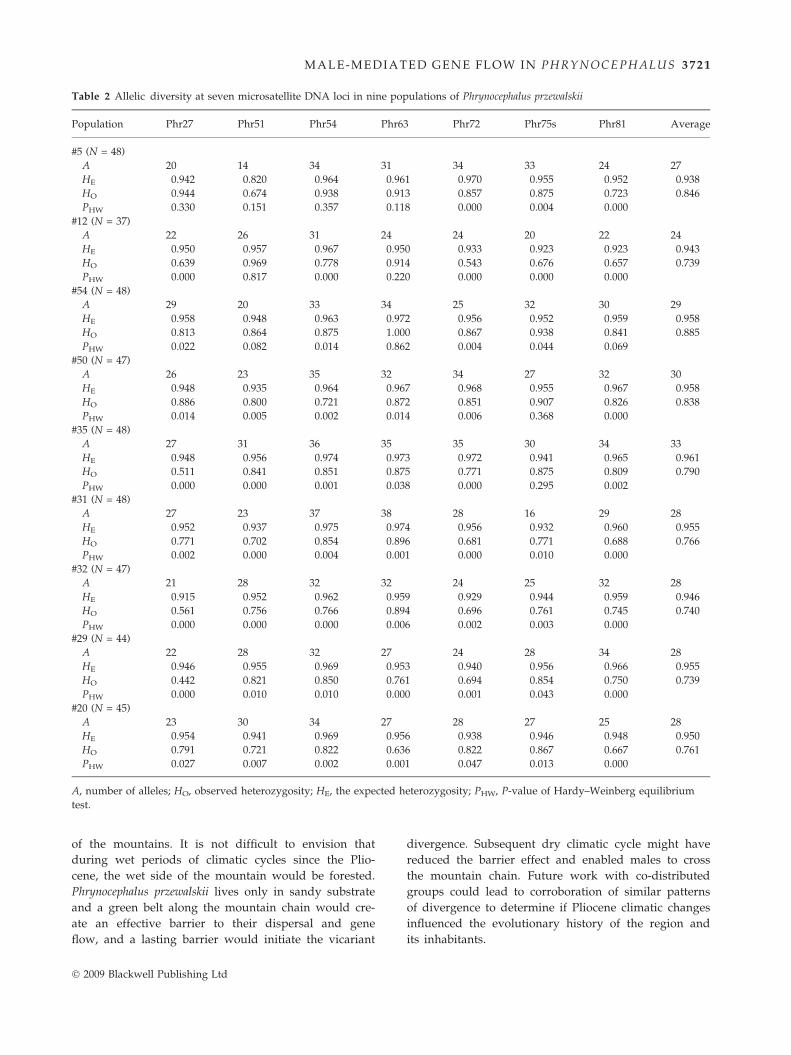
Table 2 Allelic diversity at seven microsatellite DNA loci in nine populations of Phrynocephalus przewalskii
Population Phr27 Phr51 Phr54 Phr63 Phr72 Phr75s Phr81 Average
#5 (N = 48)
A 20 14 34 31 34 33 24 27
HE 0.942 0.820 0.964 0.961 0.970 0.955 0.952 0.938
HO 0.944 0.674 0.938 0.913 0.857 0.875 0.723 0.846
PHW 0.330 0.151 0.357 0.118 0.000 0.004 0.000
#12 (N = 37)
A 22 26 31 24 24 20 22 24
HE 0.950 0.957 0.967 0.950 0.933 0.923 0.923 0.943
HO 0.639 0.969 0.778 0.914 0.543 0.676 0.657 0.739
PHW 0.000 0.817 0.000 0.220 0.000 0.000 0.000
#54 (N = 48)
A 29 20 33 34 25 32 30 29
HE 0.958 0.948 0.963 0.972 0.956 0.952 0.959 0.958
HO 0.813 0.864 0.875 1.000 0.867 0.938 0.841 0.885
PHW 0.022 0.082 0.014 0.862 0.004 0.044 0.069
#50 (N = 47)
A 26 23 35 32 34 27 32 30
HE 0.948 0.935 0.964 0.967 0.968 0.955 0.967 0.958
HO 0.886 0.800 0.721 0.872 0.851 0.907 0.826 0.838
PHW 0.014 0.005 0.002 0.014 0.006 0.368 0.000
#35 (N = 48)
A 27 31 36 35 35 30 34 33
HE 0.948 0.956 0.974 0.973 0.972 0.941 0.965 0.961
HO 0.511 0.841 0.851 0.875 0.771 0.875 0.809 0.790
PHW 0.000 0.000 0.001 0.038 0.000 0.295 0.002
#31 (N = 48)
A 27 23 37 38 28 16 29 28
HE 0.952 0.937 0.975 0.974 0.956 0.932 0.960 0.955
HO 0.771 0.702 0.854 0.896 0.681 0.771 0.688 0.766
PHW 0.002 0.000 0.004 0.001 0.000 0.010 0.000
#32 (N = 47)
A 21 28 32 32 24 25 32 28
HE 0.915 0.952 0.962 0.959 0.929 0.944 0.959 0.946
HO 0.561 0.756 0.766 0.894 0.696 0.761 0.745 0.740
PHW 0.000 0.000 0.000 0.006 0.002 0.003 0.000
#29 (N = 44)
A 22 28 32 27 24 28 34 28
HE 0.946 0.955 0.969 0.953 0.940 0.956 0.966 0.955
HO 0.442 0.821 0.850 0.761 0.694 0.854 0.750 0.739
PHW 0.000 0.010 0.010 0.000 0.001 0.043 0.000
#20 (N = 45)
A 23 30 34 27 28 27 25 28
HE 0.954 0.941 0.969 0.956 0.938 0.946 0.948 0.950
HO 0.791 0.721 0.822 0.636 0.822 0.867 0.667 0.761
PHW 0.027 0.007 0.002 0.001 0.047 0.013 0.000
A, number of alleles; HO, observed heterozygosity; HE, the expected heterozygosity; PHW, P-value of Hardy–Weinberg equilibrium
test.
MALE-MED IATED GENE FLOW IN PHRYNOCEPHALUS 3 72 1
of the mountains. It is not difficult to envision that
during wet periods of climatic cycles since the Plio-
cene, the wet side of the mountain would be forested.
Phrynocephalus przewalskii lives only in sandy substrate
and a green belt along the mountain chain would cre-
ate an effective barrier to their dispersal and gene
flow, and a lasting barrier would initiate the vicariant
� 2009 Blackwell Publishing Ltd
divergence. Subsequent dry climatic cycle might have
reduced the barrier effect and enabled males to cross
the mountain chain. Future work with co-distributed
groups could lead to corroboration of similar patterns
of divergence to determine if Pliocene climatic changes
influenced the evolutionary history of the region and
its inhabitants.
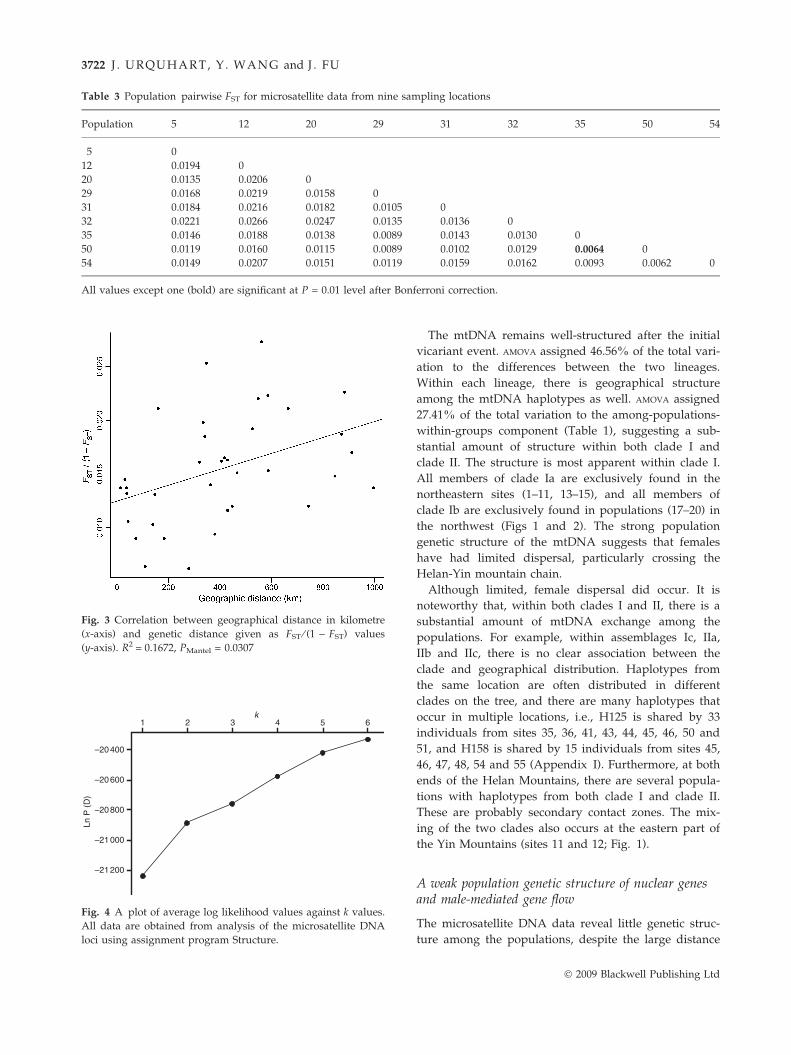
Fig. 3 Correlation between geographical distance in kilometre
(x-axis) and genetic distance given as FST ⁄ (1 ) FST) values
(y-axis). R2 = 0.1672, PMantel = 0.0307
–21 200
–20 400
–20 600
–20 800
–21 000
1 6 5 4 3 2
Ln P
(D
)
k
Fig. 4 A plot of average log likelihood values against k values.
All data are obtained from analysis of the microsatellite DNA
loci using assignment program Structure.
Table 3 Population pairwise FST for microsatellite data from nine sampling locations
Population 5 12 20 29 31 32 35 50 54
5 0
12 0.0194 0
20 0.0135 0.0206 0
29 0.0168 0.0219 0.0158 0
31 0.0184 0.0216 0.0182 0.0105 0
32 0.0221 0.0266 0.0247 0.0135 0.0136 0
35 0.0146 0.0188 0.0138 0.0089 0.0143 0.0130 0
50 0.0119 0.0160 0.0115 0.0089 0.0102 0.0129 0.0064 0
54 0.0149 0.0207 0.0151 0.0119 0.0159 0.0162 0.0093 0.0062 0
All values except one (bold) are significant at P = 0.01 level after Bonferroni correction.
3722 J . URQUHART, Y . WANG and J . FU
The mtDNA remains well-structured after the initial
vicariant event. AMOVA assigned 46.56% of the total vari-
ation to the differences between the two lineages.
Within each lineage, there is geographical structure
among the mtDNA haplotypes as well. AMOVA assigned
27.41% of the total variation to the among-populations-
within-groups component (Table 1), suggesting a sub-
stantial amount of structure within both clade I and
clade II. The structure is most apparent within clade I.
All members of clade Ia are exclusively found in the
northeastern sites (1–11, 13–15), and all members of
clade Ib are exclusively found in populations (17–20) in
the northwest (Figs 1 and 2). The strong population
genetic structure of the mtDNA suggests that females
have had limited dispersal, particularly crossing the
Helan-Yin mountain chain.
Although limited, female dispersal did occur. It is
noteworthy that, within both clades I and II, there is a
substantial amount of mtDNA exchange among the
populations. For example, within assemblages Ic, IIa,
IIb and IIc, there is no clear association between the
clade and geographical distribution. Haplotypes from
the same location are often distributed in different
clades on the tree, and there are many haplotypes that
occur in multiple locations, i.e., H125 is shared by 33
individuals from sites 35, 36, 41, 43, 44, 45, 46, 50 and
51, and H158 is shared by 15 individuals from sites 45,
46, 47, 48, 54 and 55 (Appendix I). Furthermore, at both
ends of the Helan Mountains, there are several popula-
tions with haplotypes from both clade I and clade II.
These are probably secondary contact zones. The mix-
ing of the two clades also occurs at the eastern part of
the Yin Mountains (sites 11 and 12; Fig. 1).
A weak population genetic structure of nuclear genesand male-mediated gene flow
The microsatellite DNA data reveal little genetic struc-
ture among the populations, despite the large distance
� 2009 Blackwell Publishing Ltd
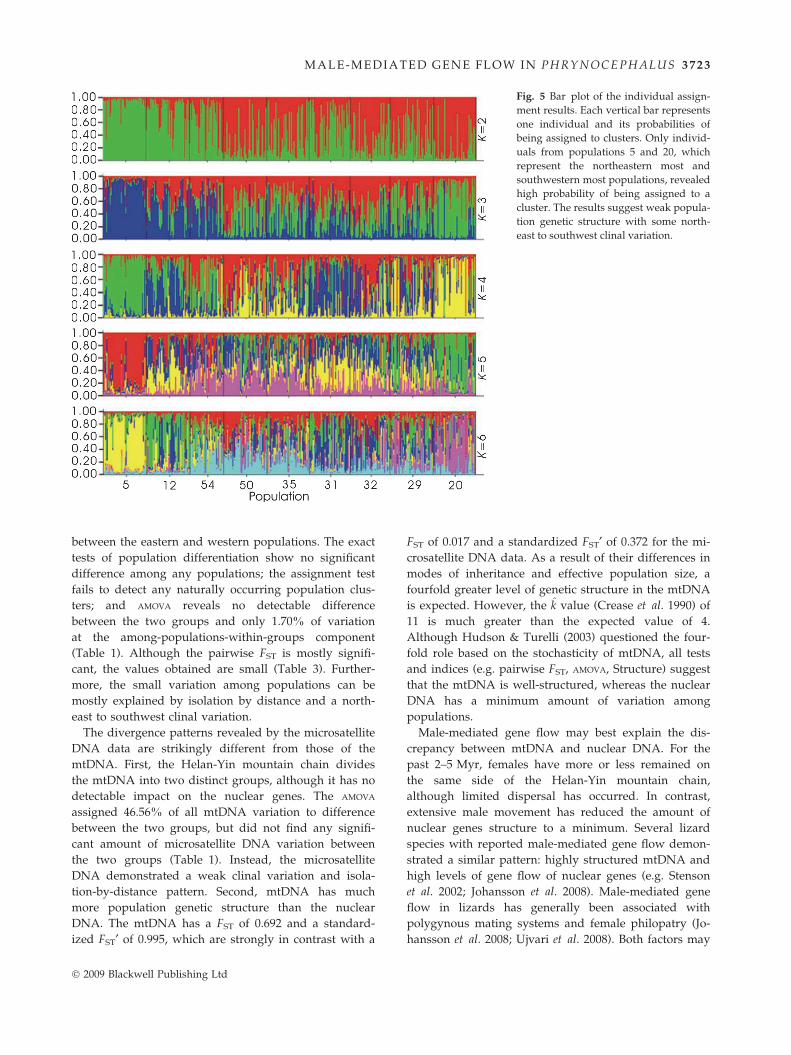
Fig. 5 Bar plot of the individual assign-
ment results. Each vertical bar represents
one individual and its probabilities of
being assigned to clusters. Only individ-
uals from populations 5 and 20, which
represent the northeastern most and
southwestern most populations, revealed
high probability of being assigned to a
cluster. The results suggest weak popula-
tion genetic structure with some north-
east to southwest clinal variation.
MALE-MED IATED GENE FLOW IN PHRYNOCEPHALUS 3 72 3
between the eastern and western populations. The exact
tests of population differentiation show no significant
difference among any populations; the assignment test
fails to detect any naturally occurring population clus-
ters; and AMOVA reveals no detectable difference
between the two groups and only 1.70% of variation
at the among-populations-within-groups component
(Table 1). Although the pairwise FST is mostly signifi-
cant, the values obtained are small (Table 3). Further-
more, the small variation among populations can be
mostly explained by isolation by distance and a north-
east to southwest clinal variation.
The divergence patterns revealed by the microsatellite
DNA data are strikingly different from those of the
mtDNA. First, the Helan-Yin mountain chain divides
the mtDNA into two distinct groups, although it has no
detectable impact on the nuclear genes. The AMOVA
assigned 46.56% of all mtDNA variation to difference
between the two groups, but did not find any signifi-
cant amount of microsatellite DNA variation between
the two groups (Table 1). Instead, the microsatellite
DNA demonstrated a weak clinal variation and isola-
tion-by-distance pattern. Second, mtDNA has much
more population genetic structure than the nuclear
DNA. The mtDNA has a FST of 0.692 and a standard-
ized FST¢ of 0.995, which are strongly in contrast with a
� 2009 Blackwell Publishing Ltd
FST of 0.017 and a standardized FST¢ of 0.372 for the mi-
crosatellite DNA data. As a result of their differences in
modes of inheritance and effective population size, a
fourfold greater level of genetic structure in the mtDNA
is expected. However, the k value (Crease et al. 1990) of
11 is much greater than the expected value of 4.
Although Hudson & Turelli (2003) questioned the four-
fold role based on the stochasticity of mtDNA, all tests
and indices (e.g. pairwise FST, AMOVA, Structure) suggest
that the mtDNA is well-structured, whereas the nuclear
DNA has a minimum amount of variation among
populations.
Male-mediated gene flow may best explain the dis-
crepancy between mtDNA and nuclear DNA. For the
past 2–5 Myr, females have more or less remained on
the same side of the Helan-Yin mountain chain,
although limited dispersal has occurred. In contrast,
extensive male movement has reduced the amount of
nuclear genes structure to a minimum. Several lizard
species with reported male-mediated gene flow demon-
strated a similar pattern: highly structured mtDNA and
high levels of gene flow of nuclear genes (e.g. Stenson
et al. 2002; Johansson et al. 2008). Male-mediated gene
flow in lizards has generally been associated with
polygynous mating systems and female philopatry (Jo-
hansson et al. 2008; Ujvari et al. 2008). Both factors may
3724 J . URQUHART, Y . WANG and J . FU
well-contribute to the observed patterns in Phrynocepha-
lus przewalskii. Currently, we do not have much data on
the mating strategy and territorial behaviour of P. prze-
walskii. However, preliminary data from a closely
related species, P. vlangalii, revealed that floater males
have a much larger home range than that of females
(Yin Qi, personal communication).
Male-mediated gene flow in P. przewalskii spans a
very large spatial and temporal scale, compared with
other studies that have found evidence for male-medi-
ated gene flow or male-biased dispersal in lizards. For
example, sampling sites of both Johansson et al. (2008)
and Ujvari et al. (2008) were within 50 km of each
other. Both were also focused on short-term migra-
tion ⁄ dispersal within one generation. Compared with
direct measurements of dispersal, ‘indirect’ genetic
methods can be applied to small and large spatial and
temporal scales. They are probably more sensitive as
well, because of the benefits of accumulation of differ-
ences between different types of markers over long time
and large distance.
Several microsatellite DNA loci in multiple popula-
tions deviated significantly from HWE, and heterozy-
gote deficiency was detected in all cases (Table 2). The
increased homozygosity is probably a consequence of
the biology of these lizards rather than the presence of
null alleles. First, we screened all microsatellite loci
using Micro-Checker before analysis. All loci with sig-
nificant long allele drop-out or null alleles were
excluded from analysis. Second, we found that the fre-
quency of individuals that failed to amplify for popula-
tions ⁄ loci significantly deviating from HWE is lower
than that of populations ⁄ loci not significantly deviating
from HWE. Higher frequency of the former would sug-
gest the presence of null alleles. Several authors adver-
tised this null allele detecting method under the
assumption that some of the observed homozygotes
were actually heterozygous for the null allele and indi-
viduals that failed to amplify were homozygous for the
null allele (e.g. Magalon et al. 2005). Although the sig-
nificant heterozygote deficiency may violate assump-
tions of some methods, it has unlikely compromised
our overall conclusion as their presence typically
inflates the estimates of FST (Chapuis & Estoup 2007).
In contrast, we find no evidence for such inflation.
Although male-mediated gene flow may sufficiently
explain the minimum amount of structure at the
nuclear loci, one question remains: what evolutionary
forces have been keeping females of P. przewalskii from
crossing the mountain chain for the last 2–5 Myr?
Polygyny and female philopatry may explain part of
the genetic structure in mtDNA, particularly the struc-
ture within clades I and II (Fig. 2), but they may not be
sufficient to explain the separation of the two clades
along the mountain chain. Physical (size) difference
between males and females is unlikely the reason. The
sexual size dimorphism of this species is rather small;
males reach snout to vent length (SVL) of 47–63 mm,
whereas females reach SVL of 42–60 mm. If males are
capable of crossing the mountains, females are likely
capable too. In addition, there is one large gap between
the Yin and Helan Mountains (Fig. 1). Females appear
to have used the corridor to cross the mountain chain;
several populations nearby the corridor (39–42) have
haplotypes from both clades I and II. However, they
have not dispersed far (Fig. 1). Behavioural data on this
species are lacking, and we can only speculate that this
is probably associated with female-specific behaviour,
such as female intrasexual aggression (Jenssen et al.
2000). Females may defend territories against distantly
related females, such as the ones from different, deeply
diverged clades (e.g. clades I and II). Such hypothesis
can be tested in manipulative field studies.
Concluding remarks
mtDNA sequence data revealed a clear vicariant history
of P. przewalskii. However, this pattern has been gradu-
ally erased by male-mediated gene flow for the nuclear
genes. Limited migration maintains a small amount of
population genetic structure, with a weak isolation-by-
distance pattern.
Strong mtDNA structure is common in lizards (e.g.
Clark et al. 1999; Stenson & Thorpe 2003; Jin et al.
2008), although the nuclear gene structure is unknown
in most cases. Male-mediated gene flow is perhaps
much more common than we currently know. Although
polygynous mating systems and female philopatry may
significantly contribute to male-biased dispersal, other
alternative hypotheses should be explored. Studying
sex-biased dispersal in lizards may prove to be a very
fertile ground and more novel hypotheses will probably
be generated.
Acknowledgements
We thank Z. Liu, Y. Zheng, Q. Li and F. Feng for field assis-
tance, and A. Gozdzik and K. Bi for laboratory assistance. T.
Crease, R. Danzmann, D. Noble and K. Bi provided many
valuable comments for this manuscript. This project is sup-
ported by an NSFC (China) grant (NSFC30470252) to YW and
an NSERC (Canada) discovery grant to JF.
References
Baker M, Nur N, Geupel GR (1995) Correcting biased
estimates of dispersal and survival due to limited study
area: theory and an application using wrentits. Condor, 97,
663–674.
� 2009 Blackwell Publishing Ltd
MALE-MED IATED GENE FLOW IN PHRYNOCEPHALUS 3 72 5
Balloux F, Goudet J (2002) Statistical properties of population
differentiation estimators under stepwise mutation in a finite
island model. Molecular Ecology, 11, 771–783.
Berry O, Tocher MD, Sarre SD (2004) Can assignment tests
measure dispersal? Molecular Ecology, 13, 551–561.
Chapuis MP, Estoup A (2007) Microsatellite null alleles and
estimation of population differentiation. Molecular Biology
and Evolution, 24, 621–631.
Clark AM, Bowen BW, Branch LC (1999) Effects of natural
habitat fragmentation on an endemic scrub lizard (Sceloporus
woodi): an historical perspective based on a mitochondrial
DNA gene genealogy. Molecular Ecology, 8, 1093–1104.
Clarke AL, Seather BE, Roskaft E (1997) Sex biases in avian
dispersal: a reappraisal. Oikos, 79, 429–438.
Clobert J, Massot M, Lecomte J, Sorci G, de Fraipont M,
Barbault R (1994) Determinants of dispersal behavior: the
common lizard as a case study. In:Lizard Ecology. Historical
and Experimental Perspective (eds Vitt LJ, Pianka ER). pp. 181–
206, Princeton University Press, Princeton, New Jersey.
Crease TJ, Lynch M, Spitze K (1990) Hierarchical analysis of
population genetic structure in mitochondrial and nuclear
genes in Daphnia pulex. Molecular Biology and Evolution, 7,
444–458.
Devillard S, Allaine D, Gaillard J-M, Pontier D (2004) Does
social complexity lead to sex-biased dispersal in polygynous
mammals? A test on ground-dwelling sciurids. Behavioural
Ecology, 15, 83–87.
Dobson S (1982) Competition for mates and predominant
juvenile dispersal in mammals. Animal Behaviour, 30, 1183–
1192.
Excoffier L, Laval G, Schneider S (2005) ARLEQUIN (version 3.0):
An integrated software package for population genetic data
analysis. Evolutionary Bioinformatics Online, 2005, 47–50.
Goudet J, Perrin N, Waser P (2002) Tests for sex biased
dispersal using bi-parentally inherited genetic markers.
Molecular Ecology, 11, 1103–1114.
Gozdzik A, Fu J (2009) Are toad-headed lizards Phrynocephalus
przewalskii and P. frontalis (family Agamidae) the same
species? Defining species boundaries with morphological
and molecular data. Russian Journal of Herpetology, 16, 107–
118.
Greenwood PJ (1980) Mating systems, philopatry and dispersal
in birds and mammals. Animal Behaviour, 28, 1140–1162.
Hudson RR, Turelli R (2003) Stochasticity overrules the ‘three-
times rule’: Genetic drift, genetic draft, and coalescence
times for nuclear loci versus mitochondrial DNA. Evolution,
57, 182–190.
Jenssen TA, Orrell KS, Lovern MB (2000) Sexual dimorphism
in aggressive signal structure and use by a polygynous
lizard, Anolis carolinensis. Copeia, 2000, 140–149.
Jin YT, Brown RP, Liu NF (2008) Cladogenesis and
phylogeography of the lizard Phrynocephalus vlangalii
(Agamidae) on the Tibetan Plateau. Molecular Ecology, 17,
1971–1982.
Johansson H, Surget-Groba Y, Thorpe RS (2008) Microsatellite
data show evidence for male-biased dispersal in the
Caribbean lizard Anolis roquet. Molecular Ecology, 17, 4425–
4432.
Koenig WD, Van Vuren D, Hooge PN (1996) Detectability,
philopatry and the distribution of dispersal distances in
vertebrates. Trends in Ecology and Evolution, 11, 514–517.
� 2009 Blackwell Publishing Ltd
Liu NF, Li RD, Sun HY (1993) The Effects of Environmental
Factors on Population Density of Phrynocephalus przewalskii.
Zoological Research, 14, 319–325 [in Chinese].
Liu DS, Zhang XS, Yuan BY (1998) The impact of plateau
uplifting on surrounding areas. In: Formation, Evolution and
Development of Qinghai-Xizan (eds Sun HL, Zheng D) pp.
179–227, Guangdong Science and Technology Press,
Guangdong, China [in Chinese].
Macey JR, Schulte II JA, Ananjeva NB et al. (1998) Phylogenetic
relationships among Agamid lizards of the Laudakia caucasia
species group: testing hypotheses of biogeographic
fragmentation and an area cladogram for the Iranian Plateau.
Molecular Phylogenetics and Evolution, 10, 118–31.
Maddison WP, Maddison DR (2003) MACCLADE: Analysis of
Phylogeny and Character Evolution, Sinauer Associates,
Sunderland, Massachusetts.
Magalon H, Adjeroud M, Veuille M (2005) Patterns of genetic
variation do not correlate with geographical distance in the
reef-building coral Pocillopora meandrina in the South Pacific.
Molecular Ecology, 14, 1861–1868.
Meirmans PG (2006) Using the AMOVA framework to
estimate a standardized genetic differentiation measure.
Evolution, 60, 2399–2402.
Meirmans PG (2009) GenoDive version 2.0b14. Computer
software distributed by the author. Available from: http://
www.bentleydrummer.nl/software/software/GenoDive.html
Nylander JAA (2004) MRMODELTEST version 2.1. Computer
program distributed by the author. Uppsala University,
Uppsala.
Olsson M, Gullberg A, Tegelstrom H (1996) Malformed
offspring, sibling matings, and selection against inbreeding
in sand lizards (Lacerta agilis). Journal of Evolutionary Biology,
9, 229–242.
Palumbi SR (1996) Nucleic acids II: The polymerase chain
reaction. In: Molecular Systematics, 2nd edn. (eds Hillis DM,
Moritz C, Mable BK), pp. 205–247. Sinauer Associates,
Sunderland, Massachusetts.
Palumbi SR, Cipriano F, Hare MP (2001) Predicting nuclear
gene coalescence from mitochondrial data: The three-times
rule. Evolution, 55, 859–868.
Perrin N, Mazalov L (2000) Local competition, inbreeding, and
the evolution of sex-biased dispersal. American Naturalist,
135, 116–127.
Pritchard JK, Wen X, Falush D (2007) Structure, version 2.2.
Available from: http://pritch.bsd.uchicago.edu/software.
Prugnolle F, de Meeus T (2002) Inferring sex-biased dispersal
from population genetic tools: a review. Heredity, 88, 161–
165.
Pusey AE (1987) Sex-biased dispersal and inbreeding
avoidance in birds and mammals. Trends in Ecology and
Evolution, 2, 295–299.
Rambaut A, Drummond AJ (2007) TRACER: MCMC Trace
Analysis Package (version 1.4). Computer programs distributed
by the authors. http://tree.bio.ed.ac.uk/software/tracer.
Raymond M, Rousset F (1995) An exact test for population
differentiation. Evolution, 49, 1280–1283.
Raymond M, Rousset F (2003) GENEPOP (Web-Version 3.4)
Population genetics software for exact tests and ecumenicism.
Available from: http://wbiomedcurtineduau/genepop.
Laboratiore de Genetique et Environment, Montpellier,
France.

3726 J . URQUHART, Y . WANG and J . FU
Reilly SM, McBrayer LD, Miles DB (2007) Lizard Ecology, the
Evolutionary Consequences of Foraging Mode, Cambridge
University Press, Cambridge, UK.
Riley SPD, Pollinger JP, Sauvajot RM et al. (2006) A southern
California freeway is a physical and social barrier to gene
flow in carnivores. Molecular Ecology, 15, 1733–1741.
Ronquist F, Huelsenbeck JP (2003) MRBAYES 3: Bayesian
phylogenetic inference under mixed models. Bioinformatics,
19, 1572–1574.
Rousset F (1997) Genetic differentiation and estimation of gene
flow from F-statistics under isolation by distance. Genetics,
145, 1219–1228.
Slatkin M (1995) A measure of population subdivision based
on microsatellite allele frequencies. Genetics, 139, 457–462.
Stenson AG, Thorpe RS (2003) Phylogeny, paraphyly and
ecological adaptation of the colour and pattern in the Anolis
roquet complex on Martinique. Molecular Ecology, 12, 117–132.
Stenson AG, Malhotra A, Thorpe RS (2002) Population
differentiation and nuclear gene flow in the Dominican anole
(Anolis oculatus). Molecular Ecology, 11, 1679–1688.
Swofford DL (2002) PAUP*: Phylogenetic Analysis Using Parsimony
(and Other Methods). Sinauer Associates, Sunderland,
Massachusetts.
Ujvari B, Downton M, Madsen T (2008) Population genetic
structure, gene flow and sex-biased dispersal in frillneck
lizards (Chlamydosaurus kingii). Molceular Ecology, 17, 3557–
3564.
Urquhart JW, Bi K, Gozdzik A, Fu J (2005) Isolation and
characterization of microsatellite DNA loci in the toad-
headed lizards, Phrynocephalus przewalskii complex. Molecular
Ecology Notes, 5, 928–930.
Van Oosterhout C, Hutchinson WF, Wills DPM, Shipley P
(2004) MICRO-CHECKER: Software for identifying and correcting
Appendix I
Sample localities, voucher numbers and haplotype designation of
the University of Guelph (UG) and the Chengdu Institute of Biolog
examination (bold)
Population Locality Latitude Longitude
Phrynocephalus przewalskii
1 W of Abag 43�56.19¢N 114�33.24¢E2 Sonid Zuoqi 43�47.86¢N 113�36.63¢E3 E of Erenhot 43�20.46¢N 112�11.12¢E4 N of Sonid Youqi 43�07.47¢N 112�25.20¢E5 E of Sonid Youqi 42�48.094¢N 112�40.033¢E
6 S of Sonid Youqi 42�05.100¢N 112�09.577¢E7 Wu Lan Hua 41�51.219¢N 111�12.685¢E8 Wei Jing 42�36.609¢N 111�02.695¢E9 Ba Yin Ta La 42�28.070¢N 110�26.501¢
10 S of Bai Ling Miao 41�37.216¢N E110�30.690¢
11 S of Bai Ling Miao 41�31.64¢N 110�32.89¢E
genotyping errors in microsatellite data. Molecular Ecology
Notes, 4, 535–538.
Vitt LJ, Pianka ER (1994) Lizard Ecology. Historical and
Experimental Perspectives. Princeton University Press,
Princeton, New Jersey.
Wang Y, Fu J (2004) Cladogenesis and vicariance patterns in
the toad-headed lizard Phrynocephalus versicolor species
complex. Copeia, 2004, 199–206.
Weir BS, Cockerham CC (1984) Estimating F-statistics for the
analysis of population structure. Evolution, 38, 1358–1370.
Wolff JO (1994) More juvenile dispersal in mammals. Oikos, 71,
349–352.
Xu H, Yang F (1993) Age classification and growth model
of Phrynocephalus przewalskii. Ecological Modelling, 70, 127–
135.
Xu H, Yang F (1995) Simulation model of activity of
Phrynocephalus przewalskii. Ecological Modelling, 77, 197–204.
Zhao J, Zheng G, Wang H, Xu J (1990) The Natural History of
China. William Collins & Sons, London.
Zhao E, Zhao K, Zhu K (1999) Fauna Sinica, Reptilia Vol.2,
Squamata, Lacertilia. Science Press, Beijing, China [in
Chinese].
Zhu K (1984) The Physical Geography of China: Paleogeography,
Science Press, Bejing, China [in Chinese].
J. Urquhart is a vertebrate biologist and is mostly interested
in conservation and education. Y. Wang is a herpetologist
and mainly interested in ecology and biogeography. J. Fu is
a molecular phylogeneticist whose interests include specia-
tion, hybridization and biogeography of amphibians and rep-
tiles.
specimens examined. All voucher specimens are preserved at
y (CIB). Samples in [ ] were subjected to microsatellite DNA
Haplotype assignment and Voucher numbers
Sample
size
H1(CIB-XM01340) H2(CIB-XM01341) 2
H3(CIB-XM01244) 1
H5(CIB-XM01261) H4(CIB-XM01262) 2
H13(CIB-XM01240) 1
H6(UG-37461, UG-37479) H10(UG-37473)
H8(UG-37467, UG-37504) H7(UG-37470)
H5(UG-37462, UG-37464, UG-37476)
H9(UG-37482) micro[UG-37459-82,
UG-37492-509, UG-37513-8]
10 [48]
H5(UG-37523, UG-37538) 2
H11(UG-37555, UG-37560-4) 6
H13(UG-37593, UG-37611) 2
H13(UG-37649, UG-37662) 2
H14(UG-2003, UG-2017) H13(UG-1015-6,
UG-2019-22, UG-2027) H12(UG-2018)
10
H15(CIB-W01308) H16(CIB-W01309)
H17(CIB-XM01242) H159(CIB-XM01246)
4
� 2009 Blackwell Publishing Ltd
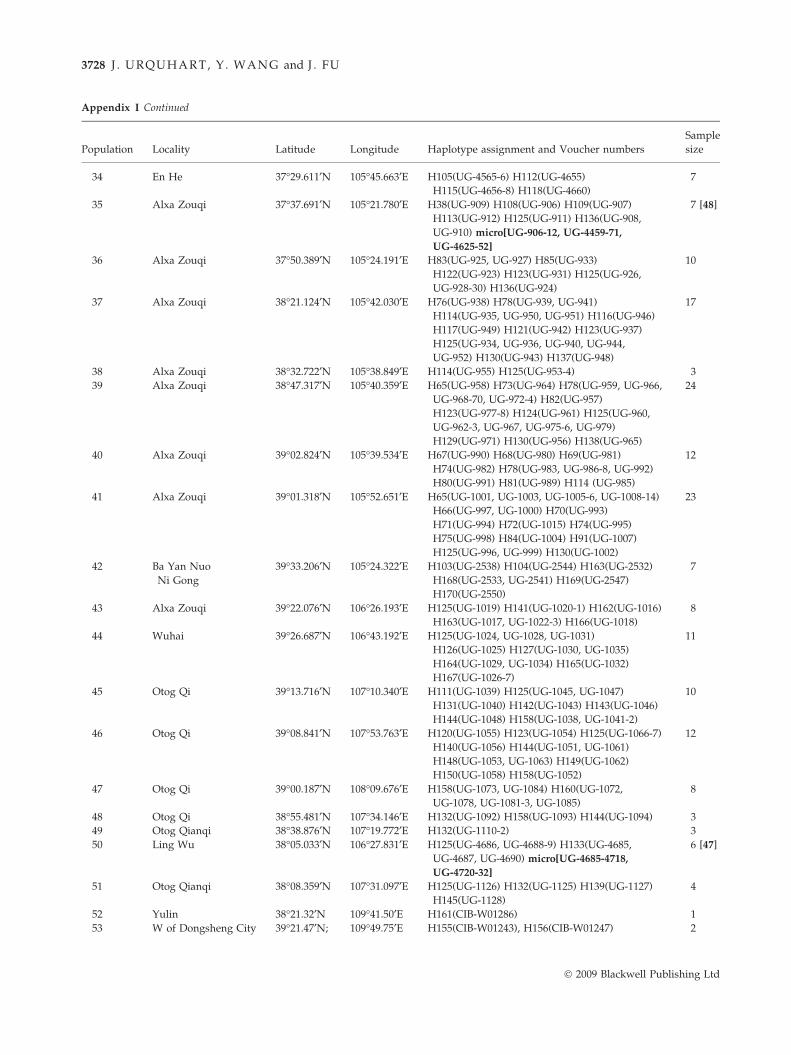
Appendix I Continued
Population Locality Latitude Longitude Haplotype assignment and Voucher numbers
Sample
size
12 Hai Liu Tu 41�21.633¢N 109�06.031¢E H103(UG-2045) H146(UG-2036) H151(UG-2039,
UG-2049, UG-2051) H152(UG-2042, UG-2048)
micro[UG-2035-44, UG-2046-53, UG-2055,
UG-2057-8, UG-2060-75]
7 [37]
13 Chuan Jing 41�52.944¢N 108�10.058¢E H18(UG-2078, UG-2117) H26(UG-2081)
H27(UG-2082-83) H28(UG-2077, UG-2118)
H29(UG-2084)
8
14 Bao Yin Tu 41�44.686¢N 107�04.317¢E H19(UG-2127, UG-2129) H22(UG-2130)
H24(UG-2128)
4
15 Sai Wu Su 41�28.530¢N 106�57.053¢E H20(UG-2169) H21(UG-2170) H23(UG-2168)
H25(UG-2171)
4
16 Tai Yang Miao 40�47.354¢N 106�32.700¢E H157(UG-2193) 1
17 Tu Ke Mu 40�42.567¢N 105�53.678¢E H30(UG-2215) H34(UG-2217-9) 4
18 Wu Li Ji 40�52.515¢N 104�26.242¢E H31(UG-2223) H32(UG-2224, UG-2226)
H34(UG-2225)
4
19 Meng Geng Bu
La Ge
40�00.153¢N 103�49.810¢E H33(UG-2474) H34(UG-2473) 2
20 E Keng Hu Du Ge 39�16.125¢N 101�45.591¢E H35(UG-2424-5, UG-2437) H42(UG-2422)
H43(UG-2440, UG-2443) H44(UG-2428)
H88(UG-2431) micro[UG-2421, UG-2425-55,
UG-2458-65, UG-2467-71]
8 [45]
21 Shang Dan 39�00.217¢N 101�11.805¢E H43(UG-2405) H88(UG-2406) 2
22 Jinchang(Hexibao), 38�41¢N 102�06¢E H42(CIB-W0729) 1
23 Jinchang, 38�23.60¢N 102�05.60¢E H42(CIB-W0239) 1
24 N of Wu Wei 38�06.298¢N 102�42.803¢E H39(UG-839) H40(UG-840) H100(UG-847-8,
UG-853) H41(UG-849, UG-851) H85(UG-852)
H94(UG-850) H92(UG-846)
10
25 Wu Wei 37�53.063¢N 102�56.190¢E H86(UG-863, UG-854) H89(UG-862) H93(UG-857,
UG-860) H95(UG-858-9) H100(UG-856, UG-861,)
H102(UG-855)
10
26 Gu Lang 37�31.115¢N 103�23.597¢E H98(UG-824) H99(UG-825) 2
27 Jing Tai 37�22.446¢N 104�09.934¢E H60(UG-815) H57(UG-816) 2
28 Zhong Wei 37�26.191¢N 104�21.208¢E H56(UG-809-10) 2
29 Gan Tang 37�26.750¢N 104�32.007¢E H58(UG-797, UG-801-2) H59(UG-805)
H62(UG-4506) H63(UG-799) H64(UG-806)
H96(UG-798, UG-803-4) H97(UG-4497)
H101(UG-800) micro[UG-4472-84, UG-4486-97,
UG-4500-09, UG-4511-9]
12 [44]
30 Alxa Zouqi 37�49.609¢N 104�58.150¢E H47(UG-893) H48(UG-897) H49(UG-892)
H50(UG-888-91, UG-904) H51(UG-900)
H52(UG-895) H53(UG-896, UG-899)
H54(UG-902) H55(UG-901) H79(UG-898)
H90(UG-894)
16
31 Zhong Wei 37�35.140¢N 105�01.256¢E H46(UG-881) H47(UG-4576, UG-4582, UG-4585)
H50(UG-887) H63(UG-886, UG-4591)
H77(UG-4588) H90(UG-883-5, UG-4574)
H103(UG-882, UG-4569, UG-4579)
micro[UG-4568-70, UG-4572-98, UG-4600-17]
15 [48]
32 Zhong Wei
(S of
the Yellow R.)
37�27.270¢N 104�59.534¢E H45(UG-869) H58(UG-878) H59(UG-870)
H61(UG-877) H134(UG-868, UG-872, UG-874)
H135(UG-879) H114(UG-866-7) H118(UG-876)
H123(UG-873) H128(UG-875) micro[UG-866-79,
UG-4535-67]
13 [47]
33 E of Zhong Wei 37�30.688¢N 105�27.672¢E H36(UG-790) H37(UG-792) H106(UG-789)
H107(UG-794) H110(UG-791) H112(UG-793,
UG-795, UG-796)
8
MALE-MED IATED GENE FLOW IN PHRYNOCEPHALUS 3 72 7
� 2009 Blackwell Publishing Ltd
Appendix I Continued
Population Locality Latitude Longitude Haplotype assignment and Voucher numbers
Sample
size
34 En He 37�29.611¢N 105�45.663¢E H105(UG-4565-6) H112(UG-4655)
H115(UG-4656-8) H118(UG-4660)
7
35 Alxa Zouqi 37�37.691¢N 105�21.780¢E H38(UG-909) H108(UG-906) H109(UG-907)
H113(UG-912) H125(UG-911) H136(UG-908,
UG-910) micro[UG-906-12, UG-4459-71,
UG-4625-52]
7 [48]
36 Alxa Zouqi 37�50.389¢N 105�24.191¢E H83(UG-925, UG-927) H85(UG-933)
H122(UG-923) H123(UG-931) H125(UG-926,
UG-928-30) H136(UG-924)
10
37 Alxa Zouqi 38�21.124¢N 105�42.030¢E H76(UG-938) H78(UG-939, UG-941)
H114(UG-935, UG-950, UG-951) H116(UG-946)
H117(UG-949) H121(UG-942) H123(UG-937)
H125(UG-934, UG-936, UG-940, UG-944,
UG-952) H130(UG-943) H137(UG-948)
17
38 Alxa Zouqi 38�32.722¢N 105�38.849¢E H114(UG-955) H125(UG-953-4) 3
39 Alxa Zouqi 38�47.317¢N 105�40.359¢E H65(UG-958) H73(UG-964) H78(UG-959, UG-966,
UG-968-70, UG-972-4) H82(UG-957)
H123(UG-977-8) H124(UG-961) H125(UG-960,
UG-962-3, UG-967, UG-975-6, UG-979)
H129(UG-971) H130(UG-956) H138(UG-965)
24
40 Alxa Zouqi 39�02.824¢N 105�39.534¢E H67(UG-990) H68(UG-980) H69(UG-981)
H74(UG-982) H78(UG-983, UG-986-8, UG-992)
H80(UG-991) H81(UG-989) H114 (UG-985)
12
41 Alxa Zouqi 39�01.318¢N 105�52.651¢E H65(UG-1001, UG-1003, UG-1005-6, UG-1008-14)
H66(UG-997, UG-1000) H70(UG-993)
H71(UG-994) H72(UG-1015) H74(UG-995)
H75(UG-998) H84(UG-1004) H91(UG-1007)
H125(UG-996, UG-999) H130(UG-1002)
23
42 Ba Yan Nuo
Ni Gong
39�33.206¢N 105�24.322¢E H103(UG-2538) H104(UG-2544) H163(UG-2532)
H168(UG-2533, UG-2541) H169(UG-2547)
H170(UG-2550)
7
43 Alxa Zouqi 39�22.076¢N 106�26.193¢E H125(UG-1019) H141(UG-1020-1) H162(UG-1016)
H163(UG-1017, UG-1022-3) H166(UG-1018)
8
44 Wuhai 39�26.687¢N 106�43.192¢E H125(UG-1024, UG-1028, UG-1031)
H126(UG-1025) H127(UG-1030, UG-1035)
H164(UG-1029, UG-1034) H165(UG-1032)
H167(UG-1026-7)
11
45 Otog Qi 39�13.716¢N 107�10.340¢E H111(UG-1039) H125(UG-1045, UG-1047)
H131(UG-1040) H142(UG-1043) H143(UG-1046)
H144(UG-1048) H158(UG-1038, UG-1041-2)
10
46 Otog Qi 39�08.841¢N 107�53.763¢E H120(UG-1055) H123(UG-1054) H125(UG-1066-7)
H140(UG-1056) H144(UG-1051, UG-1061)
H148(UG-1053, UG-1063) H149(UG-1062)
H150(UG-1058) H158(UG-1052)
12
47 Otog Qi 39�00.187¢N 108�09.676¢E H158(UG-1073, UG-1084) H160(UG-1072,
UG-1078, UG-1081-3, UG-1085)
8
48 Otog Qi 38�55.481¢N 107�34.146¢E H132(UG-1092) H158(UG-1093) H144(UG-1094) 3
49 Otog Qianqi 38�38.876¢N 107�19.772¢E H132(UG-1110-2) 3
50 Ling Wu 38�05.033¢N 106�27.831¢E H125(UG-4686, UG-4688-9) H133(UG-4685,
UG-4687, UG-4690) micro[UG-4685-4718,
UG-4720-32]
6 [47]
51 Otog Qianqi 38�08.359¢N 107�31.097¢E H125(UG-1126) H132(UG-1125) H139(UG-1127)
H145(UG-1128)
4
52 Yulin 38�21.32¢N 109�41.50¢E H161(CIB-W01286) 1
53 W of Dongsheng City 39�21.47¢N; 109�49.75¢E H155(CIB-W01243), H156(CIB-W01247) 2
3728 J . URQUHART, Y . WANG and J . FU
� 2009 Blackwell Publishing Ltd

Appendix I Continued
Population Locality Latitude Longitude Haplotype assignment and Voucher numbers
Sample
size
54 Hang Jin Qi 39�59.130¢N 108�32.368¢E H145(UG-2590) H147(UG-2589, UG-2592)
H153(UG-2610) H158(UG-2588, UG-2595,
UG-2598, UG-2601, UG-2604, UG-2607)
micro[UG-2588-2635]
10 [48]
55 Ao Bao Liang 39�56.732¢N 110�17.105¢E H154(UG-2645) H158(UG-2642-4) 4
Outgroup
Phrynocephalus sp.
Jiayuguan, Gansu 39�42¢N 98�11¢E CIB-W0984 1
Xingxingxia, Gansu 41�37.19¢N 95�14.31¢E UG-JF1415 1
Phrynocephalus versicolor
Ejin Qi, Inner Mongolia 41�58¢N 101�06¢E CIB-W1082 1
Hami, Xinjiang 43�04.19¢N 93�34.93¢E CIB-W01450 1
Phrynocephalus guttatus
Kuytun, Xinjiang 44�24.96¢N 84�47.12¢E CIB-W0887 1
Burqin, Xinjiang 47�18.70¢N 86�46.11¢E UG-JF1294 1
MALE-MED IATED GENE FLOW IN PHRYNOCEPHALUS 3 72 9
� 2009 Blackwell Publishing Ltd