historical contingencies in the ecology and evolution of
TRANSCRIPT
Historical Contingencies in the Ecology and Evolution of
Species Diversity
by
Rachel M. Germain
A thesis submitted in conformity with the requirements
for the degree of Doctor of Philosophy
Department of Ecology and Evolutionary Biology
University of Toronto
© Copyright by Rachel M. Germain 2016

ii
Historical contingencies in the ecology and evolution of species
diversity
Rachel M. Germain
Doctor of Philosophy
Department of Ecology and Evolutionary Biology
University of Toronto
2016
Abstract
Ecologists have long-sought to explain the high diversity of species in biological communities,
given that classic theory predicts that diversity is limited by available niche space. In recent
years, ecologists have looked towards ‘historical contingencies’, the persistent effects of past
ecological and evolutionary processes, as possible mechanisms that maintain diverse
communities, either by relaxing the constraints of niche availability or by adding temporal
dimensions to species’ niches. In this thesis, I use field and greenhouse experiments to explore
three ways in which historical contingencies manifest in annual plant communities. First, my
work on maternal effects shows that abiotic (ch. 2) and biotic (ch.3) conditions in the maternal
generation have diverse effects on offspring phenotypes across an assemblage of species.
Because species differences in environmental responses can facilitate coexistence, these studies
suggest that maternal effects could act as a form of niche differentiation, and motivate future
research to clarify their influences on coexistence outcomes. Second, I performed, to my
knowledge, the first experimental decoupling of dispersal limitation and environmental sorting in

iii
a natural landscape by manipulating entire seed pools of annual plants (ch. 4). In doing so, I was
able to identify the pervasive and scale-specific influences of dispersal limitation that constrain
species distributions in plant communities. Lastly, I used competitive trials to identify
macroevolutionary divergence in competitive interactions among species (ch. 5), and found
evidence that divergence is contingent on historical competitive interactions in ways that are
consistent with character displacement. In sum, my dissertation work has expanded our
understanding of (i) the number of potential niche dimensions that might allow species to
differentiate, (ii) how this differentiation can arise over evolutionary time, and (iii) the interplay
of current and historical conditions in the maintenance of species diversity, and the timescales
over which they play out.

iv
Acknowledgments
I have a long list of friends and colleagues to thank who have helped me complete my PhD and
keep my sanity in the process.
First and foremost, I am indebted to my advisor Benjamin Gilbert. It is rare to find an advisor
who is the combination of a brilliant mentor, an enthusiast of Ben Stiller movies c. 2000, and
willing to shovel (and re-shovel)10 tonnes of soil off of a university driveway when his student
makes poor life choices. Choosing a PhD advisor is one of the most important and most difficult
decisions that a young scientist can make, and I truly believe that working with Ben was one of
the best decisions I have made for myself. He has forever altered the way that I think as a
scientist and my perspective of academia, and it has been exciting to watch his lab develop and
successes accumulate over the past five years.
I will deeply miss my talented lab family: Natalie Jones, Tess Grainger, Denon Start, and Kelly
Carscadden. Natalie is the sister I never had; she has sat ~4ft from me at all times during the last
five years, and I am glad to have shared many of life’s big moments with her. Her successes have
led her to more xeric pastures living the dream at UC San Diego. Tess has taught me a lot about
life and how to live it (buying eggs on a Tuesday); I am going to miss our amped up science
discussions and mutual desire to derail book clubs. Denon is someone that I am both inspired and
annoyed by, but I will admit that that his projects are pretty rad (he’s too young to know what
that means). Kelly is pun-master extraordinaire; I admire her attention to detail, command of the
literature, and quirky sense of humor. Each of these folks will go on to do amazing things in life,
and I look forward to being their colleague in the future.
In addition to the members of my lab, I have made a number of great friends who have offered
comradery, advice, feedback, support, and commiseration in different ways throughout my time
here. This includes, in no particular order, Alex DeSerrano, Adam Cembrowski, Franus Hauser,
Jenn Coughlan, Rebecca Batstone, David "Jello" Timerman, Michael Foisy ♥, Mitch Daniel,
Luke Rogers, Thomson-lab Paul, Kyle Turner, Stephen DeLisle, not Luke Frishkoff (I haven’t
known him long enough), and many others. A special shout out to Alex DeSerrano, who I first
met in 2011 while admiring her use of fish cartoons as a font on a research poster. Grad school is
full of ups and downs but it is great friends and fun that keep things moving.

v
The Department of Ecology & Evolutionary Biology at the University of Toronto is truly
exceptional, and I am glad to have had the opportunity to carry out my graduate work here. I am
grateful for the time and insight of past and present members of my thesis committee, Jason
Weir, John Stinchcombe, and Marc Cadotte. Helen Rodd, Don Jackson, and Locke Rowe are
champions in the improvement of graduate student life in their positions within EEB and SGS. I
also thank my office neighbor and close friend of Ke$ha, Donald L. Mahler, for his tolerance and
for including me in his lab meetings. There are many more faculty and graduate students to thank
who have contributed to my intellectual and interpersonal development.
There are a number of folks at UC Davis and the University of Toronto who have helped me in
the field, laboratory, greenhouse, or administratively. From my time in California, I thank Sharon
Strauss and Susan Harrison for introducing me to a new study system, as well as their lab
members for project feedback and plant identification. At the University of Toronto, I have been
helped by Kitty Lam, Bruce Hall, Andrew Petrie, Bill Cole, Jim Dix, Jill Wheeler, Jenn English.
There is also a small army of undergraduate assistants to thank, most notably Chris Blackford,
Alanna Leale, Abdul Yossof, Yvonne Chan, and Alicia Chou.
I am grateful for my early mentors at the University of Guelph’s Department of Integrative
Biology, Andrew MacDougall, Chris Caruso, Hafiz Maherali, and Mark Sherrard, for their
dedication to undergraduate research training. I am particularly thankful to Chris and Hafiz, who
welcomed me into their labs despite my lackluster grades and helped me develop the skills to be
successful in graduate school, and to Andrew MacDougall, whose laidback enthusiasm for
community ecology and field research compelled me to pursue it in graduate school. I would not
be where I am today without having worked under their guidance at a critical juncture in life.
Last but not least, I could not have completed this work without the support of my mum and
brother, Marie Germain and Adam Germain, as well as my partner, Alex Kushnir. Alex has put
up with me through late nights, bad moods, weekends in the greenhouse, “insufficient funds”,
long fieldwork absences, etc. As someone outside of academia, his perspective of how bizarre
the day-to-day of ecology and graduate school is (“daycare for adults”) reminds me not to take
myself too seriously and to enjoy the ride. It has been fun exploring Toronto together, and I look
forward to new adventures on the west coast with our three cats, who are to blame for any
typographical errors in this thesis.

vi
This research was funded by NSERC, Sigma Xi, the Botanical Society of America, and
fellowships provided by the University of Toronto and the Department of Ecology and
Evolutionary Biology.
vii
Table of Contents
Acknowledgments........................................................................................................................... ii
Table of Contents .......................................................................................................................... vii
List of Figures ..................................................................................................................................x
List of Appendices ....................................................................................................................... xiv
Chapter 1 General Introduction .......................................................................................................1
Conceptual background ...............................................................................................................1
Thesis overview ..........................................................................................................................3
Maternal effects of past environments .................................................................................4
Dispersal histories in a metacommunity ..............................................................................5
Historical interactions and macroevolution .........................................................................6
Synthesis of research objectives ..........................................................................................7
Literature cited ............................................................................................................................8
Chapter 2 Hidden responses to environmental variation: maternal effects reveal species niche
dimensions ................................................................................................................................13
Abstract .....................................................................................................................................13
Introduction ...............................................................................................................................13
Materials and methods ..............................................................................................................16
Study system ......................................................................................................................16
Maternal generation ...........................................................................................................17
Offspring generation ..........................................................................................................18
Phylogenetic tree construction ...........................................................................................19
Data analysis ......................................................................................................................19
Results .......................................................................................................................................21
Seed size, seed number, and their correlation ....................................................................21
Offspring performance .......................................................................................................24

viii
Discussion .................................................................................................................................25
Acknowledgements ...................................................................................................................29
Literature cited ..........................................................................................................................29
Chapter 3 Frequency-dependent maternal effects across species and environments ....................33
Abstract .....................................................................................................................................33
Introduction ...............................................................................................................................34
Methods .....................................................................................................................................37
Study species ......................................................................................................................37
Greenhouse experiment .....................................................................................................38
Statistical analyses .............................................................................................................38
Results .......................................................................................................................................40
Discussion .................................................................................................................................44
Conclusion ................................................................................................................................47
Acknowledgements ...................................................................................................................47
Literature cited ..........................................................................................................................47
Chapter 4 Pervasive dispersal limitation reduces diversity in an annual plant community ...........52
Abstract .....................................................................................................................................52
Introduction ...............................................................................................................................52
Materials and methods ..............................................................................................................56
Study system ......................................................................................................................56
Experimental setup.............................................................................................................57
Data analysis ......................................................................................................................58
Results .......................................................................................................................................61
Discussion .................................................................................................................................65
Acknowledgements ...................................................................................................................68
Literature cited ..........................................................................................................................69

ix
Chapter 5 Species coexistence: macroevolutionary relationships and the contingency of
historical interactions ................................................................................................................72
Abstract .....................................................................................................................................72
Introduction ...............................................................................................................................72
Materials and methods ..............................................................................................................74
Species selection ................................................................................................................74
Greenhouse growing conditions ........................................................................................75
Experimental design...........................................................................................................76
Solving for stabilizing differences, fitness differences, and coexistence outcomes ..........78
Statistical analyses .............................................................................................................79
Results and discussion ..............................................................................................................79
Data accessibility ......................................................................................................................86
Authors’ contributions ..............................................................................................................86
Funding statement .....................................................................................................................86
Acknowledgements ...................................................................................................................87
Literature cited ..........................................................................................................................87
Chapter 6 General Conclusions .....................................................................................................91
Maternal effects of past environments ...............................................................................91
Dispersal histories in a metacommunity ............................................................................92
Historical interactions and macroevolution .......................................................................93
Concluding remarks ..................................................................................................................94
Literature cited ..........................................................................................................................95
Copyright Acknowledgements.....................................................................................................125

x
List of Figures
Figure 1.1. Schematic positioning my thesis chapters by the timescales that historical
contingencies play out, and their impacts on local or regional diversity. The shaded regions
outline the breadth of each chapter. ................................................................................................ 3
Figure 2.1. Effect sizes of (A) seed size, (B) seed number, and (C) seed dormancy responses to
our watering treatments across a phylogeny of 29 species; see Table S1 for species codes. Effect
sizes were calculated using Cohen’s d (i.e., (µdry - µwet)/pooled σ; Hartung et al. 2011). Positive
effect sizes indicate that trait values were higher in the dry compared to wet environment, and
vice versa. The numbers on the phylogeny correspond to taxonomic orders: (1) Poales, (2)
Ranunculales, (3) Fabales, (4) Caryophyllales, (5) Boraginales, (6) Lamiales, and (7) Asterales.
Dashed branches represent unknown relationships due to missing sequence data [SCOLU and
SVIRI], and ‘×’ indicates unavailable trait data rather than a true zero. * P < 0.05, º P < 0.10. .. 22
Figure 2.2. Seed size-seed number correlations. (A) Correlation among species, with values
representing the species-level means with a best-fit line indicating a significant correlation (R2 =
0.45, P < 0.001). (B) Correlations within species; seed size and seed number were standardized
by species and a constant added to visualize the correlation coefficients for each species. Black
and dark grey lines represent significant (P < 0.05) and marginally significant (P < 0.10)
correlations, respectively; light grey lines are non-significant. The dashed line represents no
correlation (r = 0). All data were log transformed (A) prior to standardization (B)..................... 24
Figure 3.1. Cross-species comparison of frequency-dependent (a) maternal provisioning of seed
size and (b) seed number responses. Points are slope coefficients (± 2 × standard error) of species
responses to the frequency of conspecific competitors, and are shaded black, gray, or white to
indicate significant (P < 0.05), marginally-significant (P < 0.10), or non-significant (P > 0.10)
slopes, respectively. In most cases, frequency × soil moisture interactions are non-significant,
and slopes are averaged across soil moisture environments; when significant, wet (upwards
triangle) and dry (downwards triangle) environments are plotted separately. Competitive pairs
are delineated by lines connecting species codes; see Table S3.1 for species codes. ................... 41

xi
Figure 3.2. Correlations of (a) seed size and seed number responses to conspecific frequency (n
= 60 [15 pairs × two species × two soil moisture environments]), and (b) seed size responses to
soil moisture conditions in the presence and absence of competition (n = 25). Each point is a
species, and points that fall in the grey zones are species with opposing directions of responses.
....................................................................................................................................................... 42
Figure 3.3. Variation in the strength of frequency-dependent maternal provisioning of seed size
explained by the phylogenetic distance between competitors, depending on whether they are
native to the same biogeographic region (a,c) or different regions (b,d). The red dashed line
indicates the cut-off between negative and positive frequency dependence, grey dashed lines
delineate pairs of species that were competed, and solid lines denote significant relationships.
Black symbols and lines are species native to California, whereas gray symbols and lines are
species native to Spain. ................................................................................................................. 43
Figure 4.2. Effect of spatial scale of seed pooling on (a) species richness (mean ± se) and (b) the
strength of species-environment relationships (R2 values); observed patterns correspond to
prediction in Fig. 4.1a. Points with the same letter were not significantly different in a multiple
comparisons test. ........................................................................................................................... 61
Figure 4.3. Effect of spatial scale of seed pooling on (a) species composition and (b) the
compositional dissimilarity of plots (β-diversity). Species composition is from the first axis
scores from a PCoA with Jaccard’s dissimilarity index (see biplot in Fig. S4.4a); results with
second axis scores are qualitatively similar. Points with the same letter were not significantly
different in a multiple comparisons test. ....................................................................................... 63
Figure 4.4. Frequency distribution of site occupancies of all species (gray bars) and species that
were significantly associated with the environment (black bars). The red line is the fitted
relationship between the proportion of species with significant species-environment relationships
and site occupancy; this relationship is a significantly hump-shaped (P = 0.008). Note that the x-
axis is on a log-scale. .................................................................................................................... 63
Figure 4.5. Natural differences among halves of the reserve in (a) environmental conditions
(from a PCA) and (b) species composition (from a PCoA). The contours outline the bivariate
normal distributions of each half of the reserve; dashed contours/upwards triangles are sites that

xii
occur in the north half, solid contours/downwards triangles are sites that occur in the south half.
Environmental conditions (P = 0.001) but not species (P = 0.175) differed significantly between
halves (see Results). ...................................................................................................................... 64
Figure 5.1. Biogeographic history alters the evolutionary trajectory of stabilizing and fitness
differences. (a) Stabilizing differences rapidly increase among sympatric species pairs (light
shade), whereas allopatric species pairs (dark shade) show no relationship. (b) Fitness
differences, by contrast, increase over evolutionary time in both sympatric and allopatric pairs,
but are larger on average among allopatric pairs. Stabilizing differences have a maximum of one
(Eq. S5.1; lines are fitted from the logit-transformed data), whereas fitness differences have no
upper limit (Eq. S5.2). Because soil moisture had no effect on stabilizing or fitness differences,
each point is a fitted average across soil moisture environments for each species pair. .............. 80
Figure 5.2. Fitness differences arise through alternate mechanisms in sympatric and allopatric
species pairs. In log-space, fitness differences (solid line) are the sum of competitive (dashed
line) and demographic (dotted line) components (see Materials and methods), shown here as
fitted relationships. (a) In sympatric species pairs, fitness differences are minimal relative to
allopatric species pairs, and appear to accumulate over macroevolutionary time primarily through
differences in demographic rates. (b) In allopatric species pairs, the more rapid increase in fitness
differences over evolutionary time is driven solely by divergence in competitive ability, as the
apparent divergence in demographic rates is non-significant. Values in the shaded area indicate
that the species with the highest fitness had the lowest fitness component. ................................. 82
Figure 5.3. The effect of evolutionary history on coexistence outcomes depends on
biogeographic history. Species coexistence is not influenced by the phylogenetic distances of
species pairs that occur in sympatry (light shade, slope not significantly different from zero), but
the probability of coexistence decreases with the phylogenetic distance of allopatric pairs (dark
shade). Species pairs were grown in wet (squares) and dry (triangles) environments, but soil
moisture does not alter the effect of evolutionary history on coexistence (fitted lines are averaged
across environments). The dashed line indicates the threshold between coexistence (positive
values) and competitive exclusion (negative values); the coexistence metric is given by Eq. 5.2 in
Materials and methods. Points connected by a solid line represent cases in which a species pair

xiii
was predicted to coexist in one but not both environments (3 of 10 sympatric pairs, 0 of 10
allopatric pairs). ............................................................................................................................ 83

xiv
List of Appendices
Appendix A: Supplementary Information to Chapter 2 .................................................................97
Supplementary tables and figures .............................................................................................97
Appendix B: Supplementary Information to Chapter 3 ...............................................................102
Species Selection .....................................................................................................................102
Greenhouse Experiment ..........................................................................................................102
Statistical Analyses .................................................................................................................103
Supplementary tables and figures ...........................................................................................104
Appendix C: Supplementary Information to Chapter 4 ...............................................................109
Supplementary tables and figures ...........................................................................................109
Appendix D: Supplementary Information to Chapter 5 ...............................................................115
Phylogenetic tree construction ................................................................................................115
Details of lambda estimation ...................................................................................................116
Supplementary equations ........................................................................................................116
Supplementary tables and figures ...........................................................................................117

CHAPTER 1: GENERAL INTRODUCTION
1
Chapter 1
General Introduction
Conceptual background
The ecological niche entered our lexicon over a century ago, first by Johnson (1910) and by
Grinnell (1917) and Elton (1926) not soon after, to describe the relationship between species and
their environments. Initially, a species’ niche quite literally referred to its place or role in an
ecological community, defined by a particular habitat-type or essential resource; for example,
vultures would occupy the desert-dwelling carrion-eating niche. This initial definition has
undergone several major conceptual revisions, first by Hutchinson (1957) who regarded the
niche as a property of a population or species, rather than a property of a particular environment
(Colwell & Rangel 2009), and later by MacArthur, Levins (1967), and others (Chase & Leibold
2003) to include the positioning of species along multiple resource, predation, and environmental
axes. These classic ideas set the conceptual foundation upon which modern ecology is built, and
have since been expanded to inform predictions of species coexistence (Adler et al. 2007) and
the maintenance of diverse species assemblages (Tilman & Pacala 1993).
An enduring preoccupation of modern ecologists has been to develop an explicit understanding
of how differences among species manifest in ways that maintain biological diversity. Central to
this preoccupation is idea that no two species can occupy the same niche space and stably coexist
through time; some minimum amount of ecological difference must exist to prevent competitive
exclusion (Gause 1932; MacArthur & Levins 1967). For example, Hutchinson (1959) noted that
the gape or body sizes of co-occurring species tended to differ by a ratio of at least 1.3:1 in a
number of taxa, including birds and mammals. Although the practicality of testing this theory has
been met with intense criticism (e.g., Simberloff & Boecklen 1981), more fundamentally, its
conceptual basis has since been revised and expanded in ways that have redefined the field of
ecology.
The most recent revision stems from theoretical work by Chesson (2000) as synthesized in the
highly cited article by Adler et al. (2007), which posits that species’ differences in resource use
can either promote or preclude local coexistence. Stabilizing differences are competitive

CHAPTER 1: GENERAL INTRODUCTION
2
differences that promote coexistence, and represent the degree to which population growth rates
are reduced by intraspecific vs. interspecific competition; these differences are analogous to
those discussed by Gause (1932) and Hutchinson (1959). By contrast, fitness differences are
competitive difference that preclude coexistence, and arise when differences in overall
competitive ability lead to the exclusion of inferior competitors by dominant species. This new
framework has been impactful because it has allowed ecologists to better predict coexistence
outcomes based on the combined effects of stabilizing and fitness differences (Levine &
HilleRisLambers 2009), and has since been invoked to explain a diversity of ecological
phenomena, including ecosystem functioning (Carroll et al. 2011), species invasions
(MacDougall et al. 2009; Godoy & Levine 2013), and community phylogenetics (Mayfield &
Levine 2010).
A challenge to understanding the determinants of species coexistence and diversity has been
expanding predictions beyond outcomes at “local” scales – the scales at which individuals
interact – to diverse assemblages of species that exist across regional landscapes. Although many
approaches have been proposed to broaden theory to larger spatial scales (e.g., Caley & Schluter
1997; Kneital & Chase 2004; Rajaniemi et al. 2004), Leibold et al. (2004) offered a necessary
synthesis of ideas with the formalization of the metacommunity concept. A metacommunity is
defined as a regional network of local communities linked by the dispersal of multiple interacting
species. Local diversity in a metacommunity is not solely a product of local conditions, but
rather, feedbacks among processes that occur at local and regional scales, and can generate a
suite of potential dynamics and patterns (Pulliam 2000). For example, in heterogenous systems
with high dispersal rates, populations of species frequently persist in localities of low suitability,
causing increases in local diversity that homogenize differences among localities (Mouquet &
Loreau 2003). Leibold et al.’s (2004) framework has strongly influenced the field of ecology for
the last decade with the recognition that most communities likely exist as part of a larger regional
metacommunity.
In addition to spatial context, ecologists have moved towards a more explicit understanding of
temporal processes over multiple timescales (e.g., Hudson & Catadorri 1994), and the ways in
which spatial and temporal processes are or are not analogous (Wolkovich et al. 2014). One
phenomenon that is uniquely temporal in nature is the presence of historical contingencies, or

CHAPTER 1: GENERAL INTRODUCTION
3
‘ghosts of the past’, that have effects on diversity patterns that persist long after their ecological
drivers have ceased to operate. For example, plant diversity in an experimental grassland was
27% higher in plots that were exposed to seed predators three years earlier, compared to plots
that had never been exposed to seed predators (Howe & Brown 2001). Many other examples of
historical contingencies exist – “ghosts of x past” appears in the titles of 53 ecological
publications (Web of Science 2016), where x includes competition, predation, environments,
land use, dispersal, evolution, and others (e.g., Knicks et al. 2000; Howe et al. 2001). Persistence
of such ecological ghosts can occur because reverting back to the initial state is difficult or
impossible (e.g., evolutionary change [Klingenberg & Gidaszewski 2009]), because recovery is
slow relative to the ecological dynamics of a system, or because ghosts reappear frequently
enough that ecosystems are continually influenced by the interplay of current and historical
conditions. When present but not accounted for, historical contingencies contribute to the
unexplained variation of a biological system, and have potential to obscure important
relationships among ecological processes of the past and present.
Thesis overview
My thesis explores three manifestations of historical contingencies that alter our understanding
of the niche, and play out over distinct spatial and temporal scales (Fig. 1.1), including past
environments through maternal effects (chs. 2 and 3), dispersal histories as affected by spatial
constraints (ch. 4), and competitive interactions on macroevolutionary timescales (ch. 5). As I
will discuss, each project draws either conceptual or empirical links among disparate subfields in
the biodiversity sciences, and together serve to deepen our understanding of the forces that affect
species coexistence and the maintenance of diversity.
Figure 1.1. Schematic positioning my thesis chapters by the timescales at which historical
contingencies play out, and their impacts on local or regional diversity. The shaded regions
outline the breadth of each chapter.
CHAPTER 1: GENERAL INTRODUCTION
4
Maternal effects of past environments
In chapters 2 and 3, I explore how the biotic and abiotic environments experienced by the
previous generation alter the phenotypes of offspring (aka maternal effects) in an ecological
assemblage of species. Because many phenotypes are tied to fitness, maternal effects have been
shown to interact with the offspring environment to determine offspring fitness in a diversity of
organisms (Herman & Sultan 2011). For example, Daphnia cuculatta produces offspring with
anti-predator structures, such as helmets and neck spines, when exposed to predators in the
maternal generation (Agrawal et al. 1999); this type of maternal effect can greatly increase
offspring survival, but only if predators are also present in the offspring environment. Without
knowing the history of the maternal environment, the factors that affect distributions of
phenotypes and fitnesses of individuals in populations of species that exhibit maternal effects
would be poorly understood.
Maternal effects have been intensively studied for five decades, almost always from an
evolutionary standpoint using genetically-controlled studies of individual species (e.g., Galloway
& Etterson 2007; see reviews by Roach & Wulff 1987 and Mousseau & Fox 1998)—yet their
prevalence across species and possible ecological consequences are largely unexplored. As one
anonymous reviewer of chapter 3 stated, “the study of maternal effects is an inherently
evolutionary question”, implying it is inappropriate or uninteresting to test their effects on
populations or communities. Yet, in the few ecological studies that exist, maternal effects have
been shown to have large effects on population persistence and the outcome of competition (e.g.,
Metz et al. 2015; Van Allen & Rudolf 2015). The importance of maternal effects for
evolutionary processes, and their apparent influence on ecological processes, suggest that
maternal effects should be considered more broadly in population and community studies.
There are many ways in which maternal effects might impact the ecological dynamics of
populations and communities. As discussed earlier, differences among species in resource use or
environmental responses are required for coexistence. Studies of different species have revealed
different types of maternal effects in response to similar sets of maternal and offspring
environments (e.g., Sultan et al. 2006), and raise the possibility that maternal effects are an
additional axis along which species can differentiate. Indeed, preliminary modeling work points
CHAPTER 1: GENERAL INTRODUCTION
5
towards species-specific differences in maternal effects as a potential mechanism of species
coexistence, even in the absence of any other form of ecological differentiation (Germain et al.
in progress). Other ecological consequences include modifications to species’ realized and
fundamental niches (Sultan et al. 2006), the ability of individuals to disperse (Larios & Venable
2014) and establish (Van Allen & Rudolf 2013) across regional landscapes, and population
fluctuations over time (Ginzburg & Taneyhill 1994). However, more multi-species, ecologically-
motivated tests of maternal effects are needed to explore the full extent of their importance.
Dispersal histories in a metacommunity
In chapter 4, I experimentally disentangle the roles of species differences in environmental niche
use, environmental heterogeneity, and dispersal limitation in a natural metacommunity using a
novel method. These three processes, depending on their relative strengths, underlie a suite of
metacommunity paradigms that regulate the spatial distributions of species across landscapes
(Pulliam 2000; Leibold et al. 2004). More importantly, these processes form the basis of much
larger debates in ecology, on whether species distributions are more strongly constrained by
environments or dispersal (Cottenie 2005), and if the latter, the degree to which dispersal
constraints allow the persistence of functionally-equivalent “neutral” species (Chave 2004). A
strong role for dispersal limitation implies that diversity patterns are more contingent on chance
and dispersal histories than associations with the underlying environment (Hurtt & Pacala 1994),
or that species-environment relationships can only be viewed within the context of habitat
isolation (Tuomisto et al. 2003; Gilbert & Lechwicz 2004); how the findings of small-scale
ecological experiments can be extended to regional communities is less clear in this scenario.
Although ecologists have come closer to providing closure to these debates, definitive answers
have been hindered by the lack of appropriate methods to compare the relative strengths of
regional processes in natural communities. Existing methods use either statistical partitioning of
observational data (Cottenie 2005) or experiments that use simplified species pools (e.g., Tilman
1997; Germain et al. 2013) or environments (e.g., Low-Décarie et al. 2015). However,
observational data is collected from communities that are already the product of simultaneously
operating processes, and mesocosm experiments lack the biological realism of natural species
pools and environments (Grainger & Gilbert 2016). Finding methods that can experimentally

CHAPTER 1: GENERAL INTRODUCTION
6
differentiate among environmental and dispersal constraints, while making use of natural
variation in species pools and environments across landscapes, would provide novel insight into
biodiversity`s spatial underpinnings.
Historical interactions and macroevolution
In chapter 5, I explore contingencies of evolutionary and biogeographic histories on the intensity
of competitive interactions among species. As with many ideas in evolutionary biology, Charles
Darwin was the first to recognize that a relationship might exist between the ecology and
evolution of species (Darwin 1859). Because species of the same genus tend to possess similar
traits, Darwin predicted that competition would be most intense between closely related species.
Some of the earliest evidence supporting this prediction came almost a century after The Origin
of Species was first published, with the discovery that fewer species per genus are represented
locally than are regionally available (Elton 1946). Although the generality of such patterns and
the processes that generate them have been revisited many times over the last 60 years (Harper et
al. 1961), they remain two of the major unanswered questions in ecology.
The prevailing framework for the relationship between evolutionary history and ecological
interactions in the last decade was developed by Webb et al. (2002), who posited that community
phylogenetic patterns could be used to make inferences about the ecological processes
underlying their formation, such as competition or environmental filtering. Webb et al. (2002)’s
seminal paper resulted in a surge of publications featuring community phylogenetic patterns, as
ecologists jumped onto what is now termed the ‘phylogenetic bandwagon’ (Fox 2012). In fact,
~60% of manuscript submissions to the American Naturalist from 2010-2012 featured analyses
of phylogenetic dispersion patterns (J. Losos, pers. comm.). However, evidence quickly began to
amass that these patterns were often weak to non-existent (Silvertown et al. 2007; Cahill et al.
2008; Vamosi et al. 2009; Anderson et al. 2011), or were opposite to those predicted by Webb et
al. (2002) in cases where the ecological processes were known (Cavender-Bares et al. 2006).
Together, these findings have led many ecologists to question the utility of phylogenetic patterns
in understanding broad-scale ecological processes (e.g., Weiher et al. 2011).
A major criticism of Webb et al.’s (2002) framework is based on recent developments in species
coexistence theory (Adler et al. 2007; sensu Chesson 2000), which posits that competition alone

CHAPTER 1: GENERAL INTRODUCTION
7
can favour coexistence between species that are closely or distantly related; the community
phylogenetics framework proposed by Webb et al. (2002) is only valid if stabilizing differences
that promote coexistence evolve faster than fitness differences that preclude coexistence
(Mayfield & Levine 2010). Not only was it not known how stabilizing and fitness differences
evolve until very recently (Narwani et al. 2013; Godoy et al. 2014), but there are also a number
of reasons to expect their evolution to differ among competitors of contrasting biogeographic
histories (sympatry vs. allopatry). The idea that evolution would differ among sympatric and
allopatric competitors (Mooney & Cleland 2001) is well-supported in invasion biology (e.g.,
Diez et al. 2008; Strauss et al. 2006), but has yet to be tested in terms of phylogenetic
community assembly and the mechanisms of species coexistence (MacDougall et al. 2009). Such
tests would provide much needed resolution to the field of community phylogenetics, and more
broadly, how historical interactions have modified the macroevolutionary trajectories of
competitive differences among species.
Synthesis of research objectives
My thesis describes four experiments on annual plant communities that take place in the
greenhouse or field, each linked by the common goal of understanding the mechanisms that
maintain species diversity. Though each experiment addresses this goal from a different
perspective, their common themes are rooted in the history of ecological research, including the
roles of species differences, environmental heterogeneity, spatial context, and historical
contingencies that manifest on ecological and evolutionary timescales. In chapters 2 and 3, I test
the prevalence of maternal effects on offspring phenotypes (i.e., seed size, seed dormancy,
seedling performance) in an assemblage of species, and similarities and dissimilarities among
maternal effects in response abiotic and biotic conditions. Chapter 4 was conducted in a natural
plant metacommunity in Northern California, where I used field manipulations to test how
strongly species distributions are constrained by dispersal limitation, the spatial scales at which
dispersal limitation manifests, and whether the experimental removal of dispersal limitation
allows species to sort along environmental gradients. In chapter 5, I used plant competition
experiments to parameterize annual plant models and estimate how competitive differences
structure species coexistence. I then tested the macroevolutionary trajectories of stabilizing
differences, fitness difference, and coexistence outcomes, and determined how these trajectories

CHAPTER 1: GENERAL INTRODUCTION
8
are modified by the biogeographic histories of competing species. Chapter 6 provides a
conceptual synthesis of the themes of my four data chapters, the implications of their findings,
and directions for future study.
The chapters of my dissertation are presented as stand-alone research papers. As a result, there is
some repetition among chapters in the Introduction, Methods, and Literature cited sections.
Chapters 2 and 5 are published and included with permission from their publishers; Chapter 3 is
currently in review at the American Naturalist, and Chapter 4 is in preparation for submission to
Proceedings of the National Academy of Sciences. The manuscripts that stem from my thesis
chapters were completed in collaboration with Benjamin Gilbert (chs. 2-5), Natalie Jones (ch. 3),
Tess Grainger (ch. 3), Sharon Strauss (ch. 4), and Jason Weir (ch. 5). In all cases, I have fulfilled
the responsibilities required of a primary author, and my co-authors have each contributed
invaluable feedback and assistance at different stages of each project’s completion.
Literature cited
Adler, P.B., HilleRisLambers, J. & Levine, J.M. (2007) A niche for neutrality. Ecology Letters,
10, 95–104.
Agrawal, A.A., Laforsch, C. & Tollrian, R. (1999) Transgenerational induction of defenses in
animals and plants. Nature, 401, 60-63.
Anderson, T.M., Shaw, J. & Olff, H. (2011) Ecology’s cruel dilemma, phylogenetic trait
evolution and the assembly of Serengeti plant communities. Journal of Ecology, 99, 797–
806.
Caley, M.J. & Schluter, D. (1997) The relationship between local and regional diversity.
Ecology, 78, 70–80.
Cahill, J.F., Kembel, S.W., Lamb, E.G. & Keddy, P.A. (2008) Does phylogenetic relatedness
influence the strength of competition among vascular plants? Perspectives in Plant
Ecolology, Evoution, and Systematics, 10, 41–50.
Carroll, I.T., Cardinale, B.J. & Nisbet, R.M. (2011) Niche and fitness differences relate the
maintenance of diversity to ecosystem function. Ecology, 92, 1157-1165.
Cavender-Bares, J., Keen, A. & Miles, B. (2006) Phylogenetic structure of Floridian plant
communities depends on taxonomic and spatial scale. Ecology, 87, 109-122.
Chase, J.M. & Leibold, M.A. (2003) Ecological niches: linking classical and contemporary
approaches. University of Chicago Press, Chicago.

CHAPTER 1: GENERAL INTRODUCTION
9
Chave, J. (2004) Neutral theory and community ecology. Ecology Letters, 7, 241-253.
Chesson, P. (2000) Mechanisms of maintenance of species diversity. Annual Review of Ecology
and Systematics, 31, 343–366.
Colwell, R.K. & Rangel T.F. (2009) Hutchinson’s duality: the once and future niche.
Proceedings of the National Academy of Sciences, 106,19651-19658.
Cottenie, K. (2005) Integrating environmental and spatial processes in ecological community
dynamics. Ecology Letters, 8, 1175-1182.
Darwin, C. (1859) On the origin of species by means of natural selection, or the preservation of
favoured races in the struggle for life. John Murray, London.
Diez, J.M., Sullivan, J.J., Hulme, P.E., Edwards, G. & Duncan, R.P. (2008) Darwin’s
naturalization conundrum: dissecting taxonomic patterns of species invasions. Ecology
Letters, 11, 674–681.
Elton, C. (1927) Animal Ecology. The MacMillan Company, New York.
Elton, C. (1946) Competition and the structure of ecological communities. Journal of Animal
Ecology, 15, 54–68.
Fox, J. (2012-10-09) Can the Phylogenetic Community Ecology Bandwagon be Stopped? in
Dynamic Ecology: http://dynamicecology.wordpress.com/2012/10/09/
Galloway, L.F. & Etterson, J.R. (2007) Transgenerational plasticity is adaptive in the wild.
Science, 318, 1134-1136.
Gause, G.F. (1932) Experimental studies on the struggle for coexistence. I. Mixed population of
two species of yeast. Journal of Experimental Biology, 9, 389-402.
Germain, R.M., Caruso, C.M. & Maherali, H. (2013) Mechanisms and consequences of water
stress-induced parental effects in an invasive annual grass. International Journal of Plant.
Sciences, 174, 886-895.
Gilbert, B. & Lechowicz, M.J. (2004) Neutrality, niches, and dispersal in a temperate forest
understory. Proceedings of the National Academy of Sciences, 101, 7651-7656.
Ginzburg, L.R. & Taneyhill, D.E. (1994) Population cycles of forest Lepidoptera: a maternal
effect hypothesis. Journal of Animal Ecology, 63, 79-92.
Godoy, O. & Levine, J.M. (2013) Phenology effects on invasion success: insights from coupling
field experiments to coexistence theory. Ecology, 95, 726-736.
Godoy, O., Kraft, N.J.B. & Levine, J.M. (2014) Phylogenetic relatedness and the determinants of
competitive outcomes. Ecology Letters, 17, 836–844.

CHAPTER 1: GENERAL INTRODUCTION
10
Grainger, T.S. & Gilbert, B. (2016) Dispersal and diversity in metacommunities: linking theory
and practice. Oikos early view: 10.5061/dryad.nq853
Grinnell, J. (1917) The niche-relationships of the California thrasher. Auk, 34, 427–433
Harper, J.L., Clatworthy, J.N., McNaughton, I.H. & Sagar, G.R. (1961) The evolution and
ecology of closely related species living in the same area. Evolution, 15, 209–227.
Herman, J.J. & Sultan, S.E. (2011). Adaptive transgenerational plasticity in plants: case studies,
mechanisms, and implications for natural populations. Frontiers in Plant Science, 2, 102.
Howe, H.F. & Brown, J.S. (2001) Ghosts of granivory past. Ecology Letters, 4, 371-378.
Hudson, P.J. & Catadorri, I.M. (1994) The Moran effect: a cause of population synchrony.
Trends in Ecology and Evolution, 14, 1-2.
Hurtt, G.C. & Pacala, S.W. (1995) The consequences of recruitment limitation: reconciling
chance, history and competitive differences between plants. Journal of Theoretical
Biology, 176, 1–12.
Hutchinson, G.E. (1957) Concluding remarks. Cold Spring Harbor Symposium of Quantitative
Biology, 22, 415-427.
Hutchinson, G.E. (1959) Homage to Santa Rosalina, or, why are there so many animals?
American Naturalist, 93, 145–159
Johnson, R.H. (1910) Determinant evolution in the color pattern of the lady-beetles. Carnegie
Institution of Washington, Washington.
Klingenberg, C.P. & Gidaszewski, N.A. (2009) Testing and quantifying phylogenetic signals and
homoplasy in morphometric data. Systematic Biology, 59, 245-261.
Kneital, J.M. & Chase, J.M. (2004) Trade-offs in community ecology: linking spatial scales and
species coexistence. Ecology Letters, 7, 69-80.
Knicks, S.T. & Rotenberry, J.T. (2000) Ghosts of habitats past: contribution of landscape change
to current habitats used by shrubland birds. Ecology, 81, 220-227.
Leibold, M.A., Holyoak, M., Mouquet, N., Amarasekare, P., Chase, J.M., Hoopes, M.F., Holt,
R.D., Shurin, J.B., Tilman, D., Loreau, M. & Gonzalez, A. (2004) The metacommunity
concept: a framework for multi-scale community ecology. Ecology Letters, 7, 601-613.
Levine, J.M. & HilleRisLambers, J. (2009) The importance of niches for the maintenance of
species diversity. Nature, 461, 254–257.
Lowe-Decarie, E., Kolber, M., Homme, P., Lofanom A., Dumbrell, A., Gonzalez, A. & Bell, G.
(2015) Community rescue in an experimental metacommunity. Proceedings of the
National Academy of Sciences, 112, 14307-14312.
CHAPTER 1: GENERAL INTRODUCTION
11
MacDougall, A.S., Gilbert, B. & Levine, J.M. (2009) Plant invasions and the niche. Journal of
Ecology, 97, 609–615.
Mayfield, M.M. & Levine, J.M. (2010) Opposing effects of competitive exclusion on the
phylogenetic structure of communities. Ecology Letters, 13, 1085-1093.
MacArthur, R. & Levins, R. (1967) The limiting similarity, convergence, and divergence of
coexisting species. American Naturalist, 101, 377–385.
Metz, J., von Oppen, J. & Tielbörger, K. (2015). Parental environmental effects due to
contrasting watering adapt competitive ability, but not drought tolerance, in offspring of a
semi-arid annual Brassicaceae. Journal of Ecology, 103, 990–997.
Miao, S.L., Bazzaz, F. & Primack, R. (1991) Persistence of maternal nutrient effects in Plantago
major: the third generation. Ecology, 72, 1634-1642.
Mooney, H.A. & Cleland, E.E. (2001) The evolutionary impact of invasive species. Proceedings
of the National Academy of Sciences, 98, 5446-5451.
Mouquet, N. & Loreau, M. (2003) Community patterns in source-sink metacommunities.
American Naturalist, 162, 554-557.
Mousseau, T.A. & Fox, C.W. (1998) Maternal Effects as Adaptations. Oxford University Press,
New York, NY.
Narwani, A., Alexandrou, M.A., Oakley, T. H., Carroll, I.T. & Cardinale, B.J. (2013)
Experimental evidence that evolutionary relatedness does not affect the ecological
mechanisms of coexistence in freshwater green algae. Ecology Letters, 16, 1373–1381.
Pulliam, H.R. (2000) On the relationship between niche and distribution. Ecology Letters, 3,349-
361.
Rajaniemi, T.K., Goldberg, D.E., Turkington, R. & Dyer, A.R. (2005) Quantitative partitioning
of regional and local processes shaping regional diversity patterns. Ecology Letters, 2006,
121-128.
Roach, D.A. & Wulff, R.D. (1987) Maternal effects in plants. Annual Review of Ecology and
Systematics, 18, 209–235.
Silvertown, J., McConway, K, Gowing, D., Dodd, M., Fay, M.F., Joseph, J.A. & Dolphin, K.
(2006) Absence of phylogenetic signal in the niche structure of meadow plant
communities. Proceedings of the Royal Society B: Biological Sciences, 273, 39-44.
Simberloff, D. & Boecklen, W. (1981) Santa Rosalia reconsidered: size ratios and competition.
Evolution, 35, 1206-1228.
Strauss, S.Y., Webb, C.O. & Salamin, N. (2006) Exotic taxa less related to native species are
more invasive. Proceedings of the National Academy of Sciences, 103, 5841–5845.

CHAPTER 1: GENERAL INTRODUCTION
12
Sultan, S.E., Barton, K. & Wilczek, A.M. (2009) Contrasting patterns of transgenerational
plasticity in ecologically distinct congeners. Ecology, 90, 1831-1839.
Tilman, D. & Pacala, S. (1993) The maintenance of species richness in plant communities.
Species Diversity in Ecological Communities (eds. Ricklefs, R.E. & Schluter, D.), pp. 13-
25. University of Chicago Press, Chicago.
Tilman, D. (1997) Community invisibility, recruitment limitation, and grassland biodiversity.
Ecology, 78, 81-92.
Tuomisto, H., Ruokolainen, K. & Yli-Halla, M. (2003) Dispersal, environment, and floristic
variation of Western Amazonian forests. Science, 299, 241-244.
Vamosi, S.M., Heard, S.B., Vamosi, J.C. & Webb, C.O. (2009) Emerging patterns in the
comparative analysis of phylogenetic community structure. Molecular Ecology, 18, 572–
592.
Van Allen, B.G. & Rudolf, V.H.W. (2013) Ghosts of habitats past: environmental carry-over
effects drive population dynamics in novel habitat. American Naturalist, 181, 596–608.
Van Allen, B.G. & Rudolf, V.H.W. (2015) Habitat-mediated carry-over effects lead to context-
dependent outcomes of species interactions. Journal of Animal Ecology, 84, 1646–1656.
Webb, C.O., Ackerly, D.D., McPeek, M.A. & Donoghue, M.J. (2002) Phylogenies and
community ecology. Annual Review of Ecology and Systematics, 33, 475–505.
Weiher, E., Freund, D., Bunton, T., Stefanski, A., Lee, T. & Bentivenga, S. (2011) Advances,
challenges and a developing synthesis of ecological community assembly theory.
Philosophical Transactions of the Royal Society B: Biological Sciences, 366, 2403–2413.
Wolkovich, E.M., Cook, B.I., McLauchlan, K.K. & Davis, T.J. (2014) Temporal ecology in the
Anthropocene. Ecology Letters, 17, 1365-1379.
CHAPTER 2: MATERNAL EFFECTS TO ABIOTIC CONDITIONS
13
Chapter 2
Hidden responses to environmental variation: maternal effects
reveal species niche dimensions
Published as Germain, R. M. & B. Gilbert. 2014. Hidden responses to environmental variation:
maternal effects reveal species niche dimensions. Ecology Letters 17:662-669.
Abstract
Species responses to fluctuating environments structure population and community dynamics in
variable ecosystems. Although offspring number is commonly used to measure these responses,
maternal effects on offspring quality may be an important but largely unrecognized determinant
of long-term population growth. We selected 29 species across a Mediterranean annual plant
phylogeny, and grew populations of each species in wet and dry conditions to determine
responses in seed number and maternal effects (seed size, seed dormancy, and seedling growth).
Maternal effects were evident in over 40% of species, but only 24% responded through seed
number. Despite a strong trade-off between seed size and seed number among species, there was
no consistent trade-off within species; we observed correlations that ranged from positive to
negative. Overall, species in this plant guild show a complex range of responses to
environmental variation that may be underestimated when only seed number responses are
considered.
Introduction
Environmental variability is ubiquitous in nature (Vasseur & Yodzis 2004), and plays a central
role in determining the structure and function of many biological communities (Hobbs et al.
2007; Elmendorf & Harrison 2009). When species differ in their responses to the environment,
this variability can maintain biodiversity by favouring different species in different years
(Chesson & Warner 1981; Levine & Rees 2004; Adler et al. 2006; Angert et al. 2009). As a
result, ecologists have devoted significant resources to understanding species-specific responses
to varying environments (Angert et al. 2010; Gremer et al. 2012).

CHAPTER 2: MATERNAL EFFECTS TO ABIOTIC CONDITIONS
14
Most research on the impacts of environmental variability has focused on numeric responses,
such as the per capita number of offspring produced (Caceres 1997; Levine & Rees 2004; Angert
et al. 2009). However, there is strong evidence that the environment not only affects offspring
quantity, but also offspring quality (Mousseau & Fox 1998), in a phenomenon known as
‘maternal effects’ (Roach & Wulff 1987). A maternal effect is “any phenotypic variation in
offspring that is a consequence of the mother’s phenotype rather than the genetic constitution of
the offspring” (Roff 1998). In plants, for example, increased seed provisioning can alter early
survivorship and competitive ability (Jakobsson & Eriksson 2000; Moles & Westoby 2004).
These changes in offspring quality have the potential to generate responses to environmental
variability that are distinct from changes in offspring quantity, and may therefore play an
important but relatively unexplored role in community dynamics (Ginzburg & Taneyhill 1994).
Previous research has revealed several cases where maternal effects can alter the fitness or
ecology of individuals (e.g., Galloway 2005; Sultan et al. 2009; Dyer et al. 2010). However, the
general importance of maternal effects for ecological dynamics is unknown for two reasons.
First, many studies of maternal effects evaluate their impact on genetically similar individuals,
such as closely related genotypes or clones (e.g., Galloway & Etterson 2007). While these tests
are relevant to the ecology of asexual organisms, it is not clear whether individual-level trends
would be swamped by population-level variation when considered in outcrossing species. In
other words, maternal effects need to be studied at the population level to determine if they are
comparable to demographic effects. Second, most studies of maternal effects include one or two
species that show strong responses (e.g., Galloway 2005). Multi-species tests of maternal effects
are currently lacking, and as a result it is unclear how common they are in natural communities.
In addition to quantifying the prevalence of maternal effects, multi-species tests also allow us to
identify key factors that account for variation in maternal effects expression among species.
Phylogenetic relationships are a likely candidate, given that they are known to structure plasticity
(Kembel & Cahill 2005; Gomez-Mestre et al. 2008) and seed size (e.g., Lord et al. 1995).
Moreover, contemporary hypotheses in the field of phylogenetic community ecology posit that
similar environmental responses among closely related species structures species coexistence
(Mayfield & Levine 2010), suggesting that understanding the phylogenetic basis of numeric
responses and maternal effects should provide insights into community assembly and diversity.

CHAPTER 2: MATERNAL EFFECTS TO ABIOTIC CONDITIONS
15
Annual plants are ideal for contrasting numeric population responses with maternal effects
because lifetime reproduction can be entirely captured in a single growing season. As such, the
number of offspring produced is estimated by seed number, whereas maternal effects manifest
through changes to seed quality, such as seed size. These differences in seed size often confer
advantages in early growth, survival and competitive ability among species (Leishman 2001;
Moles & Westoby 2002; Moles & Westoby 2004), and have been shown to change the fitness of
individuals (Germain et al. 2013). In addition, studies of seed size and seed number across
species show a consistent trade-off (e.g., Jakobsson & Eriksson 2000; Levine and Rees 2002).
This trade-off can also occur within species (e.g., Germain et al. 2013), but the opposite pattern
has also emerged (Venable 1992), raising the possibility that maternal effects can counteract or
reinforce a species’ numeric response to environmental fluctuations depending on whether they
are positively or negatively correlated to seed number.
In this study, we use annual plants from Mediterranean climate regions to test the consequences
of variation in water availability on seed production. We chose this system because the high
diversity of annual plants in Mediterranean regions is at least partially maintained by species-
specific responses to variable rainfall (e.g., Hobbs et al. 2007; Elmendorf & Harrison 2009). In
addition, several studies have demonstrated the importance of maternal effects in Mediterranean
annuals (e.g., Byers et al. 1997; Germain et al. 2013), but it is unknown how commonly maternal
effects occur across a range of species.
To test the general importance of maternal effects relative to numeric responses, we selected 29
species of both closely and distantly related taxa. We grew these species in a greenhouse under
wet and dry soil moisture conditions, and estimated the size and number of seeds produced, as
well as dormancy and offspring performance. We used these data to address three questions: (1)
How commonly do plants respond to environmental variation with maternal effects, and how
does this compare to numeric responses? (2) Is there a consistent relationship between seed size
and seed number responses within species, and does this relationship tend to be counteracting
(negative correlation) or reinforcing (positive correlation)? and (3) Does phylogenetic
relatedness explain the type and strength of responses to environmental variation?

CHAPTER 2: MATERNAL EFFECTS TO ABIOTIC CONDITIONS
16
Materials and methods
Study system
We studied the effect of water availability in the maternal generation on offspring of 29 annual
plant species that are native to Mediterranean-climate regions. Mediterranean regions are
diversity hotspots, harbouring ~20% of the world’s total vascular plant species, many of which
are rare or endemic (Cowling et al. 1996). These regions are characterized by cool winters and
hot summers, where most of the annual precipitation falls in the autumn and winter months
(Cowling et al. 1996). The timing and total amount of rainfall can vary up to six-fold between
years (Hobbs et al. 2007), potentially explaining the high turnover in both the density and
composition of species over time in these systems (Cowling et al. 1996; Levine & Rees 2004;
Hobbs et al. 2007; Elmendorf & Harrison 2009).
The species were selected to meet three criteria. First, all species have an annual lifecycle to
ensure that seed production in a single growing season is representative of that individual’s
lifetime reproductive success. Second, each species occurred in annual grasslands with similar
climatic conditions (Leiva et al. 1997) and overlapped geographically with other species in the
study as determined by CalFlora (http://www.calflora.org) and Euro+Med
(http://www.emplantbase.org) plant databases. These criteria ensured that our species had similar
exposure to variation in rainfall over recent evolutionary timescales. Third, species were selected
to span seven Orders [Asterales, Boraginales, Caryophyllales, Fabales, Lamiales, Poales, and
Ranunculales; Table S2.1], to capture the taxonomic diversity of annual species from
Mediterranean-climate regions. Seeds were acquired from commercial suppliers and an
individual donor, and originated from natural populations relatively few generations (usually <3,
all <20) before experimentation (Table S2.1). Although we suspect that our seed sources include
levels of genetic variation typical of natural populations, we are unable to test this assumption
because of a lack of knowledge of the genetic diversity both in the wild and in our populations.
Methods for ensuring genetically representative samples can be found elsewhere (e.g., Project
Baseline (http://www.baselineseedbank.org/)), and remain an important goal for future studies.
We did not cold stratify seeds prior to planting, because doing so is known to induce dormancy
in Mediterranean species (Baskin & Baskin 2001).

CHAPTER 2: MATERNAL EFFECTS TO ABIOTIC CONDITIONS
17
Maternal generation
We grew the maternal generation in a greenhouse at the University of Toronto from January to
July 2012. The greenhouse was initially set to day/night temperatures of 14/7˚C, with
supplemental high intensity discharge (HID) lighting provided to maintain a 10 h day length.
These conditions gradually increased to a 23/17 ˚C day/night cycle and 14-h day length to
simulate a typical Mediterranean growing season (Fig. S2.1). For each species, 30 seeds were
sown into each of fourteen replicate 2.54-L treepots filled with a 3:2 mixture of sand and
screened topsoil to mimic the sandy loam soils that dominate annual grasslands. Pots were top-
watered daily until saturation during a three week establishment period.
After establishment, we recorded the number of seedlings and thinned each pot to ~eight
individuals. Seedlings were selected systematically to maximize their distance from each other in
a pot, and were thinned by clipping the base of the stem. This low-density environment allowed
us to evaluate the direct effect of soil moisture on a population of individuals, rather than indirect
effects of competition. We randomly assigned pots of each species to receive either a wet or dry
soil moisture regime through drip irrigation lines. Pots in the wet treatment received 175 mL
water twice as often as those in the dry treatment, starting at one and two day intervals which
were extended to seven and 14 days as the growing season progressed (Fig. S2.1). These two soil
moisture regimes represent realistic among-year differences in precipitation, or equally, the 30
year average differences between mesic [662 mm] and xeric [312 mm] sites across the species
ranges in California (http://www.climate-charts.com). We confirmed that the wet (11.1 ± 0.56%;
mean ± SE percent soil moisture content) and dry (5.8 ± 0.42%) treatments were effective using
a volumetric water probe on empty pots. Prior to flowering (~60 days after planting), each pot
was provided with 350 mL of 1500 ppm 20-20-20 NPK fertilizer. Pollination was provided by
commercial colonies of Bombus impatiens, which were active throughout the flowering period.
Bombus impatiens are generalist pollinators, and were observed visiting all insect-pollinated
species in this experiment.
We monitored pots daily, and collected seeds as they matured on the parent plants. Seed samples
were processed in the lab by subsampling collected materials to estimate seed size and seed
number. Subsampling was conducted using a standardized procedure in which each sample was

CHAPTER 2: MATERNAL EFFECTS TO ABIOTIC CONDITIONS
18
sequentially divided into equal smaller units until manageable subsample sizes were obtained. A
single subsample was then chosen randomly. Seed size was estimated as the mass of all seeds in
the subsample divided by number of seeds in the subsample, whereas seed number was
calculated as the average number of seeds produced per plant in each pot.
Offspring generation
We performed germination and greenhouse experiments on the offspring generation from
January to April 2013. The greenhouse maintained a 15/7˚C day/night temperature regime, with
supplemental high intensity discharge (HID) lighting provided to maintain a 10-h day length
throughout the experiments.
The germination experiment tested for maternal effects on seed viability and dormancy, with the
latter indicating allocation to the seed bank as a bet-hedging strategy for persistence in
unfavourable years (Tielbörger & Valleriani 2005). Thirty seeds from each maternal pot were
haphazardly selected and placed on moist filter paper in a petri plate, with 7 petri plates used per
species by maternal environment combination. The plates were placed on a greenhouse bench
under a shade cloth and scored for germination every two days, and remoistened as needed. After
24 days, once germination plateaued for the majority of species, ungerminated seeds were air-
dried, transferred to fresh filter paper, and moistened with a 500 ppm gibberellic acid solution
(GA3). This naturally occurring plant growth regulator is commonly used to germinate dormant
seeds. Because GA3 application is not always 100% effective for deeply dormant seeds, it
provides a conservative estimate of dormancy (Baskin & Baskin 2001). Seed viability was
scored as the proportion of seeds that germinated under regular and GA3 methods; other viability
methods, such as tissue staining, could not be used due to the very small seed sizes of some
species. Mold growth was spot treated with 0.15% v/v of Previcur® fungicide throughout the
germination trial.
We also tested for maternal effects on offspring performance at the seedling stage. For each petri
plate in the germination trial, two germinants were transplanted into each of two 0.16-L
conetainers filled with a peat-based commercial soil (Sunshine Mix 1, Sun Gro Horticulture
Canada CM Ltd.). This produced fourteen conetainers per species × water level treatment, but
low germination in four species led to unbalanced replication among species. After three weeks,

CHAPTER 2: MATERNAL EFFECTS TO ABIOTIC CONDITIONS
19
we measured the height and harvested the above-ground biomass of one randomly-selected
individual per conetainer. Many individuals had very low dry mass (≤ 1 mg), which increased
the relative measurement error; we therefore used the height data to test for offspring
performance.
Phylogenetic tree construction
We constructed a phylogenetic tree for 27 of our 29 species using Bayesian methods on
nucleotide sequence data. Two species (Salvia columbariae and S. viridis) were excluded
because sequences were unavailable. Sequences from the ITS1/5.8S/ITS2 coding region were
retrieved from GenBank, aligned using the MUSCLE algorithm in MEGA (version 4.0; Tamura
et al. 2007) and combined into a single sequence matrix for analysis. We then generated a
Bayesian tree in BEAST (version 1.7; Drummond et al. 2002) using a GTR substitution model
selected by ModelTest (version 3.7; Posada & Crandall 1998) and an uncorrelated lognormal
relaxed molecular clock for branch length estimation. Because this coding region is rapidly
evolving, we constrained the tree topology at nodes above the family-level based on well-
resolved relationships in the angiosperms (Stevens 2001). We ran our MCMC chain for
100,000,000 generations, with a 10,000,000 burn-in and data logging every 10,000 generations.
Our analysis generated 10,000 posterior trees, which were summarized into a single maximum
clade credibility tree with median node heights. The resulting tree (Figs. 2.1 and S2.2) is fully
resolved and consistent with Angiosperm Phylogeny Group III classifications (Stevens 2001).
Data analysis
We used generalized least squares (GLS) analyses to test the effects of our maternal watering
treatments on all response variables that were not binomially distributed; those that were
binomially distributed (seed dormancy and viability) were tested with generalized linear models
(GLMs) using a quasibinomial distribution to account for overdispersion. The GLS allows for
heterogeneous variances among treatments, with the varIdent weighting function to account for
the different variances among species. In all analyses, we tested for the effect of maternal
environment (ME) and a species × ME interaction, with significant results indicating common
responses or species-specific responses to the maternal environment respectively.

CHAPTER 2: MATERNAL EFFECTS TO ABIOTIC CONDITIONS
20
In all analyses where a significant species × ME interaction occurred, we used post-hoc tests to
determine the species that differed and the direction of effect. The large number of species used
in the study made corrections to post-hoc comparisons impractical. As a result, we restrict our
post-hoc tests to comparisons between environments for each species, and present our data in
terms of effect sizes to quantify the magnitude of change relative to the variation. Our effect
sizes were measured using Cohen’s d with a pooled variance (i.e., (µdry - µwet)/pooled σ; Hartung
et al. 2011). Because the dormancy tests had higher variances than expected for proportions, we
used Cohen’s d for these effect sizes as well.
We tested for maternal effects on seed size, seed number, and also seed size-seed number
correlations within and among species. All tests with seed size and seed number were performed
on log-transformed data. The overall test of the correlation between seed size and seed number
within species was done by first standardizing seed size and seed number within species and
performing a regression that included a species × ME interaction. This standardization causes the
slope of the regression line to be equal to the correlation coefficient, and the test therefore
determines if any correlation between seed size and seed number is the same (or different) for
our species (Quinn & Keough 2002). The post-hoc test on seed size-seed number correlations
was performed using Pearson correlations for each species, and the effect size presented is the
correlation coefficient. The correlation among species was calculated using mean values by
species for both seed size and seed number.
Maternal effects were measured in the following generation by measuring seed dormancy,
viability and seedling height. For seedling height, we first tested for differences in height using
GLS, and subsequently tested for whether populations that produced larger seeds tended to
produce taller plants. For this second analysis, we first standardized data within each species,
using mean seed size per pot and mean height of offspring from a given pot. We then performed
a regression that included a species × ME interaction. As with the correlation test above, this test
determines if species differ in the correlation between mean seed size and the height of seedlings.
We tested for a phylogenetic signal in species responses to the maternal environment using the
‘phylosignal’ function in the picante package of R (Kembel et al. 2010), to determine if closely
related species are responding more or less similarly to environmental variation. First, when the

CHAPTER 2: MATERNAL EFFECTS TO ABIOTIC CONDITIONS
21
species × ME terms were significant, we calculated effect sizes for each species, except the seed
size-seed number correlation, for which we used the correlation coefficients. Second, we
contrasted observed phylogenetic independent contrasts (PICs) to those generated by
randomizing the tips of the tree (10000 randomizations). The rank of the observed contrasts
relative to the randomized contrasts was used to generate p-values, with p-values approaching
one or zero indicating that responses were convergent or conserved, respectively, with a null
expectation of a Brownian motion model of evolution. Because we used the randomizations for
two-tailed tests, the p-values reported are 2*rank observed/10000 for conserved responses, and
2*(1 - rank observed/10000) for convergent responses.
Results
Seed size, seed number, and their correlation
Close to half of species (45%) responded to environmental variation by altering seed size or seed
number, with these two responses being equally common (Fig. 2.1a,b). We detected a significant
maternal environment × species interaction for both responses (seed size: F28,331 = 2.20, P <
0.001, seed number: F27,320 = 2.39, P < 0.001), with seed size responses significant in six of 29
species and seed number responses significant to marginally significant in seven of 28 species (P
= 0.05-0.08 in two of those species). Interestingly, there was no overlap in the species that
responded through seed size and those that responded through seed number. Despite a significant
interaction, we found that seed number decreased by 85% on average in the dry environment
(F1,320 = 20.44, P < 0.001), and only one species significantly increased seed number in this
treatment (Fig. 2.1b). In contrast, seed size showed no mean effect of watering treatment (F1,331 =
2.20, P = 0.136; Fig. 2.1a), meaning that species were equally likely to increase or decrease seed
size in response to moisture.

CHAPTER 2: MATERNAL EFFECTS TO ABIOTIC CONDITIONS
22
Figure 2.1. Effect sizes of (A) seed size, (B) seed number, and (C) seed dormancy responses to
our watering treatments across a phylogeny of 29 species; see Table S1 for species codes. Effect
sizes were calculated using Cohen’s d (i.e., (µdry - µwet)/pooled σ; Hartung et al. 2011). Positive
effect sizes indicate that trait values were higher in the dry compared to wet environment, and
vice versa. The numbers on the phylogeny correspond to taxonomic orders: (1) Poales, (2)
Ranunculales, (3) Fabales, (4) Caryophyllales, (5) Boraginales, (6) Lamiales, and (7) Asterales.
Dashed branches represent unknown relationships due to missing sequence data [SCOLU and
SVIRI], and ‘×’ indicates unavailable trait data rather than a true zero. * P < 0.05, º P < 0.10.
CHAPTER 2: MATERNAL EFFECTS TO ABIOTIC CONDITIONS
23
There were significant seed size-seed number correlations, but their direction depended on
whether our focus was among or within species (Fig. 2.2). At the among-species level, seed size
and seed number were negatively correlated (r = -0.67, P < 0.001; Fig. 2.2a), and the slope of
this relationship was not statistically different from -1 (P > 0.05), meaning that the relationship
can be considered linear and is therefore consistent with hypothesized energetic trade-offs
(Levine & Rees 2002). Within species, however, we observed both positive and negative
correlations ranging from r = 0.76 to r = -0.65 (Fig. 2.2b). Overall, there were a similar number
of significant positive (three of 28 species) and negative (two of 28 species) correlations, with
most species having smaller correlation coefficients (-0.5 < r < 0.5) that were not statistically
significant.
We found some support of convergent evolution in the response of seed size, with closely related
species responding less similarly than expected by chance (Blomberg’s K = 0.09, P = 0.057).
This was particularly evident with Vulpia, where one species was less similar to its congeners
than to the other grasses (Fig. 2.1a), but similar patterns were seen in other closely related taxa
(e.g., Fabaceae and Boraginaceae). There was no phylogenetic signal in species responses
through seed number (Blomberg’s K = 0.22, P = 0.86) or seed size-seed number correlations
(Blomberg’s K = 0.33, P = 0.14).

CHAPTER 2: MATERNAL EFFECTS TO ABIOTIC CONDITIONS
24
Figure 2.2. Seed size-seed number correlations. (A) Correlation among species, with values
representing the species-level means with a best-fit line indicating a significant correlation (R2 =
0.45, P < 0.001). (B) Correlations within species; seed size and seed number were standardized
by species and a constant added to visualize the correlation coefficients for each species. Black
and dark grey lines represent significant (P < 0.05) and marginally significant (P < 0.10)
correlations, respectively; light grey lines are non-significant. The dashed line represents no
correlation (r = 0). All data were log transformed (A) prior to standardization (B).
Offspring performance
The maternal environment had significant effects on seedling height after three weeks of growth
(F1,575 = 15.92, P < 0.0001), with a significant maternal environment × species interaction
(F25,575 = 2.03, P = 0.003; Fig. S2.2). The height responses were only partially consistent with
the seed size effects—one species that had significantly larger seeds in the dry environment

CHAPTER 2: MATERNAL EFFECTS TO ABIOTIC CONDITIONS
25
(Hordeum vulgare) also had taller offspring when grown from those seeds in the dry
environment. However, this was not the case for many species that showed seed size effects;
only 3 of 26 species showed significant or marginally significant (P = 0.06 for one species)
responses. Nonetheless, a subsequent analysis revealed a positive correlation between seed size
and mean plant height (r = 0.11, P = 0.047, Fig. S2.3), which was consistent across species (non-
significant seed size × species interaction; P = 0.52).
We detected maternal effects on seed dormancy that varied by species (significant maternal
environment × species interaction; F26,282 = 1.96, P = 0.004), with changes to dormancy being
equally frequent as changes to seed size or seed number (Fig. 2.1c). Although seeds tended to
have higher dormancy when the maternal plant was raised in wet environments (six of seven
significant responses; F1,334 = 7.1, P = 0.008), there was one species that showed a significant,
opposite trend. The maternal environment caused large changes to dormancy for some of these
species (from 20-48% for Vulpia octoflora and from 3-9% for Lotus purshianus), whereas other
species shifted from no detectable dormancy to some dormancy (1-9%). Maternal environment
had no detectable effect on seed viability (P = 0.73). There was no phylogenetic signal for
maternal effects on dormancy (Blomberg’s K = 0.194, P = 0.998) or seedling height (Blomberg’s
K = 0.154, P = 0.650).
Discussion
We have shown that the effects of environmental variation on the ecological responses of species
are greatly underestimated when maternal effects are not considered. Ecologically important
maternal effects, such as changes in seed size and dormancy rates, are not only common, but
occur at similar frequencies as changes in seed number (Fig. 2.1). Because these maternal effects
produce responses at the population level, they likely influence long-term growth rates and
stability of populations in ways that cannot be predicted by measuring population growth rates
based on seed number alone. This study represents the first comprehensive investigation of
maternal effects that spans a guild of ecologically similar species, and demonstrates that
ecologists should consider these effects on population dynamics, species coexistence, and
phylogenetic patterns on the landscape.

CHAPTER 2: MATERNAL EFFECTS TO ABIOTIC CONDITIONS
26
We detected maternal effects on seed size directly, as well as associated differences in
performance. Seed size is known to influence the realized niches of species, with larger seeds
conferring competitive advantages and also contributing to survival in stressful conditions such
as light or nutrient limitation (reviewed in Westoby et al. 1996). We found supporting evidence
that within-species variation in seed size confers a weak but significant advantage to early
growth even when seedlings are grown in benign, non-competitive environments (Fig. S2.3), as
has been demonstrated in cross-species comparisons (Jurado & Westoby 1992). Previous work
on interspecific differences in seed size suggest that the advantages associated with larger seeds
may be less than an equal investment in seed number, with every x-fold increase in seed size
producing roughly x0.6
-fold increase in per capita success in the following generation (Freckleton
& Watson 2001; Levine & Rees 2002). However, the authors of these studies highlight that this
estimate provides a guideline at best; further research on the nature of seed size advantages and
their importance in different offspring environments is needed both within and among species
(Leishman 2001; Moles & Westoby 2004; Germain et al. 2013).
Increased investment in seed size may come at the cost of decreased seed number, a trade-off
that is commonly observed in plants. We only found strong supporting evidence for this trade-off
among species (Fig. 2.2a), which is consistent with previous studies (e.g., Jakobsson & Eriksson
2000). Within species, however, seed size-seed number correlations ranged from positive to
negative (Fig. 2.2b), suggesting that different constraints may be operating at different levels of
ecological organization. For example, Venable (1992) predicted that positive correlations can
arise if variation exists in the resource environment or the size of individual genotypes in a
population. Because changes in soil moisture conditions could induce changes to both seed size
and number, our experimental set-up was well-suited to producing a range of correlations. The
small sizes of our experimental populations (~eight individuals) likely also increased the
likelihood of high-yielding genotypes having large impacts on population-level responses. As
such, the variety of correlations between seed size and seed number likely reflects the combined
effects of species’ allocation strategies across environments as well as individual-level variation
within species.
The clearest signal of the maternal environment on offspring performance was through changes
in dormancy rates. Dormancy is known to have a large impact on population dynamics, but is

CHAPTER 2: MATERNAL EFFECTS TO ABIOTIC CONDITIONS
27
often thought to be highest with appropriate environmental signals (e.g., Angert et al. 2009) or to
be relatively constant when growing conditions vary unpredictably (Cohen 1966). The finding
that dormancy tended to decreased in response to a dry maternal environment was surprising, as
dormancy is generally thought to increase in response to resource limitation, such as water
availability (Tielbörger & Valleriani 2005). One potential explanation is that other reproductive
responses may influence dormancy. For example, a negative correlation between seed size and
dormancy is predicted by models of bet hedging when large seeds help ensure seedling success
in poor years (Venable 2007). We found limited support for this hypothesis, with approximately
one third of species that responded by changing dormancy rates also responded by altering seed
size (Fig. 2.1a,c). For these species, parents in dry soils produced larger seeds with lower
dormancy rates.
The maternal effects observed in our study have important implications for species coexistence
that are distinct from population-level implications. In particular, coexistence of annual plants in
temporally variable environments requires that (i) species respond differently to environmental
conditions, (ii) they have storage dynamics via seed dormancy, and (iii) species experience a
positive covariance between reproductive potential and intraspecific competition, which allows a
rare species to have high reproductive rates in good years (Chesson 1994; Abrams et al. 2013).
The maternal effects that we observed influence each of these conditions. For example, changes
to seed size doubled the number of species showing significant responses to soil moisture and
generated almost all of the positive responses to drought, meeting condition (i). Similarly, the
effect of the maternal environment on dormancy rates differentially alters both storage (condition
(ii)) and germination of species, with the latter contributing to coexistence by altering condition
(iii; e.g., Angert et al. 2009). Finally, condition (iii) can be met even in species with constant
germination rates so long as the per capita competitive effect and reproductive potential of each
species respond similarly to environmental conditions (Chesson 1994; Chesson et al. 2004;
Abrams et al. 2013). Seed size may generate this covariance, as large seeds have been shown to
produce plants that have a greater competitive effect and higher fecundity (Freckleton &
Watkinson 2001; Levine & Rees 2002).
The phylogenetic signature of maternal effects also offers new insights into the processes that
alter patterns of local species coexistence. Theoretical work predicts that phylogenetic

CHAPTER 2: MATERNAL EFFECTS TO ABIOTIC CONDITIONS
28
convergence in competitive traits, such as seed size, should deter local coexistence between
closely related species (Mayfield & Levine 2010). In temporally fluctuating environments,
however, the phylogenetic convergence that we observed in seed size responses to soil moisture
may actually promote coexistence between close relatives by favouring different species in
different years, as has been predicted by theory (Abrams et al. 2013). This intricate matching of
competitive ability and environmental conditions leads to contrasting predictions for
phylogenetic effects on coexistence depending on the timescale considered (i.e., single vs.
multiple years). Moreover, the phylogenetic signal observed was only apparent in seed size
responses, suggesting that this maternal effect likely contributes to phylogenetic patterns that
emerge from species interactions in this guild.
Although we have shown that maternal effects are common in this annual guild, there are four
important caveats to our conclusions. First, our study only measured a subset of maternal effects
by quantifying three responses to environmental variation: seed size, seed dormancy, and
seedling growth. Other studies have found that the maternal environment can also alter seed
composition, seed coat characteristics, and epigenetics (Roach & Wulff 1987; Donohue 2009).
As a result, our results likely underestimate the prevalence of maternal effects. Second, we
examine only two environmental conditions. Previous research has shown diverse responses of
annual plants to the timing and patterns of variation in precipitation, for example, and
quantifying the overall importance of maternal effects requires tests across a broader range of
environmental variation (e.g., Hobbs et al. 2007). Third, because we obtained seed from
commercial suppliers (Table S2.1), it is unclear how representative our seeds are of the genetic
diversity found in natural populations. Future work on the ecological importance of maternal
effects should use a standardized seed collection procedure that provides a representative sample
of genetic diversity in populations. Finally, the long-term impacts of maternal effects on
population and community dynamics are speculative in our study, which highlights the need for
long-term studies that quantify these impacts.
In sum, the diversity of responses that we observed suggests that maternal effects can alter
species niches through several pathways, including seed size, dormancy, and offspring
performance. In evolutionary ecology, it is well recognized that maternal effects can affect the
fitness of individuals, often strongly enough to generate artificial signals of natural selection

CHAPTER 2: MATERNAL EFFECTS TO ABIOTIC CONDITIONS
29
(Roach & Wulff 1987; Donohue 2009). In ecology, however, maternal effects have yet to be
incorporated into most models of population growth and species interactions. Our study
demonstrates that this failure to incorporate maternal effects effectively eliminates over half of
the ways in which species respond to the environment. The varied responses that we observed
suggest that testing the range of maternal effects that function in any guild of species may be
necessary for understanding the complexity of interactions that promote diversity.
Acknowledgements
Many undergraduate students contributed to the completion of this project, most notably Alanna
Leale, Alexandra Mushka, and Christopher Blackford. We also thank Jason Weir for his
assistance with phylogenetic reconstruction, as well as Bruce Hall and Andrew Petrie for
greenhouse assistance, and three anonymous reviewers for providing comments on an earlier
version of this manuscript. Research funding was provided by NSERC (B.G.) and the Botanical
Society of America (R.M.G.) and personal funding was awarded by NSERC-CGS (R.M.G.).
Literature cited
Abrams, P.A., Tucker, C.M. & Gilbert, B. (2013) Evolution of the storage effect. Evolution, 67,
315-327.
Adler, P.B., HilleRisLambers, J., Kyriakidis, P., Guan, Q. & Levine, J.M. (2006) Climate
variability has a stabilizing effect on the coexistence of prairie grasses. Proceedings of
the National Academy of Sciences, 103, 12793-12798.
Angert, A.L., Huxman, T.E., Chesson, P. & Venable, D.L. (2009) Functional tradeoffs determine
species coexistence via the storage effect. Proceedings of the National Academy of
Sciences, 106, 11641-11645.
Angert, A.L., Horst, J.L., Huxman, T.E. & Venable, D.L. (2010) Phenotypic plasticity and
precipitation response in the Sonoran Desert winter annuals. American Journal of Botany,
97, 405-411.
Baskin, C.C. & Baskin, J.M. (2001) Seeds: Ecology, Biogeography, and Evolution of Dormancy
and Germination. Academic Press, San Diego, CA.
Byers, D.L., Platenkamp, G.A.J. & Shaw, R.G. (1997) Variation in seed characters in Nemophila
menziesii: evidence of a genetic basis for maternal effect. Evolution, 51, 1445-1456.
Caceres, C.E. (1997) Temporal variation, dormancy, and coexistence: a field test of the storage
effect. Proceedings of the National Academy of Sciences, 94, 9171-9175.

CHAPTER 2: MATERNAL EFFECTS TO ABIOTIC CONDITIONS
30
Chesson, P. (1994) Multispecies competition in variable environments. Theoretical Population
Biology, 45, 227-276
Chesson P.L. & Warner, R.R. (1981) Environmental variability promotes coexistence in lottery
competitive systems. American Naturalist, 117, 923-943.
Chesson, P., Gebauer, R.L.E., Schwinning, S., Huntly, N., Wiegand, K., Ernest, M.S.K. et al.
(2004) Resource pulses, species interactions, and diversity maintenance in arid and semi-
arid environments. Oecologia, 141, 236-253.
Cohen, D. (1966) Optimizing reproduction in a randomly varying environment. Journal of
Theoretical Biology, 12, 119-129.
Cowling, R.M., Rundel, P.W., Lamont, B.B., Arroyo, M.K. & Arianoutsou, M. (1996) Plant
diversity in mediterranean-climate regions. Trends in Ecology and Evolution, 11, 362-
366.
Donohue, K. (2009) Completing the cycle: maternal effects as the missing link in plant life
histories. Philosophical Transactions of the Royal Society of London: Biological
Sciences, 364, 1059-1074.
Drummond, A.J., Nicholls, G.K., Rodrigo, A.G. & Solomon, W. (2002) Estimating mutation
parameters, population history and genealogy simultaneously from temporally spaced
sequence data. Genetics, 161, 1307-1320.
Dyer, A.R., Brown, C.S., Espeland, E.K., McKay, J.M., Meimberg, H. & Rice, K.J. (2010) The
role of adaptive trans-generational plasticity in biological invasions of plants.
Evolutionary Applications, 3, 179-192.
Elmendorf, S.C. & Harrison, S.P. (2009) Temporal variability and nestedness in California
grassland species composition. Ecology, 90, 1492-1497.
Freckleton, R. & Watkinson, A. (2001) Predicting competition coefficients for plant mixtures:
reciprocity, transitivity and correlations with life‐history traits. Ecology Letters, 4, 348–
357.
Galloway, L.F. (2005) Maternal effects provide phenotypic adaptation to local environmental
conditions. New Phytologist, 166, 93-100.
Galloway, L.F. & Etterson, J.R. (2007) Transgenerational plasticity is adaptive in the wild.
Science, 318, 1134-1136.
Germain, R.M., Caruso, C.M. & Maherali, H. (2013) Mechanisms and consequences of water
stress-induced parental effects in an invasive annual grass. International Journal of Plant.
Sciences, 174, 886-895.
Ginzburg, L.R. & Taneyhill, D.E. (1994) Population cycles of forest Lepidoptera: a maternal
effect hypothesis. Journal of Animal Ecology, 63, 79-92.

CHAPTER 2: MATERNAL EFFECTS TO ABIOTIC CONDITIONS
31
Gomez-Mestre, I., Wiens, J.J. & Warkentin, K.M. (2008) Evolution of adaptive plasticity: risk-
sensitive hatching in Neotropical leaf-breeding treefrogs. Ecological Monographs, 78,
205-224.
Gremer, J.R., Crone, E.E. & Lesica, P. (2012) Are dormant plants hedging their bets?
Demographic consequences of prolonged dormancy in variable environments. American
Naturalist, 179, 315-327.
Hartung, J., Knapp, G. & Sinha, B.K. (2011) Statistical Meta-analysis with Applications. John
Wiley & Sons, Inc., Hoboken, NJ.
Hobbs, R.J., Yates, S. & Mooney, H.A. (2007) Long-term data reveal complex dynamics in
grassland in relation to climate and disturbance. Ecological Monographs, 77, 545–568.
Jakobsson, A. & Eriksson, O. (2000) A comparative study of seed number, seed size, and
recruitment in grassland plants. Oikos, 88, 494-502.
Jurado, E. & Westoby, M. (1992) Seedling growth in relation to seed size among species of arid
Australia. Journal of Ecology, 80, 407–416.
Kembel, S.W. & Cahill, J.F. (2005) Plant phenotypic plasticity belowground: a phylogenetic
perspective on root foraging trade-offs. American Naturalist, 166, 216-230.
Kembel, S.W., Cowan, P.D., Helmus, M.R., Cornwell, W.K., Morlon, H., Ackerly, D.D. et al.
(2010) Picante: R tools for integrating phylogenies and ecology. Bioinformatics, 26,
1463-1464.
Leishman, M.R. (2001) Does the seed size/number trade-off model determine plant community
structure? An assessment of the model mechanisms and their generality. Oikos, 93, 294-
302.
Leiva, M.J., Chapin III, F.S. & Fernandez Ales, R. (1997) Differences in species composition
and diversity among Mediterranean grasslands with different history – the case of
California and Spain. Ecography, 20, 97-106.
Levine, J.M. & Rees, M. (2002) Coexistence and relative abundance in annual plant
assemblages: the roles of competition and colonization. American Naturalist, 160, 452-
467.
Levine, J.M. & Rees, M. (2004) Effects of temporal variability on rare plant persistence in
annual systems. American Naturalist, 164, 350-363.
Lord, J., Westoby, M. & Leishman, M. (1995) Seed size and phylogeny in six temperate floras:
constraints, niche conservatism, and adaptation. American Naturalist, 146, 349-364.
Mayfield, M.M. & Levine, J.M. (2010) Opposing effects of competitive exclusion on the
phylogenetic structure of communities. Ecology Letters, 13, 1085-1093.

CHAPTER 2: MATERNAL EFFECTS TO ABIOTIC CONDITIONS
32
Moles, A.T. & Westoby, M. (2002) Seed addition experiments are more likely to increase
recruitment in larger-seeded species. Oikos, 99, 241-248.
Moles, A.T. & Westoby, M. (2004) Seedling survival and seed size: a synthesis of the literature.
Journal of Ecology, 92, 372-383.
Mousseau, T.A. & Fox, C.W. (1998) The adaptive significance of maternal effects. Trends in
Ecology and Evolution, 13, 403-407.
Quinn, G. & Keough, M.J. (2002) Experimental Design and Data Analysis for Biologists.
Cambridge University Press, Cambridge, UK.
Posada, D. & Crandall, K.A. (1998) MODELTEST: testing the model of DNA substitution.
Bioinformatics, 14, 817-818.
Roach, D.A. & Wulff, R.D. (1987) Maternal effects in plants. Annual Review of Ecology and
Systematics, 18, 209-235.
Roff, D.A. (1998) The detection and measurement of maternal effects. In: Maternal Effects as
Adaptations. (eds Mousseau, T.A., Fox, C.W.). Oxford University Press, New York, NY,
pp. 83-96.
Stevens, P.F. (2001) Angiosperm Phylogeny Website. Version 12, July 2012 [and more or less
continuously updated since].
Sultan, S.E., Barton, K. & Wilczek, A.M. (2009) Contrasting patterns of transgenerational
plasticity in ecologically distinct congeners. Ecology, 90, 1831-1839.
Tamura, K., Dudley, J., Nei, M. & Kumar, S. (2007) MEGA4: molecular evolutionary genetics
analysis (MEGA) software version 4.0. Molecular Biology and Evolution, 24, 1596-1599.
Tielbörger, K. & Valleriani, A. (2005) Can seeds predict their future? Germination strategies of
density-regulated desert annuals. Oikos, 111, 235-244.
Vasseur, D.A. & Yodzis, P. (2004) The color of environmental noise. Ecology, 4, 1146-1152.
Venable, D.L. (1992) Size-number trade-offs and the variation of seed size with plant resource
status. American Naturalist, 140, 287-304.
Venable, D.L. (2007) Bet hedging in a guild of desert annuals. Ecology, 88, 1086-1090.
Westoby, M., Leishman, M., Lord, J., Poorter, H. & Schoen, D.J. (1996) Comparative ecology of
seed size and dispersal [and discussion]. Philosophilcal Transactions of the Royal Society
B, 351, 1309-1318.

CHAPTER 3: FREQUENCY-DEPENDENT MATERNAL EFFECTS
33
Chapter 3
Frequency-dependent maternal effects across species and
environments
In review as Germain, R. M., T. N. Grainger, N. T. Jones, & B. Gilbert. Frequency-dependent
maternal effects across species and environments. American Naturalist.
Abstract
Maternal provisioning of offspring in response to environmental conditions (“maternal effects”)
has been argued as the ‘the missing link’ in plant life histories. Although recent empirical
evidence suggests that maternal responses to abiotic conditions are common, there is little
understanding of the prevalence of maternal provisioning in response to conditions plants
commonly experience in nature, such as competition. We tested how competition in two soil
moisture environments affects maternal provisioning of offspring seed size by varying the
frequency of conspecifics from 90% (mainly intraspecific competition) to 10% (mainly
interspecific competition) for 15 pairs of annual plant species that differ in phylogenetic
relatedness and biogeographic histories. We found that conspecific frequency affected maternal
provisioning (seed size) in 48% of species, and that these responses included both increased
(20%) and decreased (24%) seed size. In contrast, 68% of species responded to the competitive
environment through changes in per capita fecundity (seed number), which generally decreased
as conspecific frequency increased. We found opposite patterns of frequency-dependent maternal
provisioning among species originating from different biogeographic regions, suggesting that
maternal provisioning might be one trait that differentiates native and non-native species. Given
the prevalence of maternal provisioning of seed size shown here, future study is needed to
understand how these effects contribute to population- and community-level dynamics.
CHAPTER 3: FREQUENCY-DEPENDENT MATERNAL EFFECTS
34
Introduction
Ecologists are often interested in relating species performance to competitive interactions and
environmental conditions, with the common goal of understanding the factors that contribute to
biological diversity. Although performance can be evaluated in many ways, the predominant
measure is to quantify the number of offspring produced, with all offspring considered identical
in quality (e.g., Law & Watkinson 1987; Levine & HilleRisLambers 2009). However, variation
in offspring quality in response to maternal environmental conditions is well-documented in
plants and animals, through a phenomenon known as ‘maternal effects’ (Roach & Wulff 1987;
Mousseau & Fox 1998). A maternal effect is the influence of the maternal environment on
offspring phenotypes, rather than or in addition to the influence of the maternal genotype
(Mousseau & Fox 1998). Although the impact of such maternal effects on demographic rates and
community dynamics is an open question (Galloway & Etterson 2007; Kendall et al. 2011),
overlooking maternal effects by focusing solely on offspring quantity has the potential to obscure
important ecological dynamics (Ginzburg & Taneyhill 1994; Benton et al. 2001).
Maternal effects on offspring quality commonly manifest as changes in the size of propagules,
such as seeds or eggs, and result from the maternal provisioning of resources to individual
offspring (Mousseau & Fox 1998; Herman & Sultan 2011). The effects of propagule size on
individual success are often short-lived, primarily manifesting at the juvenile stage; less
frequently they can persist to offspring maturity (Germain et al. 2013) or for multiple
generations (Miao et al. 1991). Regardless of the duration of persistence, maternal provisioning
of offspring size at the propagule stage can provide early life advantages or disadvantages that
affect life histories (Segers & Taborsky 2011; Allen 2012) and components of population
demography such as germination, dormancy rates, and juvenile survival (Westoby et al. 1996;
Smart & Moser 1999). These early life effects are especially important given that the filtering
effects of biotic and abiotic environments that select for some offspring over others can be most
apparent at the juvenile stage (Goldberg et al. 2001; Baldeck et al. 2013).
Although maternal effects are well-documented in response to abiotic conditions (see review by
Herman & Sultan 2011), the effect of competition on maternal provisioning is less understood,
particularly in plants (Weiner et al. 1997; Larios & Venable 2015). Maternal effects in response

CHAPTER 3: FREQUENCY-DEPENDENT MATERNAL EFFECTS
35
to competition are likely more complex than responses to abiotic conditions for several reasons.
First, competition might interact with the abiotic environment to affect seed size if competitive
interactions alter resource availability or a species’ response to abiotic conditions. For example,
competitors may exacerbate maternal effects that are driven by a limiting resource (Stratton
1989), such as soil moisture (Fotelli et al. 2001). Most studies of maternal effects are conducted
in low-competition environments (e.g., Germain & Gilbert 2014) even though organisms rarely
occur in the absence of biotic interactors in nature, which suggests that current estimates of
maternal effects are conservative.
Second, the effect of competition on demographic rates often depends on the relative frequency
of conspecific to heterospecific individuals, even when total density is maintained (Law &
Watkinson 1987). The direction of frequency dependence has been used to identify whether
competition is most intense among conspecific (negative frequency dependence; e.g., Ayala
1971) or heterospecific (positive frequency dependence; e.g., Molofsky et al. 2001) individuals;
local coexistence is promoted when competing species show negative frequency dependence
(Levine & HilleRisLambers 2009). In the context of maternal provisioning, it is not known if or
when seed provisioning strategies reinforce or counteract frequency-dependent demographic
rates.
Lastly, the magnitude and direction of maternal effects might also depend on the biogeographic
histories and phylogenetic distances of competing species. Species with different biogeographic
histories (i.e., originating from different regions) often exhibit distinct strategies of resource use
and competitive ability (Funk & Vitousek 2007; Fridley 2012) due to differences in the
evolutionary pressures that exist in different regions (e.g., herbivory, climate; Mitchell et al.
2006). Similarly, phylogenetic distance is a proxy for evolutionary relatedness, with classic and
emerging theories suggesting that the intensity of competition among species is tied to their
evolutionary relatedness (Darwin 1859; Elton 1946; Mayfield & Levine 2010). It should be
noted, however, that unlike classic hypotheses (Darwin 1859; Elton 1946), recent theory does not
predict that competition should be most intense among closely related species. Rather,
contemporary theory predicts that the evolutionary rates of competitive differences determines
both the strength and direction of frequency-dependent demographic rates (Mayfield & Levine
2010; Godoy et al. 2014; Germain et al. 2016). It has recently been shown that frequency-

CHAPTER 3: FREQUENCY-DEPENDENT MATERNAL EFFECTS
36
dependent demographic rates depend on biogeographic histories and phylogenetic distances of
competing species (Germain et al. 2016), but the influence of these differing competitive
environments on maternal provisioning of seed size has not been explored.
Although there is a long history of investigating maternal effects from an evolutionary
standpoint, their ecological implications have only recently begun to be explored (e.g., Larios &
Venable 2015; Van Allen & Rudolf 2015). In the evolutionary literature, a common goal has
been to understand how often maternal effects evolve as adaptations (Marshall & Uller 2007;
Mousseau et al. 2009), and to identify their genetic underpinnings (Mousseau & Fox 1998).
These types of evolutionary questions are typically tested in single-species experiments, using
replicated clones or genotypes to identify correlations among maternal effects expression and
fitness. In contrast, a common goal of ecological studies is to understand how prevalent maternal
effects are in natural systems (Germain & Gilbert 2014), and how they might impact population
and community dynamics (Ginzburg & Taneyhill 1994; Van Allen & Rudolf 2013; Van Allen &
Rudolf 2015). This ecological perspective requires that maternal effects be characterized at the
population or species level, rather than among genetically-similar individuals in a population.
Characterizing the strength and direction of maternal effects in an assemblage of species adds to
our understanding of how species interact with each other and their environments.
In this study, we use 25 annual plant species native to the mediterranean-climate regions of
California or Spain to test whether competition in the maternal generation results in maternal
effects on seed size. The seed stage is especially important to the life cycle of an annual plant
because annual plant populations regenerate entirely each year from the seed bank. We grew
fifteen pairs of species at six relative frequencies in two soil moisture environments that are
commonly encountered in mediterranean-climate regions. We quantified the size and number of
seeds produced, and used these data to address three questions: (i) How common are maternal
effects in response to competition, compared to seed number responses? (ii) Are maternal effects
in response to abiotic conditions sensitive to the competitive environment? And (iii) can
variation in the strength of maternal effects among species pairs be explained by differences in
their phylogenetic distances and biogeographic histories?

CHAPTER 3: FREQUENCY-DEPENDENT MATERNAL EFFECTS
37
The 25 species considered here have been used previously in experiments designed to understand
macroevolutionary patterns of competitive interactions (Germain et al. 2016) and to quantify
maternal effects in response to abiotic conditions in the absence of competition (Germain &
Gilbert 2014). This previous work shows that maternal effects in the absence of competition are
common (Germain & Gilbert 2014), and that the effect of phylogenetic distance on the intensity
of competition varies with biogeographic history, with the most intense interactions occurring
amongst distant relatives that originate from different regions (Germain et al. 2016). By
extension, we predict that phylogenetic distance and biogeographic history will interactively
explain variation in maternal effects among competitive pairs, if maternal effects are fine-tuned
to competitive differences among species.
Methods
Study species
To test species responses to competition, we competed 15 species pairs out of 25 Mediterranean
annual plant species (Table S3.1) that have been used previously in experiments that investigate
maternal effects in response to abiotic conditions (Germain & Gilbert 2014) and
macroevolutionary patterns of competitive interactions (Germain et al. 2016). Species pairs were
chosen to represent two biogeographic contrasts, with each species in each pair either originating
from a common region (California-California [n = 9]) or distinct regions (California-Spain [n =
6]), with equal sampling across a range of phylogenetic distances (nine to 170 million years since
divergence; x-axes in Fig. 3.3, phylogeny in Fig. S3.1). Additionally, each pair of species within
a biogeographic contrast was selected to be phylogenetically independent from all others (see
Appendix B for details) in order to circumvent the common problem of phylogenetic
pseudoreplication. Seeds were obtained from commercial suppliers and an individual donor, and
were sourced from natural populations consisting of relatively few generations (most < 3, all <
20; Table S2.1) prior to our experiments. It is possible that the genetic diversity of our seed
populations is low compared to natural populations, though we suspect that this is not the case
given the large numbers of individuals used to establish the commercial populations and the
small number of generations that have elapsed.

CHAPTER 3: FREQUENCY-DEPENDENT MATERNAL EFFECTS
38
Greenhouse experiment
From January to July 2012, we grew the 15 species pairs in competition in a greenhouse under
two soil moisture levels (wet vs. dry); plants in the wet treatment were watered twice as often as
those in the dry treatment, with the total water received designed to mimic rainfall in mesic sites
during wet and dry years (Germain & Gilbert 2014). The competitive environment was
manipulated by sowing seeds of each species pair at six relative frequency ratios (10:60, 20:50,
30:40, 40:30, 50:20 and 60:10 expected germinants) at a common density of 70 individuals. For
each species pair, we had two replicate pots per combination of soil moisture condition and
frequency ratio, for a total of 420 pots of plants that were randomly assigned to a position in the
greenhouse. All greenhouse growing conditions were chosen to emulate those typical of annual
grassland in Mediterranean-climate regions (Germain & Gilbert 2014; Appendix B). We
monitored pots daily, collecting all seeds produced in each pot as they matured on the parent
plants. At the end of the experiment, all seed material produced in each pot was weighed, and a
random representative subsample was taken to estimate the average size and number of seeds
produced per plant in a given pot (Appendix B).
Concurrent to this experiment, an additional experiment using the same species pairs was
conducted to estimate the impact of soil moisture conditions on maternal provisioning (Germain
& Gilbert 2014). Key differences between the previous experiment and the current one are that
each species was grown individually and at low densities (~seven individuals per pot, compared
to 70 in the current experiment), meaning that competition was greatly relaxed. We include a
summary result from Germain & Gilbert (2014) in this paper to compare maternal effects on
seed size to soil moisture conditions in the presence and absence of competition.
Statistical analyses
Prior to analysis, we transformed the data in two ways to meet model assumptions and facilitate
comparisons among species. First, we log transformed seed size, seed number, and conspecific
frequency to minimize heteroscedasticity and linearize seed size and seed number relationships
with conspecific frequency. Second, to allow us to compare species that differ markedly in seed
production, we standardized the log-transformed seed size and seed number data for each species

CHAPTER 3: FREQUENCY-DEPENDENT MATERNAL EFFECTS
39
to a mean of zero and unit variance. For simplicity, we henceforth refer to the standardized log-
transformed data as ‘seed size’, ‘seed number’, and ‘frequency’, unless stated otherwise.
We conducted a cross-species analysis to test if species differed significantly in their seed size
and seed number responses to the competitive and soil moisture environments. For these
analyses, we used the ‘lmerTest’ R package to run linear mixed effects (LME) models, with
either seed size or seed number as response variables, and species (30 levels), soil moisture (two
levels), conspecific frequency (six levels), and their interactions as fixed factors. Pot ID was
included as a random factor, to control for the non-independence of species interacting in a
single pot, as was the identity of the competitive pair (e.g., Lasthenia glabrata vs. L. californica).
Following significant species x frequency and species x soil moisture interactions (see Results),
we ran species-specific analyses. Separately for each species, we then used linear models with
type II sums of squares to test the effects of conspecific frequency, soil moisture conditions, and
their interaction on seed size and seed number, to identify species with significant responses to
the biotic and abiotic environment.
We used major axis regression (MAR; R package ‘lmodel2’) to examine the relationships
between response variables across species, and tested the significance of these relationships
using a Pearson correlation. First, to identify if seed size and seed number responses are
correlated, we performed a MAR with the slopes of species’ seed size responses and the slopes
of species’ seed number responses as variables. Second, we tested whether the presence and
absence of competition alters species’ responses to soil moisture conditions. To do this, we first
calculated species’ average effect sizes of seed size responses to contrasting soil conditions (μdry
– μwet) in the presence of competition using Cohen’s d with pooled variance (Hartung et al.
2011); in cases where a species was used in more than one species pair, a single average effect
size was used. We then used MAR to examine the relationship between these effect sizes and
previously published, identically calculated effect sizes in the absence of competition.
To identify why the strength of frequency-dependent maternal effects varied among species, we
used a LME model, where the response variable was the slope of the relationship between seed
size and conspecific frequency for each species pair. For this analysis, phylogenetic distance,
biogeographic history (native to same vs. different regions), biogeographic origin (native to

CHAPTER 3: FREQUENCY-DEPENDENT MATERNAL EFFECTS
40
California vs. Spain) nested within biogeographic history, and soil moisture were included as
fixed factors. The identity of the competitive pair was included as a random factor because each
was grown in two soil moisture environments.
Results
Of the 25 species included in this study, 16 showed significant (P < 0.05) or marginally-
significant (P < 0.10) maternal effects on seed size when in competition (Fig. 3.1a, Table S3.1).
Rather than use post-hoc corrections for multiple tests, we note that we expect 2 or 3 species to
show these results by chance alone. Most species responded to conspecific frequency alone (5
species) or in conjunction with the soil moisture environment in an additive (4 species) or
multiplicative (3 species) manner; four species responded to the soil moisture environment but
not conspecific frequency (Table S3.1). The strength and direction of responses varied among
species, as indicated by significant species x frequency (F29,464 = 2.84, P < 0.001) and species x
soil moisture (F29,410 = 3.19, P < 0.001) interactions in our cross-species statistical model (Table
S3.2). The effect of conspecific frequency on seed size was not consistently negative; species
were similarly likely to increase (five species) or decrease (six species) seed size as frequency
increased (Table S3.1, Fig. 3.1a). Overall, our results demonstrate that for a given plant
community, 64% of species are likely to exhibit maternal effects on seed size in response to
biotic or abiotic conditions.
In contrast to seed size, 21 of the 25 species showed significant or marginally significant
responses through seed number to conspecific frequency (7 species; Fig. 3.1b), soil moisture
conditions (4 species), both additively (6 species), and both interactively (4 species; Table S3.1).
Like seed size responses, the effect of conspecific frequency on seed number depended on the
focal species (significant species x frequency interaction; Table S3.3, F29,716 = 6.63, P < 0.001).
However, in contrast to seed size responses, frequency dependence was negative for most
species (14 out of 17 species; Table S3.1), and was sensitive to the soil moisture environment
(significant frequency x soil moisture interaction; Table S3.3, F1,716 = 4.49, P = 0.034). These
seed number responses were positively correlated with the strength and direction of species’ seed
size responses (r = 0.28, slope = 0.48, P = 0.029; Fig. 3.2a), even though some species showed
opposite seed size and seed number responses (grey regions of Fig. 3.2a).

CHAPTER 3: FREQUENCY-DEPENDENT MATERNAL EFFECTS
41
Figure 3.1. Cross-species comparison of frequency-dependent (a) maternal provisioning of seed
size and (b) seed number responses. Points are slope coefficients (± 2 × standard error) of species
responses to the frequency of conspecific competitors, and are shaded black, gray, or white to
indicate significant (P < 0.05), marginally-significant (P < 0.10), or non-significant (P > 0.10)
slopes, respectively. In most cases, frequency × soil moisture interactions are non-significant,
and slopes are averaged across soil moisture environments; when significant, wet (upwards
triangle) and dry (downwards triangle) environments are plotted separately. Competitive pairs
are delineated by lines connecting species codes; see Table S3.1 for species codes.
The strength and direction of seed size responses to contrasting soil moisture environments (wet
vs. dry) in the presence of competition were positively correlated with those in the absence of
competition (r = 0.50, P = 0.010; Fig. 3.2b). The slope of this correlation was less than one
(major axis regression, slope = 0.67), as many species showed stronger responses to soil

CHAPTER 3: FREQUENCY-DEPENDENT MATERNAL EFFECTS
42
moisture when grown in the absence of competition (Fig. 3.2b). This result was surprising given
that, in the current experiment, 44% of species altered seed provisioning in response to soil
moisture when in competition, whereas only 21% did so in the absence of competition (Germain
& Gilbert 2014). This suggests that the prevalence but not the magnitude of soil moisture-
induced maternal effects on seed size increase in the presence of competition, possibly because
the effects of soil moisture are dwarfed by those of conspecific frequency.
Figure 3.2. Correlations of (a) seed size and seed number responses to conspecific frequency (n
= 60 [15 pairs × two species × two soil moisture environments]), and (b) seed size responses to
soil moisture conditions in the presence and absence of competition (n = 25). Each point is a
species, and points that fall in the grey zones are species with opposing directions of responses.
The biogeographic history (native to the same or different regions) and origin (California vs.
Spain) of competitors influenced seed size responses to competition, and this effect depended on
phylogenetic relatedness and soil moisture conditions (significant four-way interaction
[phylogenetic distance x biogeographic history x biogeographic origin x soil moisture
environment; F1,60 = 4.55, P = 0.019]; Fig. 3.3, Table S3.4). We did not detect any effect of
phylogenetic relatedness when focal species were competed with species from the same
biogeographic region, regardless of soil moisture treatment (Fig. 3.3a,c). However, when species
from different regions competed in wet soil conditions, closely related Californian and Spanish
species had opposite responses to frequency; California species had negative frequency-

CHAPTER 3: FREQUENCY-DEPENDENT MATERNAL EFFECTS
43
dependent responses (smaller seeds at high conspecific frequencies) while their Spanish
competitors had positive frequency-dependent maternal effects (larger seeds at high conspecific
frequencies; Fig. 3.3b). As the phylogenetic distance between species pairs increased, the
direction of frequency-dependent maternal effects switched: species from California and Spain
shifted to positive and negative frequency-dependent seed size responses, respectively (Fig.
3.3b). In contrast, in a dry soil moisture environment, frequency-dependent maternal effects were
consistently positive for California species and negative for Spanish species, and there was no
effect of phylogenetic distance on seed size response (Fig. 3.3d).
Figure 3.3. Variation in the strength of frequency-dependent maternal provisioning of seed size
explained by the phylogenetic distance between competitors, depending on whether they are
native to the same biogeographic region (a,c) or different regions (b,d). The red dashed line
indicates the cut-off between negative and positive frequency dependence, grey dashed lines
delineate pairs of species that were competed, and solid lines denote significant relationships.
Black symbols and lines are species native to California, whereas gray symbols and lines are
species native to Spain.

CHAPTER 3: FREQUENCY-DEPENDENT MATERNAL EFFECTS
44
Discussion
There is a substantial body of empirical work investigating maternal effects in response to abiotic
conditions (Herman & Sultan 2011), yet responses to biotic interactions remain understudied,
particularly in plants (Weiner et al. 1997; Larios & Venable 2015). Our results show that
changes to the competitive environment can alter maternal provisioning of seed size and, much
like more commonly measured seed number responses (Law & Watkinson 1987), that the
strength and direction of these provisioning effects depend on identities of competing species.
Below, we discuss how these responses inform classic questions in ecology and generate new
hypotheses for future study.
We detected maternal effects on seed size in response to the frequency of conspecific
competitors in nearly half of the species examined (Fig. 3.1a). Frequency dependence manifests
when the strengths of intraspecific and interspecific competition differ. For example, when
species compete more strongly with conspecific than heterospecific individuals, fecundity should
increase as the frequency of conspecifics decreases and a species becomes relatively rare
(negative frequency dependence; Levine & HilleRisLambers 2009). In the context of
demographic rates, the direction of frequency dependence can indicate whether competition is
more likely to result in coexistence (negative frequency dependence) or exclusion (positive
frequency dependence). In our experiment, negative frequency-dependent seed number
responses that promote coexistence were common (Fig. 3.1b), but negative and positive seed size
responses were equally common (Fig. 3.1a). If seed size is tied to competitive ability, as many
authors suggest (e.g., Westoby et al. 1996), then it is possible that maternal provisioning of seed
size could reinforce or counteract the effects of frequency dependence on demographic rates.
Although our results suggest that seed size responses to conspecific frequency generally act to
reinforce seed number responses (i.e., they are positively correlated, Fig. 3.2a), some species
showed opposite seed size and seed number responses (points in the grey regions of Fig. 3.2a).
This indicates that the long-term coexistence outcome of a given pair of competing species may
be affected by complex and species-specific interactions between seed number and seed size
responses to the maternal competitive environment. For example, while negative frequency
dependence in both seed size and seed number could work in tandem to stabilize plant

CHAPTER 3: FREQUENCY-DEPENDENT MATERNAL EFFECTS
45
communities and promote coexistence, opposing seed size and number responses could negate
one another. Although the exact relationship between seed size and demographic rates remains
unknown, previous work suggests that interspecific and intraspecific variation in seed size alters
several important biological parameters, from dormancy to growth and fecundity (Westoby et al.
1996; Eriksson 1999; Germain & Gilbert 2014). Thus, the common but variable seed size
responses observed among species suggest that focusing on seed number responses alone may be
insufficient to capture the full impact of competitive interactions in the offspring generation
(Ginzburg & Taneyhill 1994; Van Allen & Rudolf 2015).
We also found important differences in the prevalence of maternal effects in response to soil
moisture conditions in competitive and non-competitive environments. Specifically, over twice
as many species altered seed provisioning in response to soil moisture in the presence of
competition (44% of species; this study, Table S3.1) compared to in the absence of competition
(21% of species; Germain & Gilbert 2014). This result is important because many tests of
maternal effects have been conducted in non-competitive environments, with individuals grown
alone in pots of soil (e.g., Aarssen & Burton 1990). Because most plants experience competition
in their natural environments, current estimates of the prevalence of maternal effects may be
conservative and most relevant to disturbed environments where plant densities are low.
Additionally, competition appears to dampen maternal effects in response to soil moisture in
some species while causing them to emerge in others (points falling in grey regions of Fig. 3.2b).
This indicates that, contrary to our initial expectations, competition does not simply exacerbate
maternal provisioning of seed size in response to soil moisture, but instead appears to alter the
nature of soil moisture’s effects on seed size in some species.
We found evidence that phylogenetic distance and biogeographic history, two characteristics of
species that have been shown to structure competitive interactions (Strauss et al. 2006; Peay et
al. 2012; Germain et al. 2016), can alter both the strength and direction of seed size provisioning
(Fig. 3.3). In a wet environment, for example, competing with a distant relative that differed in
biogeographic origin led to positive frequency dependence among species native to California,
but negative frequency dependence among species native to Spain (Fig. 3.3b). If increased
maternal investment into individual seeds results in larger, more competitive offspring, then our
results indicate that California species produce more competitive offspring when primarily
CHAPTER 3: FREQUENCY-DEPENDENT MATERNAL EFFECTS
46
competing with (i) conspecifics in the presence of a closely related Spanish competitor, or (ii)
distantly related heterospecifics of Spanish origin; the opposite is true for Spanish species.
Although studies to date have shown a general, positive effect of seed provisioning on
competition, whether this effect it is contingent on the environment or depends on the
evolutionary history of a species remains largely unexplored (reviewed in Leishman et al. 2000).
The interactive effects of biogeographic history and phylogenetic distance on maternal effects
shown here reflect the results of previous work in this system on the macroevolution of species’
competitive differences (Germain et al. 2016). From an evolutionary standpoint, our results
suggest that such maternal provisioning strategies to competition differ among plant species, but
may be shared by species from a given bioregion.
From an ecological standpoint, an intriguing hypothesis posed by Dyer et al. (2010) is that
maternal effects might contribute to the invasion success of non-native species. Our experiment
was not designed to test the role maternal provisioning plays during species invasions, but
consistent with this idea, we observe differences among regions in how competition affects
maternal provisioning of seed size. However, much of the strength and direction of frequency-
dependent maternal effects remains unexplained by macroevolutionary relationships, particularly
amongst species of the same biogeographic origin (Fig. 3.3a,c). As such, future work that
explores other differences in the biologies of species and the nature of their competitive
interactions is needed to fully understand when and why maternal effects arise (e.g., Sultan et al.
2009; Metz et al. 2015) and if species from different bioregions differ in optimal provisioning
strategies (Venable 1992).
Although this study advances our understanding of the importance of competition in structuring
maternal provisioning, there are two caveats that should be considered in interpreting our
findings. First, we were unable to identify how changes in seed size translate into differences in
offspring performance, due to the logistical infeasibility of the full factorial experiment that
would be required to test for longer-term impacts of seed size. It is possible that maternal effects
on seed size may not persist beyond the seed stage, but we have shown previously that they can
affect the size of offspring at the establishment stage in the species used here, even in the
absence of competition when such effects are considered weaker (Germain & Gilbert 2014).
Seedling recruitment is an important life stage for plants, especially under competition
CHAPTER 3: FREQUENCY-DEPENDENT MATERNAL EFFECTS
47
(Leishman et al. 2000; Goldberg et al. 2001), and thus it is likely that the advantage of larger
seeds can affect demographic rates (e.g., germination, survival, and fecundity). Second, by
focusing on seed size responses, we likely underestimate the overall prevalence of maternal
effects that can manifest in other ways, such as through germination or dormancy rates (Germain
& Gilbert 2014), or through epigenetic effects that can alter the offspring phenotype in more
complex ways (Herman & Sultan 2011). As such, this study should be viewed as an important
first step in characterizing maternal effects in competitive environments that can be used to
inform future work.
Conclusion
Our results suggest that current estimates of maternal effects in non-competitive environments
are conservative, and that frequency-dependent maternal effects have the potential to alter
competitive dynamics. We show that competition can alter maternal provisioning of seed size,
and that these maternal effects are fine-tuned to competitive differences among species, which in
turn are shaped by the abiotic environment, evolutionary history, and biogeographic origin. The
study of maternal effects has received renewed interest due to its exciting potential to explain
population- and community-level responses to heterogeneous environments (Ginzburg &
Taneyhill 1994; Van Allen & Rudolf 2013; Van Allen & Rudolf 2015). Our research suggests
new avenues for future work that would help characterize the full range and impact of maternal
effects, and sheds light on the complex nature of species interactions.
Acknowledgements
We thank C. Blackford, A. Leale, A. Mushka, B. Hall, and A. Petrie for assistance in the
greenhouse and laboratory, and J. Stinchcombe for his feedback on an earlier version of the
manuscript. Funding was provided by NSERC-CGS (R.M.G. & T.N.G.), OGS (N.T.J.), and
NSERC Discovery (B.G.).
Literature cited
Aarssen, L.W. & Burton S.M. (1990) Maternal effects at four levels in Senecio vulgaris
(Asteraceae) grown on a soil nutrient gradient. American Journal of Botany, 77, 1231–
1240.

CHAPTER 3: FREQUENCY-DEPENDENT MATERNAL EFFECTS
48
Allen, J.D. (2012) Effects of egg size reductions on development time and juvenile size in three
species of echinoid echinoderms: implications for life history theory. Journal of
Experimental Marine Biology and Ecology, 422, 72-80.
Ayala, F.J. (1971) Competition between species: frequency dependence. Science 171:820–824.
Baldeck, C.A., Harms, K.E., Yavitt, J.B., John, R., Turner, B.L., Valencia, R., Navarrete, H., et
al. 2013. Habitat filtering across tree life stages in tropical forest communities.
Proceedings of the Royal Society B: Biological Sciences, 280, 20130548.
Benton, T.G., Ranta, E., Kaitala, V. & Beckerman, A.P. (2001) Maternal effects and the stability
of population dynamics in noisy environments. Journal of Animal Ecology, 70, 590–599.
Darwin, C. (1859) On the origin of species by means of natural selection, or the preservation of
favoured races in the struggle for life. John Murray, London.
Dyer, A.R., Brown, C.S., Espeland, E.K., McKay, J.K., Meimberg, H. & Rice, J.K. (2010) The
role of adaptive trans-generational plasticity in biological invasions of plants.
Evolutionary Applications, 3, 179–192.
Elton, C. (1946) Competition and the structure of ecological communities. Journal of Animal
Ecology, 15, 54–68.
Eriksson, O. (1999) Seed size variation and its effect on germination and seedling performance
in the clonal herb Convallaria majalis. Acta Oecologica, 20, 61–66.
Fotelli, M.N., Gessler, A., Peuke, A.D. & Rennenberg, H. (2001) Drought affects the
competitive interactions between Fagus sylvatica seedlings and an early successional
species, Rubus fruticosus: responses of growth, water status and delta 13C composition.
New Phytologist, 151, 427–435.
Fridley, J.D. (2012) Extended leaf phenology and the autumn niche in deciduous forest
invasions. Nature, 485, 359–362.
Funk, J.L. & Vitousek, P.M. (2007) Resource-use efficiency and plant invasion in low-resource
systems. Nature, 446, 1079–1081.
Galloway, L.F. & Etterson, J.R. (2007) Transgenerational plasticity is adaptive in the wild.
Science, 318, 1134–1136.
Germain, R.M., Caruso, C.M. & Maherali, H. (2013) Mechanisms and consequences of water
stress-induced parental effects in an invasive annual grass. International Journal of Plant
Sciences, 174, 886–895.
Germain, R.M. & Gilbert, B. (2014) Hidden responses to environmental variation: maternal
effects reveal species niche dimensions. Ecology Letters, 17, 662–669.
Germain, R.M., Weir, J.T. & Gilbert, B. (2016) Species coexistence: macroevolutionary

CHAPTER 3: FREQUENCY-DEPENDENT MATERNAL EFFECTS
49
relationships and the contingency of historical interactions. Proceedings of the Royal
Society B: Biological Sciences, 283, 20160047.
Ginzburg, L.R. & Taneyhill, D.E. (1994) Population-cycles of forest Lepidoptera - a maternal
effect hypothesis. Journal of Animal Ecology, 63, 79–92.
Godoy, O., Kraft, N.J.B. & Levine, J.M. (2014) Phylogenetic relatedness and the determinants of
competitive outcomes. Ecology Letters, 17, 836–844.
Goldberg, D.E., Turkington, R., Olsvig-Whittaker, L. & Dyer, A.R. (2001) Density dependence
in an annual plant community: variation among life history stages. Ecological
Monographs, 71, 423–446.
Hartung, J., Knapp, G. & Sinha, B.K. (2011) Statistical meta-analysis with applications. John
Wiley & Sons Inc, Hoboken, NJ.
Herman, J.J. & Sultan, S.E. (2011) Adaptive transgenerational plasticity in plants: case studies,
mechanisms, and implications for natural populations. Frontiers in Plant Science, 2, 102.
Kendall, B.E., Fox, G.A., Fujiwara, M. & Nogeire, T.M. (2011) Demographic heterogeneity,
cohort selection, and population growth. Ecology, 92, 1985–1993.
Larios, E. & Venable, D.L. (2015) Maternal adjustment of offspring provisioning and the
consequences for dispersal. Ecology, 96, 2771–2780.
Law, R. & Watkinson, A.R. (1987) Response-surface analysis of two species competition: an
experiment on Phleum arenarium and Vulpia fasciculata. Journal of Ecology, 75, 871–
886.
Leishman, M.R., Wright, I.J., Moles, A.T. & Westoby, M. (2000) The Evolutionary Ecology of
Seed Size. Seeds: The Ecology of Regeneration in Plant Communities (ed. Fenner, M.),
pp. 31-57. CABI, Wallingford.
Levine, J.M. & HilleRisLambers, J. (2009) The importance of niches for the maintenance of
species diversity. Nature, 461, 254–257.
Marshall, D. & Uller, T. (2007) When is a maternal effect adaptive? Oikos, 116, 1957–1963.
Mayfield, M.M. & Levine, J.M. (2010) Opposing effects of competitive exclusion on the
phylogenetic structure of communities. Ecology Letters, 13, 1085–93.
Metz, J., von Oppen, J. & Tielbörger, K. (2015) Parental environmental effects due to
contrasting watering adapt competitive ability, but not drought tolerance, in offspring of a
semi-arid annual Brassicaceae. Journal of Ecology, 103, 990–997.
Miao, S.L., Bazzaz, F. & Primack, R. (1991) Persistence of maternall nutrient effects in Plantago
major: the third generation. Ecology, 72, 1634-1642.

CHAPTER 3: FREQUENCY-DEPENDENT MATERNAL EFFECTS
50
Mitchell, C.E., Agrawal, A.A., Bever, J.D., Gilbert, G.S., Hufbauer, R.A., Klironomos, J.N.,
Maron, J.L., et al. (2006) Biotic interactions and plant invasions. Ecology Letters, 9, 726–
740.
Molofsky, J., Bever, J.D. & Antonovics, J. (2001) Coexistence under positive frequency
dependence. Proceedings of the Royal Society B: Biological Sciences, 268, 273-277.
Mousseau, T.A. & Fox, C.W. (1998) Maternal effects as adaptations. Oxford University Press,
USA.
Mousseau, T.A., Uller, T., Wapstra, E. & Badyaev, A.V. (2009) Evolution of maternal effects:
past and present. Philosophical Transactions of the Royal Society B: Biological Sciences,
364, 1035–8.
Peay, K.G., Belisle, M. & Fukami, T. (2012) Phylogenetic relatedness predicts priority effects in
nectar yeast communities. Proceedings of the Royal Society B: Biological Sciences, 279,
749–758.
Roach, D.A. & Wulff, R.D. (1987) Maternal effects in plants. Annual Review of Ecology and
Systematics, 18, 209–235.
Segers, F.H.I.D. & Taborsky, B. (2011) Egg size and food abundance interactively affect
juvenile growth and behaviour. Functional Ecology, 25, 166–176.
Smart, A.J. & Moser, L.E. (1999) Switchgrass seedling development as affected by seed size.
Agronomy Journal, 91, 335-338.
Stratton, D.A. (1989) Competition prolongs expression of maternal effects in seedlings of
Erigeron annuus (Asteraceae). American Journal of Botany, 76, 1646–1653.
Strauss, S.Y., Webb, C.O. & Salamin, N. (2006) Exotic taxa less related to native species are
more invasive. Proceedings of the National Academy of Sciences, 103, 5841–5845.
Sultan, S.E., Barton, K. & Wilczek, A.M. (2009) Contrasting patterns of transgenerational
plasticity in ecologically distinct congeners. Ecology, 90, 1831–1839.
Van Allen, B.G. & Rudolf, V.H.W. (2013) Ghosts of habitats past: environmental carry-over
effects drive population dynamics in novel habitat. American Naturalist, 181, 596–608.
Van Allen, B.G. & Rudolf, V.H.W. (2015) Habitat-mediated carry-over effects lead to context-
dependent outcomes of species interactions. Journal of Animal Ecology, 84, 1646–1656.
Venable, D.L. (1992) Size-number trade-offs and the variation of seed size with plant resource
status. American Naturalist, 140, 287–304.
Weiner, J., Martinez, S., Muller-Scharer, H., Stoll, P., Schmid, B. & Society, B.E. (1997) How
important are environmental maternal effects in plants? A study with Centaurea
maculosa. Journal of Ecology, 85, 133–142.

CHAPTER 3: FREQUENCY-DEPENDENT MATERNAL EFFECTS
51
Westoby, M., Leishman, M., Lord, J., Poorter, H. & Schoen, D.J. (1996) Comparative ecology of
seed size and dispersal. Philosophical Transactions of the Royal Society B: Biological
Sciences, 351, 1309–1318

CHAPTER 4: DISPERSAL LIMITATION IN METACOMMUNITIES
52
Chapter 4
Pervasive dispersal limitation reduces diversity in an annual plant
community
Abstract
Metacommunity theory posits that dispersal among habitat patches that links local communities
is a key ‘regional’ process that maintains biological diversity. Yet, regional processes are rarely
tested in natural field conditions because the manipulations required to do so are infeasible for
most systems. In a natural serpentine grassland, we used a seed vacuum to manipulate dispersal
limitation while maintaining realistic spatial structure of species pools and environmental
conditions. We created seed banks that were mixed among thirty communities at spatial scales
varying from <1m to >10km. We found that species richness increased with the spatial scale of
seed addition, with nearly twice as many species present in plots that received seed from large
(>5km) compared to small (<5m) spatial scales. Similarly, the strength of species-environment
relationships increased with the spatial scale of seed addition, from weak associations at small
scales (R2 = 0.25, 18% of species) to strong environmental sorting at large scales (R
2 = 0.43, 38%
of species). These diversity responses to the spatial scale of seed addition were nonlinear, with
no differences both below 5m and above 5km. Further examination of naturally-occurring spatial
structure in this system suggests that these nonlinearities are generally explained by scale-
specific redundancies in environments and species pools. Our novel approach of manipulating
natural communities at different spatial scales reveals (i) nonlinear transitions in the importance
of different ecological processes, (ii) how heterogeneity in species and environments accumulate
relative to one another, and (iii) how this accumulation affects the mechanisms that structure
diversity.
Introduction
A metacommunity is colloquially defined as a “community of communities” (Gilpin & Hanski
1991), or more formally as a regional network of local communities linked by the dispersal of
their constituent species. The recognition that most communities operate as part of a larger

CHAPTER 4: DISPERSAL LIMITATION IN METACOMMUNITIES
53
metacommunity means that species diversity cannot simply be predicted by biotic and abiotic
conditions at local scales (Caley & Schluter 1997; Leibold et al. 2004). Rather, diversity is the
product of local conditions, regional dispersal that links localities, and their interaction. A large
body of theory has since been developed to understand how local and regional processes together
might structure diversity (e.g., MacArthur & Wilson 1967; Hubbell 2001; Kneital & Chase 2004;
Leibold et al. 2004; Gilbert 2012), and mesocosm experiments and observational data have
provided evidence that is consistent with specific theoretical predictions (e.g., Gilbert &
Lechowicz 2004; Cottenie 2005; Cadotte 2007).
Despite these developments, we have yet to fully understand how local and regional
determinants of diversity play out in actual natural communities, for one key reason: regional
processes, unlike local processes (e.g., Harpole & Tilman 2007), are not often amenable to
experimental manipulation in the field simply due to the inability to move most communities of
organisms. Manipulative tests of local and regional diversity are typically limited to mesocosm
experiments on communities constructed using simplified environments, species pools, or
dispersal patterns (e.g., Low-Décarie et al. 2015; see review by Grainger & Gilbert 2016).
Because it is often unclear how such simplifications affect experimental outcomes (Logue et al.
2011), mesocosm experiments allow essential tests of the range of potential outcomes under
different sets of experimental conditions but might not reflect what occurs in nature.
A feature of natural communities that is particularly difficult to replicate in experiments is the
spatial structure of processes that affect community and metacommunity diversity. Specifically,
as the spatial scale of observation increases, so too do the numbers of species and range of
environments that are sampled (Weins 1989; Lechowicz & Bell 1991) and the role that distances
among localities play in shaping the observed distributions of species (Pinto & MacDougall
2010). As a consequence, the spatial structure of the environment has been hypothesized to
constrain how species are distributed (Pinto & MacDougall 2010) and how they move across
landscapes (Bender & Fahrig 2005). However, finding new ways to combine the power of
manipulative field experiments with the biological realism of natural landscape structure can
address fundamental questions, such as: how widespread is dispersal limitation in a community
and at what spatial scales does it manifest? How strongly do species sort along environmental

CHAPTER 4: DISPERSAL LIMITATION IN METACOMMUNITIES
54
gradients in the absence of dispersal limitation? And even more basically, at what spatial extents
are communities and metacommunities most appropriately defined?
The above questions can be empirically tested by homogenizing species pools among local
communities to remove any potential dispersal limitation, and tracking the joint responses of
species richness and species-environment relationships to this manipulation (Fig. 4.1). If
dispersal limitation is widespread and the landscape is heterogeneous, then homogenization of
species pools would cause species-environment relationships to increase in strength (Fig. 4.1a) as
species are given access to suitable localities that were previously inaccessible. Alternatively, if
species are not dispersal limited and already well-matched to the environmental conditions (Fig.
4.1b), the strength of species-environment relationships should decrease even as local richness
increases. For species that are neutral in terms of environmental requirements, species-
environment relationships should not change whether species have limited dispersal (Fig. 4.1c)
or are already dispersing evenly among communities (Fig. 4.1d). The approach of homogenizing
species pools and tracking diversity responses to local conditions is similar to that taken by many
experiments that use mesocosm (e.g., Chase 2010) or field (e.g., Germain et al. 2013)
manipulations with artificial species pools (see reviews by Logue et al. 2011 and Grainger &
Gilbert 2016), but has yet to be implemented in the field with natural spatial structure in species
pools and environments.
Figure 4.1. Predicted responses of species richness (top panel) and species-environment
relationships (bottom panel) to the homogenization of the species pool, depending on whether
distance (D) or environment (E) impose limits to naturally-occurring species distributions.

CHAPTER 4: DISPERSAL LIMITATION IN METACOMMUNITIES
55
Although identifying the mechanisms that structure diversity could be achieved by comparing
communities with and without the homogenization of the regional species pool, species pools
compounded across a range of spatial scales would reveal the spatial scales at which different
mechanisms – dispersal and environmental sorting – are strongest. For example, differences in
species richness and species-environment relationships among treatments in which the spatial
scale of species pooling varies could be due to differences in the ranges of species,
environments, or both at each scale, whereas a lack of differences would indicate that a similar
range of species or environments are present across all spatial scales. There is no reason to
expect responses to change linearly with spatial scale, given that the environmental conditions
(Bell et al. 1993) and dispersal probabilities (Nathan 2006) that constrain species distributions
also scale nonlinearly with distance; Wiens (1986) refers to these nonlinear transitions in the
importance of different ecological processes as ‘domains of scale’. However, it is not known
how species and environments accumulate relative to one another with increasing spatial scale,
and how this spatial scaling affects the mechanisms that structure diversity.
We adapted the ‘hay transfer’ technique from the restoration literature (Coiffait-Gombault et al.
2010) to experimentally homogenize species pools over a range of spatial scales for entire
natural communities of serpentine-associated plants in Northern California. This technique
involved vacuuming all seed and other loose material from field plots, pooling the material
among plots occurring at five spatial scales (~1 m, 5 m, 100 m, 5 km, and 10 km), and then
redistributing it. We performed these manipulations in serpentine plant communities because the
high occurrence of annual species and patchy distribution of serpentine habitat is well-suited to
testing spatial questions (Harrison 1999) with the hay transfer method (Coiffait-Gombault et al.
2010); we refer to these manipulations as ‘seed pooling’ henceforward. In the following growing
season, we collected data on species occupancy and environmental conditions to answer four
questions: (i) how common is dispersal limitation in a metacommunity, and (ii) at what spatial
scales does it manifest? (iii) How strongly do species sort along environmental gradients once
dispersal limitation is experimentally removed? And (iv) how do scale-dependent signals of
dispersal limitation and environmental sorting correspond to the underlying spatial structure of
species pools and environmental conditions? We predicted that environmental conditions would
increasingly explain variation in species distributions as dispersal limitation is removed at

CHAPTER 4: DISPERSAL LIMITATION IN METACOMMUNITIES
56
increasing spatial scales (Fig. 4.1a). This result would support our hypothesis that diversity
patterns reflect dispersal limitation, and that given the opportunity, species sort deterministically
according to their environmental niche requirements.
Materials and methods
Study system
The field experiment was conducted at the 2800-ha McLaughlin Natural Reserve
(http://nrs.ucdavis.edu/McL/) in northern California [38.8739° N, 122.4317° W]. The region is of
a mediterranean climate, featuring cool wet winters (November-March) and hot dry summers
(April-October) with ~750 mm annual rainfall. The landscape is largely comprised of chaparral,
oak woodland, and grassland meadow habitat; common herbivores include mule deer, jack
rabbits, and pocket gophers.
The reserve lies on the San Andreas Fault, and has unique soil chemistry owing to the emergence
and erosion of the Earth’s mantle into the serpentine ultramafic soils that characterize the region.
Serpentine soils have Ca/Mg ratios < 1, as well as low levels of essential nutrients, high heavy
metal content, and poor soil moisture retention. Although these growing conditions are typically
harmful to plant growth, serpentine soils support a unique and diverse flora of native species that
have specialized to tolerate those harmful conditions (Whittaker 1954; Anacker 2014). As a
result, serpentine soils are hypothesized to act as spatial refugia for native species to escape the
competitive effects of exotic European species that now dominate Californian landscapes (e.g.,
Avena spp., Bromus spp. Centaurea solstitialis). Serpentine and non-serpentine soils frequently
occur in close proximity at the McLaughlin reserve (Fig. S4.5), with dense swards of
competitively dominant exotic species in non-serpentine soils likely limiting dispersal among
serpentine sites (Gilbert & Levine 2013).
We focused specifically on serpentine meadow habitat, and observed 113 species in our plots out
of a potential pool of the 310 species that occur in all habitat types at the reserve; 73 of the 113
species were annual plants (Table S4.1). The four most common species observed in
unmanipulated plots were Vulpia microstachys (89% of sites), Hemizonia congesta (79%),
Plantago erecta (69%), and Lasthenia californica (52%). Sixteen of the 113 total species could

CHAPTER 4: DISPERSAL LIMITATION IN METACOMMUNITIES
57
not be identified or classified as having an annual or perennial life history and were thus
excluded from all analyses; however, these individuals only occurred at single sites and are thus
unlikely to have large effects on diversity patterns.
Experimental setup
In May 2013, we surveyed the reserve for 30 serpentine meadow sites. Site locations were
chosen such that they could be hierarchically grouped at five spatial scales, which resulted in
three groups of five sites each at the northwest and southeast ends of the reserve (Fig. S4.1).
Within each site, we flagged and GPS located eight 0.75 × 0.75 m plots arranged in 2 x 4 block
of plots, with plots separated by 1 m of bare ground. Each plot in a block was randomly assigned
to receive a different experimental treatment (discussed below). In total, there were 240 plots
(eight plots x 30 sites) and five spatial scales for comparison (at the level of the plot [1m], block
of plots at a site [5 m], group of sites [100m], reserve half [5 km], and whole reserve [10 km];
Fig. S4.1).
In late July 2013, once all winter annual species senesced and the majority of summer annual
species had set seed, we harvested all seed and standing vegetation from seven of the eight plots
at each site using garden shears and a powerful gas-powered leaf vacuum (Stihl BG86); the
eighth plot (C2; Fig. S4.1b) was left unaltered to evaluate any unintended effects of the
vacuuming procedure on plant diversity. All collected materials were stored outdoors in paper
bags to allow natural heat stratification until they could be processed (< six weeks).
All collected materials were reintroduced to the seven vacuumed plots per site in two control and
five seed pooling treatments (see Fig. S4.1b). The control treatments were as follows: a ‘vacuum
without replacement’ treatment (C1), to identify individuals that were left behind following
vacuuming, and a ‘vacuum without movement’ treatment (C3), where the collected material was
homogenized at the plot-level and redistributed back onto the source plot. The five spatial
scaling treatments involved the pooling, homogenization, and redistribution of material collected
from either a single plot (1 m; blue plot in Fig. S4.1b), multiple plots at a site (5 m; green plot),
five sites of a single group (100 m; yellow plot), 15 sites from the same half of the reserve (5 km;
orange plot), all 30 sites across the entire reserve (10 km; red plot). The redistributed material
was secured to each recipient plot with jute twine and landscape staples rather than mesh

CHAPTER 4: DISPERSAL LIMITATION IN METACOMMUNITIES
58
(Coiffait-Gombault et al. 2010) to minimize damage to flowering plants and the risk of trapping
vertebrates.
We surveyed the plot-level community structure and corresponding environmental parameters
during peak biomass in the following growing season. Plots were surveyed April 20 to May 2,
2014, using % cover estimates of each species, since small-statured annuals can occur at
densities up to 5500 individuals m-2
(Bartolome 1979); additional surveys were conducted later
in the season to confirm the identities of late-flowering species. We surveyed the innermost 0.5 ×
0.5 m2 of each plot to account for any edge effects in our analyses. We measured plot-level %
soil moisture content, understory light availability in full sun (PAR), and slope inclination, as
well as site-level elevation, slope aspect, hillside slope steepness, and soil depth; soil moisture
measurements were taken three days after heavy rainfall as a measure of soil moisture retention.
We also performed site-level soil fertility analyses (NO3-N, Olsen-P, X-K, X-Na, X-Ca, X-Mg,
pH, cation exchange capacity, organic matter; UC Davis Analytical Lab) on soil samples
collected and pooled between four plots per site. X-Ca and X-Mg were converted to a ratio of
Ca/Mg. Although site-level estimates of environmental conditions preclude finer-scale estimates,
those variables for which we do have plot-level estimates showed no difference among plots that
occur at the same site (all P > 0.35, Table S4.2).
Data analysis
A presence-absence matrix was created for all 73 annual species in 29 of the 30 sites that were
sampled; data from one site was lost due to a corrupt data file. We used presence-absence data,
rather than an abundance-based estimate, because it is most appropriate for tracking gains and
losses of species (Gilpin & Hanski 1991) in response to manipulations of species pools. The R
package ‘vegan’ was used to create a distance matrix of Jaccard coefficients for all pairwise plot
combinations. A principal coordinates analysis (PCoA) was then performed on this distance
matrix to track changes in species composition, as summarized by the first two axis scores,
among sites and treatments.
We tested the responses of three components of diversity to our species pool manipulations using
linear mixed effects models in the ‘lmerTest’ R package. Species richness, evenness, and
composition (PCoA axis 1 and 2 scores) were response variables in separate analyses, each with

CHAPTER 4: DISPERSAL LIMITATION IN METACOMMUNITIES
59
spatial seed pooling treatment as a fixed factor and plot nested within site as a random factor.
Because the spatial seed pooling treatment emerged as a significant predictor in all analyses, we
used post-hoc Tukey tests using the ‘multcomp’ package to identify treatment levels that differed
significantly from each other. For species composition, the axis scores summarized a low but still
meaningful proportion of the species composition data (axis 1 = 9.7%, axis 2 = 7.2%; Fig. S4.2).
Prior to testing the responses of species-environment relationships to our seed pooling
treatments, we used complementary multivariate methods in R package ‘vegan’ to reduce the
dimensionality of the environmental variables that were measured. First, we used variance
inflation factors to confirm that multicollinearity was low (VIFs < 10, Neter et al. 1989), and
performed a constrained correspondence analysis (CCA), forward selecting environmental
variables using R function ‘ordistep’, to identify the subset of environmental variables that
significantly influenced species occurrences (all but soil depth). Second, we ran a principal
component analysis (PCA) on the subset of environmental variables identified as meaningful in
the CCA. A screeplot of the PCA output identified the first two axes as interpretable compared to
the commonly-used broken-stick null model (Jackson 1993), with the axis 1 and 2 scores of the
PCA summarizing 51.4% of the variation in the among-site environmental dataset.
We used the first (PCA1) and second (PCA2) PCA axis scores as composite environmental
variables to examine how the seed pooling treatments affected the strength of community- and
species-level responses to environment. To examine community responses as a whole, we first
performed a generalized linear mixed effects (glme) model, with species occurrences as the
binomially-distributed response variable, PCA1, PCA2, species, seed pooling treatment, and
their interactions as fixed effects, and plot nested within site as random effects. The R function
‘drop1’ was sequentially applied until the model that best explained variation in our dataset was
obtained (Table S3). Because the PCA1*species, PCA2*species, and PCA1*PCA2*treatment
interactions were significant, we analyzed each seed pooling treatment separately in a glm with
PCA1*species and PCA2*species predictor variables. We then compared the amount of variation
explained by composite environmental conditions among seed pooling treatments, with the
prediction that R2 values should increase with the spatial scale of seed pooling. ‘Species’ was a
fixed factor in these analysis to facilitate model convergence and because we were directly

CHAPTER 4: DISPERSAL LIMITATION IN METACOMMUNITIES
60
interested in the amount of variation explained (R2) by species-specific differences in responses
to environmental conditions and not tests of significance per se.
To further examine species-level responses (i.e., how strongly the occurrences of each species
are associated with environmental conditions), we performed separate generalized linear models
for each species and seed pooling treatment, testing the additive effects of PCA1 and PCA2. We
then summed the percentage of species that significantly responded to the environmental
gradient in each treatment, and compared this percentage to the 5% false-discovery rate expected
by chance given the number of tests performed. Because species varied in their post-
manipulation associations with environmental conditions, we tested whether this significance
was tied to differences among species in regional occupancy (# of the 30 sites a species occurred
in) prior to manipulation. To do this, we used a glm with the presences or absences of significant
associations with the environment for all species as the binomially-distributed response variable,
as a function of log-transformed regional occupancy with a second-order polynomial to allow for
a hump-shaped relationship. Allowing for a hump was important because a given species might
poorly associate with the environment because it is either extremely rare or extremely common.
To quantify similarity among sites in environments and species that occurred naturally at distinct
spatial scales, we performed separate permutational multivariate analyses of variance (‘adonis’
function in R package ‘vegan’); this analysis is analogous to a univariate analysis of variance,
except expanded to handle multivariate response variables. The response variables were matrices
of Euclidian (for environment) and Jaccard (for species) distances among sites, and each matrix
was tested for differences among groups of five sites (100 m scale) nested within each half of the
reserve (5 km scale). The species distance matrix was created from plots that received the 1 m
treatment only, as this treatment most closely reflects natural species distributions.
The control plots were used to assess the presence of any unintended effects of the hay transfer
manipulation that were unrelated to the seed pooling treatment. We found no difference in
species richness or composition between the unmanipulated (C2 in Fig. S4.1) plots and our 1 m
treatment plots (all P > 0.998), indicating that the hay transfer manipulation did not affect local
diversity. Similarly, there was no difference among plots that received its own hay back (C3) and
the 1 m treatment plots that received hay from a different adjacent plot (all P > 0.807). As a

CHAPTER 4: DISPERSAL LIMITATION IN METACOMMUNITIES
61
result, we only report the results from the 1 m treatment plots. The removal without replacement
control plot (C1) had significantly lower species richness than the unmanipulated control plot
(C2) and all treatment plots (all P < 0.002) indicating that are seed vacuum was effective.
Results
Plot-level species richness increased with the spatial scale of seed pooling (F4,112 = 72.4, P <
0.001; Fig. 4.2a), from 11.4 ± 0.73 species (mean ± standard error) in the 1 m treatment to 22.5 ±
1.01 species in the 10 km treatment (Fig. 4.2a). This increase was sigmoidal rather than linear,
with no significant differences in species richness between the two smallest (1 and 5 m; P =
0.98) or the two largest (5 and 10 km; P = 0.68) spatial scales, but highly significant (all P <
0.001) differences among small (≤5 m), intermediate (100 m), and large (≥5 km) spatial scales.
Figure 4.2. Effect of spatial scale of seed pooling on (a) species richness (mean ± se) and (b) the
strength of species-environment relationships (R2 values); observed patterns correspond to
prediction in Fig. 4.1a. Points with the same letter were not significantly different in a multiple
comparisons test.
In an analysis that included all 73 annual species observed in our study, we found the proportion
of variance explained (marginal R2) by our models increased from 0.25 to 0.43 with increasing
spatial scale of seed pooling (Fig. 4.2b). In considering each species separately, we found that
the occurrences of 18% of species were significantly predicted by environmental conditions
when seeds were distributed locally (at 1 m scales). As the spatial scale of seed pooling

CHAPTER 4: DISPERSAL LIMITATION IN METACOMMUNITIES
62
increased, so too did the percentages of species whose occurrences were significantly associated
with environmental conditions, which peaked at 38% in the second largest spatial scale (Fig.
S4.3)—these significantly-associated species tended be those that occurred at intermediate but
not high or low abundances prior to manipulation (a significant hump-shaped relationship; Χ2 =
9.62, P = 0.008, Fig. 4.4). Taken together, our results show concordance in the effects of seed
pooling on the effects of environmental conditions when species are considered as a community
and separately.
In addition to plot-level species richness (α-diversity), we tested the effects of our seed pooling
treatments on other components of diversity. Species composition was distinct among treatments
at the same spatial scales of seed pooling as species richness, with sigmoidal responses in the
axis 1 and 2 PCoA scores (Fig. 4.3a). These axes were significantly associated with forty-two
plant species (P < 0.05), including many endemic serpentine-associated species (e.g., Clarkia
gracilis, Collinsia sparsiflora, and Navarretia jepsonii). The compositional shifts translated into
a sigmoidal decrease in among-plot species dissimilarity (β-diversity), from 0.80 to 0.55
dissimilarity in comparing the 1 m to 10 km spatial scaling treatments (Fig. 4.3b). Site
occupancy (the number of sites occupied by each species) also increased with the spatial scale of
seed pooling (Fig. S4.4), as did community evenness due to the increasing occurrences of
regionally rare species (shallower slope, Fig. S4.4). The size of the regional species pool (γ-
diversity) was not affected by the seed pooling treatments, with a mean pool size of 60.0 ± 0.8
standard error across treatments (x-intercept in Fig. S4.4). Not all 73 species were observed in all
treatments; on average, each treatment had 1.2 species (± 0.58 standard error) that were not
observed in any other treatment.

CHAPTER 4: DISPERSAL LIMITATION IN METACOMMUNITIES
63
Figure 4.3. Effect of spatial scale of seed pooling on (a) species composition and (b) the
compositional dissimilarity of plots (β-diversity). Species composition is from the first axis
scores from a PCoA with Jaccard’s dissimilarity index (see biplot in Fig. S4.4a); results with
second axis scores are qualitatively similar. Points with the same letter were not significantly
different in a multiple comparisons test.
Figure 4.4. Frequency distribution of site occupancies of all species (gray bars) and species that
were significantly associated with the environment (black bars). The red line is the fitted
relationship between the proportion of species with significant species-environment relationships
and site occupancy; this relationship is a significantly hump-shaped (P = 0.008). Note that the x-
axis is on a log-scale.

CHAPTER 4: DISPERSAL LIMITATION IN METACOMMUNITIES
64
We found differences in the naturally-occurring spatial structure of environmental conditions and
species pools that inform our interpretation of the observed diversity responses to our
manipulations. Environmental conditions significantly differed between halves of the reserve (5
km scale; F = 247.68, P = 0.001) and among groups of sites within halves (100 km scale; F =
14.05, P = 0.001), with little overlap in environmental conditions among halves of the reserve
(Fig. 4.5a). Variation in environmental conditions was greater in the south half of the reserve,
possibly due to the greater spatial spread of these sites. Although these are site-level estimates,
for those environmental variables that we do have multiple within-site measurements (5 m scale),
there were no statistically significant differences among plots that occur at the same site (all P >
0.3, Table S4.2) as expected given the biology of serpentine soils.
Figure 4.5. Natural differences among halves of the reserve in (a) environmental conditions
(from a PCA) and (b) species composition (from a PCoA). The contours outline the bivariate
normal distributions of each half of the reserve; dashed contours/upwards triangles are sites that
occur in the north half, solid contours/downwards triangles are sites that occur in the south half.
Environmental conditions (P = 0.001) but not species (P = 0.175) differed significantly between
halves (see Results).
In contrast to environmental conditions, the composition of species significantly differed among
the groups of five sites (100 m scale; F = 1.96, P = 0.001) but not between halves of the reserve
(5 km scale; F = 1.26, P = 0.168; Fig. 4.5b). Despite their lack of differences in species

CHAPTER 4: DISPERSAL LIMITATION IN METACOMMUNITIES
65
composition, the two halves of the reserve had 37 species in common, but also 12 species that
were unique to the north half and 11 that were unique to the south half; these numbers sum to
less than 73 because some species were not observed in the 1 m treatment. These unique species
were significantly less associated with the axis 1 and 2 PCoA scores than species that were
common to both halves (P = 0.023), which potentially reconciles the high compositional
similarity among halves of the reserve despite the presence of unique species. We discuss the
biological interpretation of this point in the discussion.
Discussion
Many studies seek to identify and compare the factors that constrain species distributions across
landscapes, commonly through controlled experiments or statistical partitioning of observational
data. In a natural metacommunity, our seed pool manipulations resulted in two key findings: (i)
compared to natural patterns, the strength of environmental matching doubles when seeds were
distributed at large spatial scales, and (ii) non-linear diversity responses to the spatial scale of
seed pooling suggests that there are distinct transitions among spatial scales in the forces that
structure diversity. Our findings provide novel insight into how metacommunities and their
constituent species are structured across landscapes, and how that structure is constrained by
distance and the environment.
In the absence of seed pooling, most species in our study (~82%) were not significantly
associated with environmental conditions, consistent with the findings of numerous studies of
individual species (e.g., Borcard et al. 2004; Ramette & Tiedje 2007). This result might be
surprising to many ecologists, given the ubiquity of experimental work demonstrating the
strength of environmental determinants of species’ performances and the composition of
communities (e.g., Harpole & Tilman 1997; Silvertown et al. 2006). However, this type of
observational evidence alone cannot be used to identify the mechanisms underlying the pervasive
lack of environmental associations across species that we observed. The experimental
enhancement of dispersal via seed pool manipulations has allowed us to discriminate among
several potential mechanisms (Fig. 4.1), and supports a model in which dispersal limitation
precludes the colonization of suitable sites. Similar results have been obtained in the canary
violet (Viola praemora) using seed addition trials (Pinto & MacDougall 2010); we extend this

CHAPTER 4: DISPERSAL LIMITATION IN METACOMMUNITIES
66
perspective beyond individual species to an entire plant community, and show a doubling in the
strength of species-environment relationships (Figs. 4.2b and S4.3) that explains nearly half of
the variation in how species are distributed (Fig. 4.2b). Further work is needed to understand the
factors that determine the distributions of species that remain poorly associated even after
dispersal limitation is removed.
Although not a characteristic of species themselves, we found a clear hump-shaped relationship
between the abundance of species pre-manipulation and how well-matched those species are to
the environment post-manipulation (Fig. 4.4). This makes intuitive sense, given that species
abundance is tied to the relative number of seeds it contributes to the seed pool. For rare species,
this means that seeds have a low probability of ending up in suitable sites when species pools are
homogenized, whereas common species have a high probability of ending up in all sites
regardless of suitability; the latter case could lead to transient or persistent establishment in low
suitability sites (Mouquet & Loreau 2003). Furthermore, the regional abundance of a given
species is in part determined by its degree of environmental specialization simply because
generalists can persist in more sites than specialists. For example, specialist Castilleja
rubicundula occurred in a single site of unusually high percent soil moisture (27.7%, compared
to 13.5% among-site mean ± 0.87 standard error), and was not significantly matched to
environmental conditions. These abundance-based effects are in part an artifact of our seed
pooling manipulation, but are analogous to what would occur in a metacommunity of species
that differ in propagule supply (Hurtt & Pacala 1995) and degree of specialization (Pandit et al.
2009).
Nearly all components of diversity that were examined showed consistent, nonlinear responses to
the spatial scale of seed pooling, including species richness (α diversity), species-environment
relationships, and compositional turnover (β diversity). In all cases, there were no differences in
responses between 1 and 5 m or 5 and 10 km spatial scales of seed pooling, but large differences
among <5 m, 100m, and >5 km, a result that is best explained by first considering the geology of
how serpentine soils are formed. Serpentine soils occur along fault lines and are formed by the
emergence and erosion of the Earth’s mantle; repeated events of emergence and erosion form a
mosaic of soils that are distinct in biochemistry and occur within a matrix of non-serpentine soil.
The resulting landscape is characterized by abrupt transitions in environmental conditions (see

CHAPTER 4: DISPERSAL LIMITATION IN METACOMMUNITIES
67
photo in Fig. S4.5b), unlike systems where differences accumulate linearly across space
(Lechowicz & Bell 1991).
For plants, the unique geological history of serpentine systems has scale-specific consequences
for natural diversity patterns and responses to our seed pool manipulations. At small spatial
scales (<5 m), conditions are essentially homogenous and within the dispersal abilities of most
plant species in one or few generations (Thomson et al. 2011); our seed pool manipulations had
negligible effects at this scale. At intermediate scales (100 m), our manipulations forced seeds to
cross the boundaries of serpentine outcrops into environments that were highly dissimilar from
their source sites; this allowed the establishment of some species with broad environmental
tolerances. At large scales (>5 km), seeds were sampled from and allowed to access a broad suite
of conditions represented by many serpentine outcrops (Fig. 4.5a); our manipulations caused
diversity to respond at these scales because species were given access to suitable sites in which
they had previously been absent. Together, our evidence indicates that the non-linearity we
observed is tied to the probability that species will encounter suitable sites at each scale as
determined by the underlying structure of the environment.
A common challenge faced by ecologists is identifying the spatial scales at which
metacommunities are most appropriately delineated (Logue et al. 2011), given that the
appropriateness of these delineations are not easily testable (Thuiller et al. 2015) or comparable
among different study systems. In our experiment, we made no assumptions about the spatial
scales at which different ecological processes were operating, and instead tested a range of
spatial scales for signatures of community and metacommunity limits. Our results support the
delineation of regional metacommunities at scales of ~5 km due to the lack of diversity and
species-environment responses to our manipulations above this scale, results that are striking
given that the numbers of seeds that were pooled essentially doubled between the 5 and 10 km
scale. In other words, the imprint of dispersal limitation would not be observed at spatial extents
above 5 km, a conclusion that is concordant with a recent paper on plant metacommunities in the
French Alps (Thuiller et al. 2015). It is important to keep in mind that although these results are
specific to this particular study system, this study provides rare insight into the spatial
delineations of communities and metacommunities in an area that is considered a model system
for biodiversity research (Harrison & Rajakaruna 2011).

CHAPTER 4: DISPERSAL LIMITATION IN METACOMMUNITIES
68
A limitation of this study is that the data was collected a year after our seed pooling
manipulations were carried out. This means that the diversity patterns we observed are not in an
equilibrium state, and may or may not persist through time. For example, source-sink dynamics
or competitive interactions could be of heightened or diminished importance in this first year
compared to subsequent years, respectively; our results suggest that these concerns are unlikely
to apply to our system. For example, the increase in species-environment relationships at larger
scales, when one might expect homogenizing source-sink effects to overwhelm any
environmental signal, is indicative of the interplay between dispersal limitation and
environmental heterogeneity that characterizes serpentine landscapes. Competitive interactions
tend to be strongest at the seedling stage (Goldberg et al. 2001), suggesting that our
measurements at peak biomass would not obscure the impacts of competition.
The forces that dictate how species are distributed across landscapes have long fascinated
ecologists. In the serpentine system, we used a novel method to identify scale-specific processes
that structure natural plant communities, and how this spatial scaling is explained by the
accumulation of species and environments across space. Because environmental conditions are
tightly linked to the geology of this system, our results highlight the role that geological
complexity plays in the maintenance of diverse species assemblages in a global biodiversity
hotspot. The role of geological complexity (or environmental complexity in general) has been
long-recognized by evolutionary biologists as a mechanism for the generation of biological
diversity (Golberg et al. 2011; Anacker & Strauss 2013; Cacho & Strauss 2014). Our work offers
the ecological counterpart on the forces that maintain diverse assemblages of species en route to
evolutionary change.
Acknowledgements
We thank Susan Harrison, Brian Anacker, Cathy Kohler, Caprice Lee, Erica Case, Stella
Copeland, Paola Arenas, and Laurren Sergison for advice and/or assistance in the field, and
Strauss and Gilbert lab members for project feedback. Funding to R. M. G. provided by NSERC-
CGS D (personal), NSERC-MSFSS (research), and Sigma Xi (research).

CHAPTER 4: DISPERSAL LIMITATION IN METACOMMUNITIES
69
Literature cited
Anacker, B.L. (2014) The nature of serpentine endemism. American Journal of Botany, 101,
219-224.
Anacker, B.L. & Strauss, S.Y. (2013) The geography and ecology of plant speciation: range
overlap and niche divergence in sister species. Proceedings of the Royal Society B:
Biological Sciences, 281, 1-9.
Borcard, D., Legendre, P., Avois-Jacquet, C. & Tuomisto, H. (2004) Dissecting the spatial
structure of ecological data at multiple scales. Ecology, 85, 1826-1832.
Bartolome, J.W. (1979) Germination and seedling establishment in California annual grassland.
Journal of Ecology, 67, 273–281.
Bell, G., Lechowicz, M.J., Appenzeller, A., Chandler, M. & DeBlois, E. (1993) The spatial
structure of the physical environment. Oecologia, 96, 114-121.
Bender, D.J. & Fahrig, L. (2005) Matrix structure obscures the relationship between interpatch
movement and patch size and isolation. Ecology, 86, 1023-1033.
Cacho, N.I. & Strauss, S.Y. (2014) Occupation of bare habitats, an evolutionary precursor to soil
specialization in plants. Proceedings of the National Academy of Sciences, 111, 15131-
15137.
Caley, M.J. & Schluter, D. (1997) The relationship between local and regional diversity.
Ecology, 78, 70–80.
Cadotte, M.W. (2007) Concurrent niche and neutral processes in the competition-colonization
model of species coexistence. Proceedings of the Royal Society B: Biological Sciences,
274, 2739-2744.
Chase, J.M. (2010) Stochastic community assembly causes higher biodiversity in more
productive environments. Science, 328, 1388-1391.
Coiffait-Gombault, C., Buisson, E. & Dutoit, T. (2010) Hay transfer promotes establishment of
Mediterranean steppe vegetation on soil disturbed by pipeline construction. Restoration
Ecology, 19, 214–222.
Cottenie, K. (2005) Integrating environmental and spatial processes in ecological community
dynamics. Ecology Letters, 8,1175-1182.
Germain, R.M., Johnson, L., Schneider, S., Cottenie, K., Gillis, E.A. & MacDougall, A.S. (2013)
Stochastic variability in plant predation determines the strength of stochastic community
assembly. American Naturalist, 182, 169-179.
Gilbert, B. & Lechowicz, M.J. (2004) Neutrality, niches, and dispersal in a temperate forest
understory. Proceedings of the National Academy of Sciences, 101, 7651-7656.

CHAPTER 4: DISPERSAL LIMITATION IN METACOMMUNITIES
70
Gilbert, B. & Levine, J.M. (2013) Plant invasions and extinction debts. Proceedings of the
National Academy of Sciences, 110, 1744–1749.
Gilpin, M.E. & Hanski, L.A. (1991) Metapopulation Dynamics: Empirical and Theoretical
Investigations. Academic Press, San Diego.
Goldberg, D.E., Turkington, R., Olsvig-Whittaker, L. & Dyer, A.R. (2001) Density dependence
in an annual plant community: variation among life history stages. Ecological
Monographs, 71, 423-446.
Grainger, T.N. & Gilbert, B. (2016) Dispersal and diversity in metacommunities: linking theory
and practice. Oikos early view: 10.5061/dryad.nq853
Harpole, W.S. & Tilman, D. (2007) Grassland species loss resulting from reduced niche
dimension. Nature, 446, 791-793.
Harrison, S. (1999) Local and regional diversity in a patchy landscape: native, alien, and
endemic herbs on serpentine. Ecology, 80, 70–80.
Hubbell, S. (2001) The unified neutral theory of biodiversity and biogeography. Princeton
University Press, Princeton.
Hurtt, G.C. & Pacala, S.W. (1995) The consequences of recruitment limitation: reconciling
chance, history and competitive differences between plants. Journal of Theoretical
Biology, 176, 1–12.
Harrison, S. & Rajakaruna, N. (2011) Serpentine: The Ecology and Evolution of a Model System.
University of California Press, Berkeley, CA.
Jackson, D.A. (1993) Stopping rules in principal components analysis: a comparison of
heuristical and statistical approaches. Ecology, 74, 2204-2214.
Kneital, J.M. & Chase, J.M. (2004) Trade-offs in community ecology: linking spatial scales and
species coexistence. Ecology Letters, 7, 69-80.
Lechowicz, M.J. & Bell, G. (1991) The ecology and genetics of fitness in forest plants. II.
Microspatial heterogeneity of the edaphic environment. Journal of Ecology, 79, 687-696.
Leibold, M.A., Holyoak, M., Mouquet, N., Amarasekare, P., Chase, J.M., Hoopes, M.F., Holt,
R.D., Shurin, J.B., Tilman, D., Loreau, M. & Gonzalez, A. (2004) The metacommunity
concept: a framework for multi-scale community ecology. Ecology Letters, 7, 601-613.
Logue, J.B., Mouquet, N., Peter, H. & Hillebrand, H. (2011) Empirical approaches to
metacommunities: a review and comparison with theory. Trends in Ecology and
Evolution, 26, 482-491.

CHAPTER 4: DISPERSAL LIMITATION IN METACOMMUNITIES
71
Lowe-Decarie, E., Kolber, M., Homme, P., Lofanom A., Dumbrell, A., Gonzalez, A. & Bell, G.
(2015). Community rescue in an experimental metacommunity. Proceedings of the
National Academy of Sciences, 112, 14307-14312.
MacArthur, R.H. & Wilson, E.O. (1967) The Theory of Island Biogeography. Princeton
University Press, Princeton.
Mouquet, N. & Loreau, M. (2003) Community patterns in source-sink metacommunities.
American Naturalist, 162, 554-557.
Nathan, R. (2006) Long-distance dispersal of plants. Science, 313, 786-788.
Pandit, S., Kolasa, J. & Cottenie, K. (2009) Contrasts between habitat generalists and specialists:
an empirical extension to the basic metacommunity framework. Ecology, 90, 2253-2262.
Pinto, S.M. & MacDougall, A.S. (2010) Dispersal limitation and environmental structure interact
to restrict the occupation of optimal habitat. American Naturalist, 175, 675–686.
Ramette, A. & Tiedje, J.M. (2007) Multi-scale responses of microbial life to spatial distance and
species sorting in a patchy ecosystem. Proceedings of the National Academy of Sciences,
104, 2761-2766.
Silvertown, J., Poulton, P., Johnston, E., Edwards, G., Heard, M. & Biss, P.M. (2006) The Park
Grass experiment 1856-2006: its contribution to ecology. Journal of Ecology, 94, 801-
814.
Thomson, F.J., Moles, A.T., Auld, T.D. & Kingsford, R.T. (2011) Seed dispersal distance is
more strongly correlated with plant height than with seed mass. Journal of Ecology, 99,
1299-1307.
Thuiller, W., Pollock, L.J., Gueguen, M. & Münkemüller, T. (2015) From species distributions
to metacommunities. Ecology Letters, 18, 1321-1328.
Weins, J.A. (1989) Spatial scaling in ecology. Functional Ecology, 3, 385-397.
Whittaker, R.H. (1954) The ecology of serpentine soils. Ecology, 35, 258–288.
Neter, J., Wasserman, W. & Kutner, M.H. (1989) Applied Linear Regression Models, 2nd
edition.
Irwin Homewood, IL.

CHAPTER 5: MACROEVOLUTION AND COMPETITIVE DIVERGENCE
72
Chapter 5
Species coexistence: macroevolutionary relationships and the
contingency of historical interactions
Published as Germain, R.M., Weir, J.T. & B. Gilbert. 2016. Species coexistence:
macroevolutionary relationships and the contingency of historical interactions. Proceedings of
the Royal Socierty B: Biological Sciences, 283, 20160047.
Abstract
Evolutionary biologists since Darwin have hypothesized that closely related species compete
more intensely and are therefore less likely to coexist. However, recent theory posits that species
diverge in two ways: either through the evolution of ‘stabilizing differences’ that promote
coexistence by causing individuals to compete more strongly with conspecifics than individuals
of other species, or through the evolution of ‘fitness differences’ that cause species to differ in
competitive ability and lead to exclusion of the weaker competitor. We tested macroevolutionary
patterns of divergence by competing pairs of annual plant species that differ in their phylogenetic
relationships, and in whether they have historically occurred in the same region or different
regions (sympatric vs. allopatric occurrence). For sympatrically-occurring species pairs,
stabilizing differences rapidly increased with phylogenetic distance. However, fitness differences
also increased with phylogenetic distance, resulting in coexistence outcomes that were
unpredictable based on phylogenetic relationships. For allopatric species, stabilizing differences
showed no trend with phylogenetic distance, whereas fitness differences increased, causing
coexistence to become less likely among distant relatives. Our results illustrate the role of
species’ historical interactions in shaping how phylogenetic relationships structure competitive
dynamics, and offer an explanation for the evolution of invasion potential of non-native species.
Introduction
The diversity of ecological interactions on Earth is the product of ~3.5 billion years of evolution,
with ongoing extinctions matched by the continual divergence of populations and species.
Signatures of this past evolution frequently emerge in the strength of the interactions among

CHAPTER 5: MACROEVOLUTION AND COMPETITIVE DIVERGENCE
73
current-day species (Peay et al. 2012) in ways that have potential to further perpetuate
divergence and the evolution of interaction strengths (Meyer & Kassen 2007). This dynamic
feedback between the ecology and evolution of organisms is a central theme in
microevolutionary (Gravel et al. 2011; Zuppinger-Dingley et al. 2014), macroevolutionary
(Mahler et al. 2013), and recent ecological perspectives (Johnson & Stinchcombe 2007; Webb et
al. 2002 ; Schoener 2011), as it promises a more complete picture of the processes that generate
and maintain biological diversity.
A longstanding hypothesis in evolutionary biology states that closely related species are more
ecologically similar, and that this similarity leads to intense competition and ultimately exclusion
(Webb et al. 2002; Darwin 1859; Elton 1946; Harper et al. 1961). Despite abundant evidence
that closely related species tend to be similar in terms of functional traits and resource
requirements (Violle et al. 2011), the effect of evolutionary relatedness on the outcome of
competition tends to be weak or absent in experimental (Cahill et al. 2008) and observational
(Anderson et al. 2011; Vamosi et al. 2009) tests. This might occur for two reasons: First,
contemporary ecological theory (Chesson 2000; Mayfield & Levine 2010) suggests that species
may evolve two types of differences, ‘stabilizing differences’ and ‘fitness differences’, that have
opposing effects on competitive outcomes. Stabilizing differences, also known as ‘niche
differences’ (Mayfield & Levine 2010), promote coexistence by causing negative-frequency
dependence in interacting species, and act to stabilize diversity by preventing any one species
from dominating the community. Fitness differences, by contrast, are inequalities in mean
fitness, including intrinsic demographic rates and competitive abilities, which preclude
coexistence by favoring a single dominant species (Chesson 2000; Mayfield & Levine 2010).
Because character displacement may cause species to diverge in both stabilizing differences and
fitness differences, the relationship between coexistence and evolutionary time depends on their
relative evolutionary trajectories (Mayfield & Levine 2010; Narwani et al. 2013; Godoy et al.
2014).
The second reason for inconsistent effects of evolutionary relationships on coexistence and
diversity might stem from the high occurrence of non-native species in many contemporary
communities. Research on coevolution and adaptive radiations predicts that the divergence of
related species depends on a history of competitive interactions, and therefore on whether species

CHAPTER 5: MACROEVOLUTION AND COMPETITIVE DIVERGENCE
74
have historically occurred in sympatry or in allopatry (Abrams 1986; Thompson 1999; Dayan &
Simberloff 2005). By occurring in sympatry, we refer to the idea that species have had ample
opportunity to interact and potentially influence evolutionary trajectories, rather than a specific
mode of speciation. For the vast majority of taxa, evolutionary histories are not sufficiently
documented to know when species historically occurred in sympatry or allopatry. However,
information on species’ native status in a region and current-day distributional overlap can be
used to identify species with a history of potential interaction; interactions between pairs of
species native to either the same or different regions can therefore be contrasted as a proxy for
the influence of coevolutionary history.
We grew 30 Mediterranean annual plant species both alone and in two-species competition to
estimate stabilizing and fitness differences (Godoy & Levine 2014) in two commonly
encountered environments (wet and dry), and used phylogenetic relationships among species
pairs to test whether the evolutionary trajectories of stabilizing differences, fitness differences,
and coexistence depend on coevolutionary history. We predicted that stabilizing differences
would increase rapidly and predictably with phylogenetic distance among species pairs that have
occurred in sympatry, whereas fitness differences would be constrained (e.g., red queen
hypothesis (Stenseth 1979) and competitive disarmament (Kisdi & Geritz 2001)). In contrast, we
predict a weak or absent relationship between stabilizing differences and phylogenetic distance
for allopatric species, due to the lack of coevolutionary history, and no constraints on fitness
differences. These predictions would correspond to positive and negative relationships between
coexistence and phylogenetic distance, depending on whether species pairs originated from the
same or different biogeographic region, respectively.
Materials and methods
Species selection
Species were selected to meet two criteria: First, species of the same biogeographic origin must
have had common affinities for annual grasslands and overlapping geographic distributions
across their native ranges, as determined by CalFlora (http://www.calflora.org; California) and
Euro+Med (http://www.emplantbase.org; Spain) plant databases, to represent a realistic subset of
species that could have potentially interacted over evolutionary time. There were no criteria

CHAPTER 5: MACROEVOLUTION AND COMPETITIVE DIVERGENCE
75
necessitating the overlap or non-overlap of species of different biogeographic origins in that the
species pool was not designed to discriminate species based on invasion history or lack thereof.
In total, 30 species were included, 20 of which were native to the Central Valley in California
and 10 of which were native to the Mediterranean Basin region of southern Spain (Table S5.1).
These regions were selected from amongst all Mediterranean-climate regions because of their
high similarity in climate, especially rainfall (Germain & Gilbert 2014). Second, species must
have an annual lifecycle to estimate lifetime seed production in a single growing season. We
constructed a phylogenetic tree using Bayesian methods and the ITS1/5.8S/ITS2 and rbcL
sequence regions, as detailed in the Supplementary methods and Fig. S5.1. Seeds were acquired
from independent donors and commercial suppliers (Germain & Gilbert 2014), and were tested
for % germinability under similar soil conditions prior to experimentation. We chose not to cold
stratify the seeds because this method is known to induce rather than break dormancy in
Mediterranean annuals (Baskin & Baskin 2001).
Greenhouse growing conditions
In January 2012, seeds were sown into 12.7 cm diameter, 23 cm deep treepots filled with a 3:2
mixture of sand and screened topsoil, to mimic the sandy loam soils found in annual grasslands.
The topsoil was collected locally (Villacci’s Garden Depot; Scarborough, ON, CA) to ensure that
species were equally naïve to the soil microbiome regardless of origin, a requirement for
unbiased biogeographic comparisons in a common garden experiment. Each pot was randomly
assigned to a position on a bench in the rooftop greenhouse at the University of Toronto
(Toronto, Canada). The greenhouse was maintained at day/night temperatures of 14/7°C, which
was set to gradually increase to 29/17°C on average by the end of the experiment. High intensity
discharge (HID) lighting was provided to maintain a 12 h photoperiod. Each pot was watered
daily to saturation using a drip irrigation system during a three-week establishment period.
After the establishment period, pots of plants were randomly assigned to either a wet or dry soil
moisture regime. Using a drip irrigation system, pots in the wet treatment received 175 mL water
twice as often as those in the dry treatment, starting at one and two day intervals which were
extended to seven and 14 days as the growing season progressed. These two soil moisture
regimes were selected to simulate realistic among-year differences in precipitation, or equally,

CHAPTER 5: MACROEVOLUTION AND COMPETITIVE DIVERGENCE
76
the 30-year average differences between mesic [662 mm] and dry [312 mm] sites across the
species ranges (http://www.climate-charts.com). We confirmed that the wet (11.1 ± 0.56%; mean
± SE percent soil moisture content) and dry (5.8 ± 0.42%) treatments were effective using a
volumetric water probe (HydroSense™, Campbell Scientific Australia) on empty pots. Prior to
flowering (~60 days after planting), each pot was provided with 350 mL of 1500 ppm 20-20-20
NPK fertilizer (Plant Products, Inc., Brampton, Ontario). Pollination was provided by
commercial colonies of the generalist pollinator Bombus impatiens, which were active
throughout the flowering period (Biobest Canada, Leamington, Ontario). The experiment lasted
220 days owing to our inclusion of some summer annual species with relatively long lifecycles
(Atriplex patula, Chenopodium berlandieri, Crepis capillaris, and Madia elegans).
Experimental design
The experiment was designed to parameterize a series of annual plant models (Levine &
HilleRisLambers 2009). Here we present the model that best fit our data (based on AICc, Table
S5.2), the Beverton-Holt model,
log (𝑁𝑖 𝑡+1
𝑁𝑖 𝑡) = log(𝜆𝑖) − log (1 + 𝛼𝑖𝑖𝑁𝑖 𝑡 + 𝛼𝑖𝑗𝑁𝑗 𝑡) (5.1)
where Ni t and Nj t are the numbers of viable seeds of focal species i and j initially planted, λi is
the finite rate of increase for species i in the absence of competition, αij and αii are the inter- and
intra-specific competition coefficients, respectively, and Ni t+1 is the number of viable seeds of
focal species i in year t+1. Because this equation is symmetric, Nj t+1 can also be calculated by
switching subscripts i and j. To independently estimate λ, we grew each species alone at low
densities and enumerated the number of seeds produced per individual; other models (Table
S5.2) require a similar parameterization for finite rate of increase in low competition.
Specifically, 30 seeds of each species were sown into the pots, and emerged seedlings were
thinned to ~eight maximally-spaced individuals that were allowed to mature and produce seed.
There were seven replicate pots of this low density treatment, and these replicates were used to
calculate the distribution of log-transformed λ for each combination of species × soil moisture
environment (details in Appendix D) to be used as informative priors in our Bayesian analysis
(described below).

CHAPTER 5: MACROEVOLUTION AND COMPETITIVE DIVERGENCE
77
To estimate competition coefficients (αii, αjj, αij, and αji), we grew species in pairwise
competition in pots at an expected density of 70 plants (based on germination rates from pilot
experiments). This density is comparable to the seeding density found in annual grasslands (2500
to 5500 plants m-2
(Harrison 1999; Bartolome 1979)). Within these pots, we varied the numbers
of individuals of the two species (10:60, 20:50, 30:40, 40:30, 50:20, and 60:10 individuals) to
create six relative frequency ratios, and had two replicates per frequency ratio. The presence of
strong negative frequency-dependence would indicate that stabilizing differences are large
between competing species (Adler et al. 2007).
We used Bayesian modeling (JAGS software v. 3-15, implemented in the ‘rjags’ R package) to
fit annual plant models to our data, using uninformative priors for all fitted parameter estimates,
except log(λ) for which we used the distributions calculated earlier. Similar to previous work
(Godoy & Levine 2014), all competition coefficients (α parameters in Eqn. 5.1) were log-
normally distributed, and other parameters (such as b in models 4 and 6, Table S5.2) were
uniformly distributed but constrained to be positive. We ran four independent Markov chains for
100,000 iterations, with a 10,000 iteration burn-in period based on time to convergence; for each
parameter, the mean of the posterior distribution was used as the best estimate. We then
compared AICc values for the various models by calculating likelihoods for each model using
parameter means. Once we selected the best model (the Beverton-Holt model, as has been
commonly fit in other annual plant studies (Godoy & Levine 2014; Levine & HilleRisLambers
2009)), the estimated parameters were used to calculate stabilizing and fitness differences using
Eqs. S5.1 and S5.2, which are further described below. The entire experiment was replicated in
two soil moisture environments (wet and dry, see Greenhouse growing conditions), and included
900 total pots of plants arranged in a completely randomized design.
We did not compete all possible pairs of the 30 species included in the experiment. Rather, ten
sympatric (both species native to California) and ten allopatric (one species native to California,
the other to Spain) pairs were selected to represent competitive pairs that were phylogenetically
independent (i.e., non-overlapping branch lengths) relative to all other pairs of the same
biogeographic history treatment. Additionally, the same ten Californian focal species were used
in both the sympatric and allopatric pairs, competed against ten other unique species from
California or Spain (e.g., Vulpia microstachys vs. V. octoflora [sympatric] or V. myuros
CHAPTER 5: MACROEVOLUTION AND COMPETITIVE DIVERGENCE
78
[allopatric]); this was accounted for in the model fitting, with the parameter estimates of all three
species being fit simultaneously (Table S5.3).
Solving for stabilizing differences, fitness differences, and coexistence outcomes
Stabilizing (1-ρ; Eq. S5.1) and fitness (κj/κi; Eq. S5.2) differences were estimated according to
Godoy & Levine (2014) by rearranging the parameters from the Beverton-Holt annual plant
model described in Eq. 5.1. When the strength of intraspecific and interspecific competition is
the same, then √(𝛼𝑖𝑗/𝛼𝑗𝑗 ∙ 𝛼𝑗𝑖/𝛼𝑖𝑖) = 1 and 1-ρ = 0, indicating that there are no stabilizing
differences between competitors. As the relative strength of intraspecific to interspecific
competition increases [√(𝛼𝑖𝑗/𝛼𝑗𝑗 ∙ 𝛼𝑗𝑖/𝛼𝑖𝑖) << 1], 1-ρ approaches 1 indicating that stabilizing
differences are large. In five of 40 cases (20 species pairs × two soil moisture environments), 1-ρ
was < 0, meaning that these species pairs showed evidence of destabilizing effects that are
indicative of priority-based competitive outcomes. For simplicity, we followed the convention of
setting these values to 1 (complete niche overlap (Godoy & Levine 2014)), as this allows
comparison of coexistence outcomes. κj/κi is the average fitness difference between species i and
j, calculated as the product of the demographic ratio ((𝜆𝑗 − 1)/(𝜆𝑖 − 1)), and the competitive
response ratio (√(𝛼𝑖𝑗 ∙ 𝛼𝑖𝑖)/(𝛼𝑗𝑗 ∙ 𝛼𝑗𝑖) ). Our estimate of fitness differences differs from previous
work [23] in that we use Κ, the larger of κj/κi and κi/κj (Eq. S5.3). This was done to simplify the
presentation of our results, but does not alter their outcome or interpretation. Mathematical
derivations of these equations can be found in the appendices of Godoy and Levine (2014).
Species are predicted to coexist locally if both can invade when rare and the other species is at its
equilibrium density, a criterion that is met when (Chesson 2000; Godoy & Levine 2014):
1
𝜌𝛫> 1 (5.2)
In the main text, we use the logarithm of the left-hand side of Eq. 5.2 as our coexistence metric,
so that values greater than zero indicate coexistence whereas those less than zero indicate
competitive exclusion. It is important to note that we consider a model of coexistence in which
all ungerminated seeds are considered inviable, thereby ignoring the contribution that
ungerminated seeds may make to fitness (Godoy & Levine 2014) or to inter-annual stabilization

CHAPTER 5: MACROEVOLUTION AND COMPETITIVE DIVERGENCE
79
through the storage effect (Chesson & Huntly 1989). We tested the sensitivity of our results
against two alternative models, where the seed bank was set to either realistic species-specific
rates (Table S5.4) or 100% viability to determine Κ, as used previously (Godoy & Levine 2014);
our results are qualitatively similar across all three models (Fig. S5.2). The species-specific rates
for the first alternative model were estimated via a separate germination trial using Petri dishes
and gibberellic acid application (Germain & Gilbert 2014).
Statistical analyses
We analyzed stabilizing differences, fitness differences, and the coexistence metric using linear
mixed effects (LME) models with the R packages ‘lmerTest’ and ‘nlme’. All response variables
were tested against a model with phylogenetic distance, biogeographic history, soil moisture
treatment, and their interactions as fixed effects, and species pair as the random effect since the
same pairs of species were grown in each soil moisture treatment. To meet model assumptions
(linearity and homoscedasticity of errors), stabilizing differences were logit-transformed and
tested with the ‘lmer’ function, whereas fitness differences and the coexistence metric were both
log-transformed and coded to include heteroscedastic variance structure (‘weights’ argument in
the ‘lme’ function). The results of the LMEs were summarized using function ‘Anova’ (type II
analysis of variance) in the ‘car’ package; we report the significant highest-order interactions
only in the main text, and the full model outputs in Tables S5.5 and S5.6. Reported P-values are
calculated from χ2 tests of maximum likelihood ratios.
Results and discussion
Consistent with evolutionary theory, our results support the hypothesis that the
macroevolutionary trajectories of stabilizing differences are mediated by biogeographic history
(phylogenetic distance by biogeographic history interaction χ2
1 = 8.75, P = 0.003). Species that
have had potential to evolve in sympatry rapidly accumulated stabilizing differences with
phylogenetic distance, resulting in nearly complete ecological separation by 90 million years
(Fig. 5.1a, light shade). This was not observed in species pairs that have been evolving in
allopatry (i.e. in California vs. Spain); stabilizing differences showed no relationship with
phylogenetic distance (Fig. 5.1a, dark shade). These lines of phylogenetic evidence are consistent
with theory that competition imposes selective pressure for divergence in resource use among

CHAPTER 5: MACROEVOLUTION AND COMPETITIVE DIVERGENCE
80
sympatrically-evolving species (Dayan & Simberloff 2005). A relationship would not be
expected between allopatric species pairs because they are evolutionarily naïve to each other;
species native to separate regions have experienced distinct coevolutionary trajectories, such that
stabilizing differences in the native range would not be predictive of those in the introduced
range.
Figure 5.1. Biogeographic history alters the evolutionary trajectory of stabilizing and fitness
differences. (a) Stabilizing differences rapidly increase among sympatric species pairs (light
shade), whereas allopatric species pairs (dark shade) show no relationship. (b) Fitness
differences, by contrast, increase over evolutionary time in both sympatric and allopatric pairs,
but are larger on average among allopatric pairs. Stabilizing differences have a maximum of one
(Eq. S5.1; lines are fitted from the logit-transformed data), whereas fitness differences have no
upper limit (Eq. S5.2). Because soil moisture had no effect on stabilizing or fitness differences,
each point is a fitted average across soil moisture environments for each species pair.
Our results are striking and appear to contradict the few existing experimental studies that test
whether stabilizing differences are explained by phylogenetic relatedness, and find no
relationship (Narwani et al. 2013; Godoy et al. 2014). This apparent contradiction might be
explained by two methodological differences between our study and those that precede it. First,
our study is the first to our knowledge to incorporate information on historical species
distributions. In rerunning our analysis without accounting for differences in biogeographic
history, we find that phylogenetic distance fails to explain variation in stabilizing differences (χ2
1

CHAPTER 5: MACROEVOLUTION AND COMPETITIVE DIVERGENCE
81
= 0.10, P = 0.756), a result more in line with previous studies. Second, our competitive pairs
were selected to be phylogenetically independent (see Materials and methods). This approach is
necessary because any time there is overlap in evolutionary history among contrasted pairs, the
number of comparisons made will be greater than the number of independent observations from
a phylogenetic perspective. This limits the inferential power of many observational and
experimental tests (Harmon & Glor 2010).
Similarly to stabilizing differences, we found that the pattern of past evolution of fitness
differences depended on biogeographic history. Specifically, fitness differences increased as an
accelerating function of phylogenetic distance [χ2
1 = 17.72, P < 0.001] and were greater overall
amongst allopatric species pairs [χ2
1 = 5.82, P = 0.016; Fig. 5.1b]. In other words, just as co-
evolutionary dynamics lead to a greater probability of stabilizing coexistence, they appear to
constrain the degree of fitness differences that lead to competitive exclusion across the entire
phylogeny.
The effect of biogeographic history on fitness differences could arise from factors other than
coevolutionary dynamics if, for example, the growing conditions in our experiment were more
similar to the ambient environment in either California or Spain. If this were the case, we would
expect absolute fitness differences (κj/κi) to be biased towards species from a particular region.
Further investigation suggests that this is not the case; a post-hoc test showed no consistent
fitness advantage for a particular region (χ2
1 = 0.42, P = 0.515). It appears that the effect of
biogeographic history we observe reflects differences in historical interactions, rather than
experimental conditions favoring species from one region.
Fitness differences arise from the combined effects of differences in demographic rates and
differences in competitive abilities, both of which have been hypothesized to lead to competitive
exclusion by invasive species (Daehler 2003). Despite reports that many invasive species differ
in demographic characteristics, such as seed production (van Kleunen et al. 2010), we found that
allopatric species pairs significantly diverged in competitive ability but the trend in demographic
rates was not significant (Fig. 5.2b, dashed vs. dotted line; Table S5.6). By contrast, sympatric
species pairs significantly diverged in demographic rates but not competitive ability (Fig. 5.2a,
dotted vs. dashed line; Table S5.6), with divergence in overall fitness differences matching
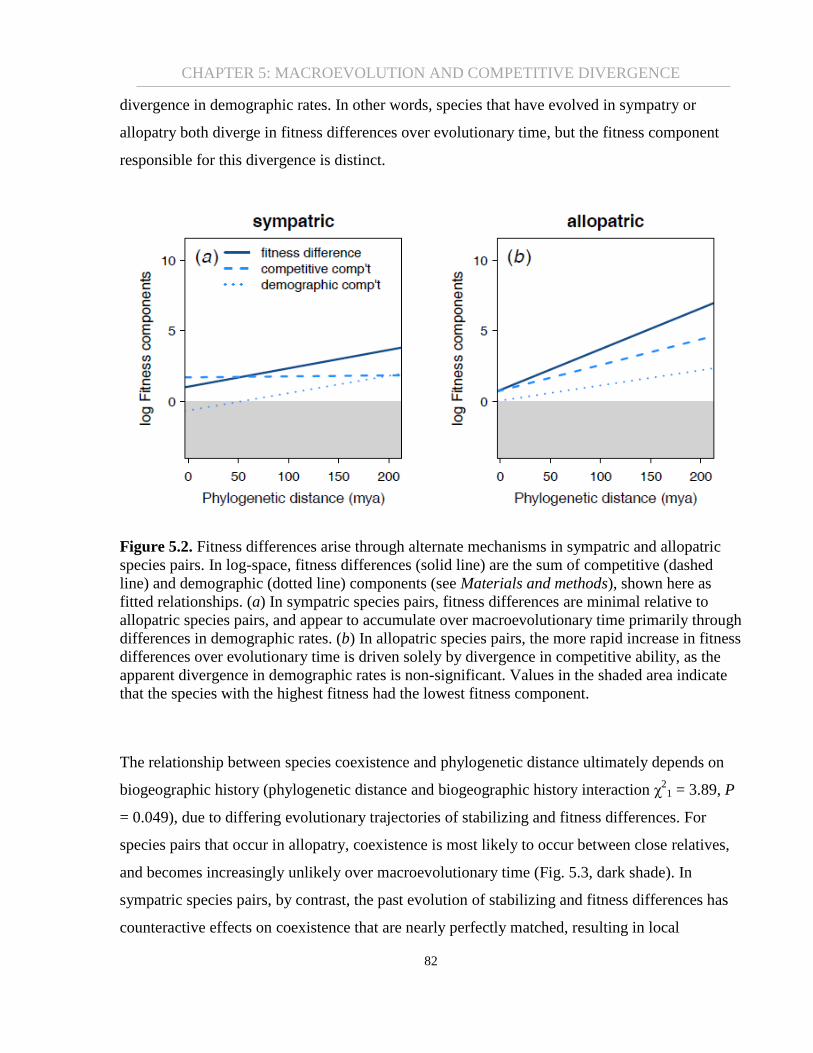
CHAPTER 5: MACROEVOLUTION AND COMPETITIVE DIVERGENCE
82
divergence in demographic rates. In other words, species that have evolved in sympatry or
allopatry both diverge in fitness differences over evolutionary time, but the fitness component
responsible for this divergence is distinct.
Figure 5.2. Fitness differences arise through alternate mechanisms in sympatric and allopatric
species pairs. In log-space, fitness differences (solid line) are the sum of competitive (dashed
line) and demographic (dotted line) components (see Materials and methods), shown here as
fitted relationships. (a) In sympatric species pairs, fitness differences are minimal relative to
allopatric species pairs, and appear to accumulate over macroevolutionary time primarily through
differences in demographic rates. (b) In allopatric species pairs, the more rapid increase in fitness
differences over evolutionary time is driven solely by divergence in competitive ability, as the
apparent divergence in demographic rates is non-significant. Values in the shaded area indicate
that the species with the highest fitness had the lowest fitness component.
The relationship between species coexistence and phylogenetic distance ultimately depends on
biogeographic history (phylogenetic distance and biogeographic history interaction χ2
1 = 3.89, P
= 0.049), due to differing evolutionary trajectories of stabilizing and fitness differences. For
species pairs that occur in allopatry, coexistence is most likely to occur between close relatives,
and becomes increasingly unlikely over macroevolutionary time (Fig. 5.3, dark shade). In
sympatric species pairs, by contrast, the past evolution of stabilizing and fitness differences has
counteractive effects on coexistence that are nearly perfectly matched, resulting in local

CHAPTER 5: MACROEVOLUTION AND COMPETITIVE DIVERGENCE
83
coexistence outcomes that are random with respect to phylogeny (Fig. 5.3, light shade; slope = -
0.02 ± 0.01 standard error). Interestingly, our coexistence metric was less variable among
sympatric than among allopatric species pairs, and generally straddled the threshold between
coexistence and exclusion (Fig. 5.3, light shade); in three cases, the soil moisture treatment alone
was enough to cause sympatric species pairs to cross this threshold so that species were predicted
to coexist in at least one environment. Our results highlight the importance of environmental
variation in maintaining species diversity among native species, but suggest that this variation
may be less successful in maintaining diversity among species from different regions.
Figure 5.3. The effect of evolutionary history on coexistence outcomes depends on
biogeographic history. Species coexistence is not influenced by the phylogenetic distances of
species pairs that occur in sympatry (light shade, slope not significantly different from zero), but
the probability of coexistence decreases with the phylogenetic distance of allopatric pairs (dark
shade). Species pairs were grown in wet (squares) and dry (triangles) environments, but soil
moisture does not alter the effect of evolutionary history on coexistence (fitted lines are averaged
across environments). The dashed line indicates the threshold between coexistence (positive
values) and competitive exclusion (negative values); the coexistence metric is given by Eq. 5.2 in
Materials and methods. Points connected by a solid line represent cases in which a species pair
was predicted to coexist in one but not both environments (3 of 10 sympatric pairs, 0 of 10
allopatric pairs).
The use of two sets of environmental conditions in deconstructing the components of species’
competitive dynamics is a strength of our experiment, and is the first to do so to our knowledge;

CHAPTER 5: MACROEVOLUTION AND COMPETITIVE DIVERGENCE
84
the sensitivity of these components to the underlying environment is heretofore unknown (Kraft
et al. 2014). We found that the soil moisture environment did not affect stabilizing differences,
fitness differences, or coexistence (all P > 0.15), and did not influence how these variables
responded to biogeographic history or phylogenetic distance. The presence of an effect would
have indicated that certain environments cause species to overlap more or less in resource use
(affecting stabilizing differences) or to have stronger or weaker competitive asymmetries
(affecting fitness differences (HilleRisLambers et al. 2012)). Instead, the varied responses
observed across species pairs likely reflect species-specific differences in responses to soil
moisture limitation (Germain & Gilbert 2014); in a dry environment, for example, some species
pairs might experience more overlap in resource use, whereas others might experience less
overlap. Although we do not have the data to identify the exact mechanism of species-specific
differences, it likely has to do with whether or not traits relevant to competition converge or
diverge between species in different environments. Whether the same results would be obtained
in response to other environmental conditions that, unlike soil moisture, are not also an essential
resource, warrants further investigation.
A caveat to our interpretation of our findings is that we can only infer past histories of interaction
from present-day distributional data (Connell 1980), given that macroevolutionary change takes
place on timescales that are not directly observable. For this reason, it is important that we weigh
our results against explanations other than competition for the patterns we observed, such as
neutral evolution or specialization on different environment types. The predictions expected
given these alternative mechanisms differ from those under competition in two key ways. First, if
environmental specialization alone was responsible for divergence, then species would show
clear differences in habitat association, or in their abilities to persist in a common environment in
the absence of competition; neither was true for the species in our experiment. Second, under
either neutral evolution or environmental specialization, stabilizing differences would not be
expected to evolve differently between sympatric and allopatric species pairs, nor would they be
constrained to the narrow range of high stabilization that we observed among sympatric pairs.
For these reasons, we argue that although we cannot definitively rule out alternative
mechanisms, historical interactions likely constrain the evolution of competitive similarities and
dissimilarities among species.
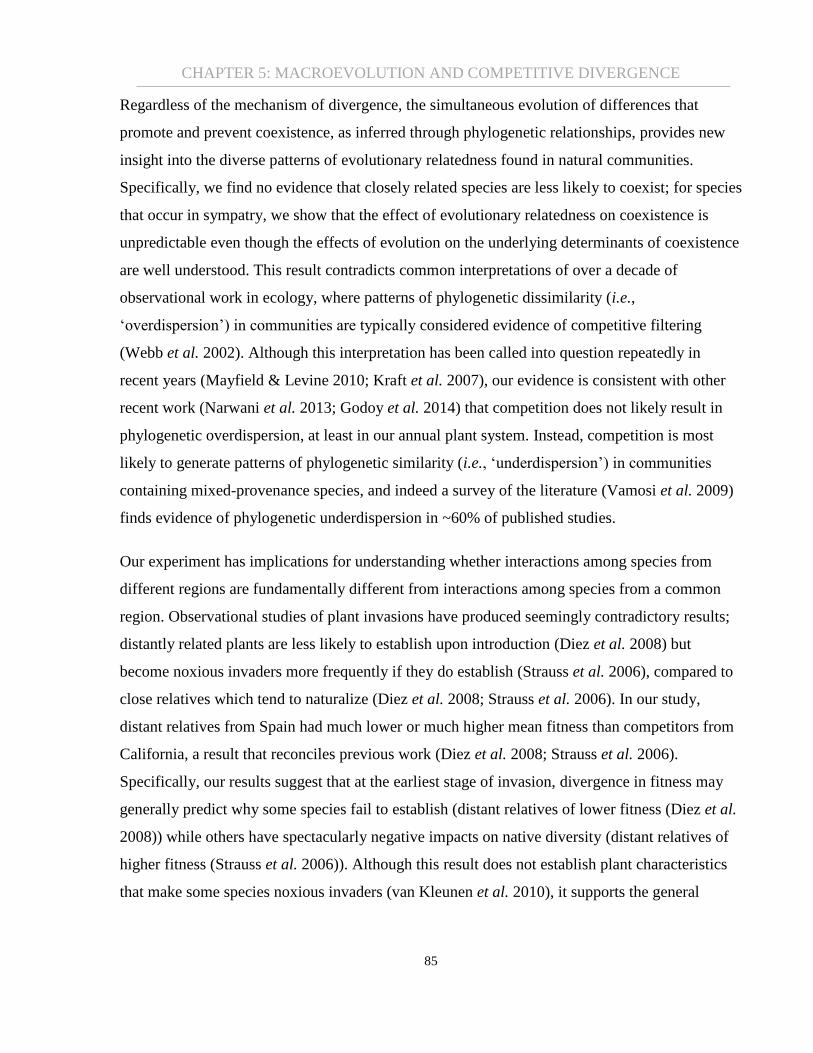
CHAPTER 5: MACROEVOLUTION AND COMPETITIVE DIVERGENCE
85
Regardless of the mechanism of divergence, the simultaneous evolution of differences that
promote and prevent coexistence, as inferred through phylogenetic relationships, provides new
insight into the diverse patterns of evolutionary relatedness found in natural communities.
Specifically, we find no evidence that closely related species are less likely to coexist; for species
that occur in sympatry, we show that the effect of evolutionary relatedness on coexistence is
unpredictable even though the effects of evolution on the underlying determinants of coexistence
are well understood. This result contradicts common interpretations of over a decade of
observational work in ecology, where patterns of phylogenetic dissimilarity (i.e.,
‘overdispersion’) in communities are typically considered evidence of competitive filtering
(Webb et al. 2002). Although this interpretation has been called into question repeatedly in
recent years (Mayfield & Levine 2010; Kraft et al. 2007), our evidence is consistent with other
recent work (Narwani et al. 2013; Godoy et al. 2014) that competition does not likely result in
phylogenetic overdispersion, at least in our annual plant system. Instead, competition is most
likely to generate patterns of phylogenetic similarity (i.e., ‘underdispersion’) in communities
containing mixed-provenance species, and indeed a survey of the literature (Vamosi et al. 2009)
finds evidence of phylogenetic underdispersion in ~60% of published studies.
Our experiment has implications for understanding whether interactions among species from
different regions are fundamentally different from interactions among species from a common
region. Observational studies of plant invasions have produced seemingly contradictory results;
distantly related plants are less likely to establish upon introduction (Diez et al. 2008) but
become noxious invaders more frequently if they do establish (Strauss et al. 2006), compared to
close relatives which tend to naturalize (Diez et al. 2008; Strauss et al. 2006). In our study,
distant relatives from Spain had much lower or much higher mean fitness than competitors from
California, a result that reconciles previous work (Diez et al. 2008; Strauss et al. 2006).
Specifically, our results suggest that at the earliest stage of invasion, divergence in fitness may
generally predict why some species fail to establish (distant relatives of lower fitness (Diez et al.
2008)) while others have spectacularly negative impacts on native diversity (distant relatives of
higher fitness (Strauss et al. 2006)). Although this result does not establish plant characteristics
that make some species noxious invaders (van Kleunen et al. 2010), it supports the general

CHAPTER 5: MACROEVOLUTION AND COMPETITIVE DIVERGENCE
86
finding that species have a greater potential to become noxious invaders when they are naïve to a
region (Simberloff et al. 2012).
Our patterns of rapid predictable divergence in fitness differences but not stabilizing differences
among species from different floras has been hypothesized (MacDougall et al. 2009), but has
remained untested until now. Future work is needed to identify the traits that underlie stabilizing
and fitness differences among non-native competitors. Although specific traits have been
implicated as contributors to species’ competitive differences (Kraft et al. 2015) and invasion
success (van Kleunen et al. 2010), the potential for traits to differentially contribute to stabilizing
and fitness differences depending on biogeographic history is heretofore unexplored.
The intricate interplay between the ecology and evolution of organisms remains an important
area of research for understanding diversity and its response to global changes, such as species
invasions. In this study, we have tested one of the most long-standing hypotheses about the
relationships between evolutionary relatedness, competition, and coexistence. Our work
highlights the role that historical interactions play in determining the stability of current-day
interactions and the impacts of non-native species.
Data accessibility
The raw data used to fit our annual plant models and our nexus tree file have been made
publically available on Dryad (doi:10.5061/dryad.v2211); the fitted parameter estimates, seed
viability data, and Genbank sequence accessions are in the electronic supplementary materials.
Authors’ contributions
R.M.G., B.G. and J.W. designed the experiment, R.M.G. collected the data, R.M.G. and B.G.
analyzed the data, R.M.G. and J.T.W. constructed the phylogeny, R.M.G., B.G., and J.T.W.
wrote the manuscript.
Funding statement
Funding was provided by NSERC Discovery (research; B.G.) and NSERC-CGSD (personal
funding; R.M.G.).

CHAPTER 5: MACROEVOLUTION AND COMPETITIVE DIVERGENCE
87
Acknowledgements
We thank M. Cadotte and members of the Gilbert lab for their feedback, as well as two
anonymous reviewers for their comments improving the manuscript. Greenhouse assistance was
provided by B. Hall, A. Petri, and many undergraduate assistants, most notably C. Blackford.
Bees were provided by J. Thomson.
Literature cited
Abrams, P.A. (1986) Character displacement and niche shift analyzed using consumer-resource
models of competition. Theoretical Population Biology, 29, 107–160.
Adler, P.B., HilleRisLambers, J. & Levine, J.M. (2007) A niche for neutrality. Ecology Letters,
10, 95–104.
Anderson, T.M., Shaw, J. & Olff, H. (2011) Ecology’s cruel dilemma, phylogenetic trait
evolution and the assembly of Serengeti plant communities. Journal of Ecology, 99, 797–
806.
Bartolome, J.W. 1979 Germination and seedling establishment in California annual grassland.
Journal of Ecology, 67, 273–281.
Baskin, C.C. & Baskin, J.M. (2001) Seeds: Ecology, Biogeography, and Evolution of Dormancy
and Germination. Academic Press, San Diego.
Bell, C.D., Soltis, D.E. & Soltis, P.S. (2010) The age and diversification of the angiosperms re-
revisited. American Journal of Botany, 97, 1296–1303.
Cahill, J.F., Kembel, S.W., Lamb, E.G. & Keddy, P.A. (2008) Does phylogenetic relatedness
influence the strength of competition among vascular plants? Perspectives on Plant
Ecolology, Evolution, and Systematics, 10, 41–50.
Chesson, P. & Huntly, N. (1989) Short-term instabilities and long-term community dynamics.
Trends in Ecology and Evolution, 4, 293–298.
Chesson, P. (2000) Mechanisms of maintenance of species diversity. Annual Review of Ecology
and Systematics, 31, 343–366.
Connell, J.H. (1980) Diversity and the coevolution of competitors, or the ghost of competition
past. Oikos, 35, 131–138.
Daehler, C.C. (2003) Performance comparisons of co-occurring native and alien invasive plants:
implications for conservation and restoration. Annual Review of Ecology, Evolution, and
Systematics, 34, 183–211.

CHAPTER 5: MACROEVOLUTION AND COMPETITIVE DIVERGENCE
88
Darwin, C. (1859) On the Origin of Species by Means of Natural Selection, or the Preservation
of Favoured Races in the Struggle for Life. John Murray, London.
Dayan, T. & Simberloff, D. (2005) Ecological and community-wide character displacement: the
next generation. Ecology Letters, 8, 875–894.
Diez, J.M., Sullivan, J.J., Hulme, P.E., Edwards, G. & Duncan, R.P. (2008) Darwin’s
naturalization conundrum: dissecting taxonomic patterns of species invasions. Ecology
Letters, 11, 674–681.
Elton, C. (1946) Competition and the structure of ecological communities. Journal of Animal
Ecology, 15, 54–68.
Germain, R.M. & Gilbert, B. (2014) Hidden responses to environmental variation: maternal
effects reveal species niche dimensions. Ecology Letters, 17, 662–669.
Godoy, O. & Levine, J.M. (2014) Phenology effects on invasion success: insights from coupling
field experiments to coexistence theory. Ecology, 95, 726–736.
Godoy, O., Kraft, N.J.B. & Levine, J.M. (2014) Phylogenetic relatedness and the determinants of
competitive outcomes. Ecology Letters, 17, 836–844.
Gravel, D., Bell, T., Barbera, C., Bouvier, T., Pommier, T., Venail, P. & Mouquet, N. (2011)
Experimental niche evolution alters the strength of the diversity-productivity relationship.
Nature, 469, 89–92.
Harmon, L.J. & Glor, R.E. (2010) Poor statistical performance of the Mantel test in phylogenetic
comparative analyses. Evolution, 64, 2173–2178.
Harper, J.L., Clatworthy, J.N., McNaughton, I.H. & Sagar, G.R. (1961) The evolution and
ecology of closely related species living in the same area. Evolution, 15, 209–227.
Harrison, S. (1999) Local and regional diversity in a patchy landscape: native, alien, and
endemic herbs on serpentine. Ecology, 80, 70–80.
HilleRisLambers, J., Adler, P.B., Harpole, W.S., Levine, J.M. & Mayfield, M.M. (2012)
Rethinking community assembly through the lens of coexistence theory. Annual Review of
Ecology, Evolution, and Systematics, 43, 227-248.
Johnson, M.T. & Stinchcombe, J.R. (2007) An emerging synthesis between community ecology
and evolutionary biology. Trends in Ecolgy and Evolution, 22, 250–257.
Kisdi, E. & Geritz, S.A.H. (2001) Evolutionary disarmament in interspecific competition.
Proceedings of th Royal Society B: Biological Sciences, 268, 2589–2594.
Kraft, N.J.B., Adler, P.B., Godoy, O., James, E.C., Fuller, S. & Levine, J.M. (2014) Community
assembly, coexistence and the environmental filtering metaphor. Functional Ecology, 29,
592-599.

CHAPTER 5: MACROEVOLUTION AND COMPETITIVE DIVERGENCE
89
Kraft, N.J.B., Cornwell, W.K., Webb, C.O. & Ackerly, D.D. (2007) Trait evolution, community
assembly, and the phylogenetic structure of ecological communities. American Naturalist,
170, 271–283.
Kraft, N.J.B., Godoy, O. & Levine, J.M. (2015) Plant functional traits and the multidimensional
nature of species coexistence. Proceedings of the National Academy of Sciences, 112,
797-802.
Levine, J.M. & HilleRisLambers, J. (2009) The importance of niches for the maintenance of
species diversity. Nature, 461, 254–257.
MacDougall, A.S., Gilbert, B. & Levine, J.M. (2009) Plant invasions and the niche. Journal of
Ecology, 97, 609–615.
Mahler, D.L., Ingram, T., Revell, L.J. & Losos, J.B. (2013) Exceptional convergence on the
macroevolutionary landscape in island lizard radiations. Science, 341, 292–295.
Mayfield, M.M. & Levine, J.M. (2010) Opposing effects of competitive exclusion on the
phylogenetic structure of communities. Ecology Letters, 13, 1085–1093.
Meyer, J.R. & Kassen, R. (2007) The effects of competition and predation on diversification in a
model adaptive radiation. Nature, 446, 432–435.
Narwani, A., Alexandrou, M.A., Oakley, T.H., Carroll, I.T. & Cardinale, B.J. (2013)
Experimental evidence that evolutionary relatedness does not affect the ecological
mechanisms of coexistence in freshwater green algae. Ecology Letters, 16, 1373–1381.
Peay, K.G., Belisle, M. & Fukami, T. (2012) Phylogenetic relatedness predicts priority effects in
nectar yeast communities. Proceedings of the Royal Society B: Biological Sciences, 279,
749–758.
Schoener, T.W. (2011) The newest synthesis: understanding the interplay of evolutionary and
ecological dynamics. Science, 331, 426–429.
Simberloff, D., Souza, L., Nunez, M.A., Barrios-Garcia, M.N. & Bunn, W. (2012) The natives
are restless, but not often and mostly when disturbed. Ecology, 93, 598-607.
Stenseth, N.C. (1979) Where have all the species gone? On the nature of extinction and the Red
Queen Hypothesis. Oikos, 33, 196–227.
Stevens, P.F. (in press) Angiosperm Phylogeny Website. Version 12, July 2012 [and more or less
continuously updated since].
Strauss, S.Y., Webb, C.O. & Salamin, N. (2006) Exotic taxa less related to native species are
more invasive. Proceedings of National Academy of Science, 103, 5841–5845.
Thompson, J.N. (1999) The evolution of species interactions. Science, 284, 2116–2118.

CHAPTER 5: MACROEVOLUTION AND COMPETITIVE DIVERGENCE
90
Vamosi, S.M., Heard, S.B., Vamosi, J.C. & Webb, C.O. (2009) Emerging patterns in the
comparative analysis of phylogenetic community structure. Molecular Ecology, 18, 572–
592.
van Kleunen, M., Dawson, W., Schlaepfer, D., Jeschke, J.M. & Fischer, M. (2010) Are invaders
different? A conceptual framework of comparative approaches for assessing determinants
of invasiveness. Ecology Letters, 13, 947-958.
van Kleunen, M., Weber, E. & Fischer, M. (2010) A meta-analysis of trait differences between
invasive and non-invasive plant species. Ecology Letters, 13, 235–245.
Violle, C., Nemergut, D.R., Pu, Z. & Jiang, L. (2011) Phylogenetic limiting similarity and
competitive exclusion. Ecology Letters, 14, 782–787.
Walker, J.B., Sytsma, K.J., Treutlein, J. & Wink, M. (2004) Salvia (Lamiaceae) is not
monophyletic: implications for the systematics, radiation, and ecological specializations of
Salvia and tribe Mentheae. American Journal of Botany, 91, 1115–1125.
Webb, C.O., Ackerly, D.D., McPeek, M.A. & Donoghue, M.J. (2002) Phylogenies and
community ecology. Annual Review of Ecology and Systematics, 33, 475–505.
Wikström, N., Savolainen, V. & Chase, M.W. (2001) Evolution of the angiosperms: calibrating
the family tree. Proceedings of the Royal Society B: Biological Sciences, 268, 2211–2220.
Zuppinger-Dingley, D., Schmid, B., Petermann, J.S., Yadav, V., De Deyn, G.B. & Flynn, D.F.B.
(2014) Selection for niche differentiation in plant communities increases biodiversity
effects. Nature, 515, 108–111.

CHAPTER 6: GENERAL CONCLUSIONS
91
Chapter 6
General Conclusions
My doctoral research is motivated by understanding the role of historical contingencies as
mechanisms that maintain diverse species assemblages, as well as their potential to obscure
meaningful ecological phenomena if overlooked. I have explored three ways in which historical
contingencies manifest, and where they fall along a time continuum of effects that persist from
one (chs. 2 and 3) to tens (ch. 4) to tens of millions (ch. 5) of generations (Fig. 1.1). As I will
discuss, each chapter has addressed contemporary issues at the interface of ecology and
evolution, and serves to provide a broader demonstration of the spatial and temporal dimensions
of species’ niches.
Maternal effects of past environments
In chapters 2 and 3, I present the first step in exploring the ecological significance of maternal
effects by quantifying their overall prevalence among assemblages of species in controlled
environments. This work led to three main findings: (i) species differ in magnitude and direction
of maternal effects in response to the same sets of abiotic conditions, (ii) these maternal effects
can reinforce or counteract responses through seed number, depending on the species, and (iii)
maternal effects are exacerbated in competitive environments, indicating that existing estimates
of the prevalence of maternal effects are likely conservative. My research demonstrates that by
ignoring maternal effects, ecologists effectively miss over half of the ways in which species
respond to the environment; ecologists should work to develop a more synthetic understanding
of when maternal effects are likely to occur and the ways in which they influence ecological
dynamics.
There are several next steps for this work towards the goal of understanding how maternal
effects might contribute to ecological dynamics in real communities and under different maternal
effects scenarios. First, to test their importance in real communities, ecologists could either parse
out maternal effects from demographic data or test how different maternal environmental
histories affect the ecologies of offspring. As an example of the latter, I am involved in ongoing
CHAPTER 6: GENERAL CONCLUSIONS
92
work in the Gilbert lab that tests competitive differences between offspring of two Vulpia
species, reciprocally transplanted so that offspring originated from maternal plants that either
experienced the same or different soil moisture conditions as the other species. Second, the
maternal effects observed across species in my experiments suggest that they will have large
influences on parameters in population models, and alter coexistence and diversity under
different biotic and abiotic environments. This could be tested by estimating parameters that
modify demographic rates, such as finite rates of increase, competition coefficients, and seed
bank viability, based on biotic and abiotic conditions experienced in the previous generation.
Incorporating these parameter estimates into population models would improve our
understanding the relative importance of maternal effects in promoting or limiting diversity in
ecological communities. Finally, the intricacies of how different types of maternal effects (e.g.,
seed size, dormancy, seedling performance) are distributed among species warrants the use of
comparative methods that link maternal effects expression to species’ ecologies.
Dispersal histories in a metacommunity
The interplay between local and regional processes underlies contemporary perspectives on the
mechanisms that maintain diverse communities. Chapter 4 uses a novel method of manipulating
species pools across natural landscapes, and in doing so, offers definitive evidence of scale-
specific processes and their roles in structuring the distributions of whole communities of
species. The key findings are: (i) species’ distributions are strongly influenced by dispersal
histories that manifest at distinct spatial scales, (ii) the removal of dispersal limitation doubles
the strength of species-environment relationships, and (iii) that dispersal histories are constrained
the natural spatial structure of environmental conditions. Together, these results indicate that
ecologists should consider moving away from questions of whether species’ distributions are
more constrained by environments or dispersal histories, and instead explicitly test and model
their interdependence in future studies. Additionally, the scale-specific transitions that we
observed shed light on the potential shortcomings of the “local” vs. “regional” dichotomy in
ecology.
Given that our community surveys were performed a year after the seed pooling manipulations
were carried out, future surveys will ascertain their longer-term effects. Specifically, we will test

CHAPTER 6: GENERAL CONCLUSIONS
93
whether our seed pooling effects are maintained or swamped out through time with incoming
propagules from surrounding communities, and whether they affect the temporal dynamics of
local communities. Though preliminary, a follow-up survey in 2016 points towards the
persistence of increasing species richness with the spatial scale of seed pooling, even in face of
extreme natural events, including record-setting drought (2014-2015), wildfire (2015), and heavy
la Niña rains (2016). Formal analyses will be performed to confirm this result, as well as the
persistence of effects on other components of diversity reported in chapter 4.
Historical interactions and macroevolution
In chapter 5, I presented empirical mechanistic evidence that challenges a fundamental
assumption of community phylogenetics, and informs our understanding of how competitive
interactions evolve on macroevolutionary timescales. Contrary to classic ecological theory
(Darwin 1856; Elton 1946), and Webb et al.’s (2002) initial predictions, my work shows there is
no evidence that local coexistence is less likely to occur amongst closely related species. This
result was especially interesting given that the competitive components that underlie coexistence
did correlate with relatedness. Although it is not known how broadly my results might apply
across diverse communities, the fact that a key assumption of community phylogenetics is not
supported in the few definitive tests that are available (e.g., Narwani et al. 2013; Godoy et al.
2014; Germain et al. 2016) should call into question the inferential power of existing research in
this field (Vamosi et al. 2009). Furthermore, by additionally contrasting among competitors that
have historically occurred in sympatry or allopatry, I found macroevolutionary patterns of
stabilizing niche differences that are consistent with the presence of character displacement, or
“ghosts of competition past” (Connell 1980). These ghosts have remained elusive, and may have
masked evolutionary patterns of stabilizing differences in previous research due to the inclusion
of species of multiple provenances and thus mixed potentials for coevolutionary interactions
(Godoy et al. 2014).
My work tested competitive divergence among species, and intriguingly, showed rapid increases
in stabilizing differences over a relatively small evolutionary window (<25 mya since
divergence; Fig. 5.1a). This observation has motivated my future work as a postdoctoral fellow
to explore competitive divergences on much shorter timescales, among populations within

CHAPTER 6: GENERAL CONCLUSIONS
94
species. Recent work by Siepielski et al. (2016) showed that the strength of density dependence
among populations of damselflies negatively covaries with the strength of local adaptation.
Because density dependence underlies both stabilizing and fitness differences, disentangling
their relative influences would bring us closer to understanding the ecological mechanisms that
shape the evolutionary divergence of populations. The findings of my PhD work offer a clear
predictive framework for population divergence in competitive differences under different
scenarios of sympatry or allopatry.
More broadly, my work demonstrates the need for syntheses of ecology and evolutionary biology
that are conceptually robust from the perspective of both fields. For example, it is now apparent
that initial expectations for how evolutionary relatedness might impact ecological interactions
were overly simplistic, and can be better resolved via the incorporation of biogeographic history
(Mittelbach & Schemske 2015; Johnson & Stinchcombe 2007). It is likely that similar
improvements to theory could be made elsewhere, for example, in studies that assume Brownian
motion models of trait evolution (Freckleton & Harvey 2006) or ecological equivalence of
species immediately following speciation (Funk et al. 2006). From an evolutionary standpoint,
ecological theory has yet to be incorporated beyond some of the simplest of principles, such as
divergence along single resource or environmental axes (e.g., Funk et al. 2006; Anacker &
Strauss 2014). Because ecological mechanisms are thought to play a primary role during
speciation (Schluter 2001), a more explicit integration of ecological theory to evolutionary
hypotheses would better link the forces that generate and maintain diverse species assemblages
on evolutionary and ecological timescales. Calls for a more integrative synthesis between
ecology and evolution have described it as “one of the most important frontiers for the
conceptual unification of the biological sciences” (Matthews et al. 2011).
Concluding remarks
It is clear that species’ niches are far more complex and difficult to define than initially thought;
where species are now does not necessarily reflect where they could be (ch. 4), and the niche
itself can respond plastically to current and historical conditions (ch. 2 and 3). All of these
complexities add to the number of ways in which species might partition their environments, not

CHAPTER 6: GENERAL CONCLUSIONS
95
just through differences in local resource use, but also in when or where resource use takes place,
and how resource use varies in response to extrinsic factors. The net effect of all of these
possible axes of differentiation is the potential for large numbers of species to coexist across
landscapes. Most biological communities are highly speciose, an observation that early
ecologists struggled to explain under a more static and local perspective of ecological niches. G.
E. Hutchinson’s (1957) own answer to his question of why there are so many species in nature
was that “[diversity is limited] by physical factors, by space, by the fineness of possible
subdivision of niches”. The work presented in this thesis provides demonstrations of each of
these ideas, but also extends them to show how historical contingencies can cause time lags in
each that sometimes promote diversity and sometimes constrain it. Further exploration into how
the past and present interact to structure biodiversity will provide a basis for predicting future
responses to climate change (Alexander et al. 2015), introduced species (Capinha et al. 2015),
habitat fragmentation (Haddad et al. 2015), and other challenges that characterize the
Anthropocene.
Literature cited
Alexander, J.M., Diez, J.M. & Levine, J.M. (2015) Novel competitors shape species’ responses
to climate change. Nature, 525, 515-518.
Anacker, B.L. & Strauss, S.Y. (2014) The geography and ecology of plant speciation: range
overlap and niche divergence in sister species. Proceedings of the Royal Society B:
Biological Sciences, 281, 20132980.
Capinha, C., Essl, F., Seebens, H., Moser, D. & Pereira, H.M. (2015) The dispersal of alien
species redefines biogeography in the Anthropocene. Science, 348, 1248-1251.
Connell, J.H. (1980) Diversity and the coevolution of competitors, or the ghost of competition
past. Oikos, 35, 131-138.
Darwin, C. (1859) On the origin of species by means of natural selection, or the preservation of
favoured races in the struggle for life. John Murray, London.
Elton, C. (1946) Competition and the structure of ecological communities. Journal of Animal
Ecology, 15, 54–68.
Freckleton, R.P. & Harvey, P.H. (2006) Detecting non-Brownian trait evolution in adaptive
radiations. PLOS Biology, 4, e373.

CHAPTER 6: GENERAL CONCLUSIONS
96
Funk, D.J. (2006) Ecological divergence exhibits consistently positive associations with
reproductive isolation across disparate taxa. Proceedings of the National Academy of
Sciences, 103, 3209-3213.
Germain, R.M., Weir, J.T. & B. Gilbert. (2016) Species coexistence: macroevolutionary
relationships and the contingency of historical interactions. Proceedings of the Royal
Society B: Biological Sciences, 283, 20160047.
Godoy, O., Kraft, N.J.B. & Levine, J.M. (2014) Phylogenetic relatedness and the determinants of
competitive outcomes. Ecology Letters, 17, 836–844.
Haddad, N.M., Brudvig, L.A., Clobert, J., Davies, K.F., Gonzalez, A., Holt, R.C., et al. (2015)
Habitat fragmentation and its lasting impact on Earth’s ecosystems. Science Advances, 1,
e1500052.
Hutchinson, G.E. (1957) Concluding remarks. Cold Spring Harbor Symposium of Quantitative
Biology, 22, 415-427.
Johnson, M.T. & Stinchcombe, J.R. (2007) An emerging synthesis between community ecology
and evolutionary biology. Trends in Ecolgy and Evolution, 22, 250–257.
Matthews, B., Narwani, A., Hausch, S., Nonaka, E., Peterm H., Yamamichi, M., et al. (2011)
Toward an integration of evolutionary biology and ecosystem science. Ecology Letters,
14, 690-701.
Mittelbach, G.G. & Schemske, D.W. (2015) Ecological and evolutionary perspectives on
community assembly. Trends in Ecology and Evolution, 30, 241-247.
Narwani, A., Alexandrou, M.A., Oakley, T. H., Carroll, I.T. & Cardinale, B.J. (2013)
Experimental evidence that evolutionary relatedness does not affect the ecological
mechanisms of coexistence in freshwater green algae. Ecology Letters, 16, 1373–1381.
Schluter, D. (2001) Ecology and the origin of species. Trends in Ecology and Evolution, 16, 372-
380.
Siepielski, A. M., Nemirov, A., Cattivera, M. & Nickerson, A. (2016) Experimental evidence for
an eco-evolutionary coupling between local adaptation and intraspecific competition.
American Naturalist, 187, 447-456.
Vamosi, S.M., Heard, S.B., Vamosi, J.C. & Webb, C.O. (2009) Emerging patterns in the
comparative analysis of phylogenetic community structure. Molecular Ecology, 18, 572–
592.
Webb, C.O., Ackerly, D.D., McPeek, M.A. & Donoghue, M.J. (2002) Phylogenies and
community ecology. Annual Review of Ecology and Systematics, 33, 475–505.

97
Appendix A: Supplementary Information to Chapter 2
Supplementary tables and figures
Table S2.1. Taxonomic, sequence accession, and seed supplier information for the 29 species included in this study.
ID codes Species names Order Family Accession # Seed supplier Collection details*
CMELI Centaurea melitensis Asterales Asteraceae HQ540425.1 Herbiseed NP in 2009
CCAPI Crepis capillaris Asterales Asteraceae AJ633353 Herbiseed NP in 2008
LCALI Lasthenia californica Asterales Asteraceae AF467195.1 S & S seed AF <20 years
LGLAB Lasthenia glabrata Asterales Asteraceae AF391593.1 S & S seed AF <20 years
MELEG Madia elegans Asterales Asteraceae AF413612.1 S & S seed AF <10 years
ULIND Uropappus lindleyi Asterales Asteraceae AF386495.1 Theodore Payne NP in 2011
SGALL Silene gallica Caryophyllales Caryophyllaceae U30959/U30985 Herbiseed AF for 1 year
CBERL Chenopodium berlandieri Caryophyllales Chenopodiaceae HE577429.1 Wild Garden Seed NA†
MNUTT Monolepis nuttalliana Caryophyllales Chenopodiaceae HE577375.1 Independent donor NP in 2011
CPERF Claytonia perfoliata Caryophyllales Montiaceae AY764040.1 S & S seed NP in 2011
POLER Portulaca oleracea Caryophyllales Portulacaceae JF508578.1 Herbiseed NP in 2010
LPURS Lotus purshianus Fabales Fabaceae AF467067.1 S & S seed AF <10 years
LBICO Lupinus bicolor Fabales Fabaceae DQ524209.1 S& S seed AF <20 years
TINCA Trifolium incarnatum Fabales Fabaceae AF053160.1 S & S seed NP in 2011
CHETE Collinsia heterophylla Lamiales Lamiaceae AF385337.1 S & S seed NP in 2011
SCOLU Salvia columbariae Lamiales Lamiaceae NA S & S seed NP in 2011
SVIRI Salvia viridis Lamiales Lamiaceae NA B & T World seed NA†
BCUCU Bromus cucamonga Poales Poaceae AY367948.1 S & S seed AF <10 years
HDEPR Hordeum depressum Poales Poaceae AJ607894.1 S & S seed AF <10 years
HVULG Hordeum vulgare Poales Poaceae FJ593180.1 S & S seed NP in 2011
VMICR Vulpia microstachys Poales Poaceae EF584981.1 S & S seed AF <10 years
VMYUR Vulpia myuros Poales Poaceae AY118092.1 S & S seed NP in 2011
VOCTO Vulpia octoflora Poales Poaceae EF584982.1 S & S seed AF <10 years
ECAES Eschscholzia caespitosa Ranunculales Papaveraceae JF892592.1 S & S seed AF <20 years

98
EMEXI Eschscholzia mexicana Ranunculales Papaveraceae DQ912884.1 S & S seed AF <10 years
PDUBI Papaver dubium Ranunculales Papaveraceae DQ250322.1 Herbiseed AF for 1 year
MARVE Myosotis arvensis Boraginales Boraginaceae AY092908.1 Herbiseed NP in 2011
NMENZ Nemophila menziesii Boraginales Boraginaceae AF091183.1 S & S seed NP in 2011
PCAMP Phacelia campanularia Boraginales Boraginaceae AF091188.1 S & S seed AF <20 years
Notes: *The collection details summarize the origins of the seed used in this experiment, based on information provided by the seed
suppliers. NP = collected directly from natural populations; AF = grown in agricultural fields for x years since source seed was
collected from natural populations. In all but two cases†, populations cultivated in agricultural fields are regularly supplemented with
seed from natural populations to maintain genetic diversity. †C. berlandieri and S. viridis populations were raised in agricultural fields
for 8-10 generations and the original source is unknown.

99
Figure S2.1. The timing of shifts in (A) watering intervals in number of days by treatment
[wet/dry], (B) day/night temperature regime (°C), and key methodological events with respect to
days since the maternal generation experiment was initiated. Flowering dates varied by species,
such that the seed collection and biomass harvest was ongoing in the timespan bounded by the
grey arrow.

100
Figure S2.2. Effect size of seedling height responses to our watering treatments across a
phylogeny of 29 species; see Table S2.1 for species codes. Effect sizes were calculated using
Cohen’s d (i.e., (µdry - µwet)/pooled σ; Hartung et al. 2011). Positive effect sizes indicate that trait
values were higher in the dry compared to wet environment, and vice versa. The numbers on the
phylogeny correspond to taxonomic orders: (1) Poales, (2) Ranunculales, (3) Fabales, (4)
Caryophyllales, (5) Boraginales, (6) Lamiales, and (7) Asterales. Dashed branches represent
unknown relationships due to missing sequence data [SCOLU and SVIRI], and ‘×’ indicates
unavailable trait data rather than a true zero. * P < 0.05, º P < 0.10.

101
Figure S2.3. Effect of seed size on seedling height after three weeks of growth. Each data point
represents the average height of the two seedlings per pot from the offspring generation
experiment. The best-fit line indicates a significant positive relationship (R2 = 0.01, P = 0.047).

102
Appendix B: Supplementary Information to Chapter 3
Species Selection
We selected 25 annual Mediterranean plant species that span six orders in the angiosperms
(Boraginales, Caryophyllales, Fabales, Lamiales, Poales and Ranunculales). These species are
native to the Mediterranean-climate regions of California (n = 19) or Spain (n = 6), overlap
geographically with other species from the same native range (CalFlora [http://www.calflora.org]
and Euro+Med [http://www.emplantbase.org]), and all associate with grassland meadow habitat.
For these reasons, species from the same region have potential to compete in the wild. We
obtained the initial seeds for our experiment from commercial suppliers and independent donors,
and tested them for percent germinability prior to the experiment to correct seeding densities
based on germination rates.
Species pairs for the competitive trials were chosen to include comparisons at four taxonomic
levels (within the same genus, tribe, family, or order) and to include comparisons of both
California-California pairs (n = 9) and California-Spain pairs (n = 6). Although we initially
sought out a balanced design with 10 species pairs in each of the biogeographic contrasts, we
were restricted to the 15 pairs that were not so limited by competition that they produced seeds
across a range of relative conspecific frequencies. Because five California species were
competed against two other species of the same (native to California) and different (native to
Spain) origin, a total of 25 species were used to create our 15 species pairs (Tables S3.1 and
S3.2).
Greenhouse Experiment
Seeds for the greenhouse experiment were sown into 12.7 cm diameter, 23 cm deep treepots
filled with a 3:2 mixture of sand and screened topsoil, to mimic the sandy loam soils
characteristic of annual grasslands. The greenhouse was maintained at day/night temperatures of
14/7°C, which was set to gradually increase to 29/17°C on average by the end of the experiment.
High intensity discharge (HID) lighting was provided to create a 12 h photoperiod. Each pot was
103
watered daily to saturation using a drip irrigation system during a three-week establishment
period, after which pots were randomly assigned to either a wet or dry soil moisture treatment.
Using a drip irrigation system, pots in the wet treatment received 175 mL water twice as often as
those in the dry treatment. Pots were watered at one and two day intervals initially, which was
extended to seven and 14 days (for wet and dry treatments respectively) as the growing season
progressed [see Fig. S3.1 in Germain and Gilbert (2014) for a schematic of the watering and
temperature conditions throughout the experiment]. These two soil moisture regimes were
selected to simulate realistic inter-annual differences in precipitation, or equally, the 30-year
average differences between wet (mesic) [662 mm] and dry [312 mm] sites across the species
ranges (http://www.climate-charts.com). We confirmed that the wet (11.1 ± 0.56%; mean ± SE
percent soil moisture content) and dry (5.8 ± 0.42%) treatments were effective using a
volumetric water probe (HydroSense™, Campbell Scientific Australia). Prior to flowering (~60
days after planting), we added 350 mL of 1500 ppm 20-20-20 NPK fertilizer (Plant Products,
Inc., Brampton, Ontario) to each pot. Pollination was provided by commercial colonies of the
generalist pollinator Bombus impatiens, which were active throughout the flowering period
(Biobest Canada, Leamington, Ontario).
At the end of the experiment, subsampled seeds were cleaned of debris, weighed, and
enumerated to estimate the size and number of seeds produced. Seed size was estimated as the
mass of seeds in the subsample divided by number of seeds in the subsample, and seed number
was calculated as the average number of seeds produced per plant in each pot.
Statistical Analyses
In all of our mixed effects models, we used backwards selection of the fixed factors, starting with
the most complex model and dropping higher-order interactions that did not improve model fit
(i.e., that did not minimize the AIC scores). All random effects were kept in the models, as these
were necessary to account for non-independence between some species and samples due to
constraints of the experimental design. Backwards selection of the fixed factors was performed
using the ‘step’ function in the ‘lmerTest’ R package. All analyses were conducted in R v. 3.0.2
(R Core Team 2014).

104
Supplementary tables and figures
Table S3.1. ID codes and taxonomic information for the 25 species included in this study.
ID codes Species names Order Family
CCAPI Crepis capillaris Asterales Asteraceae
LCALI Lasthenia californica Asterales Asteraceae
LGLAB Lasthenia glabrata Asterales Asteraceae
MELEG Madia elegans Asterales Asteraceae
ULIND Uropappus lindleyi Asterales Asteraceae
SGALL Silene gallica Caryophyllales Caryophyllaceae
CBERL Chenopodium berlandieri Caryophyllales Chenopodiaceae
MNUTT Monolepis nuttalliana Caryophyllales Chenopodiaceae
CPERF Claytonia perfoliata Caryophyllales Montiaceae
LPURS Lotus purshianus Fabales Fabaceae
LBICO Lupinus bicolor Fabales Fabaceae
CHETE Collinsia heterophylla Lamiales Lamiaceae
SCOLU Salvia columbariae Lamiales Lamiaceae
SVIRI Salvia viridis Lamiales Lamiaceae
BCUCU Bromus cucamonga Poales Poaceae
HDEPR Hordeum depressum Poales Poaceae
HVULG Hordeum vulgare Poales Poaceae
VMICR Vulpia microstachys Poales Poaceae
VMYUR Vulpia myuros Poales Poaceae
VOCTO Vulpia octoflora Poales Poaceae
ECAES Eschscholzia caespitosa Ranunculales Papaveraceae
EMEXI Eschscholzia mexicana Ranunculales Papaveraceae
MARVE Myosotis arvensis Boraginales Boraginaceae
NMENZ Nemophila menziesii Boraginales Boraginaceae
PCAMP Phacelia campanularia Boraginales Boraginaceae

105
Table S3.2. Summary of species’ seed size and seed number responses to conspecific frequency, soil moisture environment, and their
interaction.
Seed size Seed number
In competition Not in
competition
In competition Not in
competition
species origin Freq Env Freq × Env Env Freq Env Freq × Env Env
Ulind California 0 0 0 0 - 0 0 0
Ccapi Spain - - 0 0 - 0 0 -
Ulind California 0 0 0 - 0 ×
Mele California 0 0 0 0 - - 0 0
Lglab California 0 0 0 0 0 - 0 0
Lcali California 0 + 0 0 0 + 0 -
Mnutt California + 0 0 0 + 0 0 +
Sgall Spain - 0 0 0 - - 0 0
Cberl California 0 - 0 0 - 0 0 -
Cperf California 0 0 0 0 0 0 0 0
Lbico California 0 0 0 0 + - 0 0
Lpurs California - - 0 0 - 0 0 0
Scolu California 0 0 0 + 0 0 0 0
Chete California + + × + - 0 0 0
Scolu California - + 0 0 - 0
Sviri Spain 0 + × 0 - + × 0
Bcucu California 0 0 0 0 - 0 × 0
Hdepr California + 0 0 0 0 0 0 0
Bcucu California 0 0 0 0 0 0
Hvulg Spain 0 0 0 + - - 0 0
Vmicr California 0 - 0 - 0 0 0 0
Vmyur Spain 0 - 0 - - - 0 0
Vmicr California 0 - 0 0 0 0
Vocto California 0 0 0 + 0 0 0 0
Ecaes California + 0 0 0 + 0 0 0
Emexi California - - 0 0 0 0 × -

106
Pcamp California + 0 0 0 0 0 0 0
Nmen California - 0 0 0 0 - 0 0
Pcamp California 0 0 × - 0 0
Marv Spain 0 0 0 0 - + 0 -
Total significant
responses
11 11 3 6 17 11 4 6
Notes: Values in red and yellow cells are significant (red cells; P < 0.05) and marginally significant (yellow cells; P < 0.10) responses.
Because some focal species were competed twice against different species (5 cases), species pairs separated by a dashed line have the
same focal species; in these cases, we shade cells in grey to avoid redundancy in environmental responses when not in competition.
Positive symbols indicate that seed size or seed number increased in response to high conspecific frequency or dry soil moisture
conditions; negative symbols are the opposite.

107
Table S3.3. Summary of a reduced backward-selected linear mixed effects model testing for
effects of species identity, soil moisture, and conspecific frequency on the seed size in 25 annual
plant species.
F P
Species 2.26 <0.001 Soil moisture 0.94 0.334
Frequency 0.48 0.490
Species*soil moisture 3.19 <0.001 Species*frequency 2.84 <0.001
Table S3.4. Summary of a reduced backward-selected linear mixed effects model testing for
effects of species identity, soil moisture, and conspecific frequency on seed number in 25 annual
plant species.
F P
Species 5.05 <0.001 Soil moisture 0.51 0.477
Frequency 53.17 <0.001
Species*soil moisture 1.62 0.022
Species*frequency 6.63 <0.001
Soil moisture*frequency 4.49 0.034
Table S3.5. Summary of a reduced backward-selected linear mixed effects model testing for
effects of phylogenetic distance, biogeographic history (California-California vs. California-
Spain), soil moisture, and biogeographic origin (California vs. Spain) nested within
biogeographic history on the slope of the relationship between seed size and conspecific
frequency in 25 annual plant species.
F P
Phylogenetic distance (PD) 2.21 0.147
Biogeographic history (BH) 0.50 0.485
Soil moisture (SM) 0.73 0.398
PD x SM 1.74 0.196
PD x BH 4.55 0.041
BH x SM 0.90 0.350
PD x BH x SM 2.29 0.141
PD x BH x biogeographic origin x SM 4.55 0.019

108
Figure S3.1. Maximum clade credibility tree of the 25 annual plant species with median node
heights. The tree was generated in BEAST using ITS1/5.8S/ITS2 and rbcL sequence data, and
calibrated to real-time based on fossil records. The scale bar is in millions of years ago, and
nodal support values are the posterior probabilities; * indicates nodes that were fixed based on a
priori information. The original tree of 30 species (Germain et al. 2016) was pruned for analysis
to the 25 used in the current experiment; pruned species are shown in grey. See Table S3.1 for
species codes.
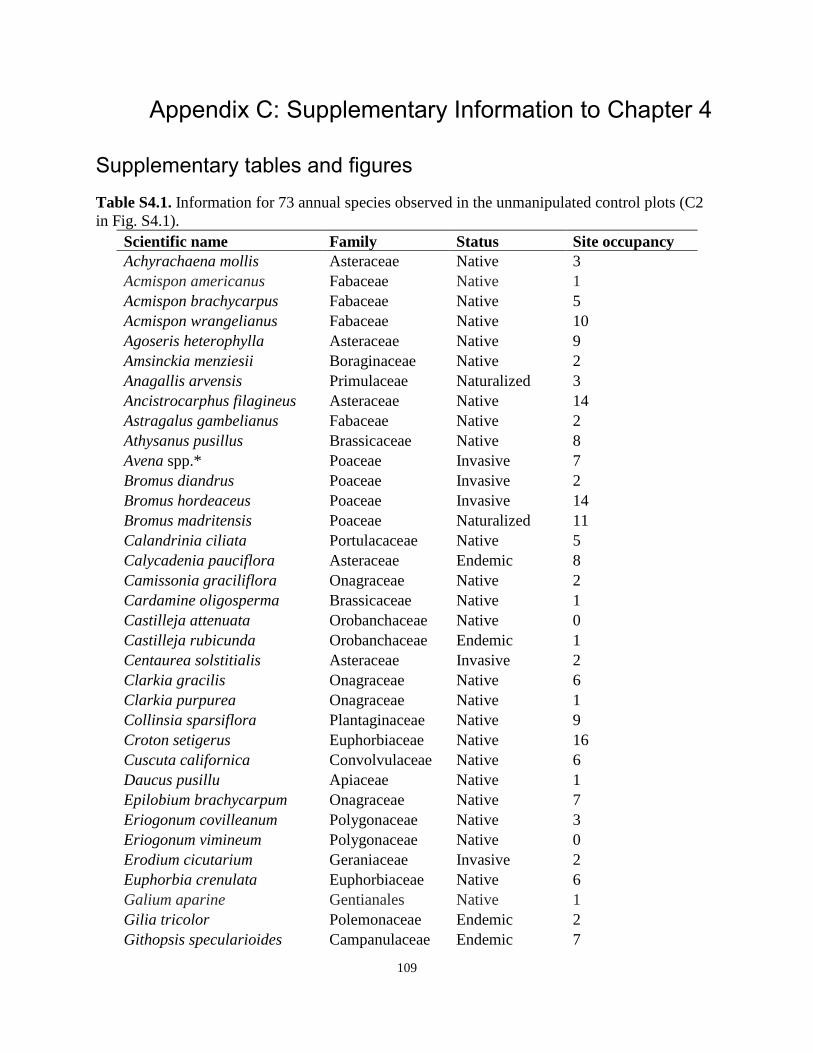
109
Appendix C: Supplementary Information to Chapter 4
Supplementary tables and figures
Table S4.1. Information for 73 annual species observed in the unmanipulated control plots (C2
in Fig. S4.1).
Scientific name Family Status Site occupancy
Achyrachaena mollis Asteraceae Native 3
Acmispon americanus Fabaceae Native 1
Acmispon brachycarpus Fabaceae Native 5
Acmispon wrangelianus Fabaceae Native 10
Agoseris heterophylla Asteraceae Native 9
Amsinckia menziesii Boraginaceae Native 2
Anagallis arvensis Primulaceae Naturalized 3
Ancistrocarphus filagineus Asteraceae Native 14
Astragalus gambelianus Fabaceae Native 2
Athysanus pusillus Brassicaceae Native 8
Avena spp.* Poaceae Invasive 7
Bromus diandrus Poaceae Invasive 2
Bromus hordeaceus Poaceae Invasive 14
Bromus madritensis Poaceae Naturalized 11
Calandrinia ciliata Portulacaceae Native 5
Calycadenia pauciflora Asteraceae Endemic 8
Camissonia graciliflora Onagraceae Native 2
Cardamine oligosperma Brassicaceae Native 1
Castilleja attenuata Orobanchaceae Native 0
Castilleja rubicunda Orobanchaceae Endemic 1
Centaurea solstitialis Asteraceae Invasive 2
Clarkia gracilis Onagraceae Native 6
Clarkia purpurea Onagraceae Native 1
Collinsia sparsiflora Plantaginaceae Native 9
Croton setigerus Euphorbiaceae Native 16
Cuscuta californica Convolvulaceae Native 6
Daucus pusillu Apiaceae Native 1
Epilobium brachycarpum Onagraceae Native 7
Eriogonum covilleanum Polygonaceae Native 3
Eriogonum vimineum Polygonaceae Native 0
Erodium cicutarium Geraniaceae Invasive 2
Euphorbia crenulata Euphorbiaceae Native 6
Galium aparine Gentianales Native 1
Gilia tricolor Polemonaceae Endemic 2
Githopsis specularioides Campanulaceae Endemic 7

110
Hemizonia congesta Asteraceae Native 24
Hesperolinon spp.* Linaceae Endemic 9
Holocarpha virgata Asteraceae Endemic 3
Hypochaeris glabra Asteraceae Invasive 2
Juncus bufonius Juncaceae Native 1
Lactuca spp.* Asteraceae Naturalized 10
Lagophylla minor Asteraceae Endemic 3
Lasthenia californica Asteraceae Native 16
Lepidium nitidum Brassicaceae Native 4
Lessingia ramulosa Asteraceae Endemic 7
Linanthus bicolor Polemoniaceae Native 3
Linanthus dichotomus Polemoniaceae Native 1
Lolium multiflorum Poaceae Naturalized 11
Lupinus bicolor Fabaceae Native 2
Lupinus succulentus Fabaceae Native 1
Micropus californicus Asteraceae Native 10
Microseris douglasii Asteraceae Native 12
Mimulus douglasii Phrymaceae Native 5
Mimulus guttatus Phrymaceae Native 1
Minuartia douglasii Caryophyllaceae Native 1
Navarretia jepsonii Polemoniaceae Rare/Endemic 4
Navarretia pubescens Polemoniaceae Native 1
Nemophila heterophylla Boraginaceae Native 2
Nemophila pedunculata Boraginaceae Native 1
Phlox gracilis Polemoniaceae Native 3
Plantago erecta Plantaginaceae Native 24
Riggiopappus leptocladus Asteraceae Native 6
Sidalcea diploscypha Malvaceae Endemic 5
Stellaria nitens Caryophyllaceae Native 3
Taeniatherum caput-medusae Poaceae Invasive 8
Torilis arvensis Apiaceae Invasive 1
Trifolium albopurpureum Fabaceae Native 5
Trifolium bifidum Fabaceae Native 5
Trifolium depauperatum Fabaceae Native 1
Trifolium fucatum Fabaceae Native 2
Trifolium gracilentum Fabaceae Native 4
Velezia rigida Caryphyllaceae Naturalized 1
Vulpia microstachys Poaceae Native 26
Notes: Species’ statuses were cross-checked with CalFlora Plant Database (www.calflora.org);
species that occurred in 0 sites were observed in one of the other treatment or control plots.
*Avena fatua/A. barbata and Lactuca saligna/L. serriola were indistinguishable, and
Hesperolinon could not be identified to species.

111
Table S4.2. Fine-scale estimates of soil moisture, light availability, and slope inclination among
plots at the same site, among groups of sites occurring within 100 m, and among sites occurring
within the same half of the reserve.
Nested plot design
spatial
extent of
observation
soil moisture
(%)
light availability
(PAR)
slope inclination
(º)
F-
value P
F-
value P
F-
value P
halves w/i reserve 5 km 161.2 <0.001 17.2 <0.001 18.5 <0.001
groups w/i halves 100 m 3.4 0.068 64.9 <0.001 80.7 <0.001
sites w/i groups 5 m 14.7 <0.001 0.5 0.502 65.3 <0.001
plots w/i sites 1 m 0.44 0.505 0.8 0.382 0.3 0.566
residual df 711 475 474
Notes: Analyses are nested analysis of variance using ‘aov’ R function; data are from two (light
availability, slope inclination) or three (soil moisture) subsamples per plot for all eight plots per
site. The statistical annotation of the independent factors is ~halves/groups/sites/plots (Fig. S4.1).
Table S4.3. Summary of a reduced backward-selected linear mixed effects model testing the
effects of composite environmental conditions (PCA1 and PCA2), seed pooling treatment, and
species on the occurrence patterns of 73 annual plant species.
Χ2 P
PCA1 2.31 0.129
PCA2 7.75 <0.005 treatment 338.59 <0.001 species 1295.72 <0.001 PCA1:PCA2 0.266 0.606
PCA1:treatment 3.07 0.546
PCA2:treatment 6.20 0.184
PCA1:species 204.73 <0.001 PCA2:species 211.16 <0.001 PCA1:PCA1:treatment 15.08 0.005

112
Figure S4.1. Map of field site with the six groups of five sites (a) and the seed pooling treatment
design for a block of plots at a single site (b). Dashed grey arrows indicate seed material source
plots, and solid black arrows indicate recipient plots. Plots C1 to C3 are control plots: material
removed without replacement (C1), no manipulation (C2), and material collected and transferred
to the same plot (C3). Colored plots are the treatment plots, receiving material mixed from plots
at increasing spatial scales: a single plot from the same site (1 m), a mix of plots within a site (5
m, mix i), a mix of plots from the same cluster of five sites (100 m, mix j), a mix of plots within
the same half of the reserve (east vs. west side; 5 km, mix k), and a mix of plots across the entire
reserve (10 km, mix l). Source material from the recipient plot of the 1 m treatment was
discarded.

113
Figure S4.2. Community composition biplot of PCoA using Jaccard’s dissimilarity. Points in
grey are control treatments (Fig. S4.1): vacuumed without replacement (C1; triangles),
unmanipulated plots (C2; circles), and vacuumed with replacement but not pooled (C3; squares).
Species composition becomes more distinct and less variable with increasing spatial scale.
Figure S4.3. Effect of spatial scale of seed pooling on the percentage of species that are
significantly associated with the environment. The grey region is the percentage of significant
results expected due to type I error with multiple comparisons.

114
Figure S4.4. Site occupancy (based on number of sites each species occurs in) increases with
spatial scale (also note upwards shift in y-intercept) and becomes more even (decrease in
regional rarity).
Figure S4.5. Photos of McLaughlin reserve showing (a) a serpentine meadow in the foreground
of non-serpentine oak hillside, and (b) an abrupt transition zone between two abutting serpentine
outcrops.

115
Appendix D: Supplementary Information to Chapter 5
Phylogenetic tree construction
We constructed a phylogenetic tree for the 30 species in our experiment using Bayesian methods
on ITS1/5.8S/ITS2 and rbcL nucleotide sequence regions. These regions were chosen because
they are relatively fast and slow evolving, respectively, and are thus good complements for
estimating divergence times at different depths in the phylogenetic tree. Separately for each
region, sequences were retrieved from GenBank, aligned using the MUSCLE algorithm in
MEGA (version 4.0), and combined into a single sequence matrix for analysis. We then loaded
the aligned sequence data from both sequence regions into BEAST (version 2.3.1) and generated
a Bayesian tree using a GTR substitution model selected by ModelTest (version 3.7) and an
uncorrelated lognormal relaxed molecular clock for branch length estimation; the site and clock
models of the two sequence regions were unlinked. We set lognormal priors on four internal
nodes (Poales = 1.8 [mean], 0.5 [standard deviation], 68.1 [minimum age in millions of years];
Fabales = 1.5, 0.5, 59.9; Caryophyllales = 1.5, 0.5, 83.5; Lamiales = 1.5, 0.5, 44.3) based on
published node calibrations for these groups, to calibrate the tree to real-time (in millions of
years) with the minimum age constraints based on the fossil record (Wikström et al. 2001). We
constrained the tree topology at nodes above the family-level based on well-resolved
relationships in the angiosperms (Bell et al. 2010; Stevens 2012) and thus did not require an
outgroup to root the tree because BEAST automatically performs molecular clock rooting above
the constrained nodes. We ran the MCMC chain for 100,000,000 generations, with a 10,000,000
burn-in and data logging every 9,000 generations. This analysis generated 10,000 posterior trees,
which were summarized into a single ultrametric maximum clade credibility tree with median
node heights. The resulting tree (Fig. S5.1) is fully resolved and consistent with Angiosperm
Phylogeny Group III classifications and estimated divergence times of major groups (Stevens
2012). We used the ‘cophenetic.phylo’ function in the R package ‘ape’ to calculate all pairwise
phylogenetic distances based on the branch length information of the 30 study species.

116
Details of lambda estimation
As described in the Materials and methods, we grew plants at low densities with seven replicate
pots per species × soil moisture environment. These replicates were used to calculate the
distribution of log-transformed finite rates of increase (λ) for each combination of species × soil
moisture environment by fitting separate linear models. The linear models tested the effects of
the number of individuals in each low density pot on finite rate of increase, to identify species for
which competition might affect our estimates of λ. These linear models were possible because,
although we thinned pots to eight individuals, low germination rates or post-thinning
germination/mortality caused some variation among pots in the numbers of individuals that were
present (mean = 6.3, sd = 2.2 individuals). For species with a significant to marginally-
significant slope (P < 0.1), we confirmed that significance was not driven by outlying
observations, and then used the intercept (± standard deviation [sd]) of the population growth
rate as λ. For species with a non-significant slope, we used the mean (± sd) population growth
rate across all replicates as λ. In both cases, these estimates were used as informative priors in the
Bayesian analysis described in the Materials and methods. For those species that have been
studied elsewhere, our estimated λ values were, on average, within one standard deviation (mean
= 0.56 standard deviations, n = 3) of existing estimates in the literature (Levine &
HillRisLambers 2009).
Supplementary equations
Equations for stabilizing differences (Eq. S5.1) and fitness differences (Eq. S5.2, S5.3) as
described in Materials and methods:
1 − 𝜌 = 1 − √𝛼𝑖𝑗
𝛼𝑗𝑗 ∙
𝛼𝑗𝑖
𝛼𝑖𝑖 (S5.1)
𝜅𝑗 𝜅𝑖⁄ =𝜆𝑗−1
𝜆𝑖−1 ∙ √
𝛼𝑖𝑗
𝛼𝑗𝑗 ∙
𝛼𝑖𝑖
𝛼𝑗𝑖 (S5.2)
𝛫 = max (𝜅𝑗 𝜅𝑖 , 𝜅𝑖 𝜅𝑗)⁄ ⁄ (S5.3)

117
Supplementary tables and figures
Table S5.1. Taxonomic and sequence accession (ITS1/5.8S/ITS2 and rbcL regions) information for the 30 study species, organized to
show each focal species and its sympatric and allopatric competitor
Species names Order Family Origin ITS1/5.8S/ITS2 rbcL
Lasthenia glabrata Asterales Asteraceae California AF391593.1 AIW51855.1*
Lasthenia californica Asterales Asteraceae California AF467195.1 NA
Centaurea melitensis1 Asterales Asteraceae Spain HQ540425.1 EU384954.1
Uropappus lindleyi Asterales Asteraceae California AF386495.1 NA
Madia elegans Asterales Asteraceae California AF413612.1 AY215141.1*
Crepis capillaris1 Asterales Asteraceae Spain AJ633353 KM360738.1
Phacelia campanularia Boraginales Boraginaceae California AF091188.1
KF158107.1
Nemophila menziesii Boraginales Boraginaceae California AF091183.1
KF158108.1
Myosotis arvensis Boraginales Boraginaceae Spain AY092908.1
HM850186.1
Chenopodium berlandieri Caryophyllales Amaranthaceae California HE577429.1 JF941268.1*
)
Claytonia perfoliata2 Caryophyllales Montiaceae California AY764040.1 AF132093.1
Portulaca oleracea Caryophyllales Portulacaceae Spain JF508578.1 HQ621340.1
Monolepis nuttalliana Caryophyllales Amaranthaceae California HE577375.1 AY270108.1
Atriplex patula2 Caryophyllales Amaranthaceae California DQ499332.1 HM849801.1
Silene gallica Caryophyllales Caryophyllaceae Spain U30959/U30985 HM850354.1
Lupinus bicolor Fabales Fabaceae California DQ524209.1 Z70056.1*
Lotus purshianus Fabales Fabaceae California AF467067.1 HM850139.1*
Trifolium incarnatum Fabales Fabaceae Spain AF053160.1 HM850415.1
Salvia columbariae Lamiales Lamiaceae California DQ667219.1* AY570408.1

118
Collinsia heterophylla Lamiales Lamiaceae California AF385337.1 AF026825.1*
Salvia viridis Lamiales Lamiaceae Spain DQ667222.1* AY570450.1
Bromus carinatus Poales Poaceae California AY367948.1 KM360707.1
Hordeum depressum Poales Poaceae California AJ607894.1 NA
Hordeum vulgare Poales Poaceae Spain FJ593180.1 AY137456.1
Vulpia microstachys Poales Poaceae California EF584981.1 NA
Vulpia octoflora Poales Poaceae California EF584982.1 KJ773986
Vulpia myuros Poales Poaceae Spain AY118092.1 KF713076.1
Eschscholzia caespitosa Ranunculales Papaveraceae California JF892592.1 NA
Eschscholzia californica Ranunculales Papaveraceae California DQ912884.1
HM849984.1
Papaver dubium Ranunculales Papaveraceae Spain DQ250322.1
HM850229.1
Notes: Species contrasts are delineated by row shading, with the focal species in bold type. Superscripts represent contrasts with
partial branch length overlap, one of which (M. nuttalliana/A. patula2) was excluded from analysis because the latter did not flower.
*Sequences were unavailable, and were replaced with those of known sister species (S. columbariae = S. clevelandii, S. viridis = S.
sclarea (Walker et al. 2004)) or congeners as appropriate. ‘NA’ means that sequences were unavailable for that species.

119
Table S5.2. Comparing fits of alternative annual plant models
Model AICc scores
1 𝑁𝑖 𝑡+1 = 𝑁𝑖 𝑡 ∙ 𝜆𝑖
1 + 𝛼𝑖𝑖𝑁𝑖 𝑡 + 𝛼𝑖𝑗𝑁𝑗 𝑡 2236
2 𝑁𝑖 𝑡+1 = 𝑁𝑖 𝑡 ∙ 𝜆𝑖𝑒−𝛼𝑖𝑖𝑁𝑖 𝑡−𝛼𝑖𝑗𝑁𝑗 𝑡 2468
3 𝑁𝑖 𝑡+1 = 𝑁𝑖 𝑡 ∙ 𝜆𝑖
1 + 𝑁𝑖 𝑡𝛼𝑖𝑖 + 𝑁𝑗 𝑡
𝛼𝑖𝑗 2556
4 𝑁𝑖 𝑡+1 = 𝑁𝑖 𝑡 ∙ 𝜆𝑖
1 + (𝛼𝑖𝑖𝑁𝑖 𝑡 + 𝛼𝑖𝑗𝑁𝑗 𝑡)𝑏𝑖 2625
5 𝑁𝑖 𝑡+1 = 𝑁𝑖 𝑡 ∙ 𝜆𝑖𝑒−𝛼𝑖𝑖ln (𝑁𝑖 𝑡+1)−𝛼𝑖𝑗ln (𝑁𝑗 𝑡+1) 2748
6 𝑁𝑖 𝑡+1 = 𝑁𝑖 𝑡 ∙ 𝜆𝑖
(1 + 𝛼𝑖𝑖𝑁𝑖 𝑡 + 𝛼𝑖𝑗𝑁𝑗 𝑡)𝑏𝑖 2892
Notes: All models were simultaneously fit to each focal species i vs. sympatric species j and
allopatric species k. The AICc scores were summed across each three-species contrast × soil
moisture environment for model comparison. The parameters are described in the Materials and
methods, except for bi which allows individuals to vary in competitive impacts as their density
increases. Model formulations are taken from Levine and HilleRisLambers (2009).

120
Table S5.3. Parameter estimates used to calculate stabilizing and fitness differences (Eqs. S5.1 and S5.2)
Species Soil
env
Parameter estimates
i j k λi λj λk αii αjj αkk αij αji αik αki
B. carinatus H. depressum H. vulgare wet 79.0 155.1 22.8 0.175 0.138 0.227 0.001 0.795 0.623 0.006
C. berlandieri C. perfoliata P. oleracea wet 69.4 8.6 509.2 0.223 0.007 279.72 <0.001 0.065 <0.001 219.90
E. caespitosa E. californica P. dubium wet 67.0 53.7 947.4 0.004 0.012 0.705 3.573 2.388 15.10 0.008
L. bicolor L. purshianus T. incarnatum wet 4.3 58.4 1136.3 0.563 12.01 20.18 0.796 0.096 7.845 0.945
L. glabrata L. californica C. melitensis wet 389.8 839.0 1.8 0.054 0.098 0.180 0.003 0.219 0.001 0.728
M. nuttalliana A. patula S. gallica wet 587.5 0.1 989.4 0.263 0.001 0.119 0.003 <0.001 8.227 <0.001
P. campanularia N. menziesii M. arvensis wet 63.6 9.6 352.4 0.142 0.140 0.107 0.006 0.004 0.004 <0.001
S. columbariae C. heterophylla S. viridis wet 318.9 727.9 75.6 0.231 2.358 0.126 0.403 0.001 0.128 0.070
U. lindleyi M. elegans C. capillaris wet 35.9 75.5 323.6 0.384 1.271 1.342 0.069 0.001 0.003 0.002
V. microstachys V. octoflora V. myuros wet 235.8 923.8 314.8 0.099 0.456 0.200 0.083 0.302 0.227 0.002
B. carinatus H. depressum H. vulgare dry 563.3 138.0 15.7 2.176 0.036 0.266 0.001 1.291 2.85 0.005
C. berlandieri C. perfoliata P. oleracea dry 44.1 14.5 331.1 0.267 0.022 0.017 0.001 0.072 0.001 221.85
E. caespitosa E. californica P. dubium dry 100.9 52.2 617.4 0.010 3.091 0.829 9.309 0.002 56.02 0.004
L. bicolor L. purshianus T. incarnatum dry 7.1 13.1 392.8 3.983 3.551 13.42 2.158 0.003 8.221 0.009
L. glabrata L. californica C. melitensis dry 468.7 666.3 1.6 0.157 0.214 0.438 0.042 0.105 0.066 0.689
M. nuttalliana A. patula S. gallica dry 1148.4 0.1 923.8 0.045 0.001 0.153 0.611 <0.001 8.303 <0.001
P. campanularia N. menziesii M. arvensis dry 103.9 3.8 303.2 0.361 0.009 0.136 0.006 0.026 0.002 <0.001
S. columbariae C. heterophylla S. viridis dry 305.3 124.3 69.8 0.130 0.518 0.177 0.847 <0.001 0.444 0.038
U. lindleyi M. elegans C. capillaris dry 38.3 120.3 166.9 0.505 3.608 0.855 0.001 0.005 0.001 0.002
V. microstachys V. octoflora V. myuros dry 152.9 1126.9 677.3 0.082 0.515 0.248 0.002 0.574 0.097 0.022
Notes: See Table S5.1 and Fig. S5.1 for full species names and taxonomic information. Focal species i (bold) were competed against
both species j (sympatric) and k (allopatric).

121
Table S5.4. Germination (g) and species-specific seed bank viability (s) rates used for alternative
seed bank viability scenarios
Species Germination Seed bank viability
i j k gi gj gk si sj sk
B. carinatus H. depressum H. vulgare 0.39 0.24 0.49 0.17 0.17 0.00
C. berlandieri C. perfoliata P. oleracea 0.62 0.25 0.35 0.00 0.35 0.11
E. caespitosa E. californica P. dubium 0.17 0.08 0.28 0.18 0.59 0.28
L. bicolor L. purshianus T. incarnatum 0.14 0.17 0.22 0.01 0.08 0.07
L. glabrata L. californica C. melitensis 0.58 0.46 0.48 0.13 0.23 0.00
M. nuttalliana A. patula S. gallica 0.36 0.24 0.80 0.59 NA 0.00
P. campanularia N. menziesii M. arvensis 0.54 0.28 0.61 0.47 0.64 0.23
S. columbariae C. heterophylla S. viridis 0.55 0.40 0.66 0.29 0.56 0.00
U. lindleyi M. elegans C. capillaris 0.32 0.07 0.09 0.61 0.03 0.23
V. microstachys V. octoflora V. myuros 0.54 0.51 0.63 0.88 0.71 0.58
Notes: See Table S5.1 and Fig. S5.1 for full species names and taxonomic information. Focal
species i (bold) were competed against both species j (sympatric) and k (allopatric). Rates g and s
were calculated separately, from the germination of seeds in the low-density λ pots (for g) and
through a germination trial comparing germination rates before and after gibberellic acid
application (for s); the 0% and 100% seed bank viability scenarios were s = 0 and s = 1 for all
species, respectively. The same values of g and s were used in wet and dry environments,
because the watering treatments were imposed post-germination.

122
Table S5.5. Effects of phylogenetic distance (PD), biogeographic history (BH), soil moisture (SM), and their interactions on
stabilizing differences, fitness differences, and coexistence
logit(stabilizing differences) log(fitness differences) log(coexistence metric)
χ2 P-value χ
2 P-value χ
2 P-value
PD 0.02 0.900 17.72 <0.001 2.08 0.149
BH 0.70 0.403 5.82 0.016 1.92 0.166
SM 0.01 0.922 0.26 0.613 1.94 0.164
PD × BH 8.75 0.003 2.60 0.107 3.89 0.049
PD × SM 1.15 0.283 1.21 0.271 2.07 0.151
BH × SM 1.12 0.290 0.38 0.537 0.18 0.675
PD × BH × SM 0.08 0.775 <0.01 0.960 <0.01 0.979
Variance weights none varIdent(form=~PD|BH) varPower(form=~PD)
Notes: All P-values based on a χ2 tests of maximum likelihood ratios with 1 degree of freedom, summarized using the ‘Anova’
function in ‘car’ R package; significant P-values are in bold type.
Table S5.6. Effects of phylogenetic distance (PD) on the fitness components of sympatric and allopatric species pairs
Sympatric Allopatric
χ2 P-value χ
2 P-value
Demographic component 5.91 0.015 0.70 0.402
Competitive component 0.02 0.881 6.67 0.010
Fitness difference 11.39 <0.001 7.35 0.007
Notes: All P-values based on a χ2 tests of maximum likelihood ratios with 1 degree of freedom, summarized using the ‘Anova’
function in ‘car’ R package; significant P-values are in bold type. Variance weights are varIdent(~PD) for allopatric pairs; no weights
were necessary for sympatric pairs.

CHAPTER 1: GENERAL INTRODUCTION
123
Figure S5.1. Maximum clade credibility tree of the 30 annual plant species with median node
heights. The tree was generated in BEAST using ITS1/5.8S/ITS2 and rbcL sequence data, and
calibrated to real-time based on fossil records. The scale bar is in millions of years ago, and
nodal support values are the posterior probabilities; * indicates nodes that were fixed based on a
priori information. See Table S5.1 for species information.
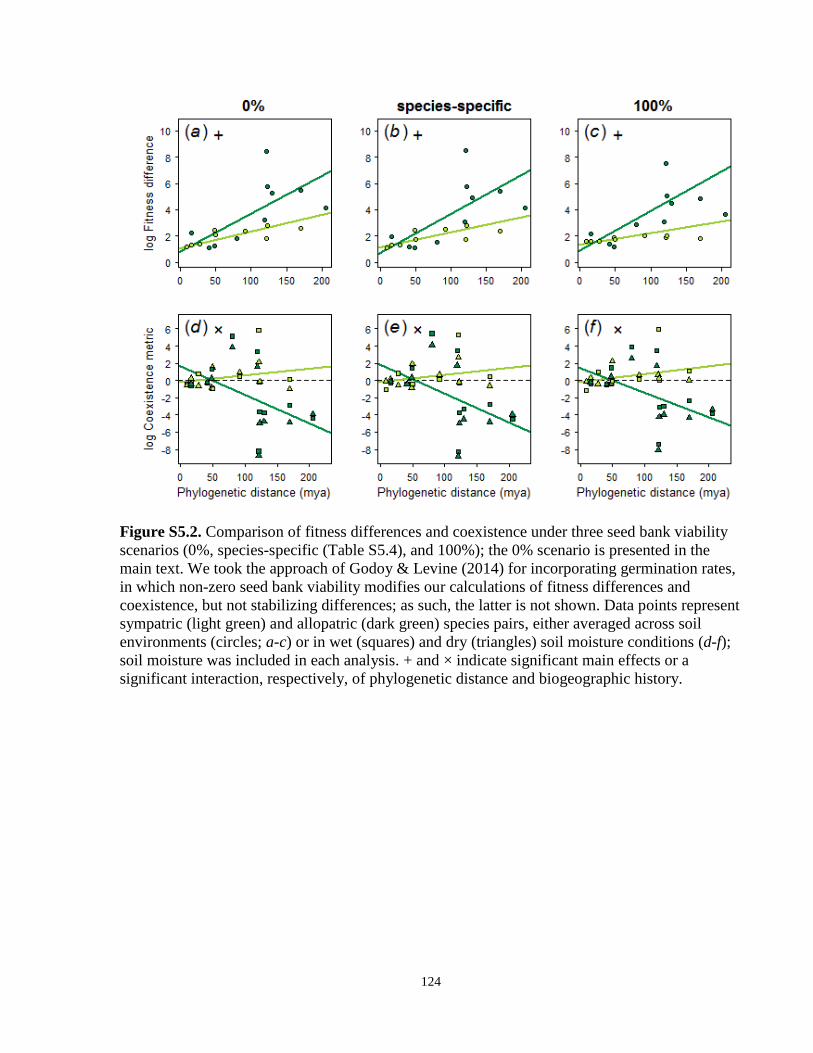
124
Figure S5.2. Comparison of fitness differences and coexistence under three seed bank viability
scenarios (0%, species-specific (Table S5.4), and 100%); the 0% scenario is presented in the
main text. We took the approach of Godoy & Levine (2014) for incorporating germination rates,
in which non-zero seed bank viability modifies our calculations of fitness differences and
coexistence, but not stabilizing differences; as such, the latter is not shown. Data points represent
sympatric (light green) and allopatric (dark green) species pairs, either averaged across soil
environments (circles; a-c) or in wet (squares) and dry (triangles) soil moisture conditions (d-f);
soil moisture was included in each analysis. + and × indicate significant main effects or a
significant interaction, respectively, of phylogenetic distance and biogeographic history.

CHAPTER 1: GENERAL INTRODUCTION
125
Copyright Acknowledgements
Chapter 2: Reprint permissions were provided by the publisher, John Wiley and Sons (license #:
3883620546808)
Chapter 5: Reprint permissions are not required by Proceedings of the Royal Society B:
Biological Sciences or their parent publisher