histologic and electroretinographic evidence of …
TRANSCRIPT

The Pennsylvania State University
The Graduate School
College of Medicine
HISTOLOGIC AND ELECTRORETINOGRAPHIC EVIDENCE OF
DIABETES-INDUCED RETINAL NEURODEGENERATION
A Dissertation in
Anatomy
by
William F. Robinson, Jr.
© 2010 William F. Robinson, Jr.
Submitted in Partial Fulfillment
of the Requirements
for the Degree of
Doctor of Philosophy
December 2010

ii
The dissertation of William F. Robinson, Jr. was reviewed and approved* by the following:
Alistair J. Barber
Associate Professor of Ophthalmology and Cellular and Molecular Physiology
Dissertation Advisor
Chair of Committee
Patricia J. McLaughlin
Professor of Neural and Behavioral Sciences; Director, Graduate Program in Anatomy
Shao-Min Zhang
Assistant Professor of Neural and Behavioral Sciences
Steve Abcouwer
Associate Professor of Surgery and Cellular and Molecular Physiology
*Signatures are on file in the Graduate School

iii
ABSTRACT
Diabetic retinopathy is a vision-threatening condition, currently affecting more than 5 million Americans. It is the leading cause of new cases of blindness in working-aged adults. The pathogenesis of the disease is poorly understood, but the earliest symptoms include subtle visual disturbances such as color and contrast sensitivity changes, delayed dark adaptation, and difficulty seeing in low-light environments. The earliest clinical signs of diabetic retinopathy are vascular abnormalities such as microaneurysms and edema. There is considerable evidence suggesting that retinal neurodegeneration takes place before the onset of such vascular changes.
Previous research in our lab has established that retinal neurodegeneration is an apoptotic event, leading to retinal thinning. Animal models of experimental diabetes have been used to determine that retinal thinning takes place preferentially in the inner retina. The retinal ganglion cells are especially vulnerable, demonstrating the greatest loss in peripheral regions of the retina. The current study seeks to further explore the effects of diabetes on the neuronal components of retinas from human donors and from diabetic mice. The studies compiled here seek to test the hypotheses that early stages of diabetes lead to histologic evidence of neurodegeneration in human donor tissue, and that diabetes in the Ins2Akita mouse leads to alterations in rhodopsin content and electroretinographic output.
Donor retinas from humans who had had diabetes for less than 10 years were compared with retinas from age-matched nondiabetic donors. Comparisons were made on the basis of retinal thickness and cell counts. Ins2Akita mice, which spontaneously develop diabetes at 4 weeks of age, were tested after being diabetic for 7 weeks. Electroretinograms were recorded and the following waveforms were analyzed for amplitude and implicit time: scotopic threshold response, a- and b- waves, and oscillatory potentials.
Results of the human histopathology study indicate that, while there are no differences between retinal thickness measurements from diabetic vs. nondiabetic donors, the retinas from donors with short-term diabetes had fewer cells in the peripheral regions of the outer nuclear layer. Cell counts from the cone photoreceptors were unchanged, indicating rod loss. Studies of rod photoreceptor protein content demonstrated a decrease in rhodopsin content in diabetic mice, without a change in the protein content of other phototransduction proteins (transducin and phosphodiesterase). ERG results from diabetic mice demonstrate reduced scotopic threshold response and delayed oscillatory potentials, compared to age-matched controls.
The findings presented here confirm that neurodegeneration takes place in the peripheral retina early in the progression of diabetes in humans. In contrast to animal models in which the inner retina is implicated, it may be that the photoreceptors of the outer retina are the cells most vulnerable to neurodegeneration in humans with diabetes. Diabetic mice, however, demonstrate loss of rhodopsin without concomitant photoreceptor loss. ERG results in the Ins2Akita diabetic mice show deficits in scotopic vision and changes in oscillatory potentials similar to those seen in humans with diabetes.

iv
TABLE OF CONTENTS PAGE
List of Figures v List of Tables vi List of Abbreviations vii Acknowledgments viii Chapter One 1
Introduction 2
Chapter Two 10 Effect of Short-Duration Diabetes on Human Donor Retinas 10
Introduction 11 Experimental Procedures 13 Results 18 Discussion 27
Chapter Three 30 Effect of Diabetes on Photoreceptor Protein Expression 30
in Diabetic Mouse Retinas
Introduction 31 Experimental Procedures 35 Results 41 Discussion 49
Chapter Four 52
Electroretinographic Response to Diabetes in Ins2Akita Mice 52
Introduction 53 Experimental Procedures 60 Results 63 Discussion 84
Chapter Five 88
Concluding Discussion 88
References 95

v
LIST OF FIGURES PAGE 1. Cross section of human retina demonstrates layered cellular structure 20
2. Cell layer thickness in central and peripheral regions of human retinas 21
3. Cell counts indicate fewer ONL cells in peripheral retinas from diabetic donors 23
4. Immunolabeled cones enable differential cone counts in human retinas 25
5. TUNEL labeling in donor retinas indicates frequency of apoptotic cells 26
6. Diabetes reduces rhodopsin protein content in 11 week Ins2Akita mice 41
7. Quantification of oligomers indicates that rhodopsin protein content in oligomer 43 form is not changed in diabetes
8. Transducin protein content is not altered by diabetes in 11 week old mice 44
9. Phosphodiesterase protein content is not altered by diabetes in 11 week old mice 45
10. Photoreceptor mRNA expression was unchanged in mice diabetic for 10 weeks 46
11. ONL cell counts are unaltered by diabetes in 11 week old mice 47
12. Immunofluorescent image analysis to compare rhodopsin content 48
13. ERG output demonstrates a- and b-wave in 11 week old mice 54
14. Oscillatory potentials recorded in Ins2Akita mice 56
15. Scotopic Threshold Response is recorded in dark-adapted animals 58
16. Positive STR amplitude is reduced in diabetic Ins2Akita mice 65
17. Negative STR is unchanged in 11 week old diabetic mice 67
18. ERG a-wave recordings for 11 week old Ins2Akita mice are largely unchanged 69 with diabetes
19. ERG b-wave response is largely unchanged by 11weeks age 71
20. Oscillatory potentials are significantly delayed in 11 week old diabetic mice 73
21. There is no difference in pSTR between controls, treated-, or untreated- 75 diabetic mice at 14 weeks
22. There is no difference in nSTR between controls, treated-, or untreated- 77 diabetic mice at 14 weeks
23. There is no difference in a-wave amplitude or implicit time measurements, 79 when comparing 14 week old controls, treated-, and untreated- diabetic mice
24. Untreated 14 week old diabetic mice demonstrate reduced b-wave implicit times 81
25. ERG oscillatory potentials for 14 week old Ins2Akita mice do not demonstrate 83 differences between controls, and treated, or untreated diabetic animals

vi
LIST OF TABLES PAGE
Table 1 Summary of donor demographics 14
Table 2 Detailed description of donor demographics 19
Table 3 Mass and blood glucose levels measured in diabetic and control mice 64

vii
LIST OF ABBREVIATIONS
µV Microvolt
AU Arbitrary Unit (of fluorescence)
DM Diabetes Mellitus
DR Diabetic Retinopathy
ERG Electroretinogram
INL Inner Nuclear Layer
IPL Inner Plexiform Layer
L-cone Long Wavelength-Sensitive Cone
M-cone Middle-Wavelength Sensitive Cone
ms Millisecond
NDRI National Disease Research Interchange
ONL Outer Nuclear Layer
OP Oscillatory Potential
OPL Outer Plexiform Layer
PDE Phosphodiesterase
pSTR Positive Scotopic Threshold Response
RGC Retinal Ganglion Cell
S-cone Short-Wavelength Sensitive Cone
STR Scotopic Threshold Response
STZ Streptozotocin
TUNEL Terminal deoxynucleotidyl transferase dUTP nick-end labeling
VEGF Vascular Endothelial Growth Factor

viii
ACKNOWLEDGMENTS
The author would like to thank Mrs. Rhona Ellis (deceased) for collecting and archiving the
human tissue; Dr. Kang Li (Penn State Hershey Histology Core facility) for paraffin
embedding, sectioning, and H&E staining; Mr. Wade Edris (Penn State Hershey Imaging
Core facility) for help with confocal microscopy; Ms. Ann Banko (Penn State Hershey
Department of Surgery) for performing the qRT-PCR work; and Dr. Peter Macleish
(Morehouse School of Medicine, Atlanta, GA) for the kind gift of mAb 7G6 anti-cone
arrestin antibody.

CHAPTER ONE
Introduction

2
Diabetes mellitus affects approximately 17.7 million Americans and is predicted to double by
the year 2030 1. The incidence of diabetic retinopathy correlates with the length of time the
patient has the disease, reaching as high as 97% prevalence by the 15th year after the onset of
diabetes 2. The serious and debilitating effects of diabetic retinopathy encompass several
facets of vision loss, including decreases in contrast sensitivity, latency in adaptation to
darkened environments, and loss of visual acuity. Diabetic retinopathy usually affects both
eyes, though the severity may vary. Vision changes may begin subtly, but frequently
progress to severe vision deficits, making diabetic retinopathy the leading cause of legal
blindness in working-aged adults 2, 3.
The clinical diagnosis and staging of diabetic retinopathy are made on the basis of observed
changes in the retinal vasculature. The fundus may be evaluated by ophthalmoscopic
examination. The first observable stage is referred to as nonproliferative diabetic
retinopathy, and may include microaneurysms, small vessel occlusion, and ischemia in the
retina. Nonproliferative diabetic retinopathy may be subdivided into mild, moderate, and
severe stages. As the vascular pathologies develop, one may progress to proliferative
diabetic retinopathy, characterized by proliferation of new vasculature (neovascularization).
The new vessels tend to be more permeable, allowing for lipid exudates and hemorrhages.
Macular edema involves the accumulation of plasma and other fluids in the macular region of
the retina. 10% of the total diabetic population has macular edema, though prevalence tends
to correlate with severity of diabetic retinopathy. Macular edema may be due to increased
vessel permeability and/or breakdown of the blood-retinal barrier 4.

3
The earliest symptoms of diabetic retinopathy, as experienced by those who suffer from the
disease, are often subtle and may be difficult for the patient to describe. Vision abnormalities
range from difficulty with hue discrimination to areas of diminished vision within the visual
field known as scotomas. One of the earliest symptoms of visual disturbance is likely to be
loss of contrast sensitivity. Brinchmann-Hansen and colleagues studied 51 patients with
diabetes, finding that deficits in contrast sensitivity correlate with the degree of diabetic
retinopathy 5. Other authors report that abnormalities in contrast sensitivity occur before the
onset of vascular changes associated with diabetic retinopathy 6, 7.
Hue discrimination and color-contrast sensitivity are also symptoms associated with early
stages of diabetic retinopathy. Fristöm studied human subjects with and without diabetes,
subdividing the diabetic sample into groups based on presence of microaneurysms and hard
exudates. He found significant differences between non-diabetics and those with diabetes,
and that color contrast sensitivity deficits correlate with the degree of diabetic retinopathy 8.
Greenstein and colleagues came to similar conclusions and also found that the short-
wavelength sensitive (S-cone) pathway sensitivity was diminished in 70% of patients with
nonproliferative diabetes while the middle-wavelength sensitive (M-cone) pathway
sensitivity remained largely unchanged 9. Additional studies have indicated that color
contrast sensitivity is impaired before the onset of vascular changes in diabetic retinopathy
patients 10, 11.
Many patients with diabetes complain of difficulty with driving at night and have trouble
seeing when entering a darkened room due to delayed dark adaptation 12. Clinical testing

4
supports these anecdotal reports. In 1979 Henson and North used a dark adaptometer with 35
diabetic patients to measure the length of time required to recognize a stimulus after exposure
to bright light. Results indicated a significant delay in dark adaptation in diabetes 13.
A growing number of studies demonstrate the impact of diabetes on the neural portions of the
retina. In 1998, Barber and coworkers first suggested that apoptotic changes in the eyes of
diabetic animals indicated retinal neurodegeneration. Samples taken from streptozotocin
(STZ)-induced diabetic rats after 1, 3, 6, and 12 months of diabetes demonstrated increased
retinal apoptosis coupled with retinal thinning compared with age-matched control rats.
Specifically, there was a 9-10 fold increase in the number of apoptotic cells in the retinas of
diabetic rats. Furthermore, there was a 22% reduction in the thickness of the inner plexiform
layer of the retina 7.5 months after the onset of diabetes in STZ rats 14. Studies performed in
vitro using R28 neuronal cells demonstrated the protective effects of insulin in reducing
neural apoptosis, 15 and that such pro-survival effects could be blocked by high glucose and
glucosamine 16.
Continued research has shown apoptosis of specific cell types within the inner retina. Retinal
ganglion cells (RGCs) are especially vulnerable to apoptosis. Abu-El-Asrar and colleagues
used immunohistochemistry to demonstrate cleaved caspase-3 immunolabeling in the
ganglion cells of retinas from diabetic subjects. Other pro-apoptotic factors, Bax and Fas,
were also expressed in the ganglion cells and identified by immunohistochemistry 17.

5
Martin and coworkers came to the same conclusion regarding neurodegeneration of ganglion
cells in STZ diabetic mice, using TUNEL labeling techniques to detect apoptosis. Further
verification was performed, noting morphologic changes indicative of apoptosis via electron
microscopy 18. In another morphology-based study of ganglion cells, Gastinger and
colleagues studied Ins2Akita mice, which have a point mutation in the insulin 2 gene,
predisposing the heterozygotes to spontaneous loss of pancreatic beta cells with subsequent
loss of insulin production and hyperglycemia. Their study demonstrated that within 3
months, Ins2Akita diabetic mice lost 16.4% of retinal ganglion cells peripherally, and those
that survived underwent morphologic changes, including abnormal swellings throughout the
cell and increases in ON-type RGC dendrite length, density, and number of dendritic
terminals 19.
Gastinger and coworkers used TUNEL labeling and caspase-3 immunoreactivity in rat
retinas to identify a significant increase in apoptosis 2 weeks after streptozotocin-induced
diabetes, compared with age-matched controls. After 12 weeks, Ins2Akita diabetic mice
showed a 72% increase in apoptotic cells, compared to control littermates 20. Other retinal
layers and cell types have also been implicated in neurodegeneration. Amacrine cells, which
have cell bodies in the inner nuclear and ganglion cell layers, with synapses in the inner
plexiform layer, were identified undergoing apoptosis in diabetic animal models. After 6
months of diabetes, Ins2Akita mice demonstrated a 16-20% reduction in amacrine cell
numbers, compared to nondiabetic littermates 20.
6
While studying neuronal nitric oxide synthase (nNOS) expression in diabetic mice, Park and
colleagues described a significant reduction in the outer nuclear layer after 12 weeks of
diabetes and a 30% reduction after 24 weeks. They suggest that, in diabetes, nNOS-
expressing bipolar cells in the inner nuclear layer lead to the increased synthesis of nitric
oxide, which may be responsible for photoreceptor degeneration in the outer retina via
glutamate excitotoxicity 21. This would support work carried out by the Smith lab, which
studied H&E stained sections in diabetic and age-matched control mice and found that, in
addition to inner retina degeneration, the thickness of the outer nuclear layer was also
significantly decreased by 10 weeks after the induction of diabetes 18.
While an accumulating body of information has documented the changes to the various cell
types involved in diabetic retinopathy, it is important to remember that these structural
changes are likely indicative of functional changes. Due to the organized, stratified anatomy
of the mammalian retina, these structural changes in retinal ganglion cell layers and nuclear
layers indicate the loss of specific cell types which have particular functions within the visual
pathway. Additionally, decreases in inner- and outer plexiform layers may indicate
degeneration of synaptic transmission within the neural retina. Animal models demonstrate
that diabetes has a neurodegenerative effect on the retina, and suggest that such neuronal
dysfunction might be related to a decrease in synaptic protein levels 22, 23. Given the
detrimental effects of diabetes on neuronal cells and synaptic proteins in the retina, it is
important to proceed with animal research and translational research that can lead to greater
understanding and improved vision in humans with diabetes.

7
The electroretinogram (ERG) is frequently used to measure the electrical responses
originating from the retina due to light stimulus. The response, recorded by an electrode
placed on the cornea, produces a waveform with several components, provided by different
cell types from the neural retina. Immediately following light stimulus, the a-wave is a
negative deflection produced by the photoreceptors. The post-receptor b-wave response is a
large positive deflection originating primarily from the ON-center bipolar cells 24, 25,
modified by input from OFF-center bipolar and horizontal cells 26. The oscillatory potentials
(OPs) are small, higher frequency wavelets on the ascending portion of the b-wave, and are
thought to represent the modulation of interactions between bipolar, amacrine, and ganglion
cells 27, 28, and are often analyzed in clinical and research studies of diabetic retinopathy.
The scotopic threshold response (STR) is another component of the ERG, considered to be
an indicator of retinal ganglion cell function 28. While this response is often not measured,
because it can only be determined in response to very low intensity flashes of light after
prolonged dark adaptation, there is good evidence that it is reduced in both humans and rats
with diabetes 29-31. Furthermore, electrophysiological ganglion cell function was found to be
compromised even in children with diabetes 32. These data provide functional evidence of
diabetes-induced retinal ganglion cell degeneration.
The negative consequences of vascular and neuronal pathologies are apparent. Treatment
options for patients suffering with diabetic retinopathy, however, are limited. The current
standard of care for treatment of diabetic retinopathy is laser photocoagulation. This
technique, developed in 1968, utilizes laser energy focused on the retina, to treat the vascular

8
pathologies associated with diabetic retinopathy 3, 33. Photocoagulation treatment serves to
ablate peripheral blood vessels, and is largely successful at halting neovascularization; but in
so doing, peripheral regions of the retina are destroyed in an effort to salvage central vision.
Photocoagulation treatment is unlikely to improve vision after the procedure but rather serves
to prevent further vision loss. Unfortunately, repeated treatments of retinal photocoagulation
are sometimes required 34.
Other therapeutic options for treating diabetic retinopathy have been designed to treat the
vascular effects of disease progression with angiotensin converting enzyme inhibitors 35, 36 or
circulating endothelial progenitor cells 37. Neuroprotective treatments proposed include
Exendin-4, a glucagon-like peptide-1 (GLP-1) receptor agonist 38; lipoic acid 39 and lutein 40.
Adrenomedullin and erythropoietin therapies are reported to have both vasculoprotective and
neuroprotective benefits 41, 42. Clinical trials have been conducted to test the effectiveness of
PKC inhibitors, and while these have demonstrated visual improvements in patients,
compared with placebo groups 43, the benefits did not meet endpoints for FDA approval.
Another promising therapy in diabetic retinopathy is the use of compounds that block
vascular endothelial growth factor (VEGF) and thereby prevent angiogenesis. These anti-
VEGF drugs demonstrate the ability to reverse neovascularization 44 and improve visual
acuity 45. Unfortunately, the administration of these drugs is by repeated intravitreal
injection, which understandably diminishes patient appeal.
Maintaining tight glycemic control and preventing hypertension are logical preventative
measures that can be taken to reduce the risks of diabetic retinopathy 46-48. However, the

9
limitations of the drug therapies and the destructive nature of laser photocoagulation therapy
serve to underscore the importance of a more complete understanding of the pathogenesis in
diabetic retinopathy.

10
CHAPTER TWO
Effect of Short-Duration Diabetes on Human Donor Retinas

11
INTRODUCTION
Diabetic retinopathy is a disease process that takes its toll on the vascular and neuronal
components of the retina. The majority of persons with diabetes will progress to clinically
detectable diabetic retinopathy within 15 years of diagnosis 48, 49. Diabetic retinopathy often
causes appreciable vision loss and is the leading cause of new cases of blindness in working
aged adults 50. Clinically observable indicators of vascular disease (microaneurysms,
neovascularization, macular edema) are accompanied by functional vision loss, which may
be due to neurodegenerative changes 14, 51-54 that are more difficult to detect in vivo 55, 56.
Postmortem specimens, however, allow for histological analysis of retinal pathology in
diabetes, providing direct access to the tissue to perform immunolabeling, layer-specific cell
counts, and selective imaging from whole-mount and cross-sectional perspectives.
Once thought to be a strictly microvascular pathology, diabetic retinopathy is now
characterized as having a neurodegenerative component as well 14, 36, 57-61. Indicators of
neurodegeneration in animal models of diabetes include histologic evidence such as loss of
retinal thickness 14, 18, 21, 38, 42, 51, 52, 60-62, increased neural apoptosis 14, 18, 42, 52, 62, increased
reactivity of glial cells 53, 62-64, and decreased neuronal cell counts 14, 18, 38, 42, 51, 52, 60, 62.
Clinical studies also indicate functional alterations in color and contrast sensitivity 5, 8, 65-69,
dark adaptation, 13, 70-72, and electrophysiological changes 38, 51. Therefore, the evidence
strongly suggests that loss of visual function and neurodegeneration are prevailing
consequences of diabetes in both humans and animals. The present study seeks to test the
hypothesis that histologic evidence of neurodegeneration can be demonstrated in human

12
retinal tissue from donors with diabetes and that the results will indicate findings similar to
those seen in experimental diabetes animal models.
Animal models have been used to study many of the complications associated with diabetes.
The most frequently utilized model involves the use of streptozotocin (STZ), a chemical that
is toxic to pancreatic beta cells. When STZ is injected into rats or mice, the animals quickly
lose the ability to produce insulin and become hyperglycemic. STZ-induced diabetes in
animals leads to many of the same alterations observed in humans with diabetes, including
vascular pathology 42, 73, glial reactivity 53, 63, and alterations in ERG response 35, 38, 74-78.
Barber and colleagues used the STZ rat model to identify neural apoptosis and retinal
thinning in diabetes 14, and went on to elaborate on this retinal neurodegeneration by
studying the Ins2Akita mouse model. The Ins2Akita mouse has a point mutation in the insulin 2
gene which leads to insulin protein misfolding in pancreatic beta cells, and by four weeks of
age, beta cell death with hypoinsulinemia and hyperglycemia. Morphometric analysis
enabled Barber’s lab to discover an overall thinning of the diabetic retinas at 22 weeks of
hyperglycemia, and more severe thinning in the inner retina peripherally 62.
In the following study the thickness of cell layers and the number of cell bodies were
quantified in post mortem human retinas from 3 groups of donors; those with no diabetes
(ND), diabetes and no insulin treatment ((-)INS), and diabetes with insulin treatment
((+)INS). The donors were carefully age-matched and their duration of diabetes was reported
as less than ten years. The results indicate that peripheral regions of retinas had a lower
number of outer nuclear layer cells compared to age-matched non-diabetic retinas. The

13
number of cones was unaffected by diabetes, suggesting that only rod photoreceptors were
lost in donors with this relatively short duration of diabetes.
EXPERIMENTAL PROCEDURES
Human Donor Tissue
Postmortem human eyes were obtained from the National Disease Research Interchange
(NDRI) in Philadelphia, PA. Eyes were accepted only if they met the following criteria:
donor was < 68 years of age; no history of infection, ischemia (no ventilator), chemotherapy,
or radiation treatment to the head. Enucleation was performed within 12 hours of time of
death, and eyes were immediately placed in formalin fixation and delivered within 48 hours.
Donor records collected by NDRI were limited to basic information including the donor’s
gender, age, race, cause of death, time of death, time of enucleation, and a brief medical
history, including diabetic status and duration, and whether or not the donor was taking
insulin. Donor statistics are summarized in Table 1. Upon receipt from NDRI, the eyes were
sagittally hemisected, using a dissecting microscope, and the temporal and nasal hemispheres
were embedded in paraffin blocks for subsequent sectioning. Paraffin-embedded tissue was
sectioned at 5µm thickness and stained with hematoxylin and eosin (H & E) or labeled by
immunohistochemistry. Care was taken to select well-preserved sections close to the optic
nerve with minimal tissue artifact such as folding.

14
Table 1. Summary of donor demographics
Donor Group
n Gender (M/F)
Average age Diabetes duration
ND 7 6/1 55±10 yrs. -
(-)INS 6 4/2 54±10 yrs. 3±2 yrs.
(+)INS 6 4/2 56±12 yrs. 5±3 yrs.
ND, non-diabetic; (-)INS, diabetic donors not using insulin; (+)INS, diabetic donors using
insulin.
Tissue Staining and Image Acquisition
H & E staining was performed in the Histology Core Facility at Penn State Hershey Medical
Center. Slides were then photographed with a Spot RT KE diagnostic camera (Diagnostic
instruments, Sterling Heights, MI) mounted on an Olympus BH-2 microscope (Lake Success,
NY), using a 20× dry objective lens. Sixteen images were acquired from each retina: four
regions from four serial sections: two centrally and two peripherally (one 8 mm superior to
the central region and one 8 mm inferior to the central region).
TUNEL Labeling
Additional retina cross sections were labeled using Terminal deoxynucleotidyl transferase
dUTP nick-end labeling (TUNEL) to detect cells undergoing apoptosis at the time of death.
TUNEL labeling was performed using the ApopTag Peroxidase In Situ Apoptosis detection
kit (Millipore, Billerica, MA), in accordance with the kit instructions, with the addition of
using 3-amino-9ethylcarbazole (Sigma, St. Louis, MO) as the peroxidase substrate. Some
retina sections were pretreated with DNase (Sigma, St. Louis, MO) to provide a positive

15
control. Other DNase-treated sections were processed without terminal deoxynucleotidyl
transferase (TdT) enzyme, serving as negative control. Masked TUNEL-labeled cross
sections were viewed with an Olympus BH2 microscope (Lake Success, NY) using the 20×
and 40× dry objective lenses. Three sections from each donor were quantified with regard to
frequency of TUNEL-positive cells. Positive cells were identified by cell layer and location
(central or peripheral) within the sagittal plane. Images were captured using an attached
Sony 3CCD video camera (Sony, Tokyo, Japan).
Morphometric and Morphologic Analyses
H & E images were analyzed using Image J software (W. S. Rasband, public domain via U.S.
National Institutes of Health, Bethesda, Maryland, http://rsb.info.nih.gov/ij/, 1997-2010).
Image J was used to measure the thickness of the following layers: ganglion cell layer + inner
plexiform layer (GCL + IPL), inner nuclear layer (INL), outer plexiform layer (OPL), and
outer nuclear layer (ONL). Cell counts were also performed on each of the images of H & E-
stained retina sections. Using Image J to randomly outline 100 micron regions of central and
peripheral retina, cell counts were carried out for the GCL, INL, and ONL. Eight separate
cell counts from the central retina of each donor were averaged to determine the number of
cells per 100 microns of retina. The procedure was repeated for the peripheral retina in each
of the same layers. The identity of each slide was masked during cell counts and
morphometric analysis.
Cone subpopulations were quantified using a Leica DM RXA2 fluorescent microscope
(Leica Microsystems, Bannockburn, IL) with a 1.2 mm diameter field using the 20×

16
objective oil-immersion lens. Cell bodies and nuclear layers were detected using Hoechst
nuclear stain. Immunofluorescence with the monoclonal mouse antibody (mAb) 7G6
(generously provided by Dr. Peter Macleish, Morehouse School of Medicine, Atlanta, GA),
which recognizes cone arrestin, enabled quantification of the total number of cone
photoreceptors within the field. As before, two central and two peripheral regions were
sampled from each of the four sections from each of the donor retinas. After data collection,
the cell numbers from each region of each donor sample were averaged and expressed as
cells/mm. Immunofluorescence to red/green opsin enabled quantification of middle- (MWS)
and long-wavelength sensitive (LWS) cones (also known as green and red cones,
respectively). The number of anti- red/green opsin-positive cells was subtracted from the
total number of mAb 7G6-positive cells to estimate the number of short-wavelength sensitive
(SWS), or blue cones.
Immunohistochemistry
Sagittally hemisected, paraffin-embedded, postmortem human donor eyes were sectioned (5µ
thick) and mounted on Colorfrost/Plus microscope slides (Fisher Scientific, Fair Lawn, NJ).
Retina tissue sections were deparaffinized in xylene (Fisher Scientific) with gentle agitation
followed by rehydration in graduated alcohol. Antigen retrieval was performed by
incubating sections in 10mM citrate buffer (pH 6.0) at 80ºC for 30 minutes. After cooling,
the retina sections were incubated at room temperature for 1.5 hours in a blocking agent of
10% donkey serum (Jackson ImmunoResearch, West Grove, PA) and 0.1% Triton X-100 in
phosphate-buffered saline (PBST). Tissue sections were then incubated in primary antibody
diluted in blocking agent at 4ºC overnight. Retina sections were labeled with rabbit Anti-

17
Opsin, red/green polyclonal antibody (1:100, Millipore, Billerica, MA), and mAb 7G6 for all
cones79 (1:1, Peter Macleish, Atlanta, GA). After overnight incubation in the primary
antibody, the sections were washed in PBST, counterstained with Hoechst (0.5 µg/mL,
Sigma-Aldrich, St. Louis, MO) and incubated in the following immunofluorescent affinity
purified secondary antibodies diluted in blocking agent: Cy2-conjugated donkey anti-rabbit
(1:1000, Jackson ImmunoResearch, West Grove, PA) and Cy3-conjugated donkey anti-
mouse (1:1000, Jackson ImmunoResearch, West Grove, PA). Secondary antibodies were
incubated for 1 hour in the dark at room temperature. Slides were then washed in PBST, and
coverslipped using Aqua Polymount (Polysciences, Warrington, PA) mounting medium.
Confocal Microscopy
Fluorescently labeled slides were imaged with a laser confocal microscope (TCS SP2 AOBS,
Leica Microsystems, Manheim, Germany), utilizing a 405 nm laser for Hoechst (detection
range 410-480 nm), a 488 nm laser for Cy2 (detection range 493-530 nm), and a 543 nm
laser for Cy3 (detection range 548-630 nm). Z-section stacks of optical slices were taken
using either a 40× or 63× inverted oil objective lens and reconstructed, using the Leica
software, as a maximum projection, and saved in 512 × 512 pixel format.
Statistical Analysis
Statistical analyses were performed using GraphPad Prism software (version 5.01, GraphPad
Software, Inc., La Jolla, CA). Values from the 3 donor groups were analyzed using 1-way
analysis of variance (ANOVA) with the Newman-Keuls Multiple Comparison post hoc test
to determine differences between groups. Donor ages are expressed as mean ± standard
18
deviation. Error bars in all graphs are expressed as mean ± standard error of the mean
(S.E.M.). An asterisk (*) denotes significance at p < 0.05.
RESULTS
Donor Demographics
30 eyes (19 right, 11 left) were used in this study, from 19 donors. All 12 diabetic donors
can be considered to have had Type II, or adult onset diabetes, given their age and short
duration of diabetes. A complete list of information is shown in Table 2, including the cause
of death. The most common cause of death was cardiac arrest. There were 14 males and 5
females. The average age of donors was 55 (±10.66) years. There was no statistically
significant difference in mean age between the three donor groups.

19
Table 2. Detailed description of donor demographics
Donor Sex Age Cause of death
ND M 68 Multi-system organ failure
ND M 48 Respiratory arrest
ND M 60 Cardiac arrest
ND M 40 Cardiac arrest
ND M 60 Cardiac arrest
ND M 47 Motorcycle accident
ND F 65 Unknown
(-)INS M 52 Cardiac arrest
(-)INS F 65 Cardiac arrest
(-)INS F 55 Respiratory arrest
(-)INS M 66 Lymphoma
(-)INS M 49 Cerebral hemorrhage
(-)INS M 38 Cardiac arrest
(+)INS M 63 Cardiac arrest
(+)INS M 53 Cardiac arrest
(+)INS F 62 Chronic Pulmonary Obstructive Disorder
(+)INS F 33 Drug overdose
(+)INS M 57 Cardiac arrest
(+)INS M 66 Respiratory arrest
ND, non-diabetic; (-)INS, diabetic donors not using insulin; (+)INS, diabetic donors using
insulin.

20
Quantification of Retinal Layer Thickness
Measurements of retinal thickness were made in H&E sections from paraffin-embedded
retinas from 6 (-)INS diabetic, 6 (+)INS diabetic, and 7 ND donors (Figure 1), in central and
peripheral regions. Results indicate that there were no significant differences in thickness for
any of the cell layers in sections from diabetic donors, compared to ND donors, in both the
central (Figure 2 A) and peripheral (Figure 2 B) regions. When the diabetic groups were
combined (data not shown), the average ONL thickness was 36.99 (±3.87) microns centrally,
and 26.41 (±2.90) microns peripherally; compared with 42.75 (±2.33) microns centrally and
29.86 (±1.68) microns peripherally in the ND donors, which was not significantly different
from the age-matched ND measurements.
Fig. 1. Cross section of human retina demonstrates layered cellular structure. Retinal thickness
measurments were taken at each of the following layers: GCL + IPL, INL, OPL, ONL. GCL,
ganglion cell layer; IPL, inner plexiform layer; INL, inner nuclear layer; OPL, outer plexiform layer;
ONL, outer nuclear layer.

21
Fig. 2. Cell layer thickness in central and peripheral regions of human retinas. The thickness of
cell layers was measured in paraffin sections from human donors. A) There were no significant
differences in retinal layer thickness in the central retina. B) There were also no significant
differences between groups in the peripheral region of retinas, despite a trend towards reduction in the
thickness of the ONL in both diabetic groups. Data were analyzed by 1-way ANOVA and expressed
as mean ± standard error of the mean. ND, non-diabetic; (-)INS, diabetic donors not using insulin;
(+)INS, diabetic donors using insulin.
22
Quantification of Retinal Layer Cell Number
Cell bodies in the GCL, INL, and ONL were quantified in each of the samples, in both
central and peripheral regions of the donor retinas. Cell body counts were compared between
the ND, (-)INS diabetic and (+)INS diabetic groups. There was no significant difference
between the groups in the number of cell bodies in the GCL or the INL (Figure 3A and 3B).
In contrast, the ONL in the peripheral regions of the retina contained significantly fewer cells
in (-)INS diabetic and (+)INS diabetic groups compared to ND donors (p < 0.05) (Figure
3B).

23
Fig. 3. Cell counts indicate fewer ONL cells in peripheral retinas from diabetic donors. Cell
bodies were counted in 1.2 mm regions of H&E paraffin sections from human donor tissue, in central
and peripheral retina. A) There were no significant differences between donor groups in the number
of cell bodies in each of the retinal layers GCL, INL, and ONL in the central regions. B) In the
peripheral regions of retinas there were no significant differences in cell body numbers in GCL and
INL, however there were significantly fewer cell bodies in the peripheral ONL of both the (-)INS
group and (+)INS group compared to the ND group. Data were analyzed by 1-way ANOVA and
expressed as mean ± standard error of the mean. * p < 0.05
A
B

24
Quantification of Photoreceptor Populations
The loss of ONL cell bodies suggested photoreceptor drop-out. Immunofluorescence was
used to further identify the subtypes of cells in the photoreceptor layer. The monoclonal
antibody (mAb) 7G6 anti-cone arrestin, was used to label the cone photoreceptors in the
peripheral retina (Figure 4A). Sections were also labeled with polyclonal anti-red/green
opsin, which is specific for the outer segments of medium/long wavelength sensitive
(red/green) cones. Co-localization of these two antibodies was taken to indicate the presence
of medium wavelength sensitive (MWS) cones or long wavelength sensitive (LWS) cones.
Cells that were mAb 7G6 positive, but negative for anti-red/green opsin were assumed to be
short wavelength sensitive (SWS), or blue, cones (Figure 4A, arrow).
After immunolabeling the cones from all three groups of donor retinas, a fluorescent
microscope was used to visualize the cone cells. Two peripheral regions were selected for
quantification, each 8 mm from the posterior aspect of the tissue sample. At 20×
magnification, all of the mAb 7G6-positive cells were counted, representing the total cone
count for each 1.2 mm span of retina. Similarly, all of the cells labeled with anti-red/green
opsin were counted in the same region of retina. The difference between the two counts was
taken as the number of SWS (blue) cones. As expected, the number of SWS cones was
dramatically outnumbered by the MWS and LWS cones, with the SWS cones comprising
about 15% of the total cone population. There was no significant difference between donor
groups with regard to the numbers of cones found (Figure 4B).

25
Fig. 4. Immunolabeled cones enable differential cone counts in human retinas. Paraffin sections
of human donor retina were labeled with anti-red/green opsin (green) and Mab7G6 for all cones (red).
Hoechst dye was used to label all nuclei (blue). A) Confocal image of retina from a non-insulin-
dependent diabetic donor: positive 7G6 labeling was observed throughout the cell bodies and outer
segments of all cone photoreceptors, while red/green opsin immunoreactivity occurred only in the
outer segments of long- and middle- wavelength cone receptors. Co-localization of both antibodies at
the outer segment (yellow) indicated long- or middle-wavelength cones, while the outer segments of
short-wavelength cones were red (arrow). Nuclear material of cell bodies is labeled with Hoechst
(blue). B) Cone counts indicate that there was no significant difference between donor groups with
regard to total cones or Short-wavelength cones and Middle-/Long-wavelength cones.
Quantification of TUNEL-positive Cells
Data from TUNEL-positive cell counts in cross sections from human donor retinas
demonstrate a higher frequency of apoptotic cells in the ganglion cell layers. This was the
case in both central and peripheral regions of retinas. The greatest number of TUNEL-
positive cells was found in the GCLs of retinas from diabetic donors who were not using
insulin. There was great variability in results across the different groups and even within
samples from the same donor. Due to the fact that the frequency of TUNEL-positive cells
A B

26
did not fall into a normal bell-shaped distribution of data points, it was not appropriate to
perform parametric statistics in these cell counts (Figure 5).
Fig. 5. TUNEL labeling in donor retinas indicates frequency of apoptotic cells. TUNEL-positive
cells were quantified in retinal cross sections from human donors. A) Sections from human donors
were TUNEL-labeled (reddish-brown) to detect cells undergoing apoptosis. B) TUNEL labeling in
central retinas demonstrated higher frequency of apoptotic cells in retinas from non-insulin using
diabetic donors, particularly in the retinal ganglion cell layer. C) Peripheral retinas also showed
higher frequencies of apoptotic cells in the retinal ganglion cell layer. TUNEL, Terminal
deoxynucleotidyl transferase dUTP nick-end labeling.
A

27
DISCUSSION
Retinal neurodegeneration is thought to be responsible for a cumulative loss of neurons and
photoreceptors in diabetes. This has become a well-established concept in animal models of
diabetes 57, 80. Studies using human postmortem tissue have also shown evidence of
increased apoptosis in both the vascular and neural tissues of the retina 14, 81. Most
postmortem studies, however, have examined retinas from donors with advanced stages of
diabetic retinopathy. The present study examined the possibility of cell loss in retinas from
human donors with shorter durations of diabetes, and little evidence of vascular retinopathy,
testing the hypothesis that such cell loss could be quantified in human donor tissue. The
donors in this study were reported to have had adult onset diabetes for an average of 4.3
(±2.5) years, which can be considered a relatively short duration in humans.
This study found that the thickness of retinal layers was unaffected by diabetes, but that the
cell bodies in the peripheral ONL were depleted by 19.2% in the (-)INS group and 21.6% in
the (+)INS group of diabetic donors, suggesting that a small but significant loss of
photoreceptors had occurred. Quantification of subgroups of cells using
immunohistochemistry determined no change in the cone density, implying that the loss of
cells in the peripheral ONL can be attributed to depletion of rod photoreceptors. This finding
differs from animal studies that measured reductions in the thickness of the IPL and INL in
mice and rats and after 3.5 to 7 months of experimental diabetes 14, 18, 62. It is possible that
larger changes in these animals with uncontrolled experimental diabetes may have masked
any subtle changes in the ONL. It is also the case that the changes in the ONL of the human
retinas were only revealed by counting cell bodies, which was not an approach used in the

28
animal studies. Some investigators have noted photoreceptor apoptosis 20, 52 and delayed a-
waves in the ERG 76, suggesting the possibility that the neurodegeneration in animals occurs
at an accelerated rate compared to humans and more rapidly affects many, if not all, cellular
components of the retina. In contrast, cell loss in human retinas may occur more gradually,
preferentially affecting a subpopulation of cells beginning with the peripheral rod
photoreceptors.
The results from the quantification of TUNEL-positive cells support previous findings in
which it has been demonstrated that ganglion cells are vulnerable to degeneration by
apoptosis 14, 18. The high frequency of TUNEL-positive RGCs does not support the data
collected in the morphometric study and cell count study presented here. These studies did
not show any differences in RGC + IPL layer thickness or in RGC counts with diabetes. It
must be noted, however, that the TUNEL study portrays a transient “snapshot” of apoptosis
that was under way at the time of the donor’s death, while the morphometry and cell count
studies demonstrate retinal layer thickness and number of cells remaining after years of
diabetes. It may be the case that photoreceptor degeneration took place prior to this
“snapshot” or that photoreceptors undergo a form of cell death other than apoptosis and
therefore do to get labeled with TUNEL staining.
Clinical studies have noted retinal thinning in diabetes 61, 82, mostly using optical coherence
tomography (OCT) techniques to image the retina. The advantage of OCT technology is that
it can be performed in vivo in patients for diagnostic purposes, although these studies were
limited to a region with a radius of 3 mm from the fovea 61, 82-84 or the optic nerve head 85. It

29
is conceivable that larger changes in retinal thickness may occur in the peripheral regions but
could not be observed in these OCT studies.
One possible explanation for a preferential loss of peripheral rod photoreceptors is that these
cells may be impacted more by the metabolic stress caused by diabetes. It has been
suggested that the rods have such a high metabolic demand that these cells are preferentially
impacted by changes in oxygen tension or blood flow associated with dark adaptation in
diabetes 71, 86. This is a difficult hypothesis to test, but there is strong evidence that diabetes
impacts the speed of dark adaptation in humans 13, even in patients with no clinical evidence
of vascular pathology, suggesting that the rod photoreceptors may undergo functional deficits
after shorter durations of diabetes.

30
CHAPTER THREE
Effect of Diabetes on Photoreceptor Protein Expression
in Diabetic Mouse Retinas

31
INTRODUCTION
The interpretation of a visual image is dependent on light as a stimulus, and the presence of
an intact cellular and synaptic pathway from the retina to the visual cortex. Photoreceptors
serve as the interface where light energy is converted into signals that are modulated by the
different cell types of the retina before leaving the eye via the optic nerve. The
phototransduction cascade is a complex process with separate pathways for cone-dominated
color vision and rod-dominated scotopic vision. Much of the research into diabetic
retinopathy has investigated changes in vasculature that occur in this disease process. More
recent studies have explored the role of neurodegeneration in the diabetic retina, discovering
pathology and apoptosis localized to the inner retina. Despite the fact that the
phototransduction cascade has been studied extensively, little research has been undertaken
to investigate the role of diabetes in the outer retina where the photoreceptors are located.
Rod and cone photoreceptors are not equally distributed across the retina. Although not
found in the fovea of humans, rods account for 95% of all photoreceptors, and are the
dominant cell type of the peripheral outer nuclear layer 87, 88. Humans have 3 different cone
cell types, those sensitive to light of short-, medium-, and long-wavelengths; allowing for
perception of blue, green, and red colors respectively. Cone photoreceptors dominate the
fovea of the retina and their population falls off dramatically outside of the parafoveal
regions. The previous chapter provides evidence that humans with diabetes for a relatively
short period of time demonstrated an increased loss of rod photoreceptors.

32
Animal studies of photoreceptor degeneration in diabetes tend to focus on structural or
functional changes to the outer retina. The structure of the retina is organized in a stratified
architecture, allowing for histologic identification of photoreceptor cell bodies, which occupy
the outer nuclear layer of the retina. Park and coworkers described a remarkable loss of
photoreceptors in diabetic rats by 12 weeks after streptozotocin (STZ) injection with
subsequent ONL thinning by 24 weeks after the onset of diabetes 52. Structural changes that
are seen in the vasculature of patients with diabetic retinopathy are not as evident in animal
models. X-ray irradiation was utilized in an attempt to model neovascularization in diabetic
rats. Findings indicated that the combined effects of diabetes and radiation lead to outer
nuclear layer (ONL) thinning followed by loss of photoreceptor cells along with RPE
hypertrophy and inner retina atrophy 89. A study which investigated the structural and
functional effects of diabetes, performed by Aizu and colleagues, found an 18.9% reduction
in photoreceptor layer thickness in 1-month diabetic Sprague Dawley rats. The same study
demonstrated a significant reduction in a-wave amplitude, implicating photoreceptor
dysfunction in 1-month diabetic Brown Norway rats 51.
A small number of histological studies of postmortem donor eyes from humans with diabetes
have demonstrated photoreceptor loss. While both of the following studies were performed
using retina tissue from donors who had had laser photocoagulation treatment for diabetic
retinopathy, Shah and coworkers documented photoreceptor loss in areas removed from the
treatment sites 90. In a separate study destruction of photoreceptors and RPE cells was noted
at the sites of laser burns, with RPE hypertrophy at the edges of the scars and the presence of
inner nuclear layer cells lying directly on the intact Bruch’s membrane 91.

33
Specific electroretinogram (ERG) waveforms have been analyzed to understand alterations in
photoreceptor function in humans. The a-wave originates from photoreceptor activity, and
the slope of the leading edge of the a-wave has been used in a computational photopigment
transduction model to determine log S, identified as an indicator of photoreceptor sensitivity
92. Using this model, humans with diabetes demonstrate diminished photoreceptor sensitivity
compared to age-matched controls 74.
Using a paired-flash ERG protocol, it is possible to extract the rod contribution to the
photoreceptor response. Diabetic rats demonstrated a reduction in the amplitude of the rod
response as early as 2 days post STZ injection. It has been suggested that this very early
dysfunction may be due to STZ toxicity, as the rod response returns to normal within 4
weeks. By 12 weeks, however, the diabetic rats again showed rod dysfunction compared
with age-matched controls. The authors attribute this alteration to a decrease in the length of
rod photoreceptor outer segments and the loss of rhodopsin 75, 93.
Mice are nocturnal animals, and as such, have a much greater preponderance of rods, which
account for 97% of photoreceptors 94. Furthermore mice are protanopic dichromats, unable
to perceive red, since they have only short- and medium-wavelength sensitive cones 95. The
rod structure and function in mice, however, are very similar to human, and the predominant
protein, rhodopsin, is highly conserved between the two species 96. Rhodopsin is a G-protein
coupled receptor with 7 transmembrane domains, located primarily within the disc
membranes of the rod photoreceptor outer segments. While there are a great many published

34
reports that have used rodents to study photoreceptor structure and function, there is less
information regarding the effects of diabetes on rhodopsin expression, in rodents or humans.
Rhodopsin is the most abundant protein of the outer retina, accounting for >90% of the
protein content of rod outer segment membrane 97. When rhodopsin absorbs a photon of
light, it undergoes a conformational change, leading to the activation of the rhodopsin
molecule. When the activated rhodopsin comes into contact with the heterotrimeric G-
protein transducin, the α-subunit of transducin is released, which allows for the exchange of
GDP for GTP. The activated α-transducin/GTP subunits dissociate from the β/γ subunits
then bind to and activate phosphodiesterase 6 (PDE 6). As the activated PDE 6 hydrolyzes
the cyclic GMP, the cytoplasmic concentration of GMP is reduced to the point that GMP is
no longer able to hold open the sodium (Na+) ion channels. The Na+ channel closure leads
to membrane hyperpolarization 98. While activated, rhodopsin catalyzes the nucleotide
exchange of GDP for GTP in many transducin α-subunits, allowing for signal amplification.
The phototransduction cascade is halted by phosphorylation of the activated rhodopsin which
leads to binding by the protein arrestin 99.
Due to the fact that rhodopsin is a rod-specific protein, it is a useful marker for western
blotting and immunohistochemistry assays, used to identify the presence of rod
photoreceptors. Evidence suggests that rhodopsin can form dimers 100, 101, and higher order
oligomers that may improve the efficiency of transducin activation 102. The present study
sought to test the hypothesis that there is a loss of rod photoreceptors and thus, a subsequent
reduction in rhodopsin protein content in Ins2Akita mice after 7 weeks of diabetes, compared

35
to age-matched controls. To test this hypothesis, diabetic and control mouse retinas were
assayed by immunoblotting, quantitative real-time polymerase chain reaction (qRT-PCR),
and immunohistochemistry for rhodopsin protein content. Additionally, the outer nuclear
layer cell bodies of photoreceptors were counted on slides taken from cross-sections of
diabetic and control mouse retinas.
EXPERIMENTAL PROCEDURES
Animals
Heterozygous C57BL/6J Ins2Akita mice were bred and maintained at the Penn State College
of Medicine Juvenile Diabetes Research Foundation Diabetic Retinopathy Center Animal
Facilities Core. Ins2Akita mice have a spontaneous mutation in the Ins2 gene that prevents
disulfide bonds from forming, leading to protein misfolding, endoplasmic reticulum stress,
and eventual pancreatic beta cell death, rendering the animals hypoinsulinemic and
hyperglycemic at 4 weeks of age. In the present study, data was collected from 11 week old
mice that had been diabetic for 7 weeks. Female Ins2Akita mice demonstrate later onset and a
lesser degree of hyperglycemia 103; for this reason, only male mice were used in the present
study. Animals were housed in the Penn State College of Medicine animal facility in a
standard 12 hour light/dark cycle with littermates in plastic cages, with ad libitum access to
food and water in accordance with the Institutional Animal Care and Use Committee
guidelines, standards set forth in the ARVO Statement of the Use of Animals in Ophthalmic
and Vision Research, and the NIH Guidelines for the Care and Use of Laboratory Animals.

36
Immunoblotting
Mice were anesthetized with an intraperitoneal injection of ketamine/xylazine (0.136 mg
ketamine + 0.0096 mg xylazine / g body weight) prior to sacrifice. Immediately following
decapitation by guillotine, retinas were removed, placed in centrifuge tubes, flash frozen in
liquid nitrogen, and transferred to a -70 degree freezer. Frozen retina samples were sonicated
in a detergent based lysis buffer (100mM NaCl, 1.0% Triton X-100, 0.05% sodium
deoxycholate, 0.2% SDS, 2 mM EDTA, 10 mM HEPES, 1 mM sodium orthovanadate, 10
mM sodium fluoride, 10 mM sodium pyrophosphate, 1 mM benzamidine, 10 mM
microcystin, and 1 Complete™ Mini EDTA-free Protease Inhibitor Cocktail Tablet (Roche
Molecular Biochemicals, Indianapolis, IN) for every 10 mL) on ice and centrifuged at 12,500
rpm. The supernatant was removed for protein quantification assay and electrophoresis using
NuPAGE apparatus and gels (Invitrogen, Carlsbad, CA). Overnight transfer to nitrocellulose
membrane was performed and the following day the membranes were blocked with 5% milk
in Tris-buffered saline with 0.05% Tween-20, incubated in primary antibodies against
rhodopsin (mouse monoclonal antibody 1D4 at 1:200, Abcam, Cambridge, MA) or rod
transducin α (rabbit polyclonal antibody 3504 at 1:500, Abcam, Cambridge, MA) or PDE 6 α
(rabbit polyclonal antibody 5659 at 1:500, Abcam, Cambridge, MA) and the appropriate
secondary antibodies (anti- mouse, anti-rabbit IgG alkaline phosphatase linked, GE
Healthcare UK Limited, Little Chalfont Buckinhamshire, UK) and developed by incubating
on ECF substrate (GE Healthcare UK Limited) before reading blots on Typhoon 9400
Variable Mode Imager (Amerisham Biosciences Corp, Piscataway, NJ). Blots were
quantified using ImageQuant 5.0 software (Molecular Dynamics, Inc., Sunnyvale, CA).

37
RNA Isolation and qRT-PCR Analysis
Total RNA was isolated from mouse retinas using the RNeasy Mini Kit (QIAGEN 74104,
Gaithersburg, MD) following the manufacturer’s instructions with some modification. The
“Protocol: Purification of Total RNA from Animal Tissues” supplied with the kit was
followed except for the following steps: Homogenization of tissue was done by pipetting
each retina in 700ul RLT buffer containing 1%β-mercaptoethanol until it disintegrated. The
homogenate was then placed in a QIAshredder column (QIAGEN 79656, Gaithersburg, MD)
and subjected to centrifugation at 13,200xg in a Labnet Spectrafuge™ 24D microcentrifuge
(Labnet International, Woodbridge, NJ) at room temperature for 2 min. The resulting lysate
was subjected to centrifugation for 3 min at 13,200xg. The supernatant, avoiding genomic
DNA and any precipitate at the bottom of the tube, was transferred to another tube. To this
sample was added 1 volume of 70% ethanol, and the manufacturer’s protocol was then
followed.
The RNA was quantitated using a Nanodrop 1000 spectrophotometer (Thermo Fisher
Scientific, Wilmington, DE). 350 ng of RNA was used as a template for reverse transcription
with the Omniscript RT Kit plus RNase inhibitor (0.5U/µl), oligo-dT primers (0.825µM) and
random hexamers (11µM) (all reagents purchased from QIAGEN, Gaithersburg, MD) by
incubation at 37°C for 90 min in a Techne TC-512 thermal cycler (Burlington, NJ). cDNA
products were diluted six-fold in water. 2µl of this dilution was used as template for PCR
with the TaqMan Gene Expression Assay (Applied Biosystems, Carlsbad, CA) for 18s rRNA
(Hs99999901_s1) and 5µl of the dilution was used as template for PCR with the TaqMan
Gene Expression Assays for β-actin (Mm00607939_s1), rhodopsin (Mm00520345_m1) and

38
Gnat1 (Mm00492388_g1) along with the TaqMan Universal PCR 2X Master Mix (Roche,
Indianapolis, IN).
PCR reactions were run in an ABI 7900HT sequence detection system (Applied Biosystems,
Carlsbad, CA) located in the Functional Genomics Core Facility of the Section of Research
Resources, Penn State College of Medicine using the following parameters: 50°C for 2 min,
95°C for 10 min then 40 cycles of 95°C for 15 s and 60°C for 1 min. Data was analyzed
using the ddCt method. Expression of each target gene was normalized to that of 18s rRNA.
Immunohistochemistry
Mice were anesthetized with an intraperitoneal injection of ketamine/xylazine (0.136 mg
ketamine + 0.0096 mg xylazine / g body weight) prior to sacrifice. Immediately following
decapitation by guillotine, globes were removed and placed in 2% paraformaldehyde for 10
minutes. Eyes were then blotted dry, submerged in Optimal Cutting Temperature Compound
(Tissue-Tek, Redding, CA) and lowered into isopentane on dry ice until frozen.
Paraformaldehyde-fixed, frozen mouse eyes were sectioned (10µ thick) and mounted on
Colorfrost/Plus microscope slides (Fisher Scientific, Fair Lawn, NJ). Antigen retrieval was
performed by incubating sections in 10mM citrate buffer (pH 6.0) at 80ºC for 30 minutes.
After cooling, the retina sections were incubated at room temperature for 1.5 hours in a
blocking agent of 10% donkey serum (Jackson ImmunoResearch, West Grove, PA) and 0.1%
Triton X-100 in phosphate-buffered saline (PBST). Tissue sections were then incubated in
primary antibody diluted in blocking agent at 4ºC overnight. Retina sections were labeled
with rabbit anti-cone arrestin polyclonal antibody (1:1000, Millipore, Billerica, MA), and

39
mouse monoclonal antibody RET-P1 (1:500, Millipore, Billerica, MA). After overnight
incubation in the primary antibody, the sections were washed in PBST, counterstained with
Hoechst (0.5 µg/mL, Sigma-Aldrich, St. Louis, MO) and incubated in the following
immunofluorescent affinity purified secondary antibodies diluted in blocking agent: Cy2-
conjugated donkey anti-mouse (1:1000, Jackson ImmunoResearch, West Grove, PA) and
Cy3-conjugated donkey anti-rabbit (1:1000, Jackson ImmunoResearch, West Grove, PA).
Secondary antibodies were incubated for 1 hour in the dark at room temperature. Slides were
then washed in PBST, and coverslipped using Aqua Polymount (Polysciences, Warrington,
PA) mounting medium for confocal microscopy.
Confocal Microscopy
Fluorescently labeled slides were imaged with a laser confocal microscope (TCS SP2 AOBS,
Leica Microsystems, Manheim, Germany), utilizing a 405 nm laser for Hoechst (detection
range 410-480 nm), a 488 nm laser for Cy2 (detection range 493-530 nm), and a 543 nm
laser for Cy3 (detection range 548-630 nm). Z-section stacks of optical slices were taken
using either a 40× or 63× inverted oil objective lens and reconstructed, using the Leica
software, as average- and maximum projections, and saved in 512 × 512 pixel format (Figure
12).
Quantification of Immunofluorescence and Outer Nuclear Layer Cells
Quantification of relative rhodopsin and cone arrestin immunoreactivity was performed using
image analysis software (Image J, W. S. Rasband, public domain via U.S. National Institutes
of Health, Bethesda, MD, http://rsb.info.nih.gov/ij/, 1997-2010). Using average projections

40
generated by confocal microscopy, a region of interest encompassing the area of
photoreceptor outer segments was selected with Image J, and average intensity recorded.
Background measurements from each sample were subtracted to obtain a measurement of
fluorescence, recorded in arbitrary units (AUs).
The cell bodies of the outer nuclear layer (ONL) were counted from confocal maximum
projection images. Using Image J to randomly outline 100 micron regions of central and
peripheral retina, cell counts were carried out in the ONL. 4 separate cell counts from the
central retina of each animal were averaged to determine the number of cells per 100 microns
of retina. The procedure was repeated for the peripheral retina in the ONL. The identity of
each slide was masked during cell counts.
Statistical Analysis
Statistical analyses were performed using Excel software (Microsoft Office 2010, Redmond,
Washington). Values from the 2 groups (diabetic and control) were analyzed using Student’s
two-tailed t-test to determine differences between groups. Error bars in all graphs are
expressed as mean ± standard error of the mean (S.E.M.). An asterisk (*) denotes
significance at p < 0.05.
41
RESULTS
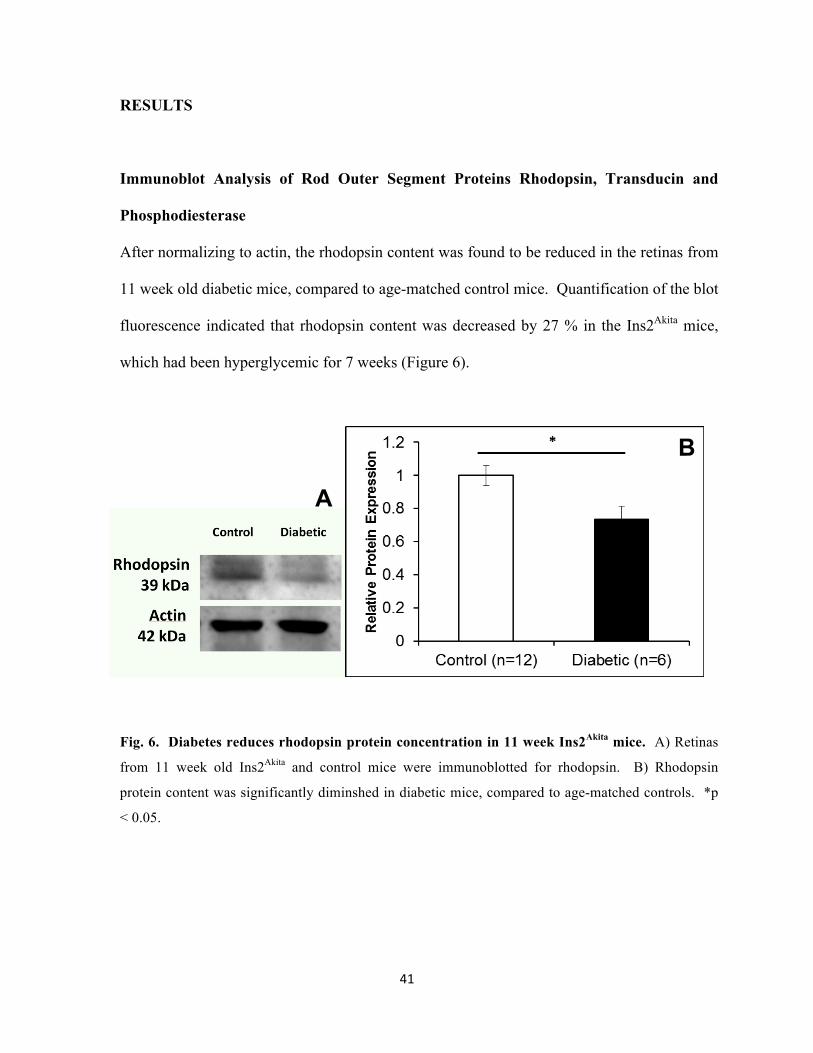
Immunoblot Analysis of Rod Outer Segment Proteins Rhodopsin, Transducin and
Phosphodiesterase
After normalizing to actin, the rhodopsin content was found to be reduced in the retinas from
11 week old diabetic mice, compared to age-matched control mice. Quantification of the blot
fluorescence indicated that rhodopsin content was decreased by 27 % in the Ins2Akita mice,
which had been hyperglycemic for 7 weeks (Figure 6).
Fig. 6. Diabetes reduces rhodopsin protein concentration in 11 week Ins2Akita mice. A) Retinas
from 11 week old Ins2Akita and control mice were immunoblotted for rhodopsin. B) Rhodopsin
protein content was significantly diminshed in diabetic mice, compared to age-matched controls. *p
< 0.05.
A
B

42
An alternative method of calculating rhodopsin content involved summing the volumes of
bands representing the monomeric, dimeric, and trimeric forms of rhodopsin taken from
another set of 11 week old mice and then normalizing to actin. The results of this
quantification revealed a different outcome in which there was not a difference in summed
rhodopsin oligomer content in the diabetic mice, compared to controls (Figure 7).

43
Fig. 7. Quantification of oligomers indicates that rhodopsin protein content in oligomer form is
not changed in diabetes. A) Retinas from 11 week old Ins2Akita and control mice were
immunoblotted for rhodopsin. Monomers, dimers, and trimers were summed and then normalized to
actin. B) Oligomeric rhodopsin protein content was unchanged in diabetic mice, compared to age-
matched controls.
A
B

44
Transducin and phosphodiesterase, photoreceptor proteins involved in the phototransduction
cascade were also detected in retinas from 11 week old mice. Subsequent quantification of
these blots demonstrated that there was no difference between the diabetic and control
animals, with respect to transducin α (Figure 8) or phosphodiesterase 6 α (Figure 9) protein
content.
Fig. 8. Transducin protein content is not altered by diabetes in 11 week old mice. A) Retinas
from 11 week old Ins2Akita and control mice were immunoblotted for transducin α subunit. B) There
is no difference in transducin protein content in diabetic mice, compared to age-matched controls.
A
B

45
Fig. 9. Phosphodiesterase protein content is not altered by diabetes in 11 week old mice.
A) Retinas from 11 week old Ins2Akita mice, and control mice were immunoblotted for the
phosphodiesterase 6 α subunit. B) There was no difference in phosphodiesterase protein content in
diabetic mice, compared to age-matched controls. PDE, phosphodiesterase.
Quantitative Real-Time Polymerase Chain Reaction (qRT-PCR)
Messenger RNA (mRNA) expression in retinas from 14 week old mice was quantified by
qRT-PCR. β-actin transcript was used as an endogenous control, and remained unchanged
in samples from diabetic (-)INS, diabetic (+)INS, and controls (data not shown). Retinas
harvested from 14 week old mice demonstrated no significant difference in rhodopsin mRNA
expression levels in insulin-treated or untreated diabetic mice, relative to control levels.
There was also no difference in transducin mRNA expression measured in the two groups of
diabetic mice, compared to controls (Figure 10).
A

46
Fig. 10. Photoreceptor mRNA expression was unchanged in mice that were diabetic for 10
weeks. A) mRNA expression levels for rhodopsin were not different in diabetic mice, compared to
age-matched controls, regardless of whether or not they received insulin treatment. B)
Quantification of mRNA levels of transducin reavealed no difference in mRNA expression in diabetic
animals, compared to controls. n=9 control, n=5 untreated diabetic, n=6 insulin-treated diabetic.
Quantification of Outer Nuclear Layer Cells
Quantification of cell bodies for photoreceptor cells found in the central and peripheral outer
nuclear layer yielded no difference between diabetic animals and age-matched controls
(Figure 11).

47
Fig. 11. ONL cell counts are unaltered by diabetes in 11 week old mice. A) Cell counts from the
outer nuclear layer of 11 week old mice indicated that there was no difference between the numbers
of photoreceptor cell bodies due to diabetes in the central retina. B) Likewise, peripheral retinas from
diabetic mice were not different from controls with regard to ONL cell counts.
Rhodopsin Immunofluorescence
Another measure of protein content included in this study involved measuring the
fluorescence of cy-2 conjugated rhodopsin in images taken using confocal microscopy. The
fluorescence of all of the pixels in the region of the image corresponding to the outer
segments was averaged to gain an understanding of the amount of rhodopsin present in the
photoreceptor outer segments. In this small study, there was no difference in measured
fluorescence between the diabetic and control mice at this 11 week time point (Figure 12).

48
A
Fig. 12. Immunofluorescent confocal image analysis to compare rhodopsin content in 11 week-
old Ins2Akita mouse retinas. Cy-2 conjugated rhodopsin is labeled in green, Cy-2 conjugated cone
arrestin is labeled in red, and nuclear DNA is counterstained with Hoechst, in blue. A) Control retina.
B) Diabetic retina. There was no difference in the level of fluorescence in Cy-2 conjugated rhodopsin
due to diabetes in either C) central retina or D) peripheral retina.
A B

49
DISCUSSION
Neurodegeneration taking place due to diabetic retinopathy has been considered to be an
event that occurs primarily in the inner retina. Retinal thinning, indicative of neuronal loss,
has been identified in patients with diabetes 61, 104 and in animal models of diabetes 14, 60, 62.
Apoptotic markers have been identified in the ganglion cells of diabetic animals 18, 20, and
humans 17. Fewer investigations have explored the neurodegenerative effects of diabetes on
the outer retina. Postmortem human histological analysis of the outer retina has been limited
to donors with longstanding diabetes or patients who received laser photocoagulation
treatment 90, 91, 105. Park and colleagues published a descriptive account of photoreceptor loss
in STZ-induced diabetic rats 52, but included no statistical comparison to indicate the extent
of cell loss, nor did the histology indicate the area of retinas sampled. The present study
examined 11 week old diabetic Ins2Akita, and age-matched control mice, to determine the
effects of diabetes on the photoreceptor layer. Outer nuclear layer cell counts were
performed centrally and peripherally in order to determine possible photoreceptor
degeneration. Immunoblotting, immunohistochemistry, and qRT-PCR were used to measure
rhodopsin expression in order to estimate potential loss within the rod photoreceptor
population.
In this study, western blot analysis demonstrated that rhodopsin content was diminished in
Ins2Akita mouse retinas after 7 weeks of diabetes, compared to age-matched controls. This
finding was not able to be confirmed by immunohistochemistry, since fluorescence levels of
immunolabeled rhodopsin in diabetic samples were not different from control samples. This
discrepancy may be due to a very small sample size in the immunohistochemistry study (n =

50
3), along with variability in fluorescence values. There appears to be a trend toward
decreased rhodopsin fluorescence in the peripheral diabetic samples, although this did not
reach statistical significance.
Transducin immunoblots indicate that transducin content in the diabetic retinas was not
different from levels seen in control samples, even as rhodopsin levels in the diabetic mice
were decreased. While the author was unable to find any other studies that used
immunoblotting to measure rhodopsin content in diabetic retinas, similar findings were
reported in BETA2/NeuroD1 Null mice. These mice serve as a model for Bardet-Biedl
syndrome, a genetic disorder characterized by rod-cone dystrophy and increased incidence of
diabetes. The BETA2/NeuroD1 Null mice also demonstrate a loss of rhodopsin in the
absence of transducin changes 106. In chapter 4 of this dissertation, ERG results demonstrate
that, at this same 11-week time point, there was no difference between diabetic and control
mice with regards to the rod-dominated a-wave. One might expect the a-wave to be
diminished in situations where there is a significant loss of rhodopsin. The fact that the a-
wave is unchanged in the rhodopsin-deficient mice can be explained by the amplification
properties of the phototransduction cascade. Since each rhodopsin molecule is able to
activate many transducin molecules, it is possible to lose a portion of the rhodopsin pool and
still maintain phototransduction, as long as transducin and PDE levels remain optimal.
ONL cell counts in 11 week-old diabetic mice were not different from values measured in
age-matched control mice. Other animal studies examining the ONL have had conflicting
results. The most frequently used method of detecting histologic change in the ONL is by

51
thickness measurements. Some studies have measured loss in ONL thickness in diabetic
animals 18, 52, while others have found thinning of alternate retinal layers without ONL
change 14, 62.
The aim of this study was to test the hypothesis that diabetes leads to rod photoreceptor
degeneration. The original intent was to measure rhodopsin as an indicator of photoreceptor
number. It must be noted that the reduction in rhodopsin content seen in the diabetic mice
occurred after 7 weeks of diabetes while, during the same time period, there was no apparent
loss of photoreceptor cell bodies. Nor was there a loss of transducin or phosphodiesterase, so
the original hypothesis must be rejected. It appears that there is a loss of monomeric
rhodopsin content in diabetes, but this does not correlate with a change in mRNA expression
or a loss of photoreceptors. It is possible that this loss of rhodopsin is due to diabetes-
induced shortening of the outer segments, where the majority of rhodopsin is localized.
Outer segment shortening has been documented in diabetic rats 51 and in humans with
diabetic macular edema 107.

52
CHAPTER FOUR
Electroretinographic Response to Diabetes in Ins2Akita Mice

53
INTRODUCTION
Electroretinography (ERG) involves the use of a recording electrode placed on the cornea of
a subject, which measures the electrophysiologic output originating from the retina. The
signal that is recorded is the response to a light stimulus; usually a flash of light of short
duration and variable intensity. The resultant waveforms have been identified and the
component parts of the output have been assigned to the retinal cell types from which they
originate. Holmgren first demonstrated that there was a change in the electrical potential of
an eye due to light stimulation in 1865 108. Following the work of Ragnar Granit, who
performed ERG studies in anesthetized cats 108, further studies have been able to determine
the cellular layers responsible for the separate components of the ERG waveform. Modern
electroretinography is now widely used in clinical and research settings to identify
pathologies in many vision disorders. Patients with diabetes, for instance, frequently exhibit
reduced or delayed ERG responses. Animal research in ERG studies, particularly in the use
of mammalian models of disease, is important in the furthering of our understanding of
disease pathology, progression, and treatment options. Research related to the study of
diabetic retinopathy has largely been performed using the rat as a model. In these studies,
rats are often injected with streptozotocin (STZ), which is toxic to pancreatic beta cells.
Fewer studies have been performed in STZ- or alloxan- injected mice. Another mouse model
of diabetes is the Ins2Akita mouse, which has a spontaneous mutation leading to the
destruction of beta cells and subsequent diabetes. To date, there are no published reports of
ERG data from this Ins2Akita diabetic mouse model.

54
The basic component parts of the ERG waveform are most frequently referred to as the a-
wave, which is a negative deflection from baseline, and a positively directed b-wave (Figure
13). Granit developed an alternate naming system, using Roman numerals to label the
cellular responses in the order in which they were suppressed by deeper levels of anesthesia.
Some researchers continue to refer to the P-I, P-II, and P-III nomenclature, but the majority
of published reports use the convention of a- and b-waves. The a-wave is the earliest
response to light stimulus and originates from the outer retina; specifically, the
photoreceptors. Following the a-wave, the post-photoreceptoral b-wave is produced by the
depolarization of bipolar cells, with contributions from amacrine cells and ganglion cells. Xu
and colleagues proposed that there is also a Muller cell contribution to the b-wave 109, but
studies by Karwoski and colleagues and Green and coworkers refute this claim 24, 25.
Fig. 13. ERG output demonstrates a- and b-wave in 11 week old mice. The photoreceptor-
dominated a-wave is seen as a negative trough, while the bipolar dominant b-wave exhibits a positive
peak. Data collected included amplitude, measured in microvolts (µV) and implicit time, measured in
milliseconds (ms).
b-wave
a-wave

55
Oscillatory potentials (OPs) consist of a series of higher frequency wavelets that are
superimposed upon the rising slope of the b-wave. They are thought to originate from the
interactions of bipolar cells, amacrine cells, and ganglion cells 27, 28. Any disease process that
impacts these cell types is likely to affect the shape of the OP wavelets. In order to measure
the amplitude and implicit times (time from the onset of stimulus to the peak of each OP),
bandpass filters are used to isolate the OPs from the b-wave (Figure 14). Changes in OP
parameters are the most commonly cited alterations in ERG studies involving patients with
diabetes. Early clinical studies of patients with diabetes were concerned with OP changes
associated with diabetic retinopathy. In 1962, Yonemura and colleagues reported
deterioration of oscillatory potentials in patients with diabetes, most of whom had been
diagnosed with retinopathy, but also in a smaller number of patients without
ophthalmoscopic evidence of retinopathy 110. Additional clinical trials followed, establishing
that humans with diabetic retinopathy have specific alterations in ERG response, including
reduced OP amplitudes 111-113 and increased OP implicit times 112, 114. Juen and Kieselbach
noted that patients ages 18 – 33 had significant loss of OP amplitude after being diagnosed
with diabetes for an average of only 7 years, prior to the advent of any notable vascular
changes associated with diabetic retinopathy 111. Alterations in OPs have been correlated
with loss of visual acuity, hue discrimination, 112 and contrast sensitivity 113. Other early
studies showing that the electroretinogram was altered within a few years of the onset of
juvenile diabetes suggested that this could be used as an early diagnostic approach 115, 116.

56
Fig. 14. Oscillatory potentials recorded in Ins2Akita mice are filtered using a bandpass filter to
obtain amplitude and implicit time measurements. A) Unfiltered waveform: note wavelets on
rising slope of the b-wave. B) OPs after filtration with a bandpass filter.
Alterations in a- and b- waves have been reported in patients with diabetes, but the results are
not as dramatic as those seen in OP changes. Bresnick and Palta recorded ERGs from 72
patients with diabetes and compared the data to recordings from 29 control subjects. They
found a significant delay in the implicit time of a-waves recorded from the patients with
diabetes. The same study also determined the effects of photocoagulation treatment on ERG
response and found that the eyes that received pan-retinal photocoagulation showed a
significant delay in the b-wave implicit time, compared to the untreated contralateral eye 114.
Chung and coworkers measured ERG responses in diabetic patients with and without
vascular signs of retinopathy. They reported decreased b-wave amplitudes at lower flash
intensities and delayed b-wave implicit times in all groups, even in patients without
retinopathy 117.
A B

57
Additional waveforms have been described in the ERG field of study, such as the c-wave, the
d-wave, and the scotopic threshold response. The c-wave originates from the retinal
pigmented epithelium (RPE) with input from photoreceptors 118. The d-wave, a second
positive response following the b-wave, can only be elicited under special conditions with
longer flash exposures. The d-wave is a response to activation of the off-bipolar pathway 119.
While the c- and d- waves have not been addressed to a great extent in diabetic literature,
there have been a small number of studies published that utilize the scotopic threshold
response (STR) as a measure. The STR is a proximal retina waveform that is more sensitive
to low-level illumination than the b-wave and saturates at a lower light intensity 120. It can
only be elicited in subjects who have been dark adapted. In order to record the STR, dark-
adapted subjects are exposed to flashes of very low intensity, producing an inner retina
response (Figure 15). As flash stimuli increase in intensity, bipolar cell depolarization will
eventually lead to b-wave encroachment. Saszik and colleagues performed intravitreal γ-
aminobutyric acid (GABA) injections in mice to eliminate the STR in order to determine that
the b-wave encroachment is initiated at a flash intensity of -4.3 log sc td s, equivalent to
0.00005 c.s/m2 120. The positive component of the STR (pSTR) denotes ganglion cell
activity while the negative deflection (nSTR) is a combined response from ganglion cell and
amacrine cell activity 28, 121. Aylward recorded ERGs in 50 diabetic patients and 10
nondiabetic subjects, finding a correlation between severity of diabetic retinopathy and STR
abnormalities 30.

58
Fig. 15. Scotopic Threshold Response is recorded in dark-adapted animals. The positive STR is
followed by the negative STR. Note that as the flash intensity grows brighter (0.0001 and 0.0005
c.s/m2), the pSTR is masked by the emerging b-wave.
Animal models provide useful insight into the normal and abnormal functions and
physiological processes that are common across species. ERG studies have been performed
in such mammalian species as primates, cats, guinea pigs, rats, and mice. Sieving and
colleagues performed pioneering work in isolating and understanding the STR by recording
ERGs in dark-adapted cats 122. Saszik and coworkers further defined our understanding of
the STR waveform using C57/BL6 mice 120. Mice have been utilized for years in
electroretinography studies as a way to learn more about the electrophysiology of vision 120,
123, 124. For instance, Lei and colleagues studied rhodopsin knockout (rho-/-) mice and cone
photoreceptor function loss 1 (cpfl1) mice to determine differences in OP results based on
pure cone and pure rod pathways 125.

59
ERG studies in diabetic animal models have been carried out largely in streptozotocin-
induced diabetic rats 31, 35, 38, 75-78. Several studies reported a reduction of the a-wave
amplitude by 12 weeks after the onset of diabetes, suggesting loss of photoreceptor function
35, 75, 93. Additionally, Hancock and Kraft found a delay in the a-wave implicit time 76, a
result which had also been reported in humans with diabetes 114, 126. Animal studies and
clinical trials show differing results with regards to b-wave response to diabetes. Animal
studies consistently demonstrate a decrease in b-wave amplitude by 12 weeks after the onset
of diabetes 38, 76, 77. Phipps and coworkers recorded decreased b-wave amplitudes as early as
2 days after STZ injection 75. The same study also determined that there was no change in b-
wave latency in the diabetic rat model, a finding that was replicated in another animal study
31. In clinical trials of humans with diabetes, however, it is an increase in b-wave latency that
has been shown to change with diabetic retinopathy 41, 117. Taken together the results of many
ERG studies provide evidence of loss of function in photoreceptors, amacrine cells, bipolar
and horizontal cells. Potential explanations for this include reduction in the actual cell
numbers, or functional deficits in neurotransmission between neurons.
In addition to the diabetic rat studies, there have been a small number of published reports
that used diabetic mice to determine the effects of diabetes on retinal electrophysiology.
Muriach and colleagues found a decrease in b-wave amplitude in alloxan-induced diabetic
mice 40. In a report by Johnsen-Soriano and coworkers, the b-wave amplitude was measured
as a way to assess the effectiveness of a proposed treatment. The b-wave amplitude was
restored to normal values in diabetic mice after 3 weeks of treatment using lipoic acid 39.
While these are important discoveries, there is another mouse model of diabetes that has not

60
been represented in the ERG literature. The Ins2Akita mouse does not require the introduction
of toxins to induce a diabetic state and has been validated as a useful animal in modeling the
characteristics of diabetic retinopathy 19, 20, 60, 62. The Ins2Akita mouse contains a point
mutation in the Ins2 gene that prevents disulfide bonding of the proinsulin A- and B- chains.
Without the formation of these disulfide bonds, the subsequent misfolded proteins
accumulate in the pancreas, leading to eventual beta cell apoptosis. Beta cell death results in
hypoinsulinemia and hyperglycemia, making the Ins2Akita mouse a useful model for the
spontaneous onset of diabetes in humans 62, 103, but there are, as yet no published reports of
ERG data from Ins2Akita mice. The aim of this study was to test the hypothesis that Ins2Akita
mice exhibit ERG abnormalities similar to those seen in human diabetic retinopathy.
EXPERIMENTAL PROCEDURES
Animals
Heterozygous C57BL/6J Ins2Akita mice were bred and maintained at the Penn State College
of Medicine Juvenile Diabetes Research Foundation Diabetic Retinopathy Center Animal
Facilities Core. Ins2Akita mice have a spontaneous mutation in the Ins2 gene that prevents
disulfide bonds from forming, leading to protein misfolding, endoplasmic reticulum stress,
and eventual pancreatic beta cell death, rendering the animals hypoinsulinemic and
hyperglycemic at 4 weeks of age. In the present study, data was collected from 11- and 14-
week old mice that had been diabetic for 7 and 10 weeks, respectively. Female Ins2Akita mice
demonstrate later onset and a lesser degree of hyperglycemia. 103. For this reason, only male

61
mice were used in the present study. Animals were housed in the Penn State College of
Medicine animal facility in a standard 12 hour light/dark cycle with littermates in plastic
cages, with ad libitum access to food and water in accordance with the Institutional Animal
Care and Use Committee guidelines, standards set forth in the ARVO Statement of the Use
of Animals in Ophthalmic and Vision Research, and the NIH Guidelines for the Care and
Use of Laboratory Animals.
Diabetic animals receiving insulin treatment were anesthetized with an intraperitoneal
injection of ketamine/xylazine (0.072 mg ketamine, (Phoenix Pharmaceuticals, St. Joseph,
MO), and 0.005 mg xylazine, (Vedco, St. Joseph, MO) /g body weight). While under
anesthesia, the external surface of the animal’s abdomen was prepared with povidone- iodine
antiseptic solution (Betadine, Purdue Pharma, Stamford, CT). Two 13 mg insulin implants
(LinBit for Mice, Sustained Release Insulin Implants; LinShin Canada, Inc., Toronto,
Ontario) were inserted subcutaneously into the flank region, using a12-gauge trocar. These
insulin pellets have a release rate of 0.1 U/day/implant over a period of 30 days.
Mice were dark adapted overnight in a ventilated, light-proof chamber with unlimited access
to food and water. All subsequent work involved in preparation for ERG testing was
performed under red L.E.D. illumination, as mice do not have long wavelength sensitive
cones capable of detecting red light. ERGs were recorded using the Espion2 system
(Diagnosys LLC, Lowell, MA). The mice were anesthetized with an intraperitoneal injection
of ketamine/xylazine (0.072 mg ketamine, (Phoenix Pharmaceuticals, St. Joseph, MO), and
0.005 mg xylazine (Vedco, St. Joseph, MO) /g body weight). Whiskers were trimmed to

62
enable free access to the animal’s cornea and both eyes were dilated with Atropine sulfate
1% (Bauch & Lomb, Tampa, FL) and Tropicamide 1% (Wilson Ophthalmic, Mustang, OK).
The mouse was then placed on Espion2’s warming platform which maintains the animal’s
body temperature during set-up and recording. A platinum needle ground electrode (Grass
Technologies, West Warwick, RI) was placed subcutaneously between the animal’s scapulae.
A negative electrode was placed either medial to the eye being tested using a platinum
needle, or in the ipsilateral cheek, using a copper-plated clip electrode. A contact lens-style
recording electrode (LKC, Gaithersburg, MD) was filled with conductive lubricating gel
(GenTeal, Novartis, East Hanover, NJ) and placed over the eye to be tested. In all cases save
one, the left eye was tested. The exception involved injury to the left eye and the right eye
was used for recordings. The contralateral eye was treated with the same lubricating gel to
prevent corneal drying during the time the animal was under anesthesia. The animal was
positioned on the warming platform, on his side with the recording electrode oriented upward
toward the Ganzfeld stimulator, which was lowered into place over the animal.
The ERG flash protocol consisted of a stepwise progression of full field flashes, beginning
with very dim (subthreshold) stimuli, and progressing to greater flash energies. All stimuli
presented to the animals were composed of broad spectrum white light. Lower intensity
flashes were produced by L.E.D., while brighter flash intensities were produced by xenon
bulb. Following each of the brightest steps, there was a dark adaptation period of 1 to 5
minutes, to allow the animal to recover from photobleaching in preparation for the next
stimulus. Oscillatory potentials were filtered with a bandpass filter of 10-1000 Hz.
Responses to the stimuli were recorded from a number of consecutive sweeps, (50 sweeps at

63
the lowest flash intensities, fewer at the higher intensities) and averaged for a final output.
Amplitudes and implicit times were collected for each of the following ERG waveform
components: positive scotopic threshold (pSTR), negative scotopic threshold (nSTR), a-
wave, b-wave, and oscillatory potentials (OPs). OP results were summed in a manner
previously described by Hancock and Kraft 76.
RESULTS
Animal Data
The control animals continued to gain mass throughout the study. Diabetic animals failed to
gain mass at the same rate as controls, and weighed significantly less that controls at 11- and
14 weeks of age. Blood glucose averages in control mice remained below 250 mg/dL
throughout testing. Untreated diabetic mice averaged 795 mg/dL at 11 weeks and 823 mg/dL
at 14 weeks. Animals that received insulin implants began to gain weight, but did not attain
masses seen in controls. Insulin restored blood glucose levels to near-euglycemic ranges,
significantly lower than those recorded in the untreated animals (Table 3).

64
11 weeks 14 weeks
n= Mass (g) Blood glucose (mg/dL)
n= Mass (g) Blood glucose (mg/dL)
Control 20 28±2.6a 227±76 b 10 31±2.9c,d 209±49e
Diabetic (-) insulin
19 25±2.2a 795±144b 6 24±3.4c 823±108e
Diabetic (+) insulin
- - - 6 26±1.5d 297±122
Table 3. Mass and blood glucose levels measured in diabetic and control mice at 11 weeks and
14 weeks of age. Half of the diabetic mice in the 14 week-old group received insulin implants to
lower their blood glucose levels. ap < .0001, bp < .0001, cp < .005, dp < .005, ep < .0001
Positive Scotopic Threshold Response
11 week old dark adapted Ins2Akita mice exposed to very dim (scotopic) flash intensities
exhibited a significantly diminished amplitude response, compared to age-matched control
mice. At flash intensities of 0.00001 c.s/m2 and 0.00005 c.s/m2, the average amplitudes were
5.28(±1.00) µv and 16.52(±2.05) µv, respectively, in diabetic mice; compared to 9.64(±0.87)
µv and 26.08(±2.59) µv in controls. There were significant differences in the results at
0.0001 c.s/m2 and 0.0005 c.s/m2 as well, although at these brighter flash intensities, the
bipolar cell response was encroaching so that the ganglion cell dominant pSTR became lost
in the emerging b-wave (Figure 16 A). The pSTR implicit times for the diabetic mice,
however, were not different from those of the control mice (Figure 16 B).

65
Fig. 16 Positive scotopic threshold response for 11 week old Ins2Akita mice. A) pSTR amplitude
was diminished at all scotopic flash intensities in diabetic mice compared to age-matched control.
Flash intensities of 0.00001 and 0.00005 c.s/m2 are considered to be in the scotopic range. The higher
flash intensities presented here mark the first positive peak, but will also include bipolar cell signal
from the encroaching b-wave. B) There was no difference between groups with regard to pSTR
implicit times. * p < 0.05

66
Negative Scotopic Threshold Response
The nSTR measured in 11 week old mice showed no difference in amplitude or implicit time
(Figures 17 A and 17 B). At higher flash intensities, above the scotopic range, there was a
significant difference in amplitude, with diabetic responses diminished in comparison with
age-matched controls (Figure 17 A)

67
Fig. 17. Negative STR is unchanged in diabetic mice. A) nSTR amplitude measurements were not
different through the scotopic stimulus range. There was a significantly reduced amplitude in the
diabetic mice at a flash intensity of 0.0005 c.s/m2, but this was outside the scotopic range. B) There
was no difference between the diabetic and control groups with regard to nSTR implicit times across
any of the tested flash intensities.

68
a-Wave
11 week old diabetic mice showed no difference in a-wave amplitudes, with any of the tested
flash intensities, compared to age-matched controls (Figure 18 A). While the lower intensity
flashes trended toward delayed a-wave implicit times in the diabetic animals, this difference
did not reach significance until the flash intensity reached 1.0 c.s/m2. Interestingly, at 10
c.s/m2, the a-wave trough was significantly delayed in the control animals (Figure 18 B).
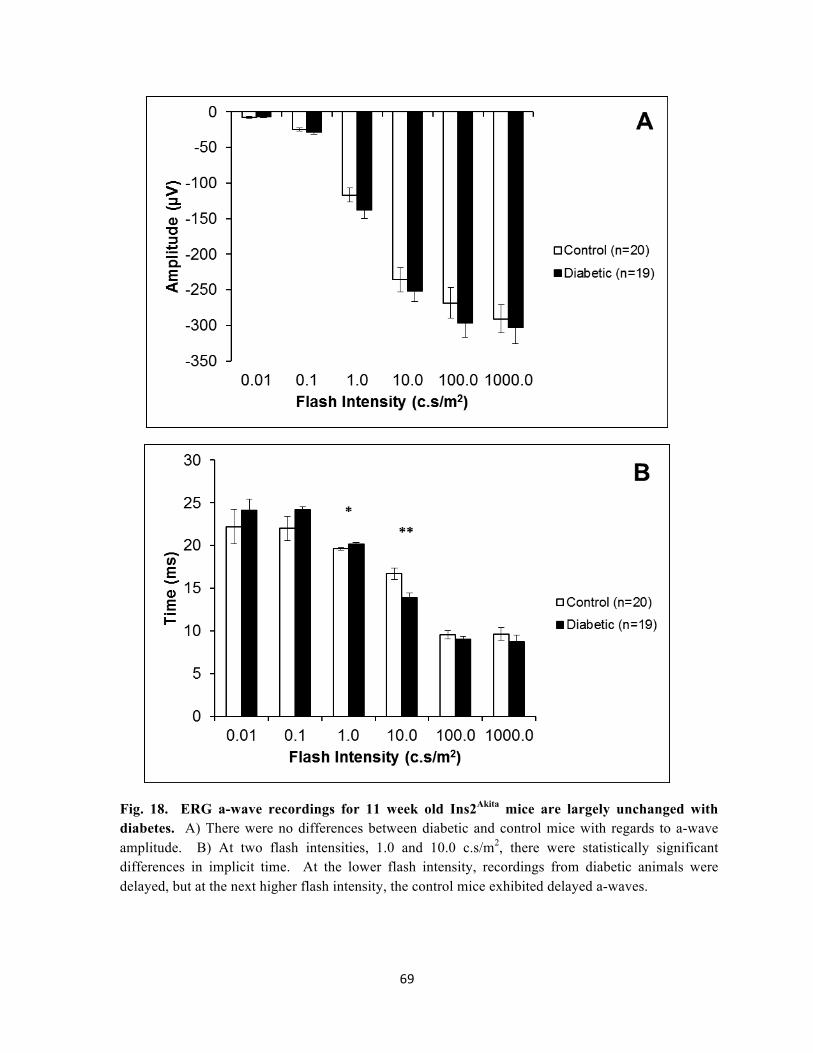
69
Fig. 18. ERG a-wave recordings for 11 week old Ins2Akita mice are largely unchanged with diabetes. A) There were no differences between diabetic and control mice with regards to a-wave amplitude. B) At two flash intensities, 1.0 and 10.0 c.s/m2, there were statistically significant differences in implicit time. At the lower flash intensity, recordings from diabetic animals were delayed, but at the next higher flash intensity, the control mice exhibited delayed a-waves.

70
b-Wave
At 11 weeks of age, the b-waves recorded from diabetic mice were not different in amplitude
from the control mice (Figure 19 A). Furthermore, the b-wave implicit times were not
significantly different in the diabetic and control mice, except at one flash intensity: 1.0
c.s/m2 (Figure 19 B).

71
Fig. 19. ERG b-wave response is largely unchanged by 11weeks age. A) b-wave amplitude was
unchanged at all flash intensities tested. B) The control mice demonstrated a significant b-wave delay
at a single flash intensity, 1.0 c.s/m2.
B
72
Oscillatory Potentials
OPs were filtered with a bandpass filter and OPs 1 through 4 were recorded and summed to
determine both amplitude and implicit times. The summed OP amplitudes were not
significantly different between the two groups. At all flash intensities, the diabetic mice had
lower average summed amplitudes, but this trend did not reach significance. (Figure 20 A).
The lower flash intensities resulted in a delay in the implicit times of summed OPs in the
diabetic mice compared to the age-matched controls. Significant delays were recorded at
0.001, 0.01, and 0.1 c.s/m2 (Figure 20 B).

73
Fig. 20. Oscillatory potentials are significantly delayed in 11 week old diabetic mice.
A) Summed oscillatory potential amplitudes were not significantly reduced in diabetic mice. B) At
the lower flash intensities, however, summed oscillatory potentials were significantly delayed in the
diabetic animals, compared to age-matched controls. * p < 0.05

74
A subset of the diabetic Ins2Akita mice were further divided into untreated (DM – insulin) and
insulin treated (DM + insulin). The insulin treated group received subcutaneous sustained-
release insulin implants in order to normalize their blood glucose values. When the animals
reached 14 weeks of age (diabetic for 10 weeks), ERG protocols were repeated.
Positive Scotopic Threshold Response
One week after the subcutaneous insulin was implanted into the diabetic mice, dark adapted
animals were tested using the previously outlined ERG protocol. ERGs were recorded using
the dimmest flash stimuli capable of eliciting responses, resulting in scotopic threshold
responses. The averaged pSTR responses at scotopic flash intensities failed to demonstrate
any differences between the three age-matched groups: control, untreated diabetic mice, and
insulin-treated diabetic mice, with regard to pSTR amplitude (Figure 21 A), or implicit time
(Figure 21 B).

75
Fig. 21. There is no difference in pSTR between controls, treated-, or untreated- diabetic mice
at 14 weeks. ERGs recorded were 1 week after 6 of the diabetic mice received subcutaneous insulin
implants. A) There was not a significant difference between the groups with regard to pSTR
amplitude. B) pSTR implicit time was also not different between the three groups.

76
Negative Scotopic Threshold Response
Stimulus flashes of scotopic intensity yielded highly variable nSTR amplitude results. The
amplitudes recorded for the control mice were not significantly different from either the
treated or untreated diabetic groups (Figure 22 A). There was also no difference between the
three groups’ nSTR implicit times (Figure 22 B).

77
Fig. 22. There is no difference in nSTR between controls, treated-, or untreated- diabetic mice
at 14 weeks. A) There was not a significant difference between the groups with regard to pSTR
amplitude. B) pSTR implicit time was also not different between the three groups.
A
B

78
a-Wave
Similar to the results from the 11 week-old mice, there were no differences in average a-
wave amplitudes between diabetic and control mice at 14 weeks of age. Furthermore, the a-
wave amplitude did not vary significantly due to the presence or absence of insulin in the
diabetic animals (Figure 23 A). The averaged implicit times of the a-waves at each flash
intensity also demonstrated no difference between groups, although there is an interesting
trend in the results recorded at 10 c.s/m2, wherein the untreated diabetic animals exhibited an
earlier a-wave trough than controls (though this did not reach significance as it did at the
same flash intensity in the 11 week-old mice), and the insulin-treated diabetic animals had a-
wave implicit values almost identical to control values (Figure 23 B).

79
Fig. 23. There is no difference in a-wave amplitude or implicit time measurements, when
comparing 14 week old controls, treated-, and untreated- diabetic mice. A) a-wave amplitudes
are not different across the three groups. B) a-wave implicit times are not different across the three
groups.

80
b-Wave
The b-wave amplitude values for 14 week-old mice were largely unchanged compared to the
11 week-old values, and there was no difference in amplitude averages when compared
across the 3 groups (Figure 24 A). Implicit times recorded in the 14 week-old mice reveal
that, at all flash intensities, the untreated animals exhibited a decrease in average implicit
time in the untreated diabetic group, compared to age-matched controls. This difference was
significant at all flash intensities except for 0.5 and 1 c.s/m2. At all flash intensities, the
average implicit times for the treated diabetic mice were statistically similar to the control
values (Figure 24 B).

81
Fig. 24. Untreated 14 week old diabetic mice demonstrate reduced b-wave implicit times.
A) There was no difference in amplitude between groups at any of the flash intensities tested. B) The
uncontrolled diabetic mice had significantly reduced implicit times compared to age-matched controls
at stimulus intensities of 0.001, 0.005, 0.01, 0.05, 0.1, and 10 c.s/m2. The insulin-treated diabetic
mice had implicit times that were not different from age-matched controls at all flash intensities.
B

82
Oscillatory Potentials
The OPs recorded from 14 week-old mice did not result in a significant difference between
untreated diabetic mice, insulin-treated diabetic, or control mice. There were no differences
in summed OP amplitudes (Figure 25 A), or summed implicit times (Figure 25 B).

83
Fig. 25. ERG oscillatory potentials for 14 week old Ins2Akita mice do not demonstrate
differences between controls, and treated, or untreated diabetic animals. A) Summed oscillatory
potential amplitudes are not significantly different from each other in the three groups. B) Summed
oscillatory potential implicit times are also not significantly different from each other in the three
groups.

84
DISCUSSION
Electroretinography is an important research tool in the field of vision research. The
component parts of the resulting waveform can be useful in determining the cellular origin of
electrophysiological dysfunction. Neurodegeneration, such as that seen in diabetic
retinopathy, can be correlated with changes in specific aspects of ERG waveforms. This
study used the Ins2Akita diabetic mouse as a model for diabetic retinopathy in an effort to
study the early effects of diabetes on the retina and the role that insulin plays in changes to
ERG responses. In this study, the author tested the hypothesis that ERG alterations measured
in humans with diabetes can be demonstrated in similar results from Ins2Akita mice.
The present study found disturbances in the ERG results from 11 week-old diabetic mice
(duration of diabetes, 7 weeks) compared to age-matched nondiabetic counterparts. ERG
results from diabetic mice demonstrated delayed OPs and diminished pSTR compared to
control values. The delay in OP implicit time that was noted in the diabetic mice indicates
pathology localized to the inner retina. At this early time point, the mice did not show any
significant differences in a- or b-wave responses. At 14 weeks of age (10 weeks diabetic),
untreated diabetic mice demonstrated a significantly reduced b-wave implicit time, compared
to age-matched controls and diabetic mice that had received insulin implants. At this later
time point, the differences in OP latency and pSTR amplitude were lost. This is likely due to
a smaller number of animal subjects leading to the study being underpowered. Power
analyses were performed to determine the number of mice that would be necessary to
determine a difference between the groups. Results indicated that the required sample size

85
would have needed to be 23 to 27 mice for the STR experiments and 8 to 21 mice for the OP
study, to demonstrate a difference (Chang Bioscience calculator, Castro Valley, CA).
The Ins2Akita mouse has been used previously as a valuable model of diabetic retinopathy, but
this is the first time, to the author’s knowledge, that this mouse has been used to study the
effects of diabetes on ERG results. While this is an important first step, there are some
limitations to the present study. As this was the first ERG study performed using Ins2Akita
mice, the protocol was designed to study all of the major waveforms across a broad range of
flash intensities. Responses were recorded under scotopic environments, with pauses built
into the protocol, after flash stimuli, to allow the animal to readapt to a darkened
environment. Time constraints limited the number of steps of increasing flash intensities that
could be included in the protocol, in order to finish testing within a period of time wherein
the animals remained under anesthesia. This made it necessary to increase the luminance of
the flash stimuli fairly quickly over a limited number of steps. This was most problematic
during the STR testing. The results indicate that in recordings resulting from flash stimuli of
0.0001 c.s/m2 and greater, the emerging b-wave was interfering with the STR. It would have
been preferable to have recorded STRs at a greater number of the intervening flash intensities
between 0.00001 and 0.0001 c.s/m2 in order to more narrowly define the differences in STRs
from diabetic and control animals. Another limitation of this study is the small number of
subjects used in the insulin treatment experiment. By dividing the number of diabetic
animals into two groups (untreated and insulin treated), the author hoped to determine
whether or not insulin could rescue diminished or delayed ERG results seen in diabetic

86
animals. Unfortunately, halving the number of diabetic animals left the study underpowered
and did not provide an adequate sample size to offset the variation in the results.
Clinical studies in humans with diabetes have demonstrated findings similar to those shown
here, including changes in OP implicit time and diminished STR amplitude. The Pardue lab
found OP results very similar to those seen in this study. Specifically, they found that
dimmer flash intensities were more sensitive at detecting OP changes in diabetes. At lower
flash energies (below current standards set by the International Society for Clinical
Electrophysiology of Vision), ERG responses were able to uncover evidence of pathology
not discernable at higher flash intensities 127. These findings are paralleled in the current
study, in which OP delays were evident in the diabetic mice at flash intensities of 0.001,
0.01, and 0.1 c.s/m2 after being diabetic for only 7 weeks. Brighter stimuli, however, failed
to show a difference in OP implicit time values.
There have not been a large number of clinical studies focusing on the scotopic threshold
response in humans with diabetes. Aylward noted a correlation between diminished STR
amplitude and severity of diabetic retinopathy 30. Graham and Vaegan reported similar
findings in the ERGs derived from diabetic subjects 121. Kaneko and colleagues studied
patients with type II diabetes who had maintained tight glycemic control and who
demonstrated no vascular retinal abnormalities. These patients had STR values that were not
different from age-matched control subjects 128. It is interesting to note that these studies in
human scotopic ERG responses only measured the negative portion of the STR (nSTR). A
more recent study in STZ-induced diabetic rats was able to uncover the smaller positive

87
deflection (pSTR) that precedes the nSTR. Similar to the findings presented here, Kohzaki
and coworkers found that the pSTR amplitude was reduced in rats 4, 8, and 11 weeks after
onset of diabetes. These changes in pSTR were evident before the onset of any nSTR
changes and before the onset of changes in STR implicit times 31. The fact that the ganglion
cell-dominated pSTR is affected prior to the onset of nSTR changes in the work by Kohzaki
and coworkers, and in the present study, may indicate pathology specific to the ganglion
cells. The nSTR is thought to be the response from not only ganglion cells, but also includes
amacrine cell function. While it is known that amacrine cells are lost by apoptosis in
diabetes 20, and that this occurs within the same timeframe as ganglion cell loss 19, the
magnitude of this loss may not have been sufficient at this early time point to affect the
nSTR.

88
CHAPTER FIVE
Concluding Discussion

89
This dissertation serves as a means to explore the neurodegenerative effects of diabetes in the
retina, with an emphasis on learning more about the earliest alterations that take place in the
disease progression. To that end, the author made use of laboratory techniques involving
immunohistochemistry, western blotting, histologic staining, microscopy, and
electroretinography. These assays yielded results which uncovered alterations in protein
expression, cell population, and electrophysiology, all of which occur in response to early
diabetic changes in the retina. The human retinas that were studied came from donors who
had had type II diabetes for less than 10 years. These were compared to retinas from non-
diabetic humans of similar ages. The animal model used was the Ins2Akita diabetic mouse.
These mice were 11-14 weeks old, which means that they had hyperglycemia for only 7 to 10
weeks. This is an important distinction, as human studies frequently examine subjects with
advanced stages of proliferative diabetic retinopathy; and animal studies are often conducted
in diabetic animals that have had diabetes for an extended period of time. The use of
younger mice not only models the earliest diabetes-induced changes, but also eliminates any
age-related confounding variables.
The human histopathology study presented in chapter 2 establishes the loss of peripheral rod
photoreceptors from donors with a short duration of diabetes, compared with age-matched
non-diabetic donors. While this photoreceptor degeneration is supported by others, no
definitive mechanism has been confirmed by which photoreceptor loss takes place. It is well
established that photoreceptors are responsible for the extremely high metabolic demands of
the retina 129. In cases wherein the retina is compromised, such as ischemic conditions,
retinal tissue may not be able to meet those metabolic demands, leading to eventual neuronal

90
loss 130. Furthermore, hypoxic conditions lead to increased expression of VEGF which
signals neovascularization 131. Dr. Geoffrey Arden has proposed the possibility that the
metabolic demands of the rods in the diabetic retina are the cause of diabetic retinopathy; that
the oxygen demands of supporting a full complement of photoreceptors will, in certain
situations (such as dark adaptation), create a hypoxic situation in the retina. Hypoxia then
induces VEGF-induced neovascularization. He surveyed a small population of patients with
both retinitis pigmentosa, a rod-degenerating disease, and diabetes, and found that these
patients did not develop the vascular signs of diabetic retinopathy. A disease process like
retinitis pigmentosa would lead to progressive destruction and removal of rod photoreceptors.
Photoreceptor outer segment ion channels are normally held open as their default position in
the dark. The ion pumps, located in the inner segment, require considerable energy to
maintain this so-called “dark current.” As the photoreceptor population decreases in retinitis
pigmentosa, so would the oxygen demands, thereby preventing diabetic retinopathy 86. The
assumptions of Dr. Arden’s ideas as to the causative factors in diabetic retinopathy have not
been rigorously tested, but it is interesting to consider the possibility that the loss of rod
photoreceptors in diabetes may serve a protective role by lessening the metabolic demands of
the retina.
The rhodopsin content study, presented in chapter 3 demonstrates, by immunoblot analysis,
diabetes-induced reduction of rhodopsin in retinas harvested from Ins2Akita mice, compared to
age-matched controls. This represents a 27% decline in rhodopsin content, within a span of 7
weeks of hyperglycemia. While the reasons for this loss of rhodopsin are unknown,
possibilities include the loss of photoreceptor number or a decrease in outer segment length.

91
ONL cell quantification (Figure 11) did not find a difference in the number of ONL cell
bodies with diabetes. This may represent a case in which there is a difference in disease
progression in the animal model compared to human pathology, or these results may reflect
the fact that this data was collected from a small sample of mice. Photoreceptor outer
segment length was not measured in this study, but diminished outer segment length has been
demonstrated previously in diabetes 51, 107.
The ERG evidence presented in chapter 4 establishes the Ins2Akita mouse as useful in
modeling certain aspects of diabetic electrophysiology. After only 7 weeks of
hyperglycemia, these diabetic mice demonstrate defects in ERG responses to stimuli
compared to their age-matched counterparts. ERG recordings from dark adapted diabetic
mice had a significantly diminished scotopic threshold response. Oscillatory potentials were
delayed in these Ins2Akita mice as well. These changes are similar to some of the early
changes seen in ERG recordings from humans with diabetes. It will be important to repeat
the insulin treatment studies in the future, with an increased sample size, in order to
determine if insulin is able to rescue the ERG waveforms that were reduced or delayed in this
study.
The reduction in the positive scotopic threshold response in the Ins2Akita mice indicates
pathology in the retinal ganglion cell population. This further supports the many
neurodegeneration studies that have found increased ganglion cell apoptosis in diabetes. The
present ERG study also found delays in the oscillatory potentials of diabetic animals, which
may be the result of the loss of synaptic connections within the inner plexiform layer. Taken

92
together, the results of the ERG study point to inner retinal neurodegeneration in diabetes.
This is in contrast to the findings in the rhodopsin content study, which demonstrate a
reduction of rhodopsin, an outer retina protein, in diabetic mice. The rhodopsin content was
diminished without a concomitant loss of transducin or phosphodiesterase, two other
photoreceptor proteins. This suggests that rhodopsin content may be reduced without the
loss of the photoreceptor cells that contain these proteins. In humans, however, the rod
photoreceptor is the very cell type which was implicated in chapter 2. There, it was
determined that, in humans with a short duration of diabetes, rod photoreceptors were
reduced in number compared with cell counts from age-matched donors. There are obvious
similarities and differences in the results from these studies, emphasizing the importance of
animal models in research as a way to study certain aspects of a disease. Care must be taken,
however, to refrain from interpreting the results from one model and imposing those
interpretations too broadly. There are findings that are presented here, that may be useful to
gain a better understanding of diabetic retinopathy. The histologic evidence from human
donors that rod photoreceptors are preferentially lost early in diabetes is an important aspect
of diabetes that has not been explored in the literature.
While the experimental results presented in this dissertation address some of the current gaps
in knowledge regarding diabetic retinopathy, they also point to other unanswered questions.
Future experiments need to be designed to better understand the photoreceptor loss that was
measured in diabetic human donor tissue. Such work would benefit from the use of
additional donor eyes, and may concentrate on donors with different durations of diabetes.
Comparisons also need to include eyes from donors with type I diabetes. It would also be

93
helpful if donor eyes could be matched with more complete donor information such as
HbA1c levels and clinical notes regarding retinopathy status. Future histologic studies of
human retinas might also benefit from horizontal sectioning, parallel to a line through the
fovea and optic disc, in order to better localize photoreceptor loss. Improved fixation and
camera technology may enable accurate rod photoreceptor counts.
Additional experiments need to be designed in order to further explore the diabetes-induced
changes that were documented in the Ins2Akita mice. Why is the protein content of the
monomeric form of rhodopsin diminished in diabetic mice, while the total protein content
and mRNA expression of rhodopsin and transducin are unaltered? Electroretinographic
responses in the current study also leave unanswered questions. Future ERG studies will
require an increased number of animal subjects to detect the effects of insulin on the various
recorded waveforms. Paired-flash ERGs will provide more insight into dark-adaptation
deficiencies. Additional scotopic flash intensities need to be added to the ERG protocol to
collect important information related to the scotopic threshold response. These and other
experiments will add to the understanding of the neurodegenerative changes that take place
in diabetic retinopathy.
This dissertation reports experimental results that establish and confirm diabetes-induced
neurodegeneration in the retinas of humans and spontaneously diabetic animals. The
collection of these data may improve our understanding of early retinal responses to diabetes.
Such understanding will enable clinicians to have a more complete picture of the pathology
and progression of diabetic retinopathy, allowing for them to better educate and treat their

94
patients. It may prove therapeutic, based on the results presented here, to develop treatment
options that target the outer retina in an effort to reduce or delay the loss of rod
photoreceptors in patients with diabetes. The rhodopsin results reported here may serve to
offer some good news to patients with diabetes, as the data suggest that there is redundancy
built into the phototransduction cascade. Although rhodopsin content is diminished in the
diabetic mice, the nature of signal amplification is such that, downstream signaling
compensates for this loss, demonstrated by the fact that transducin and phosphodiesterase
levels remained unchanged as did the photoreceptor-dominant a-wave. The ERG evidence of
diabetes-induced neurodegeneration provides further evidence of the usefulness of the
Ins2Akita mouse as a model for diabetic retinopathy. The alterations in waveforms are very
similar to changes seen in humans with diabetes, and thus may prove useful in developing
treatment options targeted to the inner retina cell types responsible for the abnormal ERG
results demonstrated here.

95
REFERENCES
1. Wild S, Roglic G, Green A, Sicree R, King H: Global prevalence of diabetes: estimates
for the year 2000 and projections for 2030, Diabetes Care 2004, 27:1047-1053
2. Klein R, Klein, B.E.: Vision Disorders in Diabetes. Edited by NIH, 1995, p. pp. 293 - 337
3. Antonetti DA, Barber AJ, Bronson SK, Freeman WM, Gardner TW, Jefferson LS, Kester
M, Kimball SR, Krady JK, LaNoue KF, Norbury CC, Quinn PG, Sandirasegarane L,
Simpson IA: Diabetic retinopathy: seeing beyond glucose-induced microvascular disease,
Diabetes 2006, 55:2401-2411
4. Hardy RA, Shetlar DJ: Retina. Edited by Riordan-Eva P, Whitcher JP. New York, Lange
Medical Books/McGraw-Hill Medical Publishing Division, 2004, p.pp. 466
5. Brinchmann-Hansen O, Bangstad HJ, Hultgren S, Fletcher R, Dahl-Jorgensen K,
Hanssen KF, Sandvik L: Psychophysical visual function, retinopathy, and glycemic control
in insulin-dependent diabetics with normal visual acuity, Acta Ophthalmol (Copenh) 1993,
71:230-237
6. Arend O, Remky A, Evans D, Stuber R, Harris A: Contrast sensitivity loss is coupled
with capillary dropout in patients with diabetes, Invest Ophthalmol Vis Sci 1997, 38:1819-
1824
7. Abrishami M, Heravian J, Derakhshan A, Mousavi M, Banaee T, Daneshvar R,
Moghaddam HO: Abnormal Cambridge low-contrast grating sensitivity results associated
with diabetic retinopathy as a potential screening tool, East Mediterr Health J 2007, 13:810-
818
8. Fristrom B: Peripheral and central colour contrast sensitivity in diabetes, Acta
Ophthalmol Scand 1998, 76:541-545

96
9. Greenstein VC, Holopigian K, Seiple W, Carr RE, Hood DC: Atypical multifocal ERG
responses in patients with diseases affecting the photoreceptors, Vision Res 2004, 44:2867-
2874
10. Hardy KJ, Lipton J, Scase MO, Foster DH, Scarpello JH: Detection of colour vision
abnormalities in uncomplicated type 1 diabetic patients with angiographically normal retinas,
Br J Ophthalmol 1992, 76:461-464
11. Tregear SJ, Knowles PJ, Ripley LG, Casswell AG: Chromatic-contrast threshold
impairment in diabetes, Eye (Lond) 1997, 11 ( Pt 4):537-546
12. Klein R: Age-related eye disease, visual impairment, and driving in the elderly, Hum
Factors 1991, 33:521-525
13. Henson DB, North RV: Dark adaptation in diabetes mellitus, Br J Ophthalmol 1979,
63:539-541
14. Barber AJ, Lieth E, Khin SA, Antonetti DA, Buchanan AG, Gardner TW: Neural
apoptosis in the retina during experimental and human diabetes. Early onset and effect of
insulin, J Clin Invest 1998, 102:783-791
15. Barber AJ, Nakamura M, Wolpert EB, Reiter CE, Seigel GM, Antonetti DA, Gardner
TW: Insulin rescues retinal neurons from apoptosis by a phosphatidylinositol 3-kinase/Akt-
mediated mechanism that reduces the activation of caspase-3, J Biol Chem 2001, 276:32814-
32821
16. Nakamura M, Barber AJ, Antonetti DA, LaNoue KF, Robinson KA, Buse MG, Gardner
TW: Excessive hexosamines block the neuroprotective effect of insulin and induce apoptosis
in retinal neurons, J Biol Chem 2001, 276:43748-43755
17. Abu-El-Asrar AM, Dralands L, Missotten L, Al-Jadaan IA, Geboes K: Expression of
apoptosis markers in the retinas of human subjects with diabetes, Invest Ophthalmol Vis Sci
2004, 45:2760-2766

97
18. Martin PM, Roon P, Van Ells TK, Ganapathy V, Smith SB: Death of retinal neurons in
streptozotocin-induced diabetic mice, Invest Ophthalmol Vis Sci 2004, 45:3330-3336
19. Gastinger MJ, Kunselman AR, Conboy EE, Bronson SK, Barber AJ: Dendrite
remodeling and other abnormalities in the retinal ganglion cells of Ins2 Akita diabetic mice,
Invest Ophthalmol Vis Sci 2008, 49:2635-2642
20. Gastinger MJ, Singh RS, Barber AJ: Loss of cholinergic and dopaminergic amacrine cells
in streptozotocin-diabetic rat and Ins2Akita-diabetic mouse retinas, Invest Ophthalmol Vis
Sci 2006, 47:3143-3150
21. Park JW, Park SJ, Park SH, Kim KY, Chung JW, Chun MH, Oh SJ: Up-regulated
expression of neuronal nitric oxide synthase in experimental diabetic retina, Neurobiol Dis
2006, 21:43-49
22. VanGuilder HD: Depletion of Retinal Synaptic Proteins in Experimental Diabetes:
Implications for Vision Loss in Diabetic Retinopathy. Edited by Hershey, Pennsylvania State
University, 2008, p. pp. 1-187
23. VanGuilder HD, Brucklacher RM, Patel K, Ellis RW, Freeman WM, Barber AJ: Diabetes
downregulates presynaptic proteins and reduces basal synapsin I phosphorylation in rat
retina, Eur J Neurosci 2008, 28:1-11
24. Karwoski CJ, Xu X: Current source-density analysis of light-evoked field potentials in
rabbit retina, Vis Neurosci 1999, 16:369-377
25. Green DG, Kapousta-Bruneau NV: A dissection of the electroretinogram from the
isolated rat retina with microelectrodes and drugs, Vis Neurosci 1999, 16:727-741
26. Sieving PA, Murayama K, Naarendorp F: Push-pull model of the primate photopic
electroretinogram: a role for hyperpolarizing neurons in shaping the b-wave, Vis Neurosci
1994, 11:519-532
27. Wachtmeister L: Oscillatory potentials in the retina: what do they reveal, Prog Retin Eye
Res 1998, 17:485-521

98
28. Bui BV, Fortune B: Ganglion cell contributions to the rat full-field electroretinogram, J
Physiol 2004, 555:153-173
29. Abraham FA, Haimovitz J, Berezin M: The photopic and scotopic visual thresholds in
diabetics without diabetic retinopathy, Metab Pediatr Syst Ophthalmol 1988, 11:76-77
30. Aylward GW: The scotopic threshold response in diabetic retinopathy, Eye 1989, 3 ( Pt
5):626-637
31. Kohzaki K, Vingrys AJ, Bui BV: Early inner retinal dysfunction in streptozotocin-
induced diabetic rats, Invest Ophthalmol Vis Sci 2008, 49:3595-3604
32. Greco AV, Di Leo MA, Caputo S, Falsini B, Porciatti V, Marietti G, Ghirlanda G: Early
selective neuroretinal disorder in prepubertal type 1 (insulin-dependent) diabetic children
without microvascular abnormalities, Acta Diabetol 1994, 31:98-102
33. L'Esperance FA, Jr.: An opthalmic argon laser photocoagulation system: design,
construction, and laboratory investigations, Trans Am Ophthalmol Soc 1968, 66:827-904
34. Bailey CC, Sparrow JM: Visual symptomatology in patients with sight-threatening
diabetic retinopathy, Diabet Med 2001, 18:883-888
35. Bui BV, Armitage JA, Tolcos M, Cooper ME, Vingrys AJ: ACE inhibition salvages the
visual loss caused by diabetes, Diabetologia 2003, 46:401-408
36. Silva KC, Rosales MA, Biswas SK, Lopes de Faria JB, Lopes de Faria JM: Diabetic
retinal neurodegeneration is associated with mitochondrial oxidative stress and is improved
by an angiotensin receptor blocker in a model combining hypertension and diabetes, Diabetes
2009, 58:1382-1390
37. Curtis TM, Stitt AW, McGahon AJ, Scholfield CN, McGeown G: New developments in
diabetic retinopathy, Expert Review of Opthalmology 2007, 2:947-956
38. Zhang Y, Wang Q, Zhang J, Lei X, Xu GT, Ye W: Protection of exendin-4 analogue in
early experimental diabetic retinopathy, Graefes Arch Clin Exp Ophthalmol 2008,

99
39. Johnsen-Soriano S, Garcia-Pous M, Arnal E, Sancho-Tello M, Garcia-Delpech S,
Miranda M, Bosch-Morell F, Diaz-Llopis M, Navea A, Romero FJ: Early lipoic acid intake
protects retina of diabetic mice, Free Radic Res 2008, 42:613-617
40. Muriach M, Bosch-Morell F, Alexander G, Blomhoff R, Barcia J, Arnal E, Almansa I,
Romero FJ, Miranda M: Lutein effect on retina and hippocampus of diabetic mice, Free
Radic Biol Med 2006, 41:979-984
41. Zakareia FA, Alderees AA, Al Regaiy KA, Alrouq FA: Correlation of
electroretinography b-wave absolute latency, plasma levels of human basic fibroblast growth
factor, vascular endothelial growth factor, soluble fatty acid synthase, and adrenomedullin in
diabetic retinopathy, J Diabetes Complications 2009,
42. Zhang J, Wu Y, Jin Y, Ji F, Sinclair SH, Luo Y, Xu G, Lu L, Dai W, Yanoff M, Li W,
Xu GT: Intravitreal injection of erythropoietin protects both retinal vascular and neuronal
cells in early diabetes, Invest Ophthalmol Vis Sci 2008, 49:732-742
43. Aiello LP, Davis MD, Girach A, Kles KA, Milton RC, Sheetz MJ, Vignati L, Zhi XE:
Effect of ruboxistaurin on visual loss in patients with diabetic retinopathy, Ophthalmology
2006, 113:2221-2230
44. Adamis AP, Altaweel M, Bressler NM, Cunningham ET, Jr., Davis MD, Goldbaum M,
Gonzales C, Guyer DR, Barrett K, Patel M: Changes in retinal neovascularization after
pegaptanib (Macugen) therapy in diabetic individuals, Ophthalmology 2006, 113:23-28
45. Querques G, Bux AV, Martinelli D, Iaculli C, Noci ND: Intravitreal pegaptanib sodium
(Macugen) for diabetic macular oedema, Acta Ophthalmol 2009, 87:623-630
46. The effect of intensive treatment of diabetes on the development and progression of long-
term complications in insulin-dependent diabetes mellitus. The Diabetes Control and
Complications Trial Research Group, N Engl J Med 1993, 329:977-986
47. Tight blood pressure control and risk of macrovascular and microvascular complications
in type 2 diabetes: UKPDS 38. UK Prospective Diabetes Study Group, BMJ 1998, 317:703-
713

100
48. Klein R, Klein BE, Moss SE, Cruickshanks KJ: The Wisconsin Epidemiologic Study of
Diabetic Retinopathy: XVII. The 14-year incidence and progression of diabetic retinopathy
and associated risk factors in type 1 diabetes, Ophthalmology 1998, 105:1801-1815
49. Wong TY, Klein R, Islam FM, Cotch MF, Folsom AR, Klein BE, Sharrett AR, Shea S:
Diabetic retinopathy in a multi-ethnic cohort in the United States, Am J Ophthalmol 2006,
141:446-455
50. Centers for Disease Control and Prevention. National diabetes fact sheet: general
information and national estimates on diabetes in the United States, 2007. Edited by Atlanta,
GA, 2008, p. pp. 1-14
51. Aizu Y, Oyanagi K, Hu J, Nakagawa H: Degeneration of retinal neuronal processes and
pigment epithelium in the early stage of the streptozotocin-diabetic rats, Neuropathology
2002, 22:161-170
52. Park SH, Park JW, Park SJ, Kim KY, Chung JW, Chun MH, Oh SJ: Apoptotic death of
photoreceptors in the streptozotocin-induced diabetic rat retina, Diabetologia 2003, 46:1260-
1268
53. Lieth E, Barber AJ, Xu B, Dice C, Ratz MJ, Tanase D, Strother JM: Glial reactivity and
impaired glutamate metabolism in short-term experimental diabetic retinopathy. Penn State
Retina Research Group, Diabetes 1998, 47:815-820
54. Ozdek S, Lonneville YH, Onol M, Yetkin I, Hasanreisoglu BB: Assessment of nerve
fiber layer in diabetic patients with scanning laser polarimetry, Eye (Lond) 2002, 16:761-765
55. Maass A, von Leithner PL, Luong V, Guo L, Salt TE, Fitzke FW, Cordeiro MF:
Assessment of rat and mouse RGC apoptosis imaging in vivo with different scanning laser
ophthalmoscopes, Curr Eye Res 2007, 32:851-861
56. Cordeiro MF, Guo L, Luong V, Harding G, Wang W, Jones HE, Moss SE, Sillito AM,
Fitzke FW: Real-time imaging of single nerve cell apoptosis in retinal neurodegeneration,
Proc Natl Acad Sci U S A 2004, 101:13352-13356

101
57. Barber AJ: A new view of diabetic retinopathy: a neurodegenerative disease of the eye,
Prog Neuropsychopharmacol Biol Psychiatry 2003, 27:283-290
58. Lieth E, Gardner TW, Barber AJ, Antonetti DA: Retinal neurodegeneration: early
pathology in diabetes, Clin Experiment Ophthalmol 2000, 28:3-8
59. Santiago AR, Hughes JM, Kamphuis W, Schlingemann RO, Ambrosio AF: Diabetes
changes ionotropic glutamate receptor subunit expression level in the human retina, Brain
Res 2008, 1198:153-159
60. Smith SB, Duplantier JN, Dun Y, Mysona B, Roon P, Martin PM, Ganapathy V: In vivo
protection against retinal neurodegeneration by the {sigma}R1 ligand (+)-pentazocine, Invest
Ophthalmol Vis Sci 2008,
61. van Dijk HW, Kok PH, Garvin M, Sonka M, Devries JH, Michels RP, van Velthoven
ME, Schlingemann RO, Verbraak FD, Abramoff MD: Selective loss of inner retinal layer
thickness in type 1 diabetic patients with minimal diabetic retinopathy, Invest Ophthalmol
Vis Sci 2009, 50:3404-3409
62. Barber AJ, Antonetti DA, Kern TS, Reiter CE, Soans RS, Krady JK, Levison SW,
Gardner TW, Bronson SK: The Ins2Akita mouse as a model of early retinal complications in
diabetes, Invest Ophthalmol Vis Sci 2005, 46:2210-2218
63. Barber AJ, Antonetti DA, Gardner TW: Altered expression of retinal occludin and glial
fibrillary acidic protein in experimental diabetes. The Penn State Retina Research Group,
Invest Ophthalmol Vis Sci 2000, 41:3561-3568
64. Mizutani M, Gerhardinger C, Lorenzi M: Muller cell changes in human diabetic
retinopathy, Diabetes 1998, 47:445-449
65. Greenstein V, Sarter B, Hood D, Noble K, Carr R: Hue discrimination and S cone
pathway sensitivity in early diabetic retinopathy, Invest Ophthalmol Vis Sci 1990, 31:1008-
1014

102
66. Kurtenbach A, Wagner U, Neu A, Schiefer U, Ranke MB, Zrenner E: Brightness
matching and colour discrimination in young diabetics without retinopathy, Vision Res 1994,
34:115-122
67. Terasaki H, Hirose H, Miyake Y: S-cone pathway sensitivity in diabetes measured with
threshold versus intensity curves on flashed backgrounds, Invest Ophthalmol Vis Sci 1996,
37:680-684
68. North RV, Farrell U, Banford D, Jones C, Gregory JW, Butler G, Owens DR: Visual
function in young IDDM patients over 8 years of age. A 4-year longitudinal study, Diabetes
Care 1997, 20:1724-1730
69. Hyvarinen L, Laurinen P, Rovamo J: Contrast sensitivity in evaluation of visual
impairment due to diabetes, Acta Ophthalmol (Copenh) 1983, 61:94-101
70. Zetterstrom B, Gjotterberg M: Photocoagulation in diabetic retinopathy with special
reference to its effect on dark adaptation, Acta Ophthalmol (Copenh) 1973, 51:512-519
71. Arden GB, Wolf JE, Tsang Y: Does dark adaptation exacerbate diabetic retinopathy?
Evidence and a linking hypothesis, Vision Res 1998, 38:1723-1729
72. Greenstein VC, Thomas SR, Blaustein H, Koenig K, Carr RE: Effects of early diabetic
retinopathy on rod system sensitivity, Optom Vis Sci 1993, 70:18-23
73. Antonetti DA, Barber AJ, Khin S, Lieth E, Tarbell JM, Gardner TW: Vascular
permeability in experimental diabetes is associated with reduced endothelial occludin
content: vascular endothelial growth factor decreases occludin in retinal endothelial cells.
Penn State Retina Research Group, Diabetes 1998, 47:1953-1959
74. Holopigian K, Greenstein VC, Seiple W, Hood DC, Carr RE: Evidence for photoreceptor
changes in patients with diabetic retinopathy, Invest Ophthalmol Vis Sci 1997, 38:2355-2365
75. Phipps JA, Fletcher EL, Vingrys AJ: Paired-flash identification of rod and cone
dysfunction in the diabetic rat, Invest Ophthalmol Vis Sci 2004, 45:4592-4600

103
76. Hancock HA, Kraft TW: Oscillatory potential analysis and ERGs of normal and diabetic
rats, Invest Ophthalmol Vis Sci 2004, 45:1002-1008
77. Li Q, Zemel E, Miller B, Perlman I: Early retinal damage in experimental diabetes:
electroretinographical and morphological observations, Exp Eye Res 2002, 74:615-625
78. Shinoda K, Rejdak R, Schuettauf F, Blatsios G, Volker M, Tanimoto N, Olcay T, Gekeler
F, Lehaci C, Naskar R, Zagorski Z, Zrenner E: Early electroretinographic features of
streptozotocin-induced diabetic retinopathy, Clin Experiment Ophthalmol 2007, 35:847-854
79. Zhang H, Cuenca N, Ivanova T, Church-Kopish J, Frederick JM, MacLeish PR, Baehr
W: Identification and light-dependent translocation of a cone-specific antigen, cone arrestin,
recognized by monoclonal antibody 7G6, Invest Ophthalmol Vis Sci 2003, 44:2858-2867
80. Kern TS, Barber AJ: Retinal ganglion cells in diabetes, J Physiol 2008, 586:4401-4408
81. Mizutani M, Kern TS, Lorenzi M: Accelerated death of retinal microvascular cells in
human and experimental diabetic retinopathy, J Clin Invest 1996, 97:2883-2890
82. Biallosterski C, van Velthoven ME, Michels RP, Schlingemann RO, DeVries JH,
Verbraak FD: Decreased optical coherence tomography-measured pericentral retinal
thickness in patients with diabetes mellitus type 1 with minimal diabetic retinopathy, Br J
Ophthalmol 2007, 91:1135-1138
83. Chan A, Duker JS, Ko TH, Fujimoto JG, Schuman JS: Normal macular thickness
measurements in healthy eyes using Stratus optical coherence tomography, Arch Ophthalmol
2006, 124:193-198
84. Iseri PK, Altinas O, Tokay T, Yuksel N: Relationship between cognitive impairment and
retinal morphological and visual functional abnormalities in Alzheimer disease, J
Neuroophthalmol 2006, 26:18-24
85. Berisha F, Feke GT, Trempe CL, McMeel JW, Schepens CL: Retinal abnormalities in
early Alzheimer's disease, Invest Ophthalmol Vis Sci 2007, 48:2285-2289
104
86. Arden GB: The absence of diabetic retinopathy in patients with retinitis pigmentosa:
implications for pathophysiology and possible treatment, Br J Ophthalmol 2001, 85:366-370
87. Østerberg G: Topography of the layer of rods and cones in the human retina. Edited by
Copenhagen, Levin & Munksgaard, 1935, p. pp. 102 p., 101 l.
88. Curcio CA, Sloan KR, Kalina RE, Hendrickson AE: Human photoreceptor topography, J
Comp Neurol 1990, 292:497-523
89. Stitt AW, Anderson HR, Gardiner TA, McIntyre I, Archer DB: The combined effects of
diabetes and ionising radiation on the rat retina: an ultrastructural study, Curr Eye Res 1994,
13:79-86
90. Shah SS, Tsang SH, Mahajan VB: Erythropoetin receptor expression in the human
diabetic retina, BMC Res Notes 2009, 2:234
91. Stitt AW, Gardiner TA, Archer DB: Retinal and choroidal responses to panretinal
photocoagulation: an ultrastructural perspective, Graefes Arch Clin Exp Ophthalmol 1995,
233:699-705
92. Hood DC, Birch DG: The A-wave of the human electroretinogram and rod receptor
function, Invest Ophthalmol Vis Sci 1990, 31:2070-2081
93. Phipps JA, Yee P, Fletcher EL, Vingrys AJ: Rod photoreceptor dysfunction in diabetes:
activation, deactivation, and dark adaptation, Invest Ophthalmol Vis Sci 2006, 47:3187-3194
94. Yoshida S, Mears AJ, Friedman JS, Carter T, He S, Oh E, Jing Y, Farjo R, Fleury G,
Barlow C, Hero AO, Swaroop A: Expression profiling of the developing and mature Nrl-/-
mouse retina: identification of retinal disease candidates and transcriptional regulatory targets
of Nrl, Hum Mol Genet 2004, 13:1487-1503
95. Onishi A, Peng GH, Chen S, Blackshaw S: Pias3-dependent SUMOylation controls
mammalian cone photoreceptor differentiation, Nat Neurosci 2010, 13:1059-1065

105
96. Fredriksson R, Hoglund PJ, Gloriam DE, Lagerstrom MC, Schioth HB: Seven
evolutionarily conserved human rhodopsin G protein-coupled receptors lacking close
relatives, FEBS Lett 2003, 554:381-388
97. Hargrave PA, McDowell JH: Rhodopsin and phototransduction: a model system for G
protein-linked receptors, FASEB J 1992, 6:2323-2331
98. Lamb TD, Pugh EN, Jr.: Phototransduction, dark adaptation, and rhodopsin regeneration
the proctor lecture, Invest Ophthalmol Vis Sci 2006, 47:5137-5152
99. Krupnick JG, Gurevich VV, Benovic JL: Mechanism of quenching of phototransduction.
Binding competition between arrestin and transducin for phosphorhodopsin, J Biol Chem
1997, 272:18125-18131
100. Jastrzebska B, Maeda T, Zhu L, Fotiadis D, Filipek S, Engel A, Stenkamp RE,
Palczewski K: Functional characterization of rhodopsin monomers and dimers in detergents,
J Biol Chem 2004, 279:54663-54675
101. Fotiadis D, Liang Y, Filipek S, Saperstein DA, Engel A, Palczewski K: Atomic-
force microscopy: Rhodopsin dimers in native disc membranes, Nature 2003, 421:127-128
102. Jastrzebska B, Fotiadis D, Jang GF, Stenkamp RE, Engel A, Palczewski K:
Functional and structural characterization of rhodopsin oligomers, J Biol Chem 2006,
281:11917-11922
103. Yoshioka M, Kayo T, Ikeda T, Koizumi A: A novel locus, Mody4, distal to
D7Mit189 on chromosome 7 determines early-onset NIDDM in nonobese C57BL/6 (Akita)
mutant mice, Diabetes 1997, 46:887-894
104. Van Dijk HW, Verbraak FD, Kok PH, Garvin MK, Sonka M, Lee K, Devries JH,
Michels RP, van Velthoven ME, Schlingemann RO, Abramoff MD: Decreased Retinal
Ganglion Cell Layer Thickness in Type 1 Diabetic Patients, Invest Ophthalmol Vis Sci 2010,
105. Wolter JR: Diabetic retinopathy, Am J Ophthalmol 1961, 51:1123-1141
106
106. Pennesi ME, Cho JH, Yang Z, Wu SH, Zhang J, Wu SM, Tsai MJ:
BETA2/NeuroD1 null mice: a new model for transcription factor-dependent photoreceptor
degeneration, J Neurosci 2003, 23:453-461
107. Forooghian F, Stetson PF, Meyer SA, Chew EY, Wong WT, Cukras C, Meyerle
CB, Ferris FL, 3rd: Relationship between photoreceptor outer segment length and visual
acuity in diabetic macular edema, Retina 2010, 30:63-70
108. Granit R: The components of the retinal action potential in mammals and their
relation to the discharge in the optic nerve, J of Physiology (London) 1933, 77:207-239
109. Xu X, Karwoski C: Current source density analysis of the electroretinographic d
wave of frog retina, J Neurophysiol 1995, 73:2459-2469
110. Yonemura D, Aoki T, Tsuzuki K: Electroretinogram in diabetic retinopathy, Arch
Ophthalmol 1962, 68:19-24
111. Juen S, Kieselbach GF: Electrophysiological changes in juvenile diabetics without
retinopathy, Arch Ophthalmol 1990, 108:372-375
112. Bresnick GH, Palta M: Oscillatory potential amplitudes. Relation to severity of
diabetic retinopathy, Arch Ophthalmol 1987, 105:929-933
113. Kawasaki K, Yonemura K, Yokogawa Y, Saito N, Kawakita S: Correlation
between ERG oscillatory potential and psychophysical contrast sensitivity in diabetes, Doc
Ophthalmol 1986, 64:209-215
114. Bresnick GH, Palta M: Temporal aspects of the electroretinogram in diabetic
retinopathy, Arch Ophthalmol 1987, 105:660-664
115. Simonsen SE: The value of the oscillatory potential in selecting juvenile diabetics
at risk of developing proliferative retinopathy, Acta Ophthalmol (Copenh) 1980, 58:865-878
116. Simonsen SE: Prognostic value of ERG (oscillatory potential) in juvenile
diabetics, Acta Ophthalmol Suppl 1974, 123:223-224

107
117. Chung NH, Kim SH, Kwak MS: The electroretinogram sensitivity in patients with
diabetes, Korean J Ophthalmol 1993, 7:43-47
118. Wu J, Marmorstein AD, Striessnig J, Peachey NS: Voltage-dependent calcium
channel CaV1.3 subunits regulate the light peak of the electroretinogram, J Neurophysiol
2007, 97:3731-3735
119. Alexander KR, Fishman GA, Peachey NS, Marchese AL, Tso MO: 'On' response
defect in paraneoplastic night blindness with cutaneous malignant melanoma, Invest
Ophthalmol Vis Sci 1992, 33:477-483
120. Saszik SM, Robson JG, Frishman LJ: The scotopic threshold response of the
dark-adapted electroretinogram of the mouse, J Physiol 2002, 543:899-916
121. Graham SL, Vaegan: High correlation between absolute psychophysical threshold
and the scotopic threshold response to the same stimulus, Br J Ophthalmol 1991, 75:603-607
122. Sieving PA, Frishman LJ, Steinberg RH: Scotopic threshold response of proximal
retina in cat, J Neurophysiol 1986, 56:1049-1061
123. Hegmann JP, Kieso RA, Hartman HB: Gene differences influencing visual system
function and behavior, Behav Genet 1974, 4:165-170
124. Seeliger MW, Grimm C, Stahlberg F, Friedburg C, Jaissle G, Zrenner E, Guo H,
Reme CE, Humphries P, Hofmann F, Biel M, Fariss RN, Redmond TM, Wenzel A: New
views on RPE65 deficiency: the rod system is the source of vision in a mouse model of Leber
congenital amaurosis, Nat Genet 2001, 29:70-74
125. Lei B, Yao G, Zhang K, Hofeldt KJ, Chang B: Study of rod- and cone-driven
oscillatory potentials in mice, Invest Ophthalmol Vis Sci 2006, 47:2732-2738
126. Liu W, Deng Y: The analysis of electroretinography of diabetes mellitus, Yan Ke
Xue Bao 2001, 17:173-175, 179

108
127. Kim MK, Mocko JA, Olson DE, Thule PM, Pardue MT, Barnes CS:
Electroretinogram changes with scotopic stimuli in retinas of diabetic subjects with and
without retinopathy. Edited by Ft. Lauderdale, FL, 2010, p.
128. Kaneko M: [Scotopic threshold response in noninsulin-dependent diabetes
mellitus patients with good HbA1c level and ophthalmoscopically intact fundus], Nippon
Ganka Gakkai Zasshi 2001, 105:463-469
129. Ames A, 3rd, Li YY, Heher EC, Kimble CR: Energy metabolism of rabbit retina
as related to function: high cost of Na+ transport, J Neurosci 1992, 12:840-853
130. Ames A, 3rd, Li YY: Energy requirements of glutamatergic pathways in rabbit
retina, J Neurosci 1992, 12:4234-4242
131. McColm JR, Geisen P, Hartnett ME: VEGF isoforms and their expression after a
single episode of hypoxia or repeated fluctuations between hyperoxia and hypoxia: relevance
to clinical ROP, Mol Vis 2004, 10:512-520

VITA
William F. Robinson, Jr. Education 2010 Ph.D. candidate in Anatomy
Pennsylvania State University, College of Medicine, Hershey, PA 2001 Doctor of Physical Therapy; graduation 2000, DPT awarded 2001
Belmont University, Nashville, TN Thesis: The Effects of Cryotherapy on Balance Strategy Selection
1992 Bachelor of Science in Biology; cum laude
Belmont University, Nashville, TN Awards and Honors 1. Student-Fellow Research Award from Penn State Hershey Eye Center Vision Research
Day; ($500 prize), June 2010. 2. Sigma-Aldrich 2009 Histotechnology Stain Contest Winner; 1st Place ($200 prize),
October 2009. http://www.sigmaaldrich.com/life-science/cell-biology/hematology-and-histology/learning-center/2009-stain-winners.html
3. Recipient of Life Care Scholarship, Belmont University Physical Therapy Program,
1999. 4. Graduated Cum Laude, Belmont University, 1992. 5. Recipient of Schering-Plough Scholarship, Belmont University, 1991. Publications in Preparation 1. Robinson, W.F., Mohr, S., Barber, A.J. (2010) Peripheral rod photoreceptors are
depleted in postmortem human retinas after a short duration of diabetes. In preparation.
2. Stevenson, J., Lam, J., Robinson, W.F., Hauck, R. (2010) Capitate morphology: radiographic evaluation with routine wrist films. In preparation.
3. Barber, A.J., Robinson, W.F., Jackson, G.R. (2010) Neurodegeneration in Diabetic
Retinopathy. In: Visual Dysfunction in Diabetes: The Science of Patient Impairment and Improvement. Humana Press. In press.