hispanic(market(weighs(in(on(201362016(new,(used(car(sales...
TRANSCRIPT
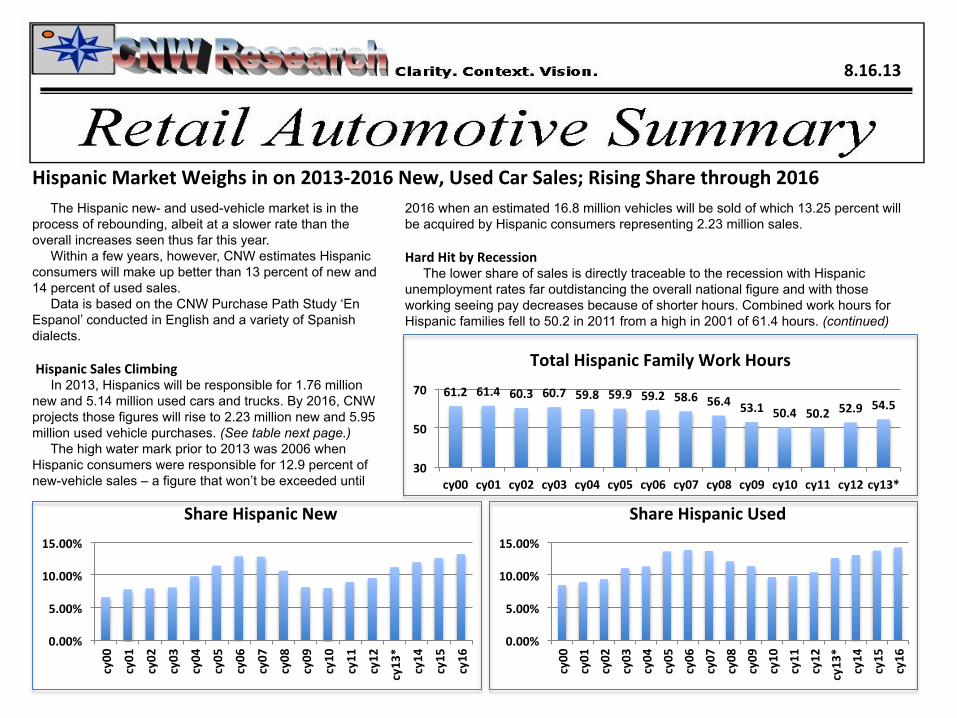
Hispanic Market Weighs in on 2013-‐2016 New, Used Car Sales; Rising Share through 2016 2016 when an estimated 16.8 million vehicles will be sold of which 13.25 percent will be acquired by Hispanic consumers representing 2.23 million sales. Hard Hit by Recession The lower share of sales is directly traceable to the recession with Hispanic unemployment rates far outdistancing the overall national figure and with those working seeing pay decreases because of shorter hours. Combined work hours for Hispanic families fell to 50.2 in 2011 from a high in 2001 of 61.4 hours. (continued)
8.16.13
The Hispanic new- and used-vehicle market is in the process of rebounding, albeit at a slower rate than the overall increases seen thus far this year. Within a few years, however, CNW estimates Hispanic consumers will make up better than 13 percent of new and 14 percent of used sales. Data is based on the CNW Purchase Path Study ‘En Espanol’ conducted in English and a variety of Spanish dialects. Hispanic Sales Climbing In 2013, Hispanics will be responsible for 1.76 million new and 5.14 million used cars and trucks. By 2016, CNW projects those figures will rise to 2.23 million new and 5.95 million used vehicle purchases. (See table next page.) The high water mark prior to 2013 was 2006 when Hispanic consumers were responsible for 12.9 percent of new-vehicle sales – a figure that won’t be exceeded until
vs. last month
Jitters Index!
0.15% Same increase as Last Month
0.00%
5.00%
10.00%
15.00%
cy00
cy01
cy02
cy03
cy04
cy05
cy06
cy07
cy08
cy09
cy10
cy11
cy12
cy13*
cy14
cy15
cy16
Share Hispanic New
0.00%
5.00%
10.00%
15.00% cy00
cy01
cy02
cy03
cy04
cy05
cy06
cy07
cy08
cy09
cy10
cy11
cy12
cy13*
cy14
cy15
cy16
Share Hispanic Used
61.2 61.4 60.3 60.7 59.8 59.9 59.2 58.6 56.4 53.1 50.4 50.2 52.9 54.5
30
50
70
cy00 cy01 cy02 cy03 cy04 cy05 cy06 cy07 cy08 cy09 cy10 cy11 cy12 cy13*
Total Hispanic Family Work Hours

Page 2… CNW Research: Retail AutomoVve Summary
(continued from previous page) That, along with other influences, have resulted in shifts in attitudes and buying habits among Hispanic vehicle shoppers. Number of Choices Considered In the Purchase Path studies, CNW breaks down the buying “funnel” into segments described variably as “stages” or “months,” the latter being easier to comprehend but not quite as precise. During the shopping process, and for this report we’ll use “months,” roughly six months from acquisition, Hispanic shoppers in 2013 through August had an average of 5.1 models on their active shopping list. In comparison, in 2000, Hispanic shoppers had only 4.3 models under consideration. Two weeks prior to acquisition, that shopping list had been pared down to 1.5 models. A dozen years ago, it was only 1.1 models. The “take away” from this data is simple: Hispanic shoppers are becoming more open to alternative brands and less brand loyal than they were in 2000. Loyalty to Brand When looking at the vehicle brands that replace a currently owned model, it is clear that loyalty to a manufacturer is diminishing.
(continued next page)
Ttl Veh Sls Hispanic Sls Shr Hispanic Used Sls Hispanic Sls Shr Hispanic cy00 17,396,327 1,151,637 6.62% 41,620,429 3,525,250 8.47% cy01 17,179,052 1,345,120 7.83% 42,623,717 3,802,036 8.92% cy02 16,870,940 1,344,614 7.97% 43,025,087 4,027,148 9.36% cy03 16,663,586 1,353,083 8.12% 43,571,652 4,823,382 11.07% cy04 16,835,879 1,653,283 9.82% 42,706,103 4,842,872 11.34% cy05 16,990,500 1,945,412 11.45% 44,138,263 6,020,459 13.64% cy06 16,549,468 2,134,881 12.90% 42,565,544 5,912,354 13.89% cy07 16,223,266 2,083,067 12.84% 41,569,561 5,703,344 13.72% cy08 13,339,771 1,423,354 10.67% 36,530,404 4,431,138 12.13% cy09 10,436,856 851,647 8.16% 35,491,762 4,038,963 11.38% cy10 11,583,829 929,023 8.02% 36,883,987 3,585,124 9.72% cy11 12,770,750 1,145,536 8.97% 38,792,167 3,824,908 9.86% cy12 14,488,469 1,386,546 9.57% 40,525,869 4,226,848 10.43% cy13* 15,650,000 1,757,495 11.23% 40,650,000 5,138,160 12.64% cy14 16,100,000 1,932,000 12.00% 40,900,000 5,357,900 13.10% cy15 16,500,000 2,079,000 12.60% 41,250,000 5,671,875 13.75% cy16 16,800,000 2,226,000 13.25% 41,750,000 5,949,375 14.25%
6 mo 5 mo 4 mo 3 mo 2 mo 1 mo 2 wks cy00 4.3 4.5 3 3.6 1.9 1.2 1.1 cy02 4.7 4.9 3.1 4.1 2.2 1.2 1.1 cy04 4.8 4.7 3.9 4.5 2.7 1.5 1.3 cy06 5.2 4.8 4.1 4.6 2.8 1.9 1.5 cy08 5.6 4.9 4.4 4.8 3.1 2.2 1.5 cy10 4.7 4.2 4.1 4.2 2.6 1.8 1.2 cy12 4.8 4.2 4.3 4.4 2.9 1.9 1.3 cy13 5.1 4.6 4.5 4.3 3.4 2.3 1.5
Number of Vehicles on AcVve Shopping List

Page 3… CNW Research: Retail AutomoVve Summary
and General Motors and Chrysler in particular. There was virtually no movement to GM or Chrysler from other brands so those who had Toyota, Ford, Honda, etc. elected to stick with them assuming they were stable automakers. Second, in the midst of the recession, fewer people were willing to chance making a change in any buying habits when it came to brands. If they owned a Kenmore washer, they felt a bit at ease buying another one rather than taking a “flyer” on a brand they weren’t familiar with. Inside Baseball Footnote Since CNW began its Hispanic Purchase Path surveys some 20 years ago, it has always encouraged the interviewees to speak Spanish, English or a combination. In the 1990s, nearly a third of respondents preferred Spanish only with a quarter preferring English only and the rest a combination of the two. But that’s changed, in some cases dramatically and contrary to what one might think. True, the number who prefer “English Only” has fallen from 46 percent in 2008 to 34 percent in 2013, it is also interesting to note that a combination of English and Spanish has grown from 31 percent to 43 percent. Spanish only? Remained about the same over the past five years in the 24 percent range.
50.0%
55.0%
60.0%
65.0%
70.0%
cy00 cy02 cy04 cy06 cy08 cy10 cy12 cy13*
Hispanic Brand Loyalty
0.0%
10.0%
20.0%
30.0%
40.0%
cy00 cy02 cy04 cy06 cy08 cy10 cy12 cy13*
Non-‐Hispanic Brand Loyalty
(continued from previous page) This is true for both Hispanic and non-Hispanic buyers. In 2000, better than 64 percent of Hispanic vehicle buyers replaced a car or truck with a vehicle from the same manufacturer. That’s dropped to 55.8 percent in the first seven months of this year. Among Non-Hispanic buyers, loyalty has been weak for decades – at least since the boom lease years of the mid 1990s. In 2000, it stood at only 26.7 percent, peaking at 35.5 percent in the midst of the recession and returning to its downward trend for the past few years. Loyalty among non-Hispanic buyers is at 31.8 percent this year. The recession actually boosted loyalty for a number of reasons. Those who owned a vehicle purchased new stuck with the brand because of a concern about the health of the auto industry in general
0%
10%
20%
30%
40%
50%
cy08 cy09 cy10 cy12 cy13
Spanish-‐English Purchase Path Survey
Spanish only
English only
English-‐Spanish
Next Month: Hispanic Market’s Sources of Info

Closing RaVo v Last Month
Sub-‐Prime Approv. v Last Yr.
5.89%
Page 4… CNW Research: Retail AutomoVve Summary
4.19%
August Deliveries Rolling Toward +8% After a staggeringly good final 10 days of July that sent new-car sales to a 15.7 million SAAR, many automakers are looking for a repeat in August. And they may get it. Through the first 15 days of the month, sales are on track to rise at least 8 percent. Same store deliveries are up nearly 6 percent while new floor traffic is ahead of last year by a whopping 24.7 percent. Many of the early month shopping crowd are likely to be back before September rolls around. Showroom visitors usually buy within a month of in-store shopping.
-‐10.20%
We’re already seeing closing ratios swelling significantly, up more than four percent vs. July even though sub-prime has taken a hit when compared to both last month and the same month a year ago. Discounts Rise When including dealer spiffs, spins and special financing including subsidized leasing, incentives are up 39 percent vs. a year ago on the manufacturer side, down 28 percent on the dealer side. (See back page.) Total discounts are up 9.6 percent.
0.28%
Sub-‐Prime Approval v Last Month
-‐2.2%
New Floor Traffic
24.7%
Same Store Sales
On the subject of leasing, if the heat continues, expect a 30 percent share of sales by the end of the year.
Used Days Supply
-‐3.14%
NEW Pent Up Dmnd Pent Up Dmnd 13 v 12 Avg. Delay Avg. Delay Mo. '13 Mo. '12 Change Mo. '13 Mo. '12 % Change SVll Plan Acq Jan '13 94,250 106,300 88.7% 3.52 3.92 -‐10.2% 95.37% Feb 118,250 109,500 108.0% 3.97 3.87 2.6% 94.62% Mar 101,800 97,500 104.4% 3.74 3.59 4.2% 94.28% Q1 13 314,300 313,300 100.3% 3.74 3.79 -‐1.3% 94.8% Apr 106,500 101,000 105.4% 3.52 3.44 2.3% 94.07% May 101,700 97,500 104.3% 3.11 3.27 -‐4.9% 94.16% June 105,250 98,250 107.1% 3.06 3.19 -‐4.1% 94.86% Q2 13 313,450 296,750 105.6% 3.23 3.30 -‐2.1% 94.4% July 103,500 90,400 114.5% 3.09 3.24 -‐4.6% 95.01% Aug 105,750 96,700 109.4% 3.01 3.22 -‐6.5% 95.27%

Page 5… CNW Research: Retail AutomoVve Summary
JITTERS Fed Gas Child’s Job Day to Day CondiVon of Food Local Jigers
INDEX Taxes Prices Edu Stability Needs Investments Prices Taxes Index
Vs. Prev Mo. 0.20% 0.81% 0.41% -1.00% 0.93% -0.47% 0.10% 0.10% 0.15%
Vs. Mo. ‘12 1.84% 10.98% 1.26% -13.79% -1.68% -12.09% 4.73% 0.30% -0.91%
Jitters and Economic Control
What’s driving consumer confidence? It seems to be up one day and down the next. Have consumers become just so fragile that any news – good or bad – will seriously impact their day-to-day attitude toward the country’s economic well-being? In a recent Gallup poll, 63 percent of Americans said they are unhappy with the economic direction of the country. On the other hand, purchases of big ticket items such as cars and home improvement goods / services have rebounded dramatically. What gives? Who Controls Economic DesVny Every five years, CNW conducts a survey asking about economic future and who controls it. Adults of working age are included. In 1998, better than 72 percent of American adults said they control their own economic future while 19.8 percent said they personally did not. The remaining 7.9 percent felt they sometimes had control and sometimes didn’t have control. As the graph at the right shows, though, before the recession hit, the share of consumers who felt their economic destiny was in their own hands fell to 64 percent and sunk to barely 43 percent in 2008. Simultaneously, those who felt their economic well being was in someone else’s hands rose from 32 percent in 2003 to 46 percent in 2008 and nearly half of the respondents in 2013. If Not Me, Then Who? The results of the first part of the survey begs the question, for those who do not feel in control of their economic future, who DOES control it? The staggering growth in reliance on government as the source of financial well being is clear. In 1998, about 16 percent of respondents said the government was in control of their economic future. By 2008, it has grown to 40 percent and in the latest survey rose to 44.5 percent. Faceless Big Corporations come in for a hit in all of the survey years although there has been a slight easing of reliance or blame (depending on the survey respondent) aimed at these business entities.
0%
20%
40%
60%
80%
100%
cy1998 cy2003 cy2008 cy2013
Are you in control of your economic future?
SomeVmes
No
Yes
Gov't Big Corps. Employer Wall Street Don't Know cy1998 16.2% 31.4% 40.7% 6.6% 5.1% cy2003 21.6% 31.7% 38.6% 5.2% 2.9% cy2008 39.8% 29.4% 20.6% 7.6% 2.6% cy2013 44.5% 28.5% 22.3% 2.9% 1.8%
CONTEXT: Let’s be clear. This is only a scratch on the surface of the entire study. But the clear indication is this: Of those who do not feel in control of their economic destiny BLAME government-corporations-employers-wall street for their inability to set their own economic roadway. Even though some portions of their home-centric Jitters have improved enough to make a big-ticket purchase acceptable, average consumers remain profoundly dissatisfied with their inability to generate their own economic future. In effect, consumers who once were optimistically thick skinned have become attitudinally thin skinned. Good news produces upbeat confidence. Bad news deflates the balloon quickly.

Anticipated Aug Actual Aug % Chng YTD YTD % Chng Document 106m cy13 cy12 13v12 cy2013 cy2012 13v12
Franchised Sales 1,526,065 1,480,008 3.1% 10,578,959 10,227,180 3.4%
Independent Sales 1,374,136 1,329,968 3.3% 9,542,087 9,307,762 2.5%
Casual Sales 1,087,426 1,057,915 2.8% 8,595,273 8,321,424 3.3%
Total Sales 3,987,627 3,867,891 3.1% 28,716,319 27,856,366 3.1%
Page 6… CNW Research: Retail AutomoVve Summary
August Sees Slight Rise in Used Sales August will be a solid month for used-car sales, rising at least 3 percent vs. year ago, based on the first 15 days of the month. For the first time this year, all channels appear in lockstep in terms of the year-over-year gains and pretty much match the full-year to date increases vs. 2012 through August. Franchised Dealers With an influx of trade ins and quick turnaround on the lot, franchised dealers should easily top 1.5 million sales in August bringing the yearly total to nearly 10.6 million. Independents will be up about 3.3 percent to 1.37 million sales while private party should rise 2.8 percent to 1.1 million.
year decline of 2013. AcquisiVon Plans Of those who have postponed a used-car or truck acquisition, 94.7 percent of them say they still plan to make that purchase sometime in the coming six months. Reasons for the postponement? Top of the list, the current car or truck still has life in its old bones and the owner wants to accumulate a bit more money to make an acquisition of a newer or slightly more upscale model. As an aside: Men are postponing at a higher rate than women. About 59 percent of all those who have put off a used purchase are male with 41 percent female. Men represent about 52 percent of all used-vehicle acquisitions.
USED Pent Up Dmnd Pent Up Dmnd 12 v 11 Avg. Delay Avg. Delay Mo. '13 Mo. '12 Change Mo. '13 Mo. '12 % Change SVll Plan Acq Jan '13 107,000 94,000 113.8% 2.67 2.41 10.8% 94.26% Feb 105,200 83,500 126.0% 2.31 2.37 -‐2.5% 94.83% Mar 101,500 83,000 122.3% 2.29 2.41 -‐5.0% 94.18% Q1 13 313,700 260,500 120.4% 2.42 2.40 1.1% 94.42% Apr 104,750 84,750 123.6% 2.21 2.53 -‐12.6% 93.58% May 80,800 76,200 106.0% 2.28 2.43 -‐6.2% 93.81% June 75,500 79,400 95.1% 2.19 2.57 -‐14.8% 94.06% Q2 13 261,050 240,350 108.6% 2.23 2.51 -‐11.3% 93.82% July 92,750 80,500 115.2% 2.22 2.79 -‐20.4% 94.25% August 96,000 84,700 113.3% 2.19 2.93 -‐25.3% 94.68%
Pent Up Demand Rises Preliminary data suggest that 96,000 potential used-car buyers are waiting in the wings ready to make an acquisition sometime later this year. And that’s just the August figure which is up more than 13 percent compared to last year. Most heartening for used-car sellers is that the average delay in making the leap is down to 2.19 months from last year’s 2.9 months. That’s a 25 percent decrease and the largest year over

Page 7… CNW Research: Retail AutomoVve Summary
Franchised Independent Franchised Franchised Independent Independent Document 107m Asking Price Asking Price Trans Price % of Asking Trans Price % of Asking Jan. '13 $11,336 $9,867 $10,558 93.14% $9,158 92.81% Feb '13 $11,321 $9,892 $10,562 93.21% $9,174 92.74% Mar '13 $11,806 $10,276 $11,112 94.12% $9,640 93.81% Apr '13 $11,716 $10,143 $11,042 94.25% $9,529 93.95% May '13 $11,682 $10,127 $11,020 94.33% $9,444 93.26% June '13 $11,597 $10,106 $10,981 94.69% $9,507 94.07% July ’13 $11,563 $10,101 $11,010 95.22% $9,527 94.32% Aug ‘13 $11,592 $10,227 $11,058 95.39% $9,687 94.72% Aug '12 $12,103 $9,849 $11,138 92.02% $8,936 90.73% Sept '12 $11,458 $10,172 $11,021 96.19% $9,598 94.36% Oct '12 $11,419 $9,872 $10,553 92.42% $9,019 91.36% Nov. 12 $11,583 $9,991 $10,894 94.05% $9,334 93.42% Dec. '12 $11,186 $10,148 $10,654 95.24% $9,452 93.14% Percent Change Yr over Yr -‐4.22% 3.84% -‐0.73% 3.65% 8.40% 4.40% Month Over Month Price 0.25% 1.25% 0.43% 0.18% 1.68% 0.42%
Used Retail Prices Slip Again; Supply Down The supply of used vehicles may be improving and dealers are turning over inventory at a quicker rate, but prices continue to be below a year ago. The August projection (based on the first 15 days of the month) shows Franchised Dealer used-car retail asking prices down 4.2 percent compared to the same month of 2012. Transaction prices are dipped 0.7 percent. Independents fared better with asking prices up 3.8 percent and transaction prices higher by 8.4 percent on the back of better inventory and fresher (newer) models. On a month-over-month basis, franchised dealers were up about a quarter percent in asking prices and 0.4 percent in transaction prices while Indies were up 1.25 percent in asking prices and 1.7 percent in actual transaction prices. Note: Transaction prices do not include taxes or aftermarket upgrades or addition.
40!42!44!46!48!50!52!
Used Vehicle Days' Supply!
August EsVmate: 45.82

(Editor’s Note: Jean Halliday’s Ad Rap will return next month.
Page 8… CNW Research: Retail AutomoVve Summary
Honda Ad “Curiosity” Scored a 9.7 out of 10
Two Ads That Sent the Focus Groups Wild
Rarely does a focus group give an ad almost perfect scores, but in two recent instances that’s exactly what happened. Honda Curiosity A pair of hands in a white lab coat and a voice over asking “Where can curiosity take you?” From there, the hands turn a simple bolt into everything from a robotic lawn mower to a business jet to a motorcycle to a variety of Honda car models. Aside from extraordinary editing, the ad is both arresting visually, entertaining and a great corporate image builder.
Russian ice skaters dance with two Mitsubishi suvs. Score: 9.9.
Russian Skaters No computer-generated graphics or images here, which makes the Russian language commercial for Mitsubishi all the more enticing. Two ice skaters, one dressed in black the other in white. Two SUVs, one black, one white. The sport utilities mimic the ice-dancer’s moves, interacting with each other and performing close-order drills that are fascinating to watch. Backed up with a haunting music score, the ad draws the viewer in and successfully provides a bit of entertainment as well as showing the capabilities of the all-wheel-drive vehicles. High Scores The focus groups actually clapped loudly after the ice skater video was shown and it had to be replayed two more times at the participants’ request. How often does that happen with your spots? Watch Full Screen So good are these two commercials that to watch them on anything other than full screen does a disservice to both.

CNW Research: Retail AutomoVve Summary
Back Page *Deliveries not sales Aug 1-15 Aug 1-15 % Chng Actual Sales Aug '13 Full Mo
Based on First 15 Days of June cy2013 cy2012 13 v 12 Aug '12 Sales Change New Cars Extension Detroit 3 127,624 125,182 2.0% 199,899 203,799 2.0% Asian 142,371 123,748 15.0% 379,705 436,847 15.0% European 30,111 25,416 18.5% 84,763 100,421 18.5% Ttl Pass. Cars 300,106 274,346 9.4% 664,367 741,067 11.5% New Trucks Detroit 3 163,768 159,681 2.6% 381,692 391,461 2.6% Asian 35,052 32,178 8.9% 206,522 224,968 8.9% European 3,776 3,545 6.5% 32,210 34,309 6.5% Ttl Lt. Trucks 202,596 195,404 3.7% 620,424 650,738 4.9% Ttl Industry 502,702 469,750 7.0% 1,284,791 1,391,805 8.3% August 1-15 Full August % Chng Prev Mo Prev Mo % Chng cy2013 cy2012 13 v 12 cy2013 cy2012 13 v 12 Lease Share 28.8% 27.8% 3.6% 28.4% 27.2% 4.4% Floor Traffic - New 95.07 76.25 24.7% 98.71 91.98 7.3% Floor Traffic - Used 97.42 86.22 13.0% 97.32 85.04 14.4% August 1-15 Prev Yr % Chng % Chng Pent Up Demand Units cy2013 cy2012 Same Mo '12 Prev Mo August est. '13 103,500 Avg. New MSRP $38,287 $37,156 3.04% 0.16% August est. '12 90,400 Total Discounts $5,621 $4,975 12.98% 1.26% % Change 14.5% Manufacturer Incentives $4,237 $3,034 39.65% 1.71% Dealer Incentives $1,384 $1,941 -28.70% -0.08% Purchase Delay Months Core Transaction Price**** $32,666 $32,181 1.51% -0.03% August est. '13 3.09 % Mfg Incentive of MSRP 11.07% 8.17% 35.5% August est. '12 3.24 % Ttl Discounts of MSRP 14.68% 13.39% 9.6% % Change -4.6%