hispanic realities in north america implications for uba daniel r. sánchez
TRANSCRIPT

HISPANIC REALITIESHISPANIC REALITIES
ININ
NORTH AMERICANORTH AMERICA
Implications for UBAImplications for UBA
Daniel R. Daniel R. SánchezSánchez
REALITY # 1REALITY # 1
The growth of the The growth of the Hispanic American Hispanic American
population has exceeded population has exceeded even the boldest even the boldest
projections of projections of demographic expertsdemographic experts
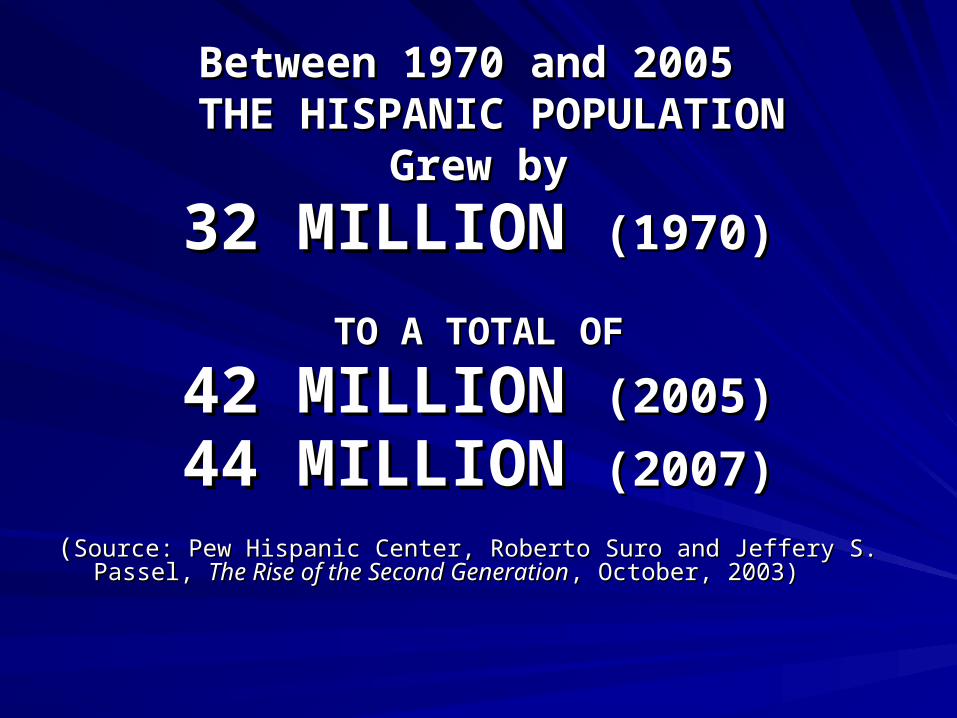
Between 1970 and 2005 Between 1970 and 2005 THE HISPANIC POPULATIONTHE HISPANIC POPULATION
Grew byGrew by
32 MILLION 32 MILLION (1970)(1970)
TO A TOTAL OFTO A TOTAL OF
42 MILLION 42 MILLION (2005)(2005)
44 MILLION 44 MILLION (2007)(2007)
((Source: Pew Hispanic Center, Roberto Suro and Jeffery S. Passel, Source: Pew Hispanic Center, Roberto Suro and Jeffery S. Passel, The Rise The Rise of the Second Generationof the Second Generation, October, 2003), October, 2003)

CONTRIBUTING FACTORSCONTRIBUTING FACTORSIMMIGRATIONIMMIGRATION
Source: Current Population Survey, March 2000
0
10
20
30
40
50
Black
American Indian, Eskimo, and Aluet
Asian and Pacific Islander
Hispanic Origin
Non-Hispanic White
4 of every 10 4 of every 10 immigrants each immigrants each year are year are HispanicHispanic
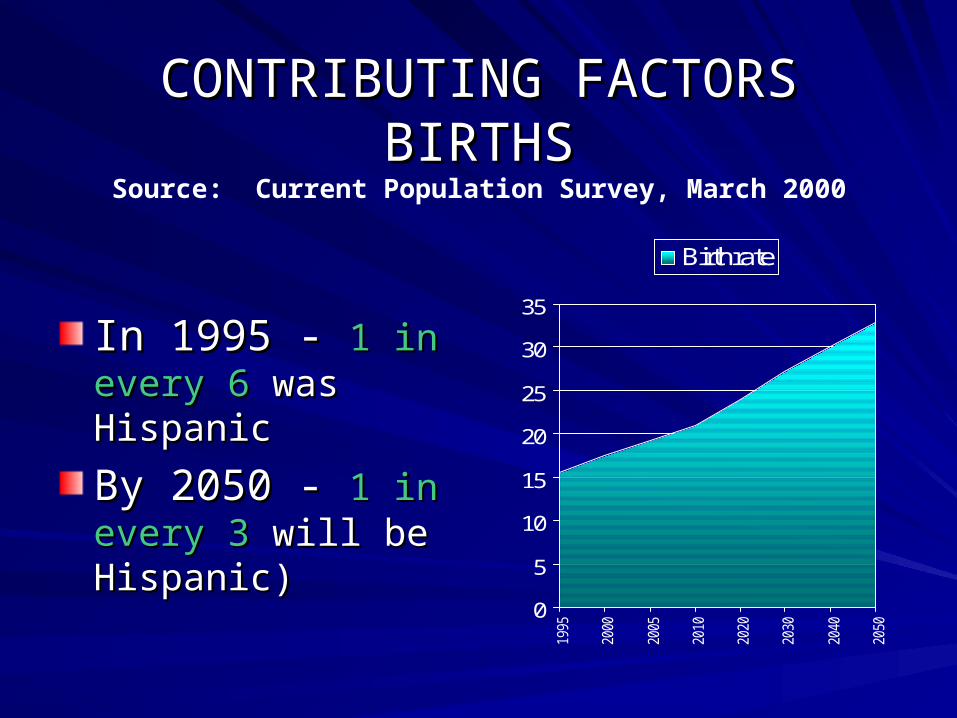
CONTRIBUTING FACTORSCONTRIBUTING FACTORSBIRTHSBIRTHS
Source: Current Population Survey, March 2000
In 1995 - In 1995 - 1 in 1 in every 6every 6 was was HispanicHispanic
By 2050 - By 2050 - 1 in 1 in every 3every 3 will be will be Hispanic)Hispanic)
0
5
10
15
20
25
30
35
1995
2000
2005
2010
2020
2030
2040
2050
Birthrate
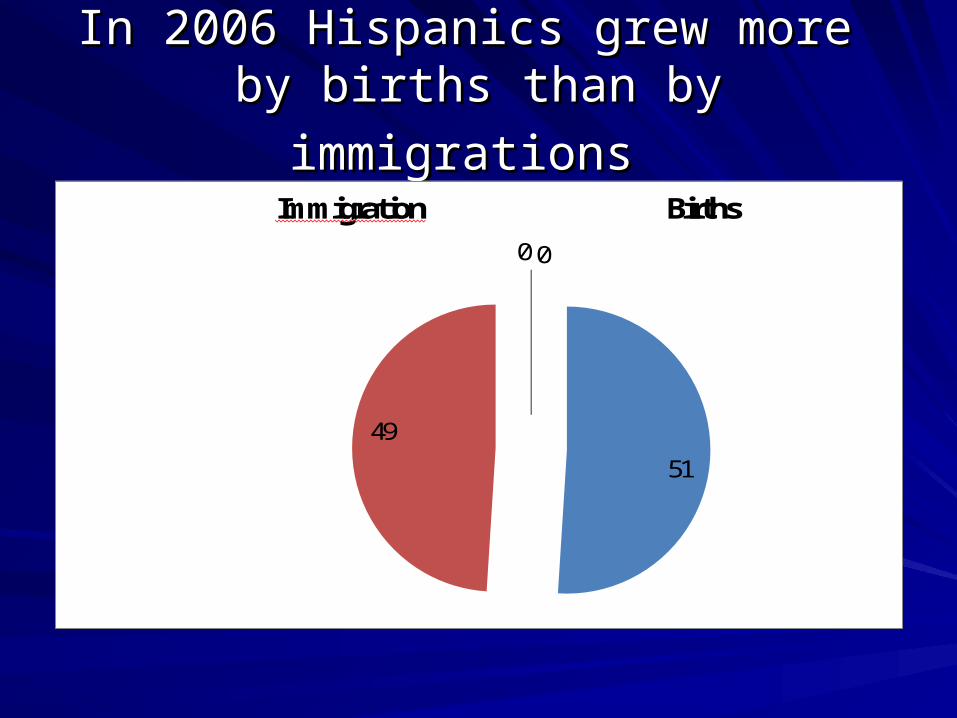
In 2006 Hispanics grew more In 2006 Hispanics grew more
by births than by immigrationsby births than by immigrations
51
49
0 0
Immigration Births
77
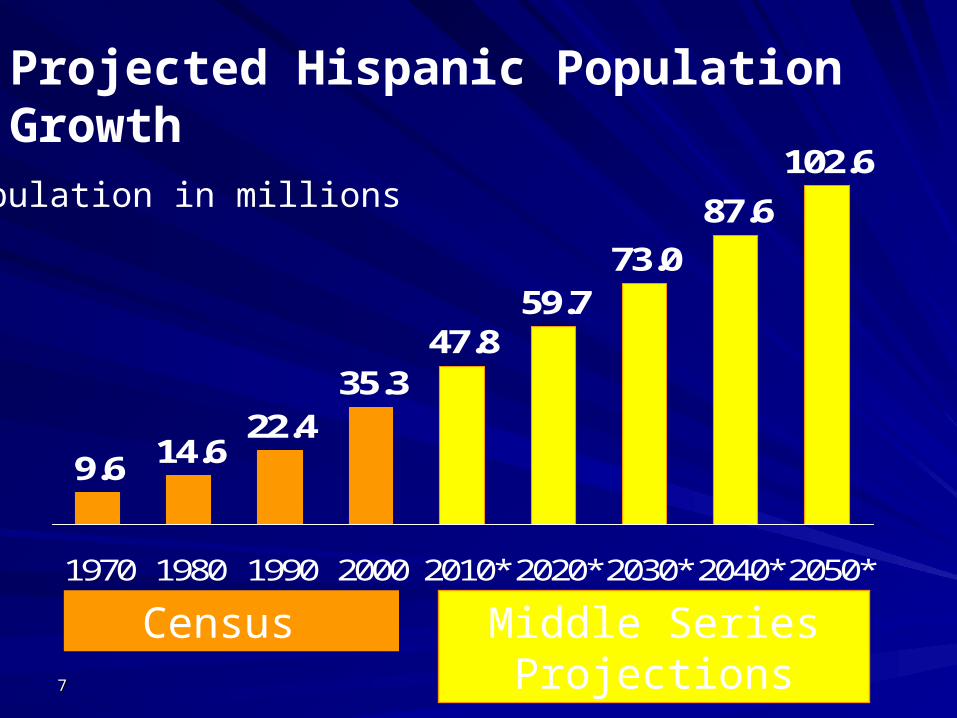
14.622.4
35.347.8
59.773.0
87.6
102.6
9.6
1970 1980 1990 2000 2010* 2020* 2030* 2040* 2050*
Population in millions
Projected Hispanic Population Growth
Middle Series Projections
Census
HISPANIC GROWTHHISPANIC GROWTH
Hispanic Americans are now the Hispanic Americans are now the largest minority group in America largest minority group in America [i] Have accounted for half of US Have accounted for half of US population growth since 2000 population growth since 2000 [ii]
[i] Dallas Morning News, “Report: Hispanic Population Surging,” Dallas Morning News, “Report: Hispanic Population Surging,” June, 9, 2005, 13A.June, 9, 2005, 13A.[ii] D’vera Cohn, “Hispanic population keeps gaining numbers,” Star [ii] D’vera Cohn, “Hispanic population keeps gaining numbers,” Star Telegram, June 9, 2005, 5A.Telegram, June 9, 2005, 5A.

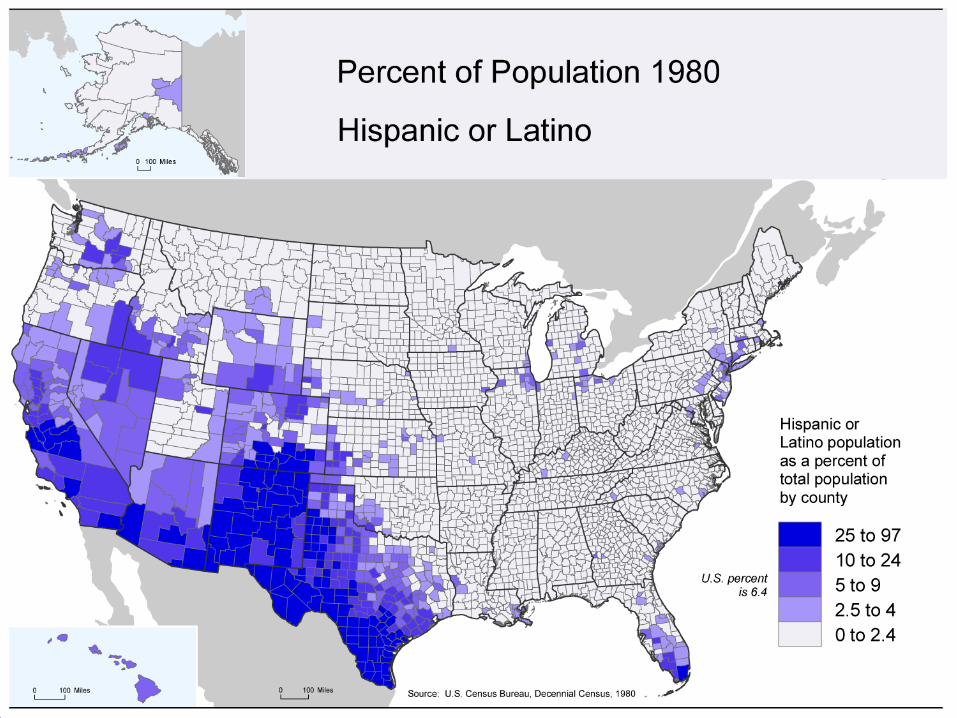
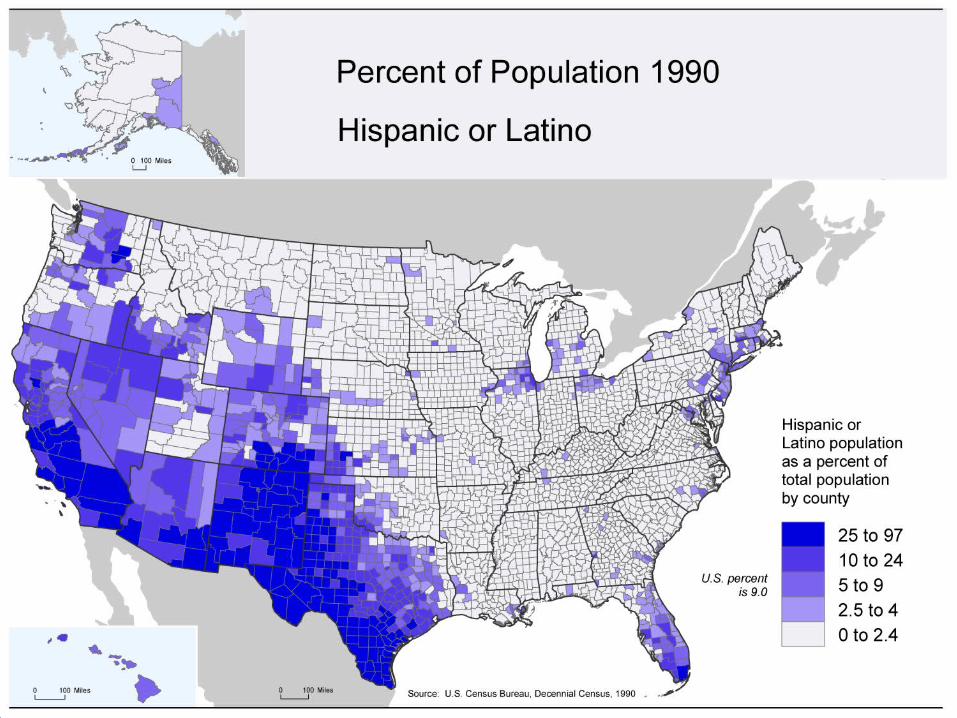
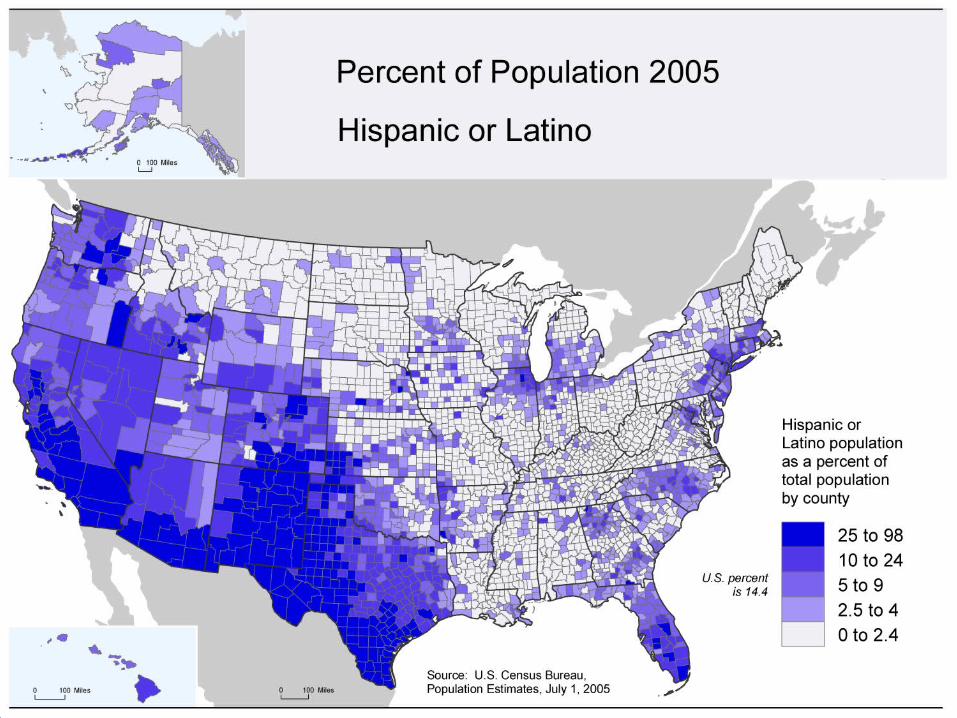
REALITY # 2REALITY # 2
Hispanics have spread Hispanics have spread
throughout the country throughout the country faster than any faster than any
previous immigrant previous immigrant groupgroup
1010
1111

1212
1313
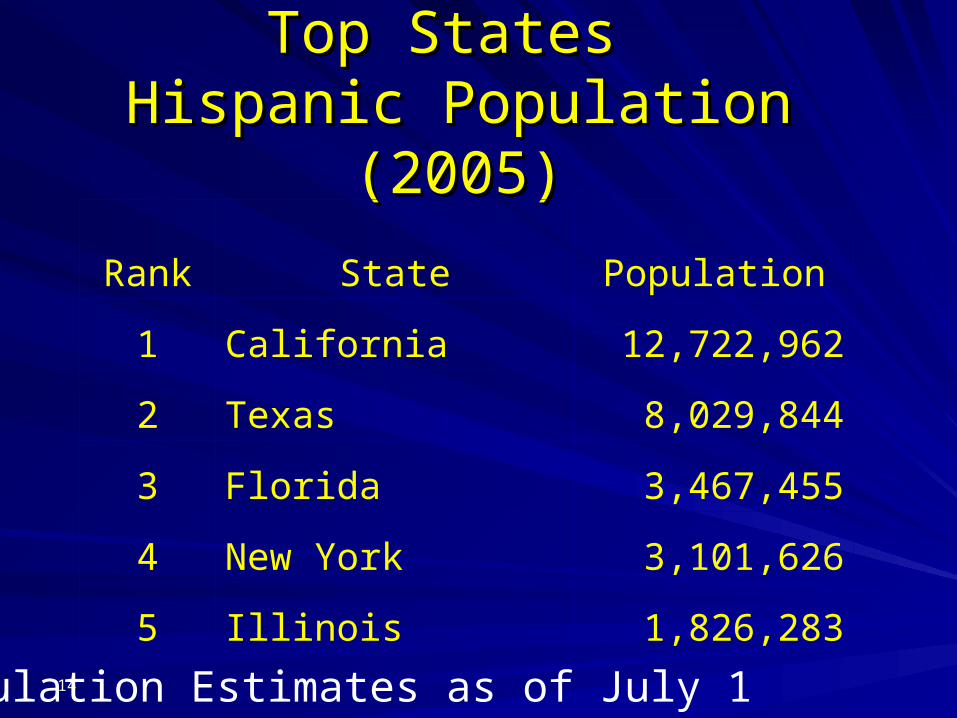
Top States Top States Hispanic Population (2005)Hispanic Population (2005)
1414
Rank State Population
1 California 12,722,962
2 Texas 8,029,844
3 Florida 3,467,455
4 New York 3,101,626
5 Illinois 1,826,283
*Population Estimates as of July 1

Top Counties Top Counties Hispanic Population (2005)Hispanic Population (2005)
1515
Rank County Population
1 Los Angeles County, CA 4,653,666
2 Harris County, TX 1,480,000
3 Miami-Dade County, FL 1,480,000
4 Cook County, IL 1,179,596
5 Maricopa County, AZ 1,055,573
*Population Estimates as of July 1

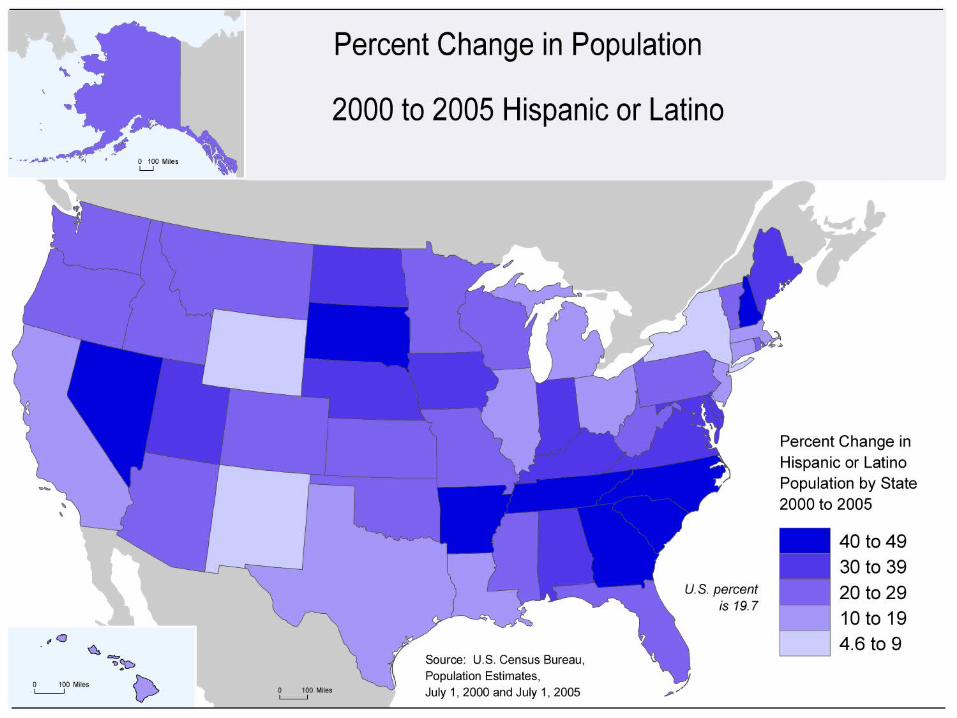
Top StatesTop States% Growth (2000 – 2005) % Growth (2000 – 2005)
1616
Rank State
Growth
(%)
1 Arkansas 49.0
2 Georgia 46.5
3 South Carolina 45.4
4 North Carolina 44.2
5 Tennessee 44.2
*Population Estimates as of July 1
(For states with 100,000 or more Hispanics in 2005)
1717

1818

Hispanic Population in TexasHispanic Population in Texas(1980 – 2000)(1980 – 2000)
City City Population % Growth %of Pop Hispanic Population % Growth %of Pop Hispanic
HoustonHouston 1,247,586 1,247,586 211 38 211 38
San Antonio 816,057 San Antonio 816,057 67 51 67 51
DallasDallas 810,499 810,499 356 23356 23
El Paso El Paso 591,654 591,654 79 75 79 75
McAllen McAllen 503,100 503,100 134 88134 88
Ft WorthFt Worth 309,851 309,851 338 18338 18
AustinAustin 254,039 254,039 211 38211 38
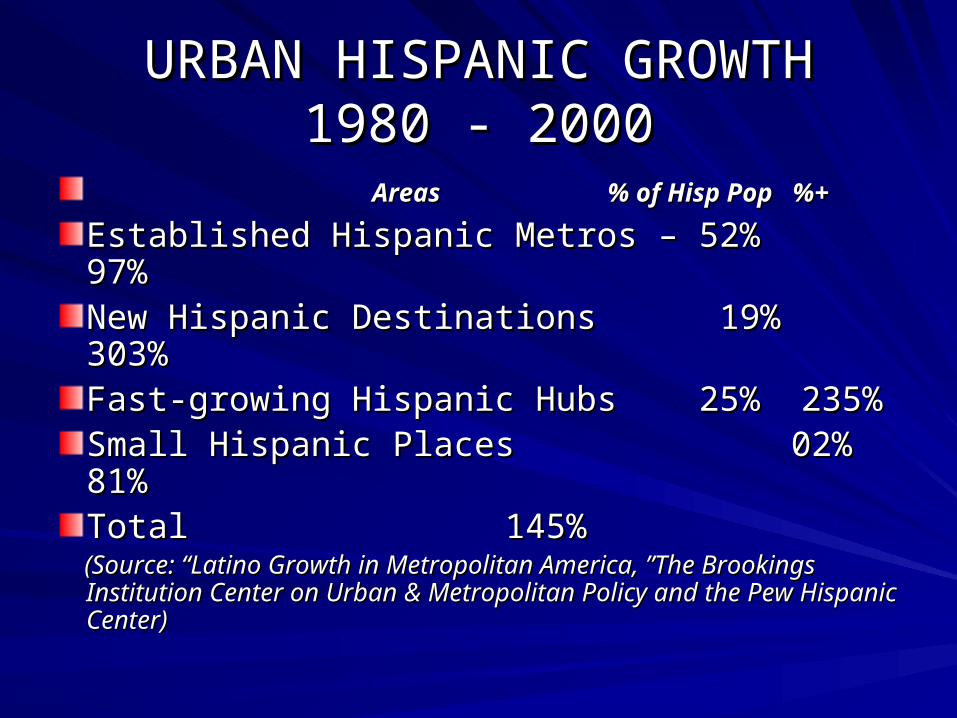
URBAN HISPANIC GROWTHURBAN HISPANIC GROWTH1980 - 20001980 - 2000
Areas % of Hisp Pop %+Areas % of Hisp Pop %+
Established Hispanic Metros – 52% 97%Established Hispanic Metros – 52% 97%New Hispanic Destinations 19% 303%New Hispanic Destinations 19% 303%Fast-growing Hispanic Hubs 25% 235%Fast-growing Hispanic Hubs 25% 235%Small Hispanic PlacesSmall Hispanic Places 02% 02% 81%81%TotalTotal 145% 145%
(Source: “Latino Growth in Metropolitan America, ”The (Source: “Latino Growth in Metropolitan America, ”The Brookings Institution Center on Urban & Metropolitan Brookings Institution Center on Urban & Metropolitan Policy and the Pew Hispanic Center) Policy and the Pew Hispanic Center)

Established Hispanic Metros Established Hispanic Metros (16) (16) (Large base / slow growth)(Large base / slow growth)
CityCity Population (2002) %+Population (2002) %+
Los AngelesLos Angeles 4,242,2134,242,213 105 105
New YorkNew York 2,339, 8362,339, 836 60 60
ChicagoChicago 1,416,5841,416,584 143 143
MiamiMiami 1,291,737 1231,291,737 123(These “Gateway Cities” posted the largest (These “Gateway Cities” posted the largest
absolute increases between 1980 and 2000)absolute increases between 1980 and 2000)

Established Hispanic MetrosEstablished Hispanic Metros (Large base / slow growth)(Large base / slow growth)
Pop 1980Pop 1980 Pop 2002Pop 2002 % Change% Change
7,180,2067,180,206 14,119,00614,119,006 97%97%
Cities: Albuquerque, Chicago, Denver, El Cities: Albuquerque, Chicago, Denver, El Paso, Fresno, Jersey City, Los Angeles, Paso, Fresno, Jersey City, Los Angeles, Mc Allen, Miami. New York, Oakland, San Mc Allen, Miami. New York, Oakland, San Antonio, San Francisco, San Jose, Antonio, San Francisco, San Jose, Tucson, VenturaTucson, Ventura

Fast Growing Hispanic Hubs (11)Fast Growing Hispanic Hubs (11)(Large base / fast growth)(Large base / fast growth)
CityCity Population (2000)Population (2000) %+%+
Houston 1,248,586Houston 1,248,586 21 21
DallasDallas 810,499810,499 358358
AustinAustin 327,760327,760 211211
BakersfieldBakersfield 254,760254,760 192192
Evangelistic ImplicationsEvangelistic Implications
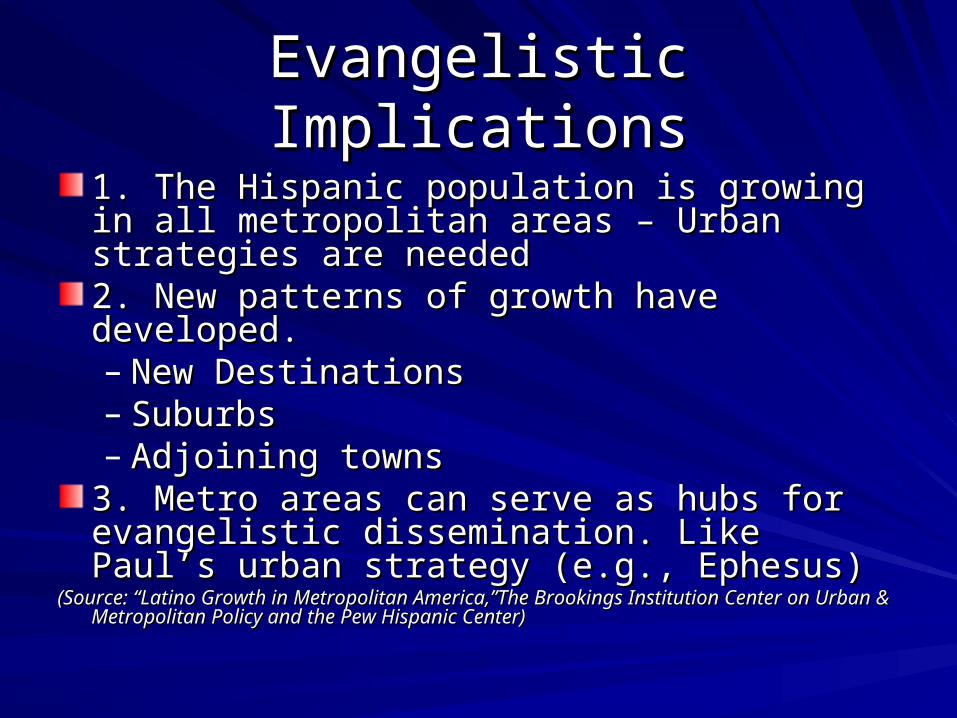
1. The Hispanic population is growing in all 1. The Hispanic population is growing in all metropolitan areas – Urban strategies are metropolitan areas – Urban strategies are neededneeded2. New patterns of growth have developed. 2. New patterns of growth have developed. – New DestinationsNew Destinations– SuburbsSuburbs– Adjoining townsAdjoining towns3. Metro areas can serve as hubs for 3. Metro areas can serve as hubs for evangelistic dissemination. Like Paul’s urban evangelistic dissemination. Like Paul’s urban strategy (e.g., Ephesus)strategy (e.g., Ephesus)
(Source: “Latino Growth in Metropolitan America,”The Brookings Institution Center on (Source: “Latino Growth in Metropolitan America,”The Brookings Institution Center on Urban & Metropolitan Policy and the Pew Hispanic Center) Urban & Metropolitan Policy and the Pew Hispanic Center)
REALITY # 3REALITY # 3
The First Generation (the The First Generation (the immigrants) has become the immigrants) has become the
largest segment of the largest segment of the Hispanic populationHispanic population
((Source: Pew Hispanic Center, Roberto Suro and Jeffery S. Source: Pew Hispanic Center, Roberto Suro and Jeffery S.
Passel, Passel, The Rise of the Second GenerationThe Rise of the Second Generation, October, 2003), October, 2003)
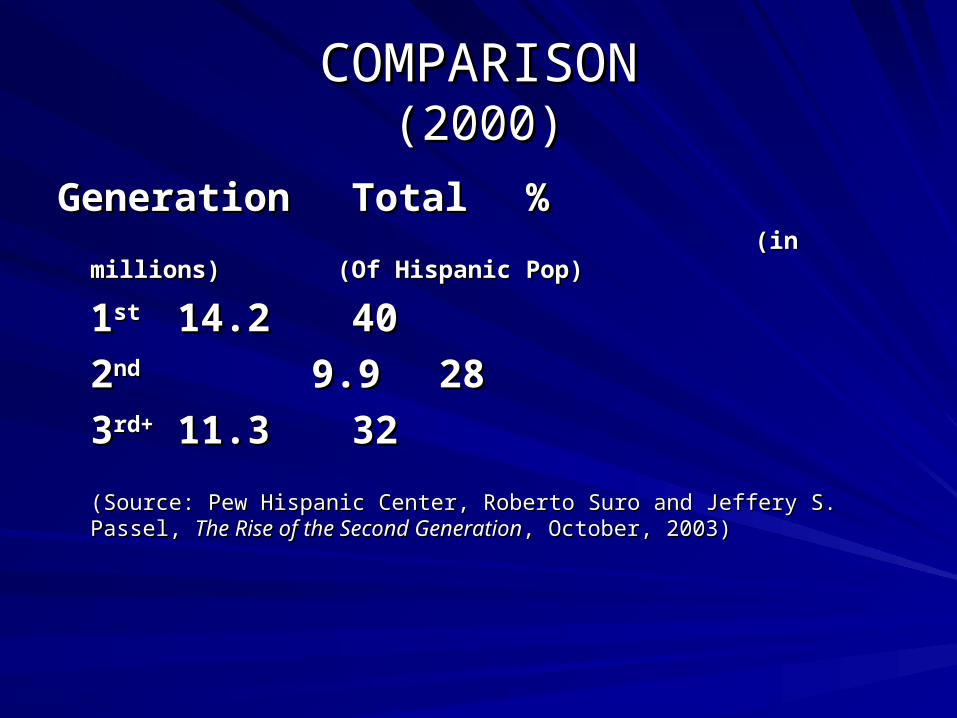
COMPARISONCOMPARISON(2000)(2000)
GenerationGeneration TotalTotal %% (in millions) (Of Hispanic Pop)(in millions) (Of Hispanic Pop)
11stst 14.214.2 4040
22ndnd 9.9 9.9 2828
33rd+rd+ 11.311.3 3232
(Source: Pew Hispanic Center, Roberto Suro and Jeffery S. Passel, (Source: Pew Hispanic Center, Roberto Suro and Jeffery S. Passel, The The Rise of the Second GenerationRise of the Second Generation, October, 2003), October, 2003)

GENERATIONAL SHIFTSGENERATIONAL SHIFTS
In mid 20In mid 20thth century, 3 century, 3rdrd + generation + generation was dominant & had deepest roots in was dominant & had deepest roots in U.S. cultureU.S. culture
By 1990, 1By 1990, 1stst generation became the generation became the largest segment of Hispanic largest segment of Hispanic populationpopulation
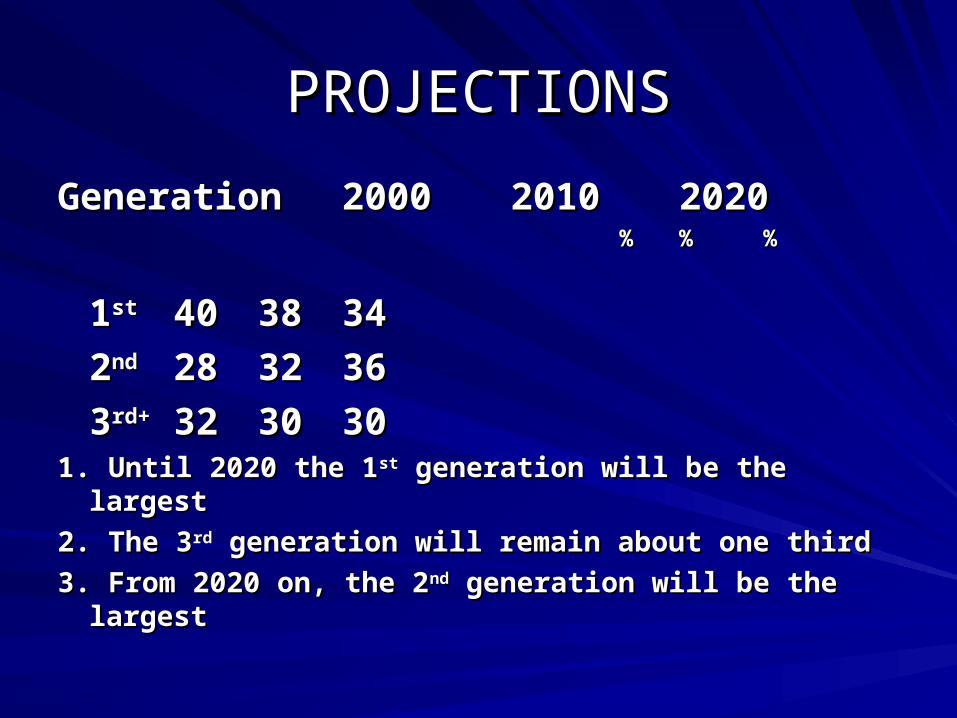
PROJECTIONSPROJECTIONS
GenerationGeneration20002000 20102010 20202020 %% %% %%
11stst 4040 3838 3434
22ndnd 2828 3232 3636
33rd+rd+ 3232 3030 30301. Until 2020 the 11. Until 2020 the 1stst generation will be the largest generation will be the largest
2. The 32. The 3rdrd generation will remain about one third generation will remain about one third
3. From 2020 on, the 23. From 2020 on, the 2ndnd generation will be the largest generation will be the largest
REALITY # 4REALITY # 4
The use of the Spanish The use of the Spanish language has increased in the language has increased in the
past two decadespast two decades
((Source: Pew Hispanic Center, Roberto Suro and Jeffery S. Source: Pew Hispanic Center, Roberto Suro and Jeffery S.
Passel, Passel, The Rise of the Second GenerationThe Rise of the Second Generation, October, 2003), October, 2003)

SPANISH BY GENERATIONSSPANISH BY GENERATIONS
GenGen SpanishSpanish BilingualBilingual EnglishEnglish DominantDominant DominantDominant
11stst 72%72% 24%24% 4%4%
22ndnd 7%7% 47%47% 46%46%
33rd+rd+ 0%0% 22%22% 78%78%

EVANGELISTIC CHALLENGESEVANGELISTIC CHALLENGES
1. Reaching the immigrant 1. Reaching the immigrant generation primarily utilizing generation primarily utilizing the Spanish languagethe Spanish language
2. Reaching the 22. Reaching the 2ndnd and 3 and 3rdrd generation with bi-lingual and generation with bi-lingual and English-dominant strategiesEnglish-dominant strategies

REALITY # 5REALITY # 5
RegardingRegarding educational attainment, educational attainment, the 2the 2ndnd and 3 and 3rdrd generations have generations have
made significant strides yet the 1made significant strides yet the 1stst generation lags behindgeneration lags behind
((Source: Pew Hispanic Center, Roberto Suro and Jeffery S. Passel, Source: Pew Hispanic Center, Roberto Suro and Jeffery S. Passel, The The
Rise of the Second GenerationRise of the Second Generation, October, 2003), October, 2003)

EDUCATIONEDUCATION(Age 25 to 64)(Age 25 to 64)
GenGen Less thanLess than High SchoolHigh School Some College Some College High School Graduate College High School Graduate College GraduateGraduate
11stst 54%54% 24%24% 13%13% 9%9%
22ndnd 23%23% 33%33% 29%29% 15%15%
33rdrd 25%25% 35%35% 27%27% 13%13%

EDUCATIONAL CHALLENGEEDUCATIONAL CHALLENGE
1. Providing GED opportunities for 1. Providing GED opportunities for Hispanic youth and adults Hispanic youth and adults
2. Encouraging Hispanic young people to 2. Encouraging Hispanic young people to complete their high school educationcomplete their high school education
3. Encouraging 23. Encouraging 2ndnd and 3 and 3rdrd generation generation Hispanics to avail themselves of existing Hispanics to avail themselves of existing educational programs in universities and educational programs in universities and seminariesseminaries

DUAL CHALLENGEDUAL CHALLENGE
4. Making provision for entry-level 14. Making provision for entry-level 1stst generation Hispanics who are called to generation Hispanics who are called to ministryministry
5. There is a desperate need SBC 5. There is a desperate need SBC educational institutions to work together to educational institutions to work together to build ramps which start at the entry level build ramps which start at the entry level but continue on to baccalaureate and but continue on to baccalaureate and graduate levels graduate levels

REALITY # 6REALITY # 6
Hispanics are showing more Hispanics are showing more receptivity to the evangelical receptivity to the evangelical message than ever before message than ever before in the history of this countryin the history of this country
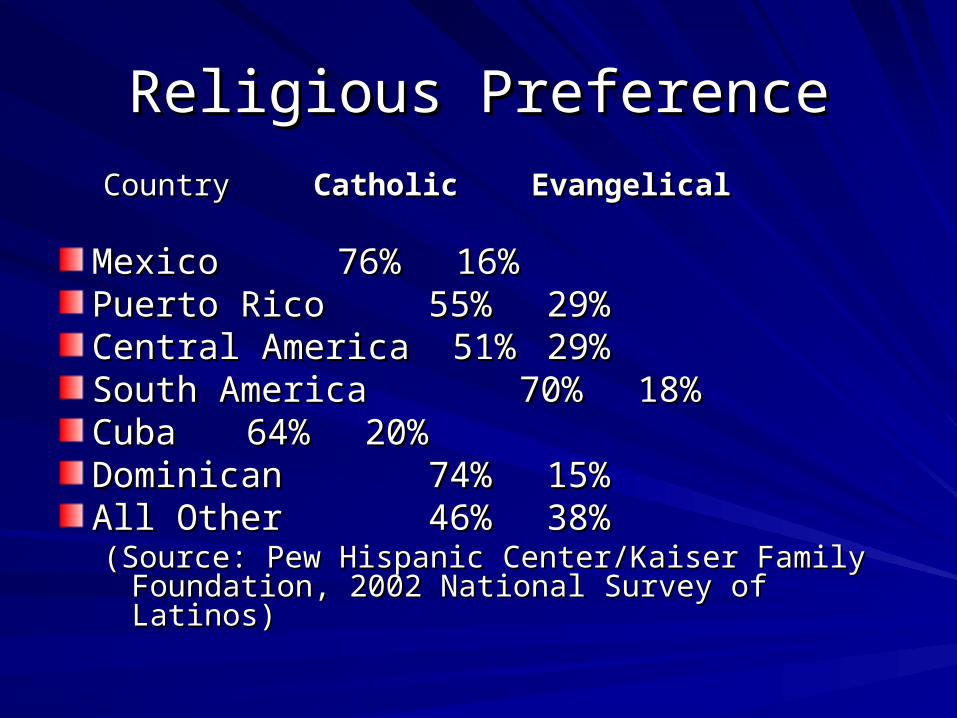
Religious PreferenceReligious Preference
Country Country Catholic Evangelical Catholic Evangelical
MexicoMexico 76% 76% 16%16%Puerto RicoPuerto Rico 55% 55% 29%29%Central America 51%Central America 51% 29%29%South AmericaSouth America 70% 70% 18%18%CubaCuba 64% 64% 20%20%Dominican Dominican 74% 74% 15%15%All OtherAll Other 46% 46% 38%38%(Source: Pew Hispanic Center/Kaiser Family (Source: Pew Hispanic Center/Kaiser Family
Foundation, 2002 National Survey of Latinos) Foundation, 2002 National Survey of Latinos)
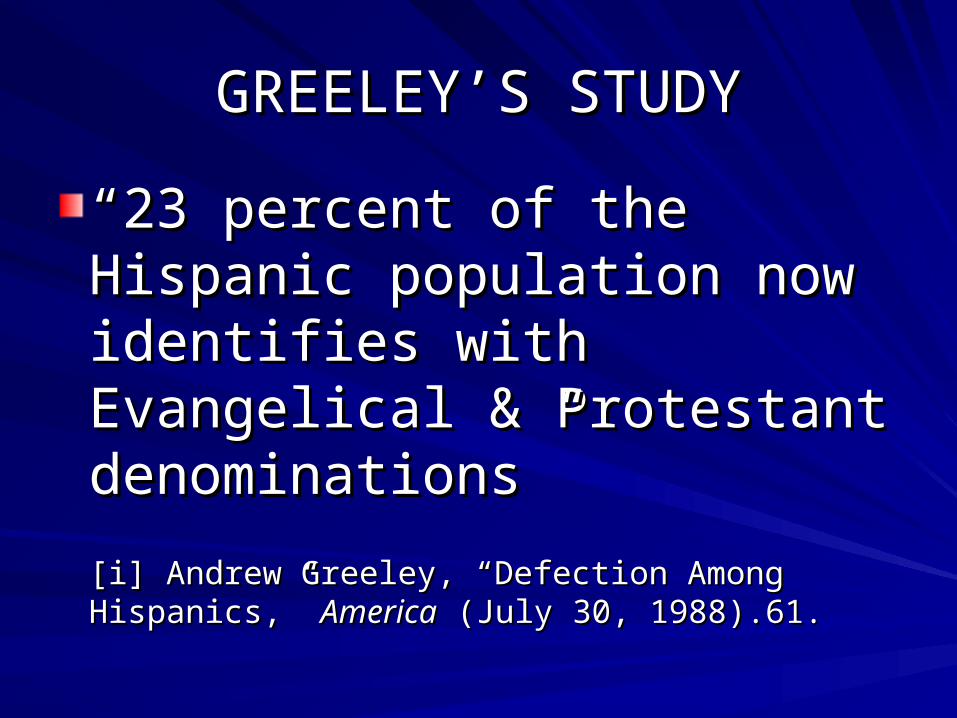
GREELEY’S STUDYGREELEY’S STUDY
““23 percent of the Hispanic 23 percent of the Hispanic population now identifies population now identifies with Evangelical & with Evangelical & Protestant denominations”Protestant denominations”
[i] Andrew Greeley, “Defection Among [i] Andrew Greeley, “Defection Among Hispanics,” Hispanics,” AmericaAmerica (July 30, 1988).61. (July 30, 1988).61.

PEW’S STUDYPEW’S STUDY
20 percent of Hispanics are 20 percent of Hispanics are “Evangelical or Born Again” “Evangelical or Born Again”
9 percent are “Other Christian”9 percent are “Other Christian”
Source: Pew Hispanic Center/Kaiser Family Foundation, Source: Pew Hispanic Center/Kaiser Family Foundation, 2002 National Survey of Latinos, December 2002, 53.2002 National Survey of Latinos, December 2002, 53.

Latest PEW StudyLatest PEW Study
More than 50% of Hispanics are seeking a More than 50% of Hispanics are seeking a more direct and personal relationship with more direct and personal relationship with God than what they find in their traditional God than what they find in their traditional religious practicesreligious practices
Pew Hispanic Center, “Changing Faiths: Latinos and Transformation Pew Hispanic Center, “Changing Faiths: Latinos and Transformation of American Religion.” 2007of American Religion.” 2007
EVANGELISTIC IMPLICATIONSEVANGELISTIC IMPLICATIONS
The Hispanic fields are white unto harvestThe Hispanic fields are white unto harvest
The religious background of many The religious background of many Hispanics favorably predisposes them to Hispanics favorably predisposes them to the evangelical message if it is presented the evangelical message if it is presented in a positive, sensitive wayin a positive, sensitive way
Most of our church members need to be Most of our church members need to be trained on how to share the good news trained on how to share the good news with Roman Catholic friends.with Roman Catholic friends.

MISSIONARY IMPLICATIONSMISSIONARY IMPLICATIONS
Because of their bi-lingual and bi-cultural Because of their bi-lingual and bi-cultural background (like the Apostle Paul), background (like the Apostle Paul), Hispanics can be among the most Hispanics can be among the most effective missionaries in highly strategic effective missionaries in highly strategic parts of the world.parts of the world.
Missions education which stresses the Missions education which stresses the positive aspects of Hispanic identity is positive aspects of Hispanic identity is urgently neededurgently needed
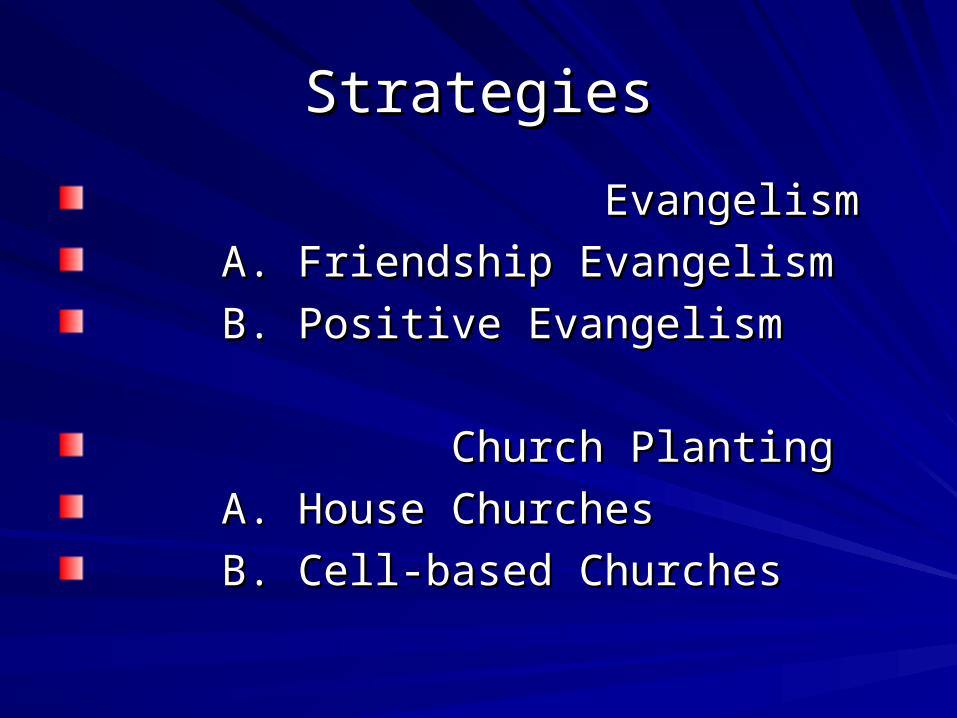
StrategiesStrategies
EvangelismEvangelism
A. Friendship EvangelismA. Friendship Evangelism
B. Positive EvangelismB. Positive Evangelism
Church PlantingChurch Planting
A. House ChurchesA. House Churches
B. Cell-based ChurchesB. Cell-based Churches

REALITY # 7REALITY # 7
Hispanics are typically very Hispanics are typically very conservative regarding conservative regarding
social valuessocial values

FAMILY VALUESFAMILY VALUES
A strong attachment to family is evident among A strong attachment to family is evident among Hispanics who predominantly speak English and Hispanics who predominantly speak English and are generations removed from the immigrant are generations removed from the immigrant experienceexperience
A majority of Hispanics maintain that children A majority of Hispanics maintain that children growing in the US will stay close to their familiesgrowing in the US will stay close to their families
(Source: Pew Hispanic Center/Kaiser Family (Source: Pew Hispanic Center/Kaiser Family Foundation, 2002 National Survey of Latinos)Foundation, 2002 National Survey of Latinos)

FAMILY VALUESFAMILY VALUES
““For Hispanics political concerns For Hispanics political concerns reflect the fact that they are more reflect the fact that they are more likely to be married and have likely to be married and have children than other Americans”children than other Americans”
Source: William Frey, Demographer, Brookings Institution.Source: William Frey, Demographer, Brookings Institution.
FAMILY VALUESFAMILY VALUES
““Leading Hispanics to a Leading Hispanics to a personal faith in Christ and personal faith in Christ and discipling them could discipling them could contribute to the contribute to the strengthening of the moral strengthening of the moral and religious values that are and religious values that are needed in our country today.”needed in our country today.”
Source: Daniel R. Sanchez.Source: Daniel R. Sanchez.

REALITY # 8REALITY # 8
22ndnd and 3 and 3rdrd generation generation Hispanics have made Hispanics have made
significant strides financially significant strides financially yet typically newly arrived yet typically newly arrived Hispanics have the most Hispanics have the most difficult time financiallydifficult time financially

Household IncomeHousehold IncomeHispanicsHispanics
Foreign-Born Native-BornForeign-Born Native-Born
>30,000>30,000 57% 57% 37%37%30,000-49,00030,000-49,000 20% 20% 28%28%50,000+ 50,000+ 11% 11% 27%27%Don’t KnowDon’t Know 12% 12% 09%09%
(Source: Pew Hispanic Center/Kaiser Family Foundation, (Source: Pew Hispanic Center/Kaiser Family Foundation, 2002 National Survey of Latinos)2002 National Survey of Latinos)

OccupationOccupationHispanicsHispanics
Foreign-Born Native-BornForeign-Born Native-Born
White-CollarWhite-Collar 31%31% 69%69%
Blue-CollarBlue-Collar 65%65% 28%28%
Other Other 03%03% 03%03%

Financial ResourcesFinancial Resources
Hispanics have great Hispanics have great economic potentialeconomic potential
FuenteFuente:Felipe Korzenny, Betty Ann Korzenny, :Felipe Korzenny, Betty Ann Korzenny, Hispanic Marketing: A Cultural Perspective (NY: Hispanic Marketing: A Cultural Perspective (NY: Elsevier, 2005, 19)Elsevier, 2005, 19)
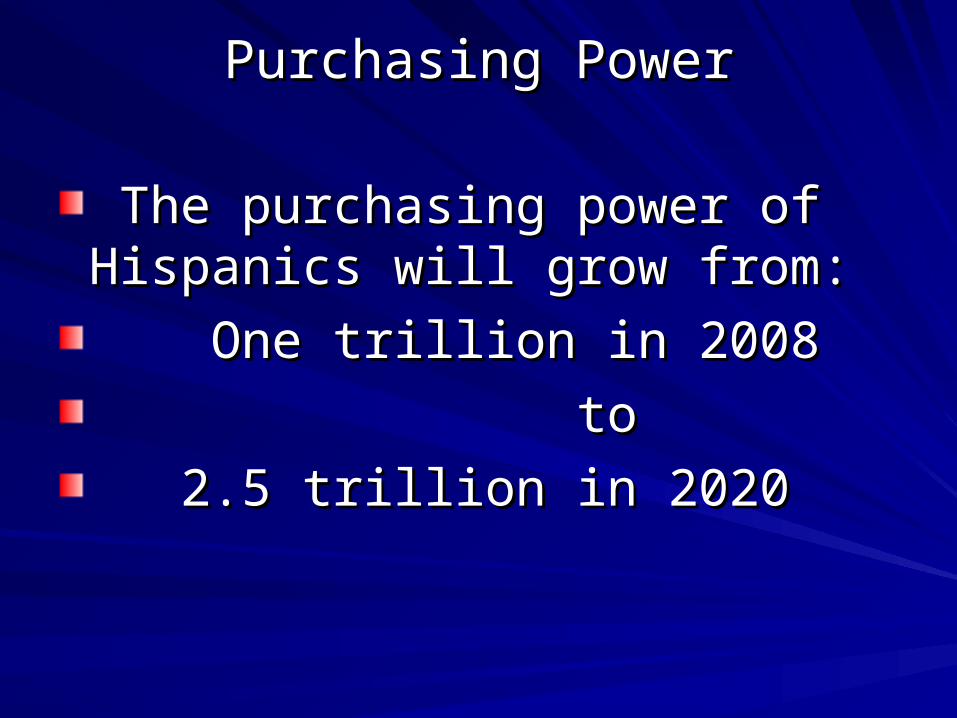
Purchasing PowerPurchasing Power
The purchasing power of The purchasing power of Hispanics will grow from: Hispanics will grow from:
One trillion in 2008 One trillion in 2008
toto
2.5 trillion in 20202.5 trillion in 2020
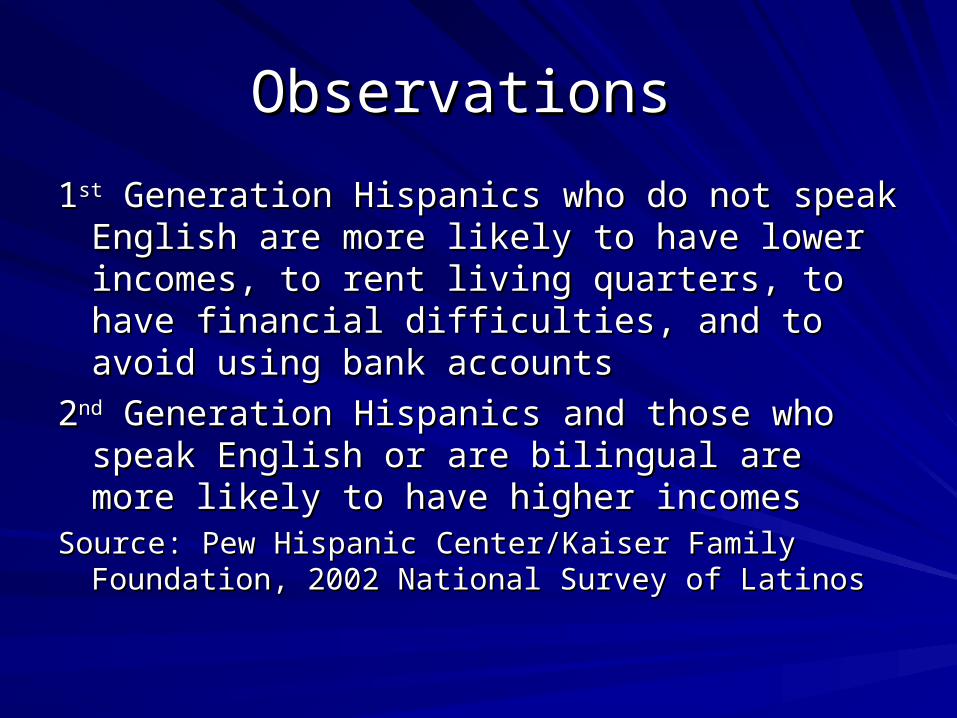
Observations Observations
11stst Generation Hispanics who do not speak English Generation Hispanics who do not speak English are more likely to have lower incomes, to rent are more likely to have lower incomes, to rent living quarters, to have financial difficulties, and living quarters, to have financial difficulties, and to avoid using bank accountsto avoid using bank accounts
22ndnd Generation Hispanics and those who speak Generation Hispanics and those who speak English or are bilingual are more likely to have English or are bilingual are more likely to have higher incomeshigher incomes
Source: Pew Hispanic Center/Kaiser Family Foundation, Source: Pew Hispanic Center/Kaiser Family Foundation, 2002 National Survey of Latinos2002 National Survey of Latinos
Observations Observations
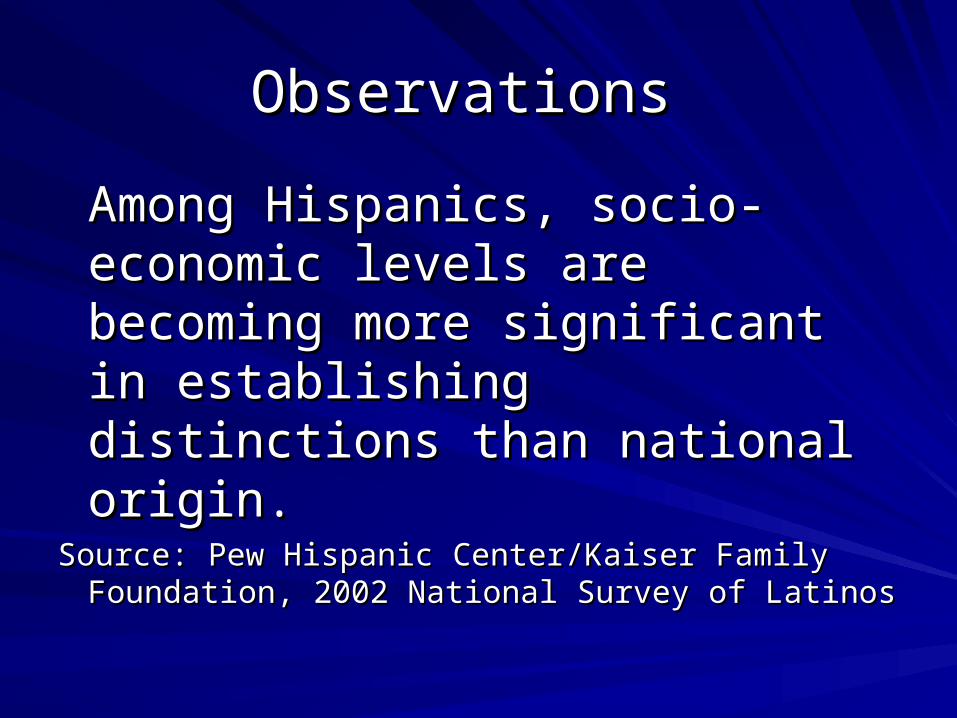
Among Hispanics, socio-Among Hispanics, socio-economic levels are becoming economic levels are becoming more significant in establishing more significant in establishing distinctions than national distinctions than national origin.origin.
Source: Pew Hispanic Center/Kaiser Family Source: Pew Hispanic Center/Kaiser Family Foundation, 2002 National Survey of LatinosFoundation, 2002 National Survey of Latinos

IMPLICATIONSIMPLICATIONS
Utilizing needs as the point of Utilizing needs as the point of entry could lead to the conversion entry could lead to the conversion to Christ of untold numbers of to Christ of untold numbers of Hispanics. Hispanics.
REALITY # 9REALITY # 9
Hispanic Americans are the Hispanic Americans are the group with the largest group with the largest
percentage of children and percentage of children and young peopleyoung people
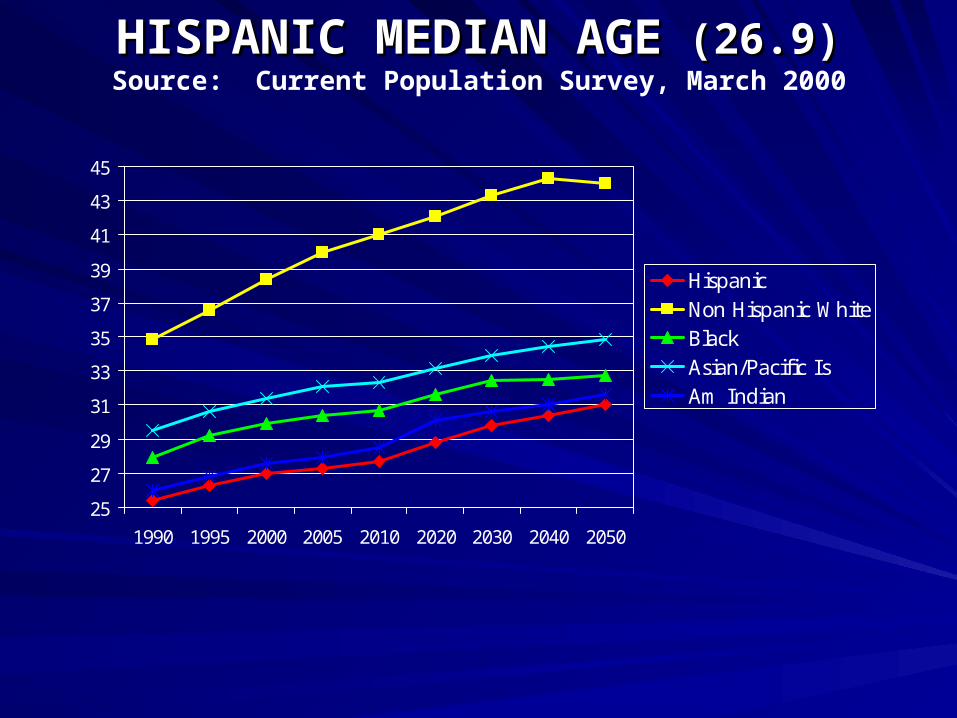
HISPANIC MEDIAN AGEHISPANIC MEDIAN AGE (26.9) (26.9)Source: Current Population Survey, March 2000
25
27
29
31
33
35
37
39
41
43
45
1990 1995 2000 2005 2010 2020 2030 2040 2050
HispanicNon Hispanic WhiteBlackAsian/Pacific IsAm Indian

YOUTHYOUTH
““In this decade, births have In this decade, births have overtaken immigration as the overtaken immigration as the largest source of Hispanic largest source of Hispanic growth.”growth.”
Source: D’vera Cohn, Washington PostSource: D’vera Cohn, Washington Post

YOUTHYOUTH
““One in five people under One in five people under the age of 18 is the age of 18 is
Hispanic.”Hispanic.”
Source: D’vera Cohn, Washington PostSource: D’vera Cohn, Washington Post

GOSPEL RECEPTIVITYGOSPEL RECEPTIVITY
Hispanic children and youth Hispanic children and youth are more receptive to the are more receptive to the Evangelical Message than Evangelical Message than their parentstheir parents
Source: Pew Hispanic Center, 2002 National Source: Pew Hispanic Center, 2002 National Survey of Latinos, 53.Survey of Latinos, 53.

““Hispanic Churches In American Public Life”Hispanic Churches In American Public Life”Pew Center & Notre Dame U.Pew Center & Notre Dame U.
AffiliationAffiliation 11STST GenerationGeneration
22ndnd GenerationGeneration
33rdrd GenerationGeneration
CatholicCatholic 74%74% 72%72% 62%62%
EvangelicalEvangelical 15%15% 20%20% 29%29%

REALITY # 10REALITY # 10
Hispanics have a great deal Hispanics have a great deal in common with one another in common with one another
yet there is significant yet there is significant diversity among themdiversity among them

Percent Distribution of Percent Distribution of HispanicsHispanics by Type: 2002 by Type: 2002
Cuban3.7%
Puerto Rican8.6%
Mexican66.9%
Central and South
American14.3%
Other Hispanic
6.5%
Source: Current Population Survey, March 2002, PGP-5
Observations Observations
Hispanics are neither monolithic nor a Hispanics are neither monolithic nor a hodgepodge of distinct national origin groupshodgepodge of distinct national origin groups
This common culture shares a diversity of views This common culture shares a diversity of views that is most evident in the contrasts between that is most evident in the contrasts between immigrant and native bornimmigrant and native born
They share a range of attitudes and experiences They share a range of attitudes and experiences that set them apart from the non-Hispanic that set them apart from the non-Hispanic populationpopulation(Source: Pew Hispanic Center/Kaiser Family (Source: Pew Hispanic Center/Kaiser Family
Foundation, 2002 National Survey of Latinos)Foundation, 2002 National Survey of Latinos)

Assimilation Stage DiversityAssimilation Stage Diversity
Gen.Gen. Outside Outside
Contacts LanguageContacts Language
1st Few Spanish1st Few Spanish
2nd Some Bilingual 2nd Some Bilingual (Spanish dominant)(Spanish dominant)
3rd Many Bilingual 3rd Many Bilingual (English dominant)(English dominant)
4th Most English (only)4th Most English (only)

Assimilation & Church PlantingAssimilation & Church Planting
Gen.Gen. Outside ChurchOutside Church
Contacts Language CultureContacts Language Culture
1st Few Spanish1st Few Spanish Hispanic Hispanic
2nd Some Bilingual Bicultural2nd Some Bilingual Bicultural (Spanish dominant) (Hispanic dominant) (Spanish dominant) (Hispanic dominant)
3rd Many Bilingual Bicultural3rd Many Bilingual Bicultural (English Dominant) (Anglo Dominant) (English Dominant) (Anglo Dominant)
4th Most English Anglo4th Most English Anglo

CONCLUSIONS CONCLUSIONS
1. Overall findings suggest the need 1. Overall findings suggest the need for new ways of thinking and for new ways of thinking and strategizing regarding the Hispanic strategizing regarding the Hispanic population in this countrypopulation in this country
(Source: Pew Hispanic Center/Kaiser Family (Source: Pew Hispanic Center/Kaiser Family Foundation, 2002 National Survey of LatinosFoundation, 2002 National Survey of Latinos

CONCLUSIONS CONCLUSIONS
2. Newly arrived immigrants are bringing 2. Newly arrived immigrants are bringing new energy to Spanish and to attitudes new energy to Spanish and to attitudes shaped in Latin America. This has shaped in Latin America. This has significant implications for evangelism and significant implications for evangelism and church planting among Hispanics.church planting among Hispanics.
(Source: Pew Hispanic Center/Kaiser Family Foundation, (Source: Pew Hispanic Center/Kaiser Family Foundation, 2002 National Survey of Latinos2002 National Survey of Latinos
CONCLUSIONSCONCLUSIONS
3. Two processes – 3. Two processes – assimilation assimilation and and
immigrationimmigration – are taking place side-by- – are taking place side-by-side in the Hispanic communities, often side in the Hispanic communities, often within a single familywithin a single family
(Source: Pew Hispanic Center/Kaiser Family (Source: Pew Hispanic Center/Kaiser Family Foundation, 2002 National Survey of LatinosFoundation, 2002 National Survey of Latinos

CONCLUSIONSCONCLUSIONS
4. The vast and widespread growth of 4. The vast and widespread growth of America’s Hispanic population also signals America’s Hispanic population also signals new forms of growth and new areas of new forms of growth and new areas of settlement across the nation’s settlement across the nation’s metropolitan landscapemetropolitan landscape
(Source: “Latino Growth in Metropolitan America, ”The (Source: “Latino Growth in Metropolitan America, ”The Brookings Institution Center on Urban & Metropolitan Brookings Institution Center on Urban & Metropolitan Policy and the Pew Hispanic Center) Policy and the Pew Hispanic Center)

CONCLUSIONSCONCLUSIONS
5. These Hispanic population trends seem 5. These Hispanic population trends seem to follow discernable pathways likely to to follow discernable pathways likely to carry into the future and should be taken carry into the future and should be taken into account in the development of into account in the development of strategic plans.strategic plans.
(Source: Pew Hispanic Center/Kaiser Family (Source: Pew Hispanic Center/Kaiser Family Foundation, 2002 National Survey of LatinosFoundation, 2002 National Survey of Latinos

CONCLUSIONSCONCLUSIONS
6. The need for mission strategists to 6. The need for mission strategists to adapt quickly to vast change presents adapt quickly to vast change presents special challenges in metro areas that special challenges in metro areas that started with miniscule Hispanic started with miniscule Hispanic populations and that experienced sudden, populations and that experienced sudden, substantial growth.substantial growth.
(Source: “Latino Growth in Metropolitan America, ”The (Source: “Latino Growth in Metropolitan America, ”The Brookings Institution Center on Urban & Metropolitan Brookings Institution Center on Urban & Metropolitan Policy and the Pew Hispanic Center) Policy and the Pew Hispanic Center)

CONCLUSIONSCONCLUSIONS
7. Mission strategists responsible for 7. Mission strategists responsible for planning the allocation of services and planning the allocation of services and resources need to tailor their decision-resources need to tailor their decision-making to the particular growth variation in making to the particular growth variation in their ministry area their ministry area
(Source: “Latino Growth in Metropolitan America, ”The (Source: “Latino Growth in Metropolitan America, ”The Brookings Institution Center on Urban & Metropolitan Brookings Institution Center on Urban & Metropolitan Policy and the Pew Hispanic Center) Policy and the Pew Hispanic Center)
IMPLICATIONSIMPLICATIONS
1. For Evangelism?1. For Evangelism?
2. For Church Planting?2. For Church Planting?
3. For Penetrating The Culture?3. For Penetrating The Culture?
4. For Leadership Training/ Resource 4. For Leadership Training/ Resource Development?Development?

THE HISPANIC CHALLENGETHE HISPANIC CHALLENGE
HOW WILL YOU RESPOND HOW WILL YOU RESPOND
TO THIS CHALLENGE?TO THIS CHALLENGE?

ResourcesResources
To obtain additional copies of this To obtain additional copies of this presentation of purchase the book presentation of purchase the book Hispanic Realities Impacting America visit Hispanic Realities Impacting America visit the Church Starting Network website the Church Starting Network website www.churchstarting.net
You may contact Dr. Sanchez through his You may contact Dr. Sanchez through his e-mail address e-mail address [email protected]
Or call 817 454 9016Or call 817 454 9016