himatangi beach coastal hazards assessment … coastal inundation hazard mapping 20 6 summary 23 7...
TRANSCRIPT

Himatangi Beach Coastal Hazards Assessment
Manawatu District
July 2015

Author Jon Bell
Design Engineer
Acknowledgements to Peter Blackwood
Manager Investigations & Design
July 2015 Report No: 2015/EXT/1422
ISBN: 978-1-927259-2-0
CONTACT 24hr Freephone 0508 800 800 [email protected] www.horizons.govt.nz
SERVICE CENTRES
Kairanga Cnr Rongotea & Kairanga-Bunnythorpe Rds Palmerston North Marton Cnr Hammond & Hair Sts Taumarunui 34 Maata Street Woodville Cnr Vogel (SH2) & Tay Sts
REGIONAL HOUSES
Palmerston North 11-15 Victoria Avenue Wanganui 181 Guyton Street
DEPOTS
Levin 11 Bruce Road Taihape Torere Road Ohotu
POSTAL ADDRESS Horizons Regional Council, Private Bag 11025, Manawatu Mail Centre, Palmerston North 4442 | F 06 9522 929

Himatangi Beach Coastal Hazards Assessment Manawatu District
i
July 2015
Executive Summary
The shoreline at Himatangi Beach has been assessed for coastal hazards. A comprehensive CEHZ (Coastal Erosion Hazard Zone) and CIHZ (Coastal Inundation Hazard Zone) assessment was undertaken.
It has been shown that there is no risk to properties at Himatangi Beach from either coastal inundation or erosion over the 100 year planning timeframe considered by this investigation. The mapping of the hazard zones shows that the landward extent of these zones is located within the dunes behind the beach at Himatangi.

Executive Summary
ii
Himatangi Beach Coastal Hazards Assessment Manawatu District Himatangi
July 2015 Month & Year

Himatangi Beach Coastal Hazards Assessment Manawatu District
iii
July 2015
CONTENTS
1 Introduction 1
1.1 Scope of Work 1
1.2 Deliverables 1
2 Site Description 3
3 Historic Shoreline Change 5
4 Coastal Erosion Hazard Zone Assessment 7
4.1 Methodology 7
4.1.1 Open Coast 7
4.1.2 Components 7
4.1.3 Inlets 10
4.2 Coastal Erosion Hazard Zones 10
4.3 CEHZ Mapping 10
5 Coastal Inundation Hazard Assessment 13
5.1 Components of Storm Surge and Wave Run-Up 13
5.1.1 Astronomical Tide 14
5.1.2 Barometric Set-Up 14
5.1.3 Wind Set-Up 15
5.1.4 Total Stillwater Level 15
5.1.5 Wave Set-Up 15
5.1.6 Wave Run-Up 15
5.2 Methodology 16
5.2.1 Components 16
5.3 Coastal Inundation Hazard Results 20
5.4 Coastal Inundation Hazard Mapping 20
6 Summary 23
7 Bibliography 25
Appendix A. Historic Shoreline Change 27
Appendix B. Survey Data 29
Appendix C. Wave Run-Up Calculations 31

Contents
iv
Himatangi Beach Coastal Hazards Assessment Manawatu District Himatangi
July 2015 Month & Year
COASTAL HAZARDS ASSESSMENT
HIMATANGI BEACH


Himatangi Beach Coastal Hazards Assessment Manawatu District
1
July 2015
1 Introduction
A progressive review of the information available on coastal hazards by Horizons Regional Council (HRC) has identified the need for an assessment of the nature and scale of coastal hazards along the coastline at Himatangi.
The purpose of this assessment is to identify the coastal hazards to which the area is subjected, in order that the respective councils can then make informed decisions as to how to manage existing and new activities and development in the area.
1.1 Scope of Work
Task 1. To identify an „area sensitive to coastal hazards‟ along the full shoreline at Himatangi.
Task 2. To investigate and identify in detail the nature and scale of coastal hazards that exist using the following criteria:
a. Design waves and storm surge wave run-up (SWRU) in a 1% AEP storm (note care is to be taken in any wave model that the extreme waves are not damped out due to model limitations).
b. Storm surge in a 1% AEP storm including: i. Barometric set-up; ii. Wind set-up; iii. Wave set-up; iv. Sea level rise of 0.31 m to 2065 and 0.95 m to 2115, being the most
recent estimate from the Ministry for the Environment Guidelines 2008; and
v. Any other physical processes. c. Erosion hazards to be based on:
i. Short-term fluctuations in shoreline position (ST); ii. The shoreline response to storm erosion (SE); iii. Long-term response to storm erosion (LT); iv. Dune stability factor (DS); v. The magnitude of shoreline retreat from sea level; and vi. Any other processes (e.g. river mouth migration).
d. Appropriate freeboard and safety margins. e. Scenarios are to be modelled for:
i. The existing (2015) situation; ii. Inclusion of climate change impacts to the year 2065 including an agreed
provision for wave intensification; and iii. Inclusion of climate change impacts to the year 2115 including an agreed
provision for wave intensification.
1.2 Deliverables
A report outlining or including:
1. The investigations undertaken and the calculations, findings and conclusions reached to meet Task 2 as defined in the scope.
2. The analysis of the options investigated, the finding and conclusions reached in evaluating the coastal hazard risk to meet Task 1 as defined in the scope.
3. That the requirements described in Task 2, of the scope, have been satisfied.

Himatangi Beach Coastal Hazards Assessment Manawatu District
2
Himatangi Beach Coastal Hazards Assessment Manawatu District Title of Report
July 2015 Month & Year
4. Plans and maps, as appropriate, that are in a form compatible with the GIS systems of HRC [ESRI‟s ArcGIS] and Manawatu District Council (MDC), and that map and plan information includes NZTM and NZMG projections and comes with completed metadata files.
River flooding inundation is not considered in this investigation.
Tsunami risks are not included in this investigation as they have previously been studied by GNS Science.
Himatangi Beach Coastal Hazards Assessment Manawatu District
3
July 2015
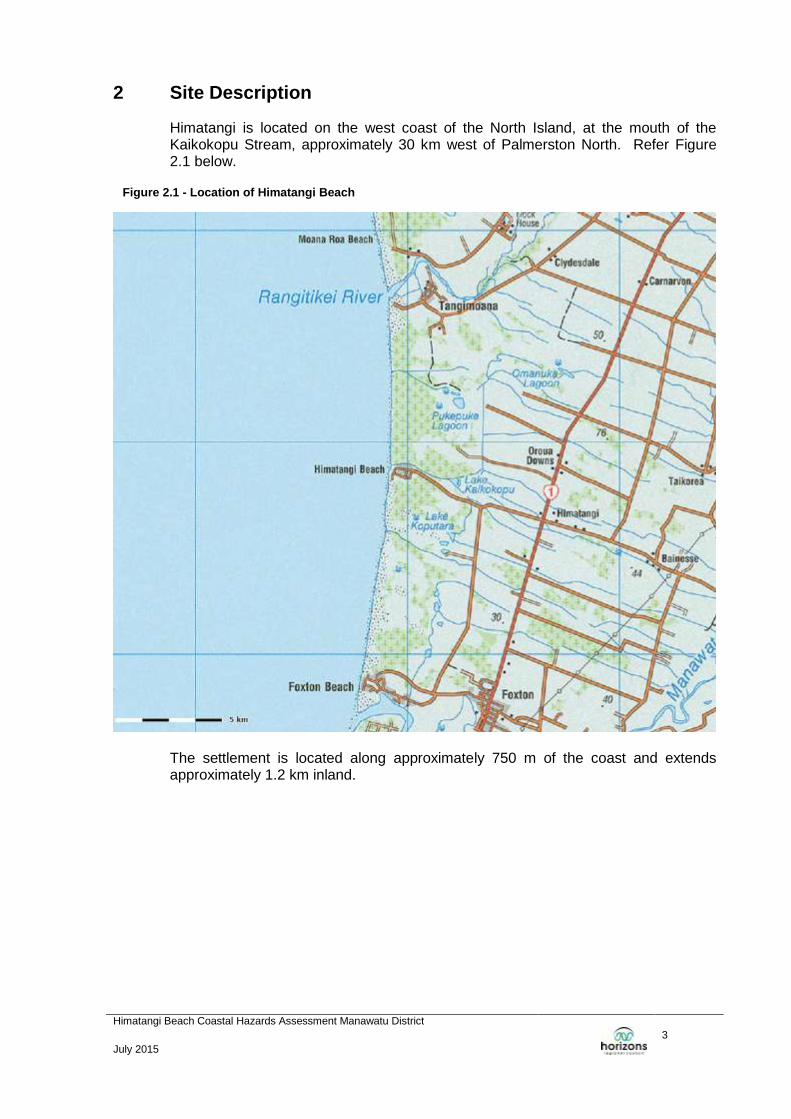
2 Site Description
Himatangi is located on the west coast of the North Island, at the mouth of the Kaikokopu Stream, approximately 30 km west of Palmerston North. Refer Figure 2.1 below.
Figure 2.1 - Location of Himatangi Beach
The settlement is located along approximately 750 m of the coast and extends approximately 1.2 km inland.
Himatangi Beach Coastal Hazards Assessment Manawatu District
4
Himatangi Beach Coastal Hazards Assessment Manawatu District Title of Report
July 2015 Month & Year

Himatangi Beach Coastal Hazards Assessment Manawatu District
5
July 2015
3 Historic Shoreline Change
To analyse the historic shoreline change at Himatangi Beach aerial photographs from 1963, 1995, 2005 and 2011 were geo-referenced and analysed.
The historic aerial photographs were digitised and geo-referenced using ArcGIS software. The estimated relative accuracy between images for this methodology is +/- 2.5 m.
In each photograph, the seaward line of vegetation was digitised as it represents a common shoreline feature. This feature was chosen because it forms a sharp discontinuity in contract in the photographs. Figure 3.1, overleaf, shows these lines overmarked on the 2011 aerial image of Himatangi Beach.
As clearly shown in Figure 3.1, the shoreline at Himatangi is accreting (building out). This is in keeping with patterns seen along the west coast of the Horizons Region that are supported by anecdotal evidence and observed trends.
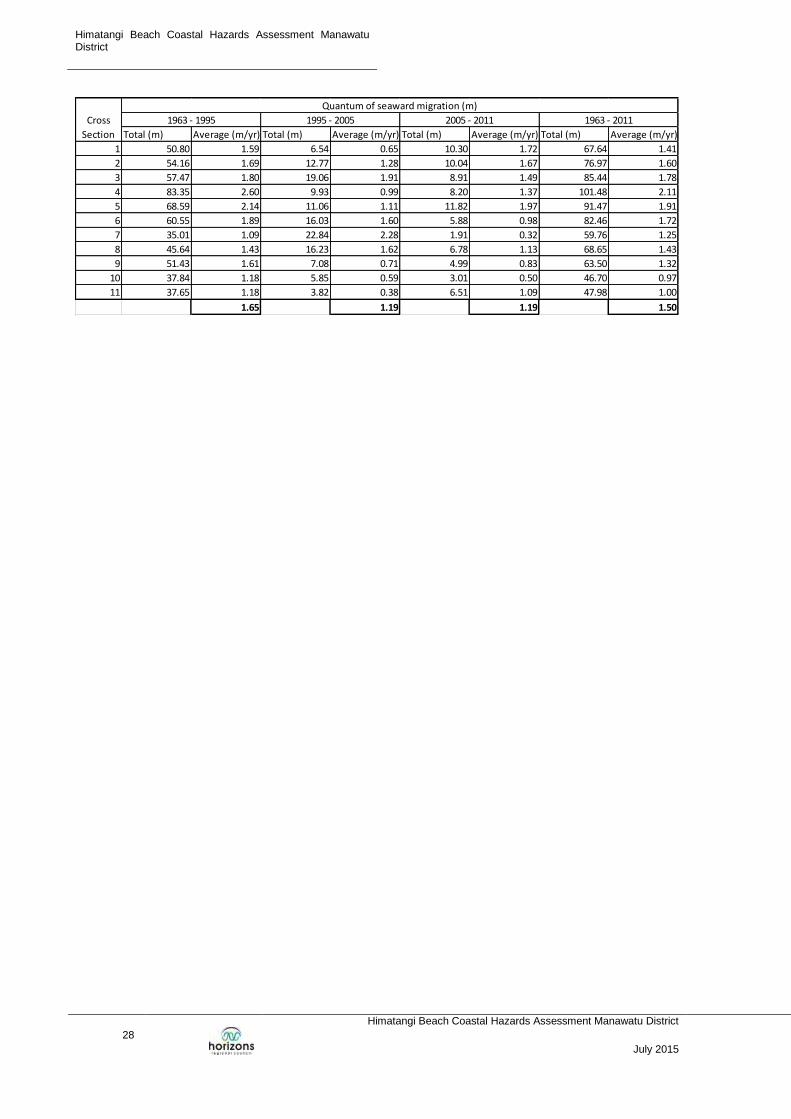
Analyses of changes in the shoreline position were undertaken at 11 cross sections, spaced at 100 m intervals along the beach. The locations of the cross sections and the full results of the analysis can be seen in Appendix A.
The analysis showed that the rate of beach accretion has been relatively steady since 1963. Between 1963 and 1995 the seaward vegetation line moved approximately 1.65 m/year. Since 1995, this movement has occurred at a slightly slower rate of approximately 1.19 m/year. This later rate of accretion occurred over both the 1995-2005 and 2005-2011 timeframes.
Due to the inaccuracies present in this type of analysis, it is considered appropriate to assume that the rate of accretion of the shoreline is the full long-term average rate that occurred between 1963 and 2011. Hence, the historic rate of shoreline change is an accretion of 1.5 m/year.

Himatangi Beach Coastal Hazards Assessment Manawatu District
6
Himatangi Beach Coastal Hazards Assessment Manawatu District Title of Report
July 2015 Month & Year
Figure 3.1 - Historic Shoreline Position Change

Himatangi Beach Coastal Hazards Assessment Manawatu District
7
July 2015
4 Coastal Erosion Hazard Zone Assessment
4.1 Methodology
To maintain a consistent approach to the assessment of coastal erosion hazards in the Horizons Region, the methodology used in the Waikawa to Waitarere Coastal Hazard Assessment (Tonkin and Taylor, 2013), has been used in this assessment.
This methodology to determine the Coastal Erosion Hazard Zones (CEHZ) includes the cumulative addition of:
Predicted climate change effects;
Expected long-term erosion rates;
Episodic storm induced erosion and short-term fluctuations in shoreline movement;
Dune stability; and
Inlet migration.
4.1.1 Open Coast
The equation below models the CEHZ for the open coast:
CEHZ (open coast) = [LT]T+SLR+ST+DS+FS (1)
Where:
CEHZ= The width of the Coastal Erosion Hazard Zone for open coast sandy shoreline (m).
LT = Historic long-term rate of horizontal shoreline movement (m/yr).
T = Planning timeframe (years).
SLR = Horizontal coastline retreat due to possible accelerated sea level rise (m).
ST = Horizontal distance of shoreline retreat from both storm induced erosion and short-term fluctuations in the long-term trend of shoreline movement (m).
DS = Horizontal retreat of the vertical erosion scarp based on the angle of repose for loose sand (m).
FS = Factor of safety/uncertainty (m).
4.1.2 Components
4.1.2.1 Planning Timeframe (T)
The three timeframes described in the project brief have been applied. These timeframes are defined below:
Current Erosion Hazard Zone (2015) - CEHZ;
2065 Erosion Hazard Zone (50 years) - 2065EHZ; and

Himatangi Beach Coastal Hazards Assessment Manawatu District
8
Himatangi Beach Coastal Hazards Assessment Manawatu District Title of Report
July 2015 Month & Year
2115 Erosion Hazard Zone (100 years) - 2115EHZ.
4.1.2.2 Sea Level Rise Effects (SLR)
The frequency of wave attack, on the fore dunes, is likely to increase with future sea level rise. It is likely that this will lead to increased erosion, even at beaches that have been relatively stable over time.
As with the Waikawa to Waitarere Coastal Hazard Assessment (Tonkin and Taylor, 2013), it is not considered appropriate to make any adjustments for vertical land displacement (uplift from earthquakes) when considering sea level rise during the 100 year planning timeframe.
The approach that has been used is to assume that the sediment supply and active beach width remains constant during a change in sea level (equilibrium beach concept). The beach profile is likely to respond to these conditions with an upward and landward transition over time (Komar, McDougal, Marra, & Ruggiero, 1999). The landward translation of the beach profile (SLR) can be defined as a function of sea level rise and the active beach slope. This method of describing the equilibrium beach concept is a variation of the Bruun Rule and is given in equation 2 below.
(2)
Where:
SLR = Landward translation of the beach profile (m).
Δs = Predicted rise in sea level (m).
α = Average intertidal slope.
The predicted sea level rise has been assumed to be 0.31 m to 2065 and 0.95 m for 2115, which are the most recent estimates from the (Ministry for the Environment (MfE), 2008).
An analysis of surveyed cross sections, which can be seen in Appendix B, shows that the average inter-tidal slope at Himatangi is approximately 1:20.
Using these assumptions, and the model described above, the potential landward movement of the beach has been calculated for both of the sea level rise scenarios. The results are summarised in Table 4.1 below:
Table 4.1 - Landward Movement due to Sea Level Rise
Planning timeframe
Inter-tidal slope Sea level rise (m) SLR distance (m)
2015 - 2065 1:20 0.31 6.2 m
2015 - 2115 1:20 0.95 19 m
Himatangi Beach Coastal Hazards Assessment Manawatu District
Himatangi Beach Coastal Hazards Assessment Manawatu District
9
July 2015
4.1.2.3 Long-Term Rates of Shoreline Movement (LT)
The historic trend in the movement of the shoreline at Himatangi Beach is discussed in Section 3. The analysis of historic aerial photographs has shown that the shoreline has been accreting at a rate of approximately 1.5 m/yr.
It is important to note, that future shoreline movement may differ from the historical trend due to changing climatic patterns associated with the Inter-decadal Pacific Oscillation (IPO) and global climate change.
As a conservative approach to the determination of the Coastal Erosion Hazard Zone at Himatangi Beach, the long-term rate of shoreline movement (LT) has been considered to be zero. This means that continued accretion of the beach is not included in the model.
4.1.2.4 Short-Term Shoreline Movement (ST)
Both storm induced erosion and fluctuations are the long-term trend of shoreline movement are included in the short-term erosion rate.
The most obvious cause of short-term erosion is the effect of severe wave storms attacking the coast. However, one must also consider short-term fluctuations over a longer period than a single storm event. These fluctuations include responses to natural variations in climatic conditions such as the El Nino Southern Oscillation (ENSO), which usually occurs on a 3-7 year cycle.
To determine the likely magnitude of short-term shoreline movement, it is usual to examine aerial photographs or survey information that has been gathered at frequent intervals over a period of time. Unfortunately, there is not a sufficient quantity of this data to make an accurate estimate of short-term shoreline movement at Himatangi Beach. However, (Tonkin and Taylor, 2013), calculated a conservative estimate of 30 m, and applied that as the ST factor along the entire coast between Waikawa and Waitarere. It is considered that this conservative estimate is appropriate to apply at Himatangi.
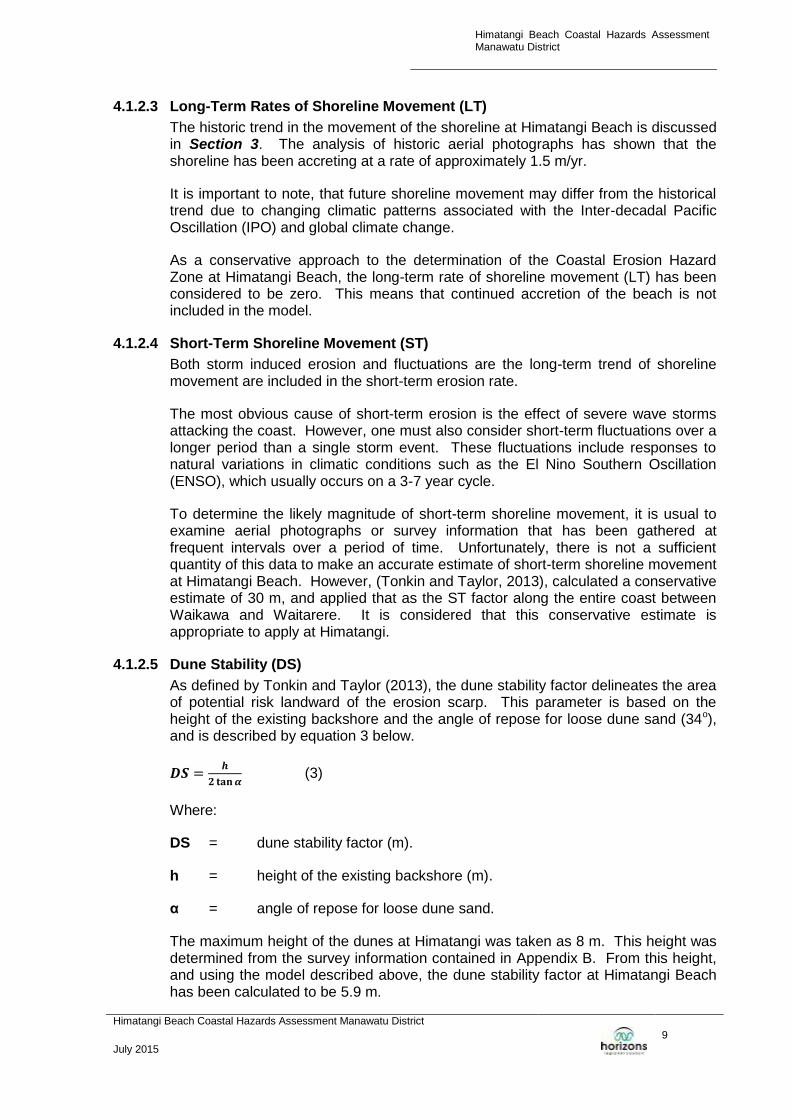
4.1.2.5 Dune Stability (DS)
As defined by Tonkin and Taylor (2013), the dune stability factor delineates the area of potential risk landward of the erosion scarp. This parameter is based on the height of the existing backshore and the angle of repose for loose dune sand (34o), and is described by equation 3 below.
(3)
Where:
DS = dune stability factor (m).
h = height of the existing backshore (m).
α = angle of repose for loose dune sand.
The maximum height of the dunes at Himatangi was taken as 8 m. This height was determined from the survey information contained in Appendix B. From this height, and using the model described above, the dune stability factor at Himatangi Beach has been calculated to be 5.9 m.

Himatangi Beach Coastal Hazards Assessment Manawatu District
10
Himatangi Beach Coastal Hazards Assessment Manawatu District Title of Report
July 2015 Month & Year
4.1.2.6 Factor of Safety (FS)
Due to the uncertainties in the short-term shoreline movement (ST) it is appropriate to allow a factor of safety in the determination of the Coastal Erosion Hazard Zones. In keeping with the Waikawa to Waitarere Coastal Hazard Assessment (Tonkin and Taylor, 2013), a factor of safety of 5 m was deemed to be appropriate for this assessment.
4.1.3 Inlets
The position of the shoreline at many beaches is heavily influenced by river inlets. However, at Himatangi Beach the outlet of the Kaikokopu Stream is controlled by the engineering works downstream of the Surf Lifesaving Club. Since these works help to maintain the vehicular access to the beach it is considered that the structures will be maintained so as to ensure their structural integrity.
This „fixing‟ of the inlet means that, in terms of Coastal Erosion Hazard, the influence of the inlet is negated and the beach can be considered as an open coast.
4.2 Coastal Erosion Hazard Zones
Table 4.2 below presents a summary of the CEHZ distances calculated for the planning timeframes at Himatangi Beach.
Table 4.2 - CEHZ Results
SLR LT (m/yr)
ST (m) DS (m)
FS (m) CEHZ
2065 (m)
2115 (m)
Current (m)
2065 (m)
2115 (m)
6.2 19 0 30 5.9 5 40.9 47.2 59.9
4.3 Coastal Erosion Hazard Zone Mapping
The seaward line of vegetation, which was digitised from the 2011 aerial imagery, was used as the CEHZ offset origin. The CEHZ is measured horizontally inland from the baseline at right angles to the general alignment of the foreshore. The Coastal Erosion Hazard Zones have been mapped digitally and are shown on the 2011 aerial photograph in Figure 4.1, overleaf.

Himatangi Beach Coastal Hazards Assessment Manawatu District
Himatangi Beach Coastal Hazards Assessment Manawatu District
11
July 2015
Figure 4.1 - Himatangi Beach Coastal Erosion Hazard Zones

Himatangi Beach Coastal Hazards Assessment Manawatu District
12
Himatangi Beach Coastal Hazards Assessment Manawatu District Title of Report
July 2015 Month & Year

Himatangi Beach Coastal Hazards Assessment Manawatu District
13
July 2015
5 Coastal Inundation Hazard Assessment
The Coastal Inundation Hazard Zones (CIHZ) at Himatangi have been assessed for storm surge and wave run-up events. Inundation from river flooding or tsunami events have not been modelled as they do not form part of the project brief.
5.1 Components of Storm Surge and Wave Run-Up
Storm surges are caused by coastal storms raising sea levels through a combination of the drop in atmospheric pressure and wind driving the sea onto land. The rising of the sea level in response to falling atmospheric pressure is known as barometric set-up. Wind set-up is the change in water levels due to the wind. Note: wind set-ups can be of two types, being either that caused on open coast or differential effects across and estuary.
The „stillwater‟ level is considered to be the combination of the astronomical tide, barometric set-up and wind set-up.
In addition to the stillwater level, there is a near-shore increase in water levels caused by waves approaching land. This is called wave set-up.
For the open coast a significant component of the peak water level reached on the land is the wave run-up. Wave run-up is defined as the sum of wave set-up and wave swash.
Figure 5.1, below, illustrates these components graphically.
Figure 5.1 - Components of Storm Surge and Wave Run-Up
Himatangi Beach Coastal Hazards Assessment Manawatu District
14
Himatangi Beach Coastal Hazards Assessment Manawatu District Title of Report
July 2015 Month & Year
5.1.1 Astronomical Tide
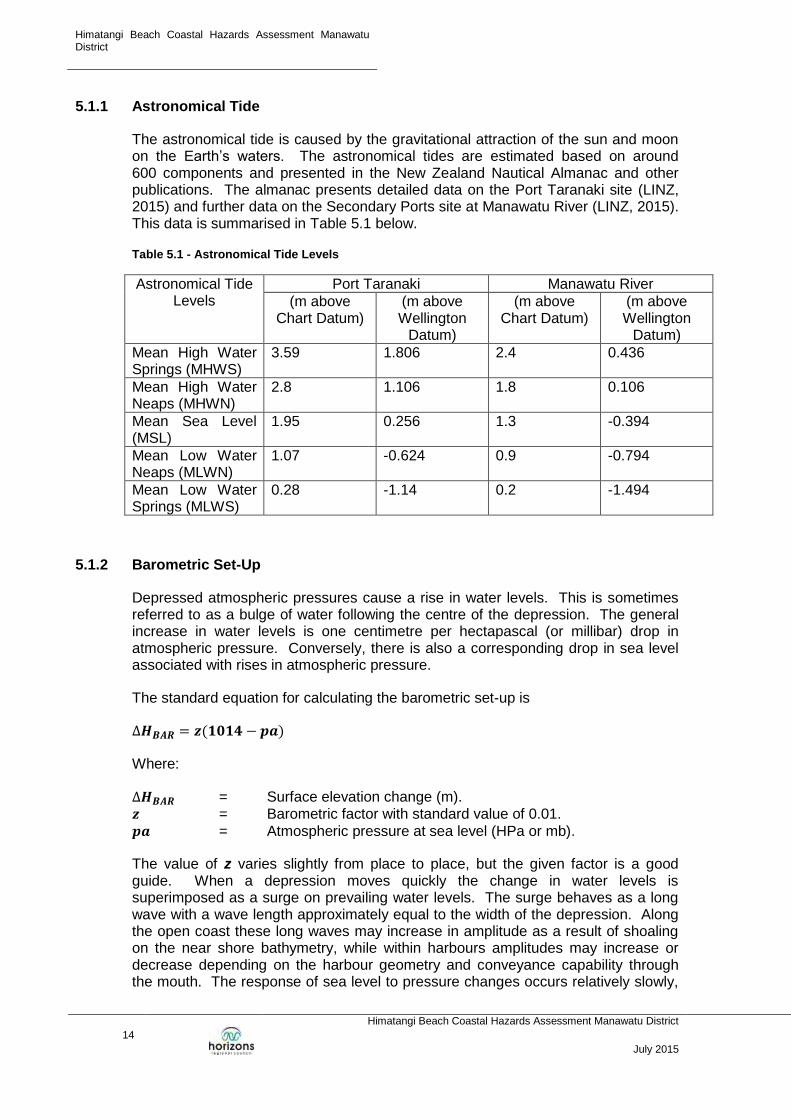
The astronomical tide is caused by the gravitational attraction of the sun and moon on the Earth‟s waters. The astronomical tides are estimated based on around 600 components and presented in the New Zealand Nautical Almanac and other publications. The almanac presents detailed data on the Port Taranaki site (LINZ, 2015) and further data on the Secondary Ports site at Manawatu River (LINZ, 2015). This data is summarised in Table 5.1 below.
Table 5.1 - Astronomical Tide Levels
Astronomical Tide Levels
Port Taranaki Manawatu River
(m above Chart Datum)
(m above Wellington
Datum)
(m above Chart Datum)
(m above Wellington
Datum)
Mean High Water Springs (MHWS)
3.59 1.806 2.4 0.436
Mean High Water Neaps (MHWN)
2.8 1.106 1.8 0.106
Mean Sea Level (MSL)
1.95 0.256 1.3 -0.394
Mean Low Water Neaps (MLWN)
1.07 -0.624 0.9 -0.794
Mean Low Water Springs (MLWS)
0.28 -1.14 0.2 -1.494
5.1.2 Barometric Set-Up
Depressed atmospheric pressures cause a rise in water levels. This is sometimes referred to as a bulge of water following the centre of the depression. The general increase in water levels is one centimetre per hectapascal (or millibar) drop in atmospheric pressure. Conversely, there is also a corresponding drop in sea level associated with rises in atmospheric pressure.
The standard equation for calculating the barometric set-up is
Where:
= Surface elevation change (m). = Barometric factor with standard value of 0.01.
= Atmospheric pressure at sea level (HPa or mb).
The value of z varies slightly from place to place, but the given factor is a good guide. When a depression moves quickly the change in water levels is superimposed as a surge on prevailing water levels. The surge behaves as a long wave with a wave length approximately equal to the width of the depression. Along the open coast these long waves may increase in amplitude as a result of shoaling on the near shore bathymetry, while within harbours amplitudes may increase or decrease depending on the harbour geometry and conveyance capability through the mouth. The response of sea level to pressure changes occurs relatively slowly,

Himatangi Beach Coastal Hazards Assessment Manawatu District
Himatangi Beach Coastal Hazards Assessment Manawatu District
15
July 2015
taking in the range 2 to 12 hours, and affects large areas in approximately uniform manner (Tonkin and Taylor, 2002).
Barometric set-up can also be harmonically enhanced by the speed of travel of the storm. This occurred in central parts of New Zealand in Cyclone Giselle (the “Wahine” storm) in April 1968 (Heath, 1979).
5.1.3 Wind Set-Up
The surface shear stress caused by the wind (called the geostrophic wind) travelling over the sea surface drives water from the prevailing wind direction. An on-shore wind thus drives a „wedge‟ of water against the land. The magnitude of the height of this wedge is known as the wind set-up. There are complex equations available to calculate the wind set-up dependant on several factors including:
Intensity, duration and direction of high winds;
Coastline bathymetry (the wind set-up) is greater in shallow waters); and
Coastline geometry. The concave shape of the Manawatu-Wanganui Region is minorly conducive to enhancing surge levels. This is a much documented phenomenon during hurricanes, with significantly elevated levels on the Gulf of Mexico coastline in the Caribbean Sea.
5.1.4 Total Stillwater Level
The total stillwater level is the combined total of the astronomical tide, barometric set-up and wind set-up. These may not act with peak magnitude simultaneously. For example, the peak set-ups may occur at low tide (although generally there would not be a significant attenuation in set-ups by the preceding or succeeding high tide), similarly the surge on various parts of the New Zealand coast caused by both Cyclones Giselle (1968) and Fergus (1996) occurred on neap tides.
5.1.5 Wave Set-Up
Wave set-up is a super-elevation of the water surface over normal surge elevation due to onshore mass transport of water by wave action alone. It is caused by energy dissipation due to the shoaling of incoming waves, and is more pronounced in environments with steeper beach slopes and hence the depth of breaking is closer to the shoreline.
It is smaller in restricted fetch environments, low beach slopes and shallow water depths (Tonkin and Taylor, 1999).
5.1.6 Wave Run-Up
The wave run-up component is the elevation above the combined level from the other components reached by the wave swash. It is dependent upon breaking wave height and period, beach slope and the resistance characteristics of the beach sediment. It increases with wave height, period and beach slope and decreases with coarser sediments.
It is also affected by the degree of sheltering from headlands, islands or reefs, and wave angle with the shoreline.

Himatangi Beach Coastal Hazards Assessment Manawatu District
16
Himatangi Beach Coastal Hazards Assessment Manawatu District Title of Report
July 2015 Month & Year
5.2 Methodology
In order to provide a consistent approach to the consideration of coastal inundation hazards in the Horizons Region, the methodology used in the Waikawa to Waitarere Coastal Hazards Assessment (Tonkin and Taylor, 2013), has been applied.
Coastal inundation at Himatangi Beach has been assessed for the three timeframes required as part of the brief. These scenarios being
2015 The existing situation;
2065 Possible inundation levels for the next 50 years; and
2115 Possible inundation levels for the next 100 years.
Design levels for each scenario were assessed for tidal conditions plus wave effects. The wave effects have been assessed assuming that the coastline can be considered as an open coast. This is a reasonable approximation as the maximum height of waves in the mouth of the Kaikokopu Stream will be limited by the depth of the inlet.
The equation below was used to model the 1% AEP still water plus 1% AEP wave effects.
Wave run-up (including wave set-up)
(5)
Where:
MHWS = Mean High Water Springs.
SS = Storm surge.
R2% = 2% wave run-up elevation (including wave set-up).
γ = IPO/ENSO/annual variation in MSL of 0.25 m.
SLR = Sea Level Rise.
5.2.1 Components
5.2.1.1 Mean High Water Springs
As discussed in Section 5.1.1 Mean High Water Springs at the Manawatu River mouth is 0.436 m (above Wellington Datum). However, as noted by (Blackwood, 2007), the tidal range decreases southwards along the coastline. Hence, the MHWS at Himatangi will be slightly higher than at the mouth of the Manawatu River.
To determine an appropriate level for MHWS at Himatangi Beach a linear interpolation was made between the levels at the Wanganui River Entrance and the Manawatu River. This produced an estimate of MHWS at Himatangi Beach of 0.561 m (above Wellington Datum).
5.2.1.2 Storm Surge
A storm surge component of 0.9 m has been chosen for Himatangi Beach. This estimate of the effects of barometric set-up and wind set-up was chosen as it is in

Himatangi Beach Coastal Hazards Assessment Manawatu District
Himatangi Beach Coastal Hazards Assessment Manawatu District
17
July 2015
keeping with the assumptions made at Waikawa and Waitarere, which are considered to be appropriate for the beach under consideration in this assessment.
5.2.1.3 Wave Run-Up (R2%)
To estimate wave run-up elevation there are a number of empirical formulae that are commonly used by engineers. In recent assessments of wave run-up on the beaches of the west coast of the Horizons Region four such formulae have been applied. These formulae are of (Holman, 1986), (Ruggiero, Komar, McDougall, Marra, & Beach, 2001) as modified by (Tonkin and Taylor, 2002), (Mase, 1989) and (Hedges & Mase, 2004). These formulae are below:
Holman
(
⁄ )
(6)
Where:
RMax = Maximum wave run-up above the stillwater elevation (m).
C = A coefficient that varies from 0.83 (rocky slope) to 1.5 (smooth slope), a value of 1.07 was found by (Tonkin and Taylor, 1999) to fit fine sandy beaches.
β = Beach slope.
HB = Breaking wave height (m), based on a transformation of H1%.
T = Wave period.
Ruggiero et al
(7)
Where the additional parameters are:
C = A coefficient that was found by (Tonkin and Taylor, 2002) to be 0.9 for several eastern Bay of Plenty beaches; and
L = Wave Length (m).
Mase
(8)
Where:
H0 = Deep-water significant wave height.
ξ0 = Iribarren number.

Himatangi Beach Coastal Hazards Assessment Manawatu District
18
Himatangi Beach Coastal Hazards Assessment Manawatu District Title of Report
July 2015 Month & Year
Hedges and Mase
(9)
Where:
HS = Deep-water significant wave height.
5.2.1.4 Components of Wave Run-Up at Himatangi Beach
As part of the storm surge and wave run-up design levels for Foxton Beach (Blackwood, 2007) consideration was given to the estimates of wave heights and periods. The following wave characteristics were defined for Foxton Beach:
HS = 12 m.
H1% = 18.36 m.
TP = 14.5 s.
It is considered that these characteristics provide a good estimate of the 1% AEP storm at Himatangi Beach due to the geographical proximity to Foxton.
5.2.1.4.1 Beach Slope (β)
From the beach surveys, contained in Appendix B, an average beach slope of 0.034 m/m has been calculated and assumed to be representative of Himatangi Beach.
5.2.1.4.2 Lribarren Number (ξ0)
The Iribarren number, or surf similarity parameter, is a dimensionless parameter that is defined as:
√ ⁄ (10)
Where:
L0 = deep-water wave length (m).
α = bed slope.
Using this formula, the Iribarren number at Himatangi Beach has been calculated to be 0.18.
5.2.1.5 Wave Run Up Estimates
Table 5.2, overleaf, summarises the wave run-up elevations calculated by each of the methods described above. The calculations can be seen in Appendix C.

Himatangi Beach Coastal Hazards Assessment Manawatu District
Himatangi Beach Coastal Hazards Assessment Manawatu District
19
July 2015
Table 5.2 - Estimates of wave run-up
Method Wave run-up (m)
Holman 10.38
Ruggiero et al 2.88
Mase 5.45
Hodges & Mase 7.24
The elevation of wave run-up calculated using the method described by Holman appears to be high, while the estimate from the Ruggiero Model is low when compared with the size of waves observed at Himatangi.
It is for this reason that the average run-up elevation calculated by the Mase and Hedges & Mase Models has been used to estimate the elevation of wave run-up at Himatangi Beach.
The 1% AEP storm wave run-up at Himatangi Beach is estimated to be 6.35 m.
5.2.1.6 Sea Level Variation (γ)
Tonkin and Taylor (2013), noted that sea level variation occurs due to thermal expansion and contraction due to changes in sea surface temperatures and associated currents. This variation in sea level is related to climate cycles of varying time periods.
The Waikawa to Waitarere Coastal Hazards Assessment concluded that a sea level variation of +/- 0.25 m would apply to both the 50 and 100 year scenarios. This is also considered to be an appropriate sea level variation to be applied at Himatangi Beach for the 2065 and 2115 scenarios.
It is also considered appropriate to include this sea level variation in the assessment of the current inundation hazard to allow for La Niña effects.
5.2.1.7 Sea Level Rise
As defined in the project brief (see section 1.1), sea level rise is taken as 0.31 m for the 2065 scenario and 0.95 m for the 2115 scenario.
5.2.1.8 Inlet Wave Effects
Wave heights in an inlet are considered to be depth limited. As such, the waves that run-up the Kaikokopu Stream, towards the surf lifesaving club, are not likely to increase in size over the planning timeframe considered by this investigation. As such, the risk of coastal inundation to the surf lifesaving club is not considered likely to change.

Himatangi Beach Coastal Hazards Assessment Manawatu District
20
Himatangi Beach Coastal Hazards Assessment Manawatu District Title of Report
July 2015 Month & Year
5.3 Coastal Inundation Hazard Results
Table 5.3, below, summarises the components and final coastal inundation levels for the existing 2065 and 2115 scenarios.
Table 5.3 - Coastal Inundation Hazard Elevations
Parameter Scenario
Existing 2065 2115
MHWS (m above Wellington Datum)
0.561 0.561 0.561
Sea level rise (m) 0 0.31 0.95
Storm surge (m) 0.9 0.9 0.9
Sea level variation (m) 0.25 0.25 0.25
Wave run-up (m) 6.35 6.35 6.35
Total CIHZ elevation (m above Wellington Datum)
8.06 8.37 9.01
5.4 Coastal Inundation Hazard Mapping
The Coastal Inundation Hazard Zones at Himatangi Beach have been mapped by plotting the inundation level on the surveyed ground level. This has given two spatial points for each inundation scenario.
A line has been plotted between these points and overmarked on the 2011 aerial map to indicate the CIHZ. These Coastal Inundation Hazard Zones can be seen in Figure 5.2.
Due to the lack of more extensive topographic information around Himatangi it is not possible to extend these lines further along the shoreline. However, a visual inspection of the dunes confirmed that the dunes are of a relatively constant size along the shoreline at Himatangi. This means, that it is reasonable to assume, that there will be no properties along Hunia Terrace that are likely to be at risk from coastal inundation during the 100 year planning timeframe considered by this investigation.

Himatangi Beach Coastal Hazards Assessment Manawatu District
Himatangi Beach Coastal Hazards Assessment Manawatu District
21
July 2015
Figure 5.2 - Himatangi Beach Coastal Inundation Hazard Zones

Himatangi Beach Coastal Hazards Assessment Manawatu District
22
Himatangi Beach Coastal Hazards Assessment Manawatu District Title of Report
July 2015 Month & Year

Himatangi Beach Coastal Hazards Assessment Manawatu District
23
July 2015
6 Summary
The shoreline at Himatangi Beach has been assessed for coastal hazards. This has included a comprehensive assessment of the CEHZ (Coastal Erosion Hazard Zone) and the CIHZ (Coastal Inundation Hazard Zone).
CEHZs were assessed for the current (2015), 50 year (2065) and 100 year (2115) planning timeframes. Table 6.1, below, summarises the CEHZ setback distances as measured from the toe of the foredunes (as seen in 2011).
Table 6.1 - Summary of CEHZ setback distances
CEHZ Setback Distances
2015 2065 2115
40.9 m 47.2 m 59.9 m
CIHZs were assessed for the same planning timeframes as the CEHZs. The 1% AEP elevations (above Wellington Datum) are summarised in Table 6.2 below.
Table 6.2 - Summary of CIHZ elevations
CIHZ Elevations (m above Wellington Datum)
2015 2065 2115
8.06 8.37 9.01

Himatangi Beach Coastal Hazards Assessment Manawatu District
24
Himatangi Beach Coastal Hazards Assessment Manawatu District Title of Report
July 2015 Month & Year

Himatangi Beach Coastal Hazards Assessment Manawatu District
25
July 2015
7 Bibliography
Blackwood, P. L. (2007). Storm Surge and Wave Run-Up Design Levels for Foxton Beach. Horizons Regional Council.
Heath, R. (1979). Significance of Storm Surges on the New Zealand Coast. New Zealand Journal of Geology and Geophysics, 22(2), 259-66.
Hedges, T. S., & Mase, H. (2004). Modified Hunt's equation incorporating wave setup. Journal of Waterway, Port Coastal and Ocean Engineering, 130, 109-113.
Holman, R. (1986). Extreme Value Statistics for Wave Run-up on a Natural Beach. Coastal Engineer, 9.
Komar, P. D., McDougal, W. G., Marra, J. J., & Ruggiero, P. (1999). The Rational Analysis of Setback Distances: Applications to the Oregon Coast. Shore and Beach, 67(1), 41-49.
LINZ. (2015). Secondary Ports Table. Retrieved 05 11, 2015, from http://www.linz.govt.nz/docs/hydro/tidal-info/tide-tables/sec-ports/port-taranaki.pdf
LINZ. (2015). Standard Port Tidal Levels. Retrieved 05 11, 2015, from http://www.linz.govt.nz/sea/tides/tide-predictions/standard-port-tidal-levels
Mase, H. (1989). Random wave runup height on gentle slope. Journal of Waterway, Port, Coastal and Ocean Engineering, 129(2), 649-661.
Ministry for the Environment (MfE). (2008). Coastal Hazards and Climate Change. A Guidance Manual for Local Government in New Zealand (2nd ed.).
Ruggiero, P., Komar, P. D., McDougall, W. G., Marra, J. J., & Beach, R. A. (2001). Wave Runup, Extreme Water Levels and the Erosion of Properties Backing Beaches. Journal of Coastal Research, 17(2), 407-419.
Tonkin and Taylor. (1999). Storm Surge Innundation Study for Tauranga Harbour. Tauranga District Council.
Tonkin and Taylor. (2002). Coastal Hazard Analysis. Whakatane District Council and Environment Bay of Plenty.
Tonkin and Taylor. (2013). Coastal Hazard Assessment - Waikawa to Waitarere. Horizons Regional Council.

Himatangi Beach Coastal Hazards Assessment Manawatu District
26
Himatangi Beach Coastal Hazards Assessment Manawatu District Title of Report
July 2015 Month & Year

Himatangi Beach Coastal Hazards Assessment Manawatu District
27
July 2015
Appendix A. Historic Shoreline Change
Himatangi Beach Coastal Hazards Assessment Manawatu District
28
Himatangi Beach Coastal Hazards Assessment Manawatu District Title of Report
July 2015 Month & Year
Total (m) Average (m/yr) Total (m) Average (m/yr) Total (m) Average (m/yr) Total (m) Average (m/yr)
1 50.80 1.59 6.54 0.65 10.30 1.72 67.64 1.41
2 54.16 1.69 12.77 1.28 10.04 1.67 76.97 1.60
3 57.47 1.80 19.06 1.91 8.91 1.49 85.44 1.78
4 83.35 2.60 9.93 0.99 8.20 1.37 101.48 2.11
5 68.59 2.14 11.06 1.11 11.82 1.97 91.47 1.91
6 60.55 1.89 16.03 1.60 5.88 0.98 82.46 1.72
7 35.01 1.09 22.84 2.28 1.91 0.32 59.76 1.25
8 45.64 1.43 16.23 1.62 6.78 1.13 68.65 1.43
9 51.43 1.61 7.08 0.71 4.99 0.83 63.50 1.32
10 37.84 1.18 5.85 0.59 3.01 0.50 46.70 0.97
11 37.65 1.18 3.82 0.38 6.51 1.09 47.98 1.00
1.65 1.19 1.19 1.50
1963 - 1995 1995 - 2005 2005 - 2011Cross
Section
1963 - 2011
Quantum of seaward migration (m)

Himatangi Beach Coastal Hazards Assessment Manawatu District
29
July 2015
Appendix B. Survey Data
-141 -91 -41 9 59 109 159 209 259 309 359 409 459 509 559 609655
-5.2
-3.2
-1.2
0.8
2.8
4.8
6.8
8.8
10.8
12.4
RL Section at Site 13 - Himatangi South on 5-Feb-1980 12:00:00
RL Section at Site 13 - Himatangi South on 24-Apr-1981 12:00:00
RL Section at Site 13 - Himatangi South on 28-May-1982 12:00:00
RL Section at Site 13 - Himatangi South on 14-Jul-1983 12:00:00
RL Section at Site 13 - Himatangi South on 3-Jul-1984 12:00:00
RL Section at Site 13 - Himatangi South on 9-Jun-1985 12:00:00
RL Section at Site 13 - Himatangi South on 30-Jan-1986 12:00:00
RL Section at Site 13 - Himatangi South on 17-Jul-1986 12:00:00
RL Section at Site 13 - Himatangi South on 15-Aug-1986 12:00:00
RL Section at Site 13 - Himatangi South on 6-Jul-1987 12:00:00
RL Section at Site 13 - Himatangi South on 14-Jun-1988 12:00:00
RL Section at Site 13 - Himatangi South on 1-Nov-1998 12:00:00
RL Section at Site 13 - Himatangi South on 1-Feb-1999 12:00:00
RL Section at Site 13 - Himatangi South on 14-Mar-2005 17:30:00
RL Section at Site 13 - Himatangi South on 12-May-2015 09:30:00

Himatangi Beach Coastal Hazards Assessment Manawatu District
30
Himatangi Beach Coastal Hazards Assessment Manawatu District Title of Report
July 2015 Month & Year
-59 -9 41 91 141 191 241 291 341 391 441 491515
-2.4
-0.4
1.6
3.6
5.6
7.6
9.6
11.6
13.6
15.1
RL Section at Site 14 - Himatangi North on 9-Mar-1983 12:00:01
RL Section at Site 14 - Himatangi North on 30-Oct-1984 12:00:01
RL Section at Site 14 - Himatangi North on 26-Mar-1985 12:00:01
RL Section at Site 14 - Himatangi North on 9-Sep-1985 12:00:01
RL Section at Site 14 - Himatangi North on 1-Mar-1986 12:00:01
RL Section at Site 14 - Himatangi North on 1-Oct-1986 12:00:01
RL Section at Site 14 - Himatangi North on 9-Apr-1987 12:00:01
RL Section at Site 14 - Himatangi North on 1-Feb-1999 12:00:00
RL Section at Site 14 - Himatangi North on 14-Mar-2005 18:00:00
RL Section at Site 14 - Himatangi North on 12-May-2015 10:00:00

Himatangi Beach Coastal Hazards Assessment Manawatu District
31
July 2015
Appendix C. Wave Run-Up Calculations

Himatangi Beach Coastal Hazards Assessment Manawatu District
32
Himatangi Beach Coastal Hazards Assessment Manawatu District Title of Report
July 2015 Month & Year