higley unified school district / higley unified school …...unit 5: percent and proportional...
TRANSCRIPT

HIGLEY UNIFIED SCHOOL DISTRICT INSTRUCTIONAL ALIGNMENT
Accelerated Math 7 Third Quarter Unit 5: Percent and Proportional Relationships
Topic A: Proportional Reasoning with Percents (Part 2) In Unit 5, students deepen their understanding of ratios and proportional relationships from Unit 3 (7.RP.A.1, 7.RP.A.2, 7.RP.A.3) by solving a variety of percent problems. Topic A builds on students’ conceptual understanding of percent from Grade 6 (6.RP.3c), and relates 100% to “the whole.” Students represent percents as decimals and fractions and extend their understanding from Grade 6 to include percents greater than 100%, such as 225%, and percents less than 1%, such as1/2 % or 0.5%.. Students create algebraic representations and apply their understanding of percent to interpret and solve multi-step word problems related to markups or markdowns, simple interest, sales tax, commissions, fees, and percent error (7.RP.A.3). They apply their understanding of proportional relationships from Unit 2, creating an equation, graph, or table to model a tax or commission rate that is represented as a percent (7.RP.A.1, 7.RP.A.2). Students solve problems related to changing percents and use their understanding of percent and proportional relationships to solve these problems. Students also apply their understanding of absolute value from Unit 1 (7.NS.A.1b) when solving percent error problems.
Big Idea: • Rates, ratios, percentages and proportional relationships can be applied to solve multi-step percent problems. • Multiple representations can be used to solve percent problems (tape diagrams, double number-line, graphs, equations, etc…) • A unified understanding of numbers is developed by recognizing fractions, decimals, and percents as different representations of rational numbers.
Essential Questions:
• How can you use proportional relationships to solve percent problems? • How can you express a unit rate as a percent? • How are the fraction and decimal representation related to the percent? • How can you identify the “whole” in a percent problem? • How does the context of a problem determine whether there is a percent increase or decrease? • What is the difference between the absolute error and the percent error?
Vocabulary Ratio, proportion, percent increase, percent decrease, percent error, markdown, markup, sales price, discount price, tax, commissions, fees
Grade
Domain
Standard
AZ College and Career Readiness Standards Explanations & Examples Resources
7 RP 3 A. Analyze proportional relationships and use them to solve real-world and mathematical problems.
Use proportional relationships to solve multistep ratio and percent problems. Examples: simple interest, tax, markups and markdowns, gratuities and commissions, fees, percent increase and decrease, percent error.
Explanations:
The use of proportional relationships is extended to solve percent problems involving sales tax, markups and markdowns, simple interest (I = prt, where I = interest, p = principal, r = rate, and t = time (in years)), gratuities and commissions, fees, percent increase and decrease, and percent error.
Eureka Math: Module 4 Lesson 11, 16 - 18 Big Ideas: Sections:6.3-6.7
6/10/2016 Page 1 of 50

7.MP.1. Make sense of problems and persevere in solving them. 7.MP.2. Reason abstractly and quantitatively. 7.MP.3. Construct viable arguments and critique the reasoning of others. 7.MP.4. Model with mathematics. 7.MP.5. Use appropriate tools strategically. 7.MP.6. Attend to precision. 7.MP.7. Look for and make use of structure. 7.MP.8. Look for and express regularity in repeated reasoning.
Students should be able to explain or show their work using a representation (numbers, words, pictures, physical objects, or equations) and verify that their answer is reasonable. Models help students to identify the parts of the problem and how the values are related. For percent increase and decrease, students identify the starting value, determine the difference, and compare the difference in the two values to the starting value.
Examples:
• After eating at a restaurant, your bill before tax is $52.60. The sales tax rate is 8%. You decide to leave a 20% tip for the waiter based on the pre-tax amount. How much is the tip you leave for the waiter? How much will the total bill be, including tax and tip? Express your solution as a multiple of the bill.
Solution: The amount paid = 0.20 x $52.50 + 0.08 x $52.50 = 0.28 x $52.50.
• Stephanie paid $9.18 for a pair of earrings. This amount
includes a tax of 8%. What was the cost of the item before tax?
Solution: One possible solution path follows: $9.18 represents 100% of the cost of the earrings + 8% of the cost of the earrings. This representation can be expressed as 1.08c = 9.18, where c represents the cost of the earrings. Solving for c gives $8.50 for the cost of the earrings.
• A salesperson set a goal to earn $2,000 in May. He receives a
base salary of $500 as well as a 10% commission for all sales. How much merchandise will he have to sell to meet his goal?
7 EE 3 B. Solve real-life and mathematical problems using numerical and algebraic expressions and equations.
Explanation: Students solve contextual problems and mathematical problems using
Eureka Math: Module 4 Lessons 1-11, 16 and 18
6/10/2016 Page 2 of 50

Solve multi-step real-life and mathematical problems posed with positive and negative rational numbers in any form (whole numbers, fractions, and decimals), using tools strategically. Apply properties of operations to calculate with numbers in any form; convert between forms as appropriate; and assess the reasonableness of answers using mental computation and estimation strategies. For example: If a woman making $25 an hour gets a 10% raise, she will make an additional 1/10 of her salary an hour, or $2.50, for a new salary of $27.50. If you want to place a towel bar 9 3/4 inches long in the center of a door that is 27 1/2 inches wide, you will need to place the bar about 9 inches from each edge; this estimate can be used as a check on the exact computation. 7.MP.1. Make sense of problems and persevere in solving them. 7.MP.2. Reason abstractly and quantitatively. 7.MP.3. Construct viable arguments and critique the reasoning of others. 7.MP.4. Model with mathematics. 7.MP.5. Use appropriate tools strategically. 7.MP.6. Attend to precision. 7.MP.7. Look for and make use of structure. 7.MP.8. Look for and express regularity in repeated reasoning.
rational numbers. Students convert between fractions, decimals, and percents as needed to solve the problem. Students use estimation to justify the reasonableness of answers. Estimation strategies for calculations with fractions and decimals extend from students’ work with whole number operations. Estimation strategies include, but are not limited to:
o front-end estimation with adjusting (using the highest place value and estimating from the front end making adjustments to the estimate by taking into account the remaining amounts),
o clustering around an average (when the values are close together an average value is selected and multiplied by the number of values to determine an estimate),
o rounding and adjusting (students round down or round up and then adjust their estimate depending on how much the rounding affected the original values),
o using friendly or compatible numbers such as factors (students seek to fit numbers together - i.e., rounding to factors and grouping numbers together that have round sums like 100 or 1000), and
o using benchmark numbers that are easy to compute (students select close whole numbers for fractions or decimals to determine an estimate).
Examples:
• Three students conduct the same survey about the number of hours people sleep at night. The results of the number of people who sleep 8 hours a nights are shown below. In which person’s survey did the most people sleep 8 hours?
o Susan reported that 18 of the 48 people she surveyed get 8 hours sleep a night
o Kenneth reported that 36% of the people he surveyed get 8 hours sleep a night
o Jamal reported that 0.365 of the people he surveyed get 8 hours sleep a night
Big Ideas: Sections: 6.1, 6.2 This standard was was taught in Qtr1 and Qtr2
6/10/2016 Page 3 of 50

Solution: In Susan’s survey, the number is 37.5%, which is the greatest percentage.
6/10/2016 Page 4 of 50

7th Grade Math Third Quarter Unit 6: Inequalities
Topic A: Solving Inequalities In Unit 6, students use linear equations and inequalities to solve problems. They continue to use bar diagrams from earlier grades where they see fit but will quickly discover that some problems would more reasonably be solved algebraically (as in the case of large numbers). Guiding students to arrive at this realization on their own develops the need for algebra. This algebraic approach builds upon work in Grade 6 with equations (6.EE.B.6, 6.EE.B.7) to now include multi-step equations and inequalities containing rational numbers (7.EE.B.3, 7.EE.B.4). Students translate word problems into algebraic equations and become proficient at solving inequalities of the form 𝑝𝑝𝑝𝑝 + 𝑞𝑞 > 𝑟𝑟 and 𝑝𝑝𝑝𝑝 + 𝑞𝑞 < 𝑟𝑟, where 𝑝𝑝, 𝑞𝑞, and 𝑟𝑟, are specific rational numbers (7.EE.B.4b). As they become fluent in generating algebraic solutions, students identify the operations, inverse operations, and order of steps, comparing these to an arithmetic solution. Students solve problems involving consecutive numbers, total cost, age comparisons, distance/rate/time, area and perimeter. Solving equations and inequalities with a variable is all about numbers, and students are challenged with the goal of finding the number(s) that makes the equation true. When given in context, students recognize that values exist, and it is simply their job to discover them.
Big Idea:
• Mathematical expressions, equations, inequalities and graphs are used to represent and solve real-world and mathematical problems. • Properties, order of operations, and inverse operations are used to solve equations/inequalities efficiently. • An inequality is a mathematical sentence that compares two expressions. • When one expression has a different value than a related expression, an inequality provides a way to show that relationship between the expressions:
the value of one expression is greater than (or greater than or equal to) the value of the other expression instead of being equal. • Variables may be used to represent a specific number, or, in some situations, to represent all numbers in a specified set. • Solving algebraic equations/inequalities is the process of determining the number(s) that, when substituted for the variable, result in a true sentence. • Inequalities have either infinitely many solutions or no solutions.
Essential Questions:
• What are some possible real-life situations to which there may be more than one solution? • What do inequality symbols represent? • How do the algebraic properties help in solving inequalities? • How does the substitution process help in solving problems? • Why are variables used in inequalities? • What might a variable represent in a given situation?
Vocabulary coefficients, like terms, distributive property, factor, multiplicative property of zero, variable, additive identity, number sentence, equation, solution, inequality, solution set
Grade
Domain
Standard
AZ College and Career Readiness Standards Explanations & Examples Resources
6/10/2016 Page 5 of 50

7 EE 4b B. Solve real-life and mathematical problems using numerical and algebraic expressions and equations. Use variables to represent quantities in a real-world or mathematical problem, and construct simple equations and inequalities to solve problems by reasoning about the quantities.
a. Solve word problems leading to inequalities of the form px + q > r or px + q < r, where p, q, and r are specific rational numbers. Graph the solution set of the inequality and interpret it in the context of the problem. For example: As a salesperson, you are paid $50 per week plus $3 per sale. This week you want your pay to be at least $100. Write an inequality for the number of sales you need to make, and describe the solutions.
7.MP.1. Make sense of problems and persevere in solving them. 7.MP.2. Reason abstractly and quantitatively. 7.MP.3. Construct viable arguments and critique the reasoning of others. 7.MP.4. Model with mathematics. 7.MP.5. Use appropriate tools strategically.
Explanation: In grade 6, students wrote inequalities of the form x > c or x < c to represent a constraint or condition in a real-world or mathematical problem. In grade 7, students extend their understanding of inequalities to model situations that result in inequalities of the form px+q > r or px+q < r. Students explain how they determined whether to write an equation or inequality and the properties of the real number system that they used to find a solution. In contextual problems, students define the variable and use appropriate units. Students solve and graph inequalities and make sense of the inequality in context. Inequalities may have negative coefficients. Problems can be used to find a maximum or minimum value when in context. Students solve real-life problems (MP.1) by modeling them with algebraic equations and inequalities (MP.4). In manipulating these equations and inequalities to generate equivalent expressions, they also reason abstractly and quantitatively (MP.2) and look for and make use of structure (MP.7). Examples:
• Florencia has at most $60 to spend on clothes. She wants to buy a pair of jeans for $22 dollars and spend the rest on t-shirts. Each t-shirt costs $8. Write an inequality for the number of t-shirts she can purchase.
Eureka Math: Module 3 Lessons 12-15 Big Ideas: Sections: 4.1, 4.2, 4.3, 4.4
6/10/2016 Page 6 of 50
7 EE 4b 7.MP.6. Attend to precision.
7.MP.7. Look for and make use of structure.
7.MP.8. Look for and express regularity in repeated reasoning.
Solution: x = cost of one t-shirt 8x + 22 ≤ 60 x = 4.75 - 4 is the most t-shirts she can purchase
• Steven has $25 dollars to spend. He spent $10.81, including
tax, to buy a new DVD. He needs to save $10.00 but he wants to buy a snack. If peanuts cost $0.38 per package including tax, what is the maximum number of packages that Steven can buy?
Solution: x = number of packages of peanuts 25 ≥ 10.81 + 10.00 + 0.38x x = 11.03 Steven can
• Solve: 7 – x > 5.4
Solution: x < 1.6
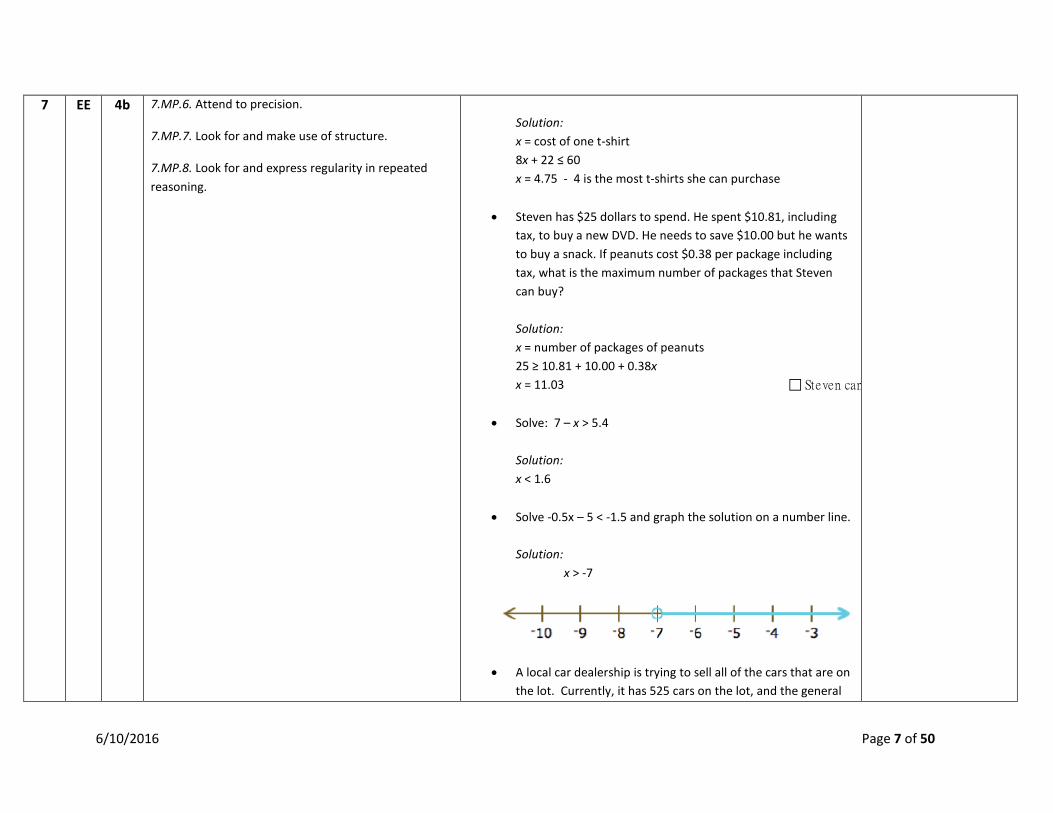
• Solve -0.5x – 5 < -1.5 and graph the solution on a number line.
Solution: x > -7
• A local car dealership is trying to sell all of the cars that are on the lot. Currently, it has 525 cars on the lot, and the general
6/10/2016 Page 7 of 50

manager estimates that they will consistently sell 50 cars per week. Estimate how many weeks it will take for the number of cars on the lot to be less than 75. Write an inequality that can be used to find the number of w full weeks, graph the solution and interpret the solution in the context of the problem. Solution: Let w = the number of full weeks
The dealership can sell 50 cars per week for more than 9 weeks to have less than 75 cars remaining on the lot.
• The carnival owner pays the owner of an exotic animal exhibit $650 for the entire time the exhibit is displayed. The owner of the exhibit has no other expenses except for a daily insurance cost. If the owner of the animal exhibit wants to make more than $500 in profits for the 5 ½ days, what is the greatest daily insurance rate he can afford to pay? Solution: Let i= the daily insurance cost
6/10/2016 Page 8 of 50

The maximum daily cost the owner can pay for insurance is $27.27.
• Steven has $25 dollars. He spent $10.81, including tax, to buy a new DVD. He needs to set aside $10.00 to pay for his lunch next week. If peanuts cost $0.38 per package including tax, what is the maximum number of packages that Steven can buy? Write an equation or inequality to model the situation. Explain how you determined whether to write an equation or inequality and the properties of the real number system that you used to find a solution.
6/10/2016 Page 9 of 50

7th Grade Math Third Quarter
Unit 7: Scale Drawings – Ratios, Rates and Percents (2 weeks) Topic A: Ratios of Scale Drawings
In Unit 7, students bring the sum of their experience with proportional relationships to the context of scale drawings (7.RP.2b, 7.G.1). Given a scale drawing, students rely on their background in working with side lengths and areas of polygons (6.G.1, 6.G.3) as they identify the scale factor as the constant of proportionality, calculate the actual lengths and areas of objects in the drawing, and create their own scale drawings of a two-dimensional view of a room or building. Students then extend this knowledge to represent the scale factor as a percent. Students construct scale drawings, finding scale lengths and areas given the actual quantities and the scale factor as a percent (and vice-versa). Students are encouraged to develop multiple methods for making scale drawings. Students may find the multiplicative relationship between figures; they may also find a multiplicative relationship among lengths within the same figure.
Big Idea: • Scale drawings can be applied to problem solving situations involving geometric figures. • Geometrical figures can be used to reproduce a drawing at a different scale.
Essential Questions:
• How do you use scale drawings to compute actual lengths and area? • How can you use geometric figures to reproduce a drawing at a different scale? • How do you determine the scale factor? • What does the scale factor tell you about the relationship between the actual picture and the scale drawings?
Vocabulary Proportional to, proportional relationship, constant of proportionality, one-to-one correspondence, scale drawing, scale factor, (ratio, rate, unit rate, equivalent ratio, reduction, enlargement, scalar
Grade
Domain
Standard
AZ College and Career Readiness Standards Explanations & Examples Resources
7 G 1 A. Draw, construct, and describe geometrical figures and describe the relationships between them. Solve problems involving scale drawings of geometric figures, including computing actual lengths and areas from a scale drawing and reproducing a scale drawing at a different scale. 7.MP.1. Make sense of problems and persevere in solving them.
Explanation: This standard focuses on the importance of visualization in the understanding of Geometry. Being able to visualize and then represent geometric figures on paper is essential to solving geometric problems. Scale drawings of geometric figures connect understandings of proportionality to geometry and lead to future work in similarity and congruence. As an introduction to scale drawings in geometry, students should be given the opportunity to explore scale factor as the number of times you multiply the measure of one object to obtain the
Eureka Math: Module 1 Lessons 16-22 Module 4 Lessons 12-15 Big Ideas: Sections: 7.5
6/10/2016 Page 10 of 50

7.MP.2. Reason abstractly and quantitatively. 7.MP.3. Construct viable arguments and critique the reasoning of others. 7.MP.4. Model with mathematics. 7.MP.5. Use appropriate tools strategically. 7.MP.6. Attend to precision. 7.MP.7. Look for and make use of structure. 7.MP.8. Look for and express regularity in repeated reasoning.
measure of a similar object. It is important that students first experience this concept concretely progressing to abstract contextual situations. Students determine the dimensions of figures when given a scale and identify the impact of a scale on actual length (one-dimension) and area (two-dimensions). Students identify the scale factor given two figures. Using a given scale drawing, students reproduce the drawing at a different scale. Students understand that the lengths will change by a factor equal to the product of the magnitude of the two size transformations. Initially, measurements should be in whole numbers, progressing to measurements expressed with rational numbers. Examples:
• Julie shows the scale drawing of her room below. If each 2 cm on the scale drawing equals 5 ft, what are the actual dimensions of Julie’s room? Reproduce the drawing at 3 times its current size.
6/10/2016 Page 11 of 50

• If the rectangle below is enlarged using a scale factor of 1.5, what will be the perimeter and area of the new rectangle?
• Solution:
The perimeter is linear or one-dimensional. Multiply the perimeter of the given rectangle (18 in.) by the scale factor (1.5) to give an answer of 27 in. Students could also increase the length and width by the scale factor of 1.5 to get 10.5 in. for the length and 3 in. for the width. The perimeter could be found by adding 10.5 + 10.5 + 3 + 3 to get 27 in. The area is two-dimensional so the scale factor must be squared. The area of the new rectangle would be 14 x 1.52 or 31.5 in2.
• The city of St. Louis is creating a welcome sign on a billboard
for visitors to see as they enter the city. The following picture needs to be enlarged so that ½ inch represents 7 feet on the actual billboard. Will it fit on a billboard that measures 14 feet in height?
Solution: Yes, the drawing measures 1 inch in height, which corresponds to 14 feet on the actual billboard.
• Chris is building a rectangular pen for his dog. The dimensions
6/10/2016 Page 12 of 50

are 12 units long and 5 units wide.
Chris is building a second pen that is 60% the length of the original and 125% the width of the original. Write equations to determine the length and width of the second pen. Solution:
• What percent of the area of the large disk lies outside the smaller disk?
6/10/2016 Page 13 of 50

Solution:
7 RP 2b A. Analyze proportional relationships and use them to solve real-world and mathematical problems. Recognize and represent proportional relationships between quantities.
Explanation: In this unit, students learn the term scale factor and recognize it as the constant of proportionality. The scale factor is also represented as a percentage.
Eureka Math: Module 1 Lessons 16-22 Module 4 Lessons 12-15 Module 1 Lesson 20 could be used as a project for
6/10/2016 Page 14 of 50

b. Identify the constant of proportionality (unit rate) in tables, graphs, equations, diagrams, and verbal descriptions of proportional relationships.
Examples:
• Nicole is running for school president and her best friend designed her campaign poster which measured 3 feet by 2 feet. Nicole liked the poster so much she reproduced the artwork on rectangular buttons measuring 2 inches by 1 1/3 inches. What is the scale factor? Solution: The scale factor is 1/18.
• Use a ruler to measure and find the scale factor.
Actual:
Scale Drawing:
Solution: The scale factor is 5/3
the unit. Big Ideas: Sections: 7.5
8 EE 6 B. Understand the connections between proportional relationships, lines, and linear equations
Use similar triangles to explain why the slope m is the same between any two distinct points on a non-vertical
Explanation: Triangles are similar when there is a constant rate of proportionality between them. Using a graph, students construct triangles between two points on a line and compare the sides to understand that the slope (ratio of rise to run) is the same between any two points on a line. This is illustrated below.
8th Gr. Eureka Math: Module 4 Lessons 15-19 8th Gr. Big Ideas: Sections: 4.2, Extension 4.2, 4.3, 4.4, 4.5
6/10/2016 Page 15 of 50

line in the coordinate plane; derive the equation y = mx for a line through the origin and the equation y = mx + b for a line intercepting the vertical axis at b.
8.MP.2. Reason abstractly and quantitatively. 8.MP.3. Construct viable arguments and critique the reasoning of others. 8.MP.4. Model with mathematics. 8.MP.5. Use appropriate tools strategically. 8.MP.7. Look for and make use of structure. 8.MP.8. Look for and express regularity in repeated reasoning.
The triangle between A and B has a vertical height of 2 and a horizontal length of 3. The triangle between B and C has a vertical height of 4 and a horizontal length of 6. The simplified ratio of the vertical height to the horizontal length of both triangles is 2 to 3, which also represents a slope of 2/3 for the line, indicating that the triangles are similar. Given an equation in slope-intercept form, students graph the line represented. The following is a link to a video that derives y = mx + b using similar triangles: https://learnzillion.com/lessons/1473-derive-ymxb-using-similar-triangles Examples:
• Show, using similar triangles, why the graph of an equation of the form y = mx is a line with slope m. Solution: Solutions will vary. A sample solution is below.
6/10/2016 Page 16 of 50

The line shown has a slope of 2. When we compare the corresponding side lengths of the similar triangles we have the ratios 2
1= 4
2= 2 . In general, the ratios would be 𝑥𝑥
1= 𝑦𝑦
𝑚𝑚
equivalently y = mx, which is a line with slope m.
• Graph the equation 𝑦𝑦 = 23𝑝𝑝 + 1. Name the slope and y-
intercept. Solution: The slope of the line is 2/3 and the y-intercept is (0.1)
6/10/2016 Page 17 of 50

6/10/2016 Page 18 of 50

7th Grade Math Third Quarter
Unit 7: Geometry (8 weeks) Topic A: Angle Relationships and Triangles
In Topic A, students solve for unknown angles. The supporting work for unknown angles began in Grade 4 (4.MD.C.5–7), where all of the key terms in this Topic were first defined, including: adjacent, vertical, complementary, and supplementary angles, angles on a line, and angles at a point. In Grade 4, students used those definitions as a basis to solve for unknown angles by using a combination of reasoning (through simple number sentences and equations), and measurement (using a protractor). For example, students learned to solve for a missing angle in a pair of supplementary angles where one angle measurement is known. In Grade 7, students study how expressions and equations are an efficient way to solve missing angle problems. The most challenging examples of unknown angle problems (both diagram-based and verbal) require students to use a synthesis of angle relationships and algebra. The problems are multi-step, requiring students to identify several layers of angle relationships and to fit them with an appropriate equation to solve. Unknown angle problems show students how to look for, and make use of, structure (MP.7). In this case, they use angle relationships to find the measurement of an angle. Next, students work extensively with a ruler, compass, and protractor to construct geometric shapes, mainly triangles (7.G.A.2). The use of a compass is new (e.g., how to hold it, and to how to create equal segment lengths). Students use the tools to build triangles, provided given conditions, such side length and the measurement of the included angle (MP.5). Students also explore how changes in arrangement and measurement affect a triangle, culminating in a list of conditions that determine a unique triangle. Students understand two new concepts about unique triangles. They learn that under a condition that determines a unique triangle: (1) a triangle can be drawn and (2) any two triangles drawn under the condition will be identical. It is important to note that there is no mention of congruence in the CCSS until Grade 8, after a study of rigid motions. Rather, the focus of Topic A is developing students’ intuitive understanding of the structure of a triangle. This includes students noticing the conditions that determine a unique triangle, more than one triangle, or no triangle (7.G.A.2). Understanding what makes triangles unique requires understanding what makes them identical.
Big Idea:
• Real world and geometric structures are composed of shapes and spaces with specific properties. • Shapes are defined by their properties. • Equations can be used to represent angle relationships. • Parallel lines cut by a transversal create angles with specific relationships. • There are certain relationships between the sides and angles of a triangle.
Essential Questions:
• How are specific characteristics and a classification system useful in analyzing and designing structures? • How does our understanding of geometry help us to describe real-world objects? • How is Algebra applied when solving geometric problems? • What is the relationship between supplementary and complementary angles? • How can relationships between angles help to solve real-life problems? • What characteristics do triangles have? • What conditions on a triangle determine a unique triangle?
Vocabulary Angle, supplementary angles, vertical angles, adjacent angles, complementary angles, protractor, geometric construction, parallel, perpendicular, ray, vertex, triangle correspondence, included angle/side, parallelogram, interior angles, exterior angles
6/10/2016 Page 19 of 50

Grade
Domain
Standard
AZ College and Career Readiness Standards Explanations & Examples Resources
7 G 2 A. Draw, construct, and describe geometrical figures and describe the relationships between them. Draw (freehand, with ruler and protractor, and with technology) geometric shapes with given conditions. Focus on constructing triangles from three measures of angles or sides, noticing when the conditions determine a unique triangle, more than one triangle, or no triangle. 7.MP.4. Model with mathematics. 7.MP.5. Use appropriate tools strategically. 7.MP.6. Attend to precision. 7.MP.7. Look for and make use of structure. 7.MP.8. Look for and express regularity in repeated reasoning.
Explanation: Constructions are introduced in this unit. Students have no prior experience with using a compass. Students draw geometric shapes with given parameters. Parameters could include parallel lines, angles, perpendicular lines, line segments, etc. Students use constructions to understand the characteristics of angles and side lengths that create a unique triangle, more than one triangle or no triangle. In this unit, students choose appropriate tools (MP.5) to create constructions with various constraints. Investigating and describing the relationships among geometrical figures requires that students look for and make use of structure (MP.7) as they construct and critique arguments (MP.3) that summarize and apply those relationships. Examples:
• Draw a quadrilateral with one set of parallel sides and no right angles.
• Can a triangle have more than one obtuse angle? Explain your
reasoning.
• Will three sides of any length create a triangle? Explain how you know which will work. Possibilities to examine are:
a. 13 cm, 5 cm, and 6 cm b. 3 cm, 3cm, and 3 cm c. 2 cm, 7 cm, 6 cm
Solution: “a” above will not work; “b” and “c” will work. Students recognize that the sum of the two smaller sides must be larger
Eureka Math: Module 6 Lessons 5-15 Big Ideas: Sections: 7.3, Extension 7.3, 7.4
6/10/2016 Page 20 of 50
than the third side.
• Is it possible to draw a triangle with a 90˚ angle and one leg that is 4 inches long and one leg that is 3 inches long? If so, draw one. Is there more than one such triangle? Note: The Pythagorean Theorem is NOT expected – this is an exploration activity only
• Draw a triangle with angles that are 60 degrees. Is this a
unique triangle? Why or why not?
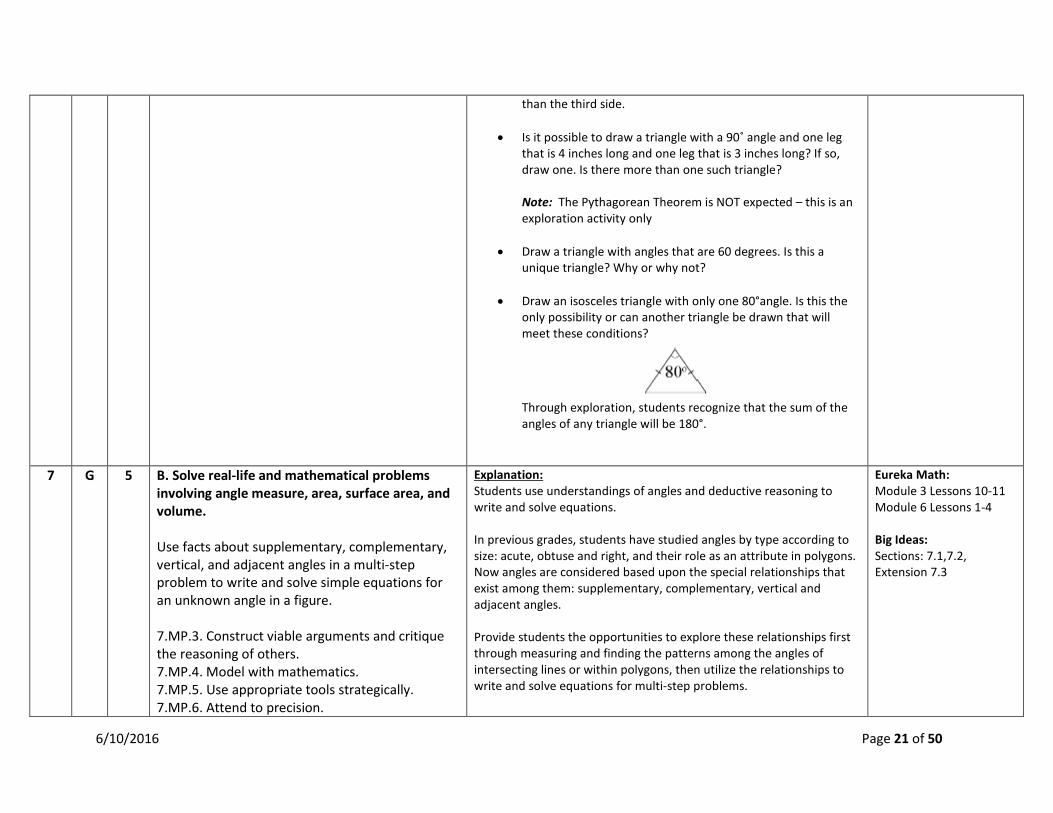
• Draw an isosceles triangle with only one 80°angle. Is this the only possibility or can another triangle be drawn that will meet these conditions?
Through exploration, students recognize that the sum of the angles of any triangle will be 180°.
7 G 5 B. Solve real-life and mathematical problems involving angle measure, area, surface area, and volume. Use facts about supplementary, complementary, vertical, and adjacent angles in a multi-step problem to write and solve simple equations for an unknown angle in a figure. 7.MP.3. Construct viable arguments and critique the reasoning of others. 7.MP.4. Model with mathematics. 7.MP.5. Use appropriate tools strategically. 7.MP.6. Attend to precision.
Explanation: Students use understandings of angles and deductive reasoning to write and solve equations. In previous grades, students have studied angles by type according to size: acute, obtuse and right, and their role as an attribute in polygons. Now angles are considered based upon the special relationships that exist among them: supplementary, complementary, vertical and adjacent angles. Provide students the opportunities to explore these relationships first through measuring and finding the patterns among the angles of intersecting lines or within polygons, then utilize the relationships to write and solve equations for multi-step problems.
Eureka Math: Module 3 Lessons 10-11 Module 6 Lessons 1-4 Big Ideas: Sections: 7.1,7.2, Extension 7.3
6/10/2016 Page 21 of 50
7.MP.7. Look for and make use of structure. Examples:
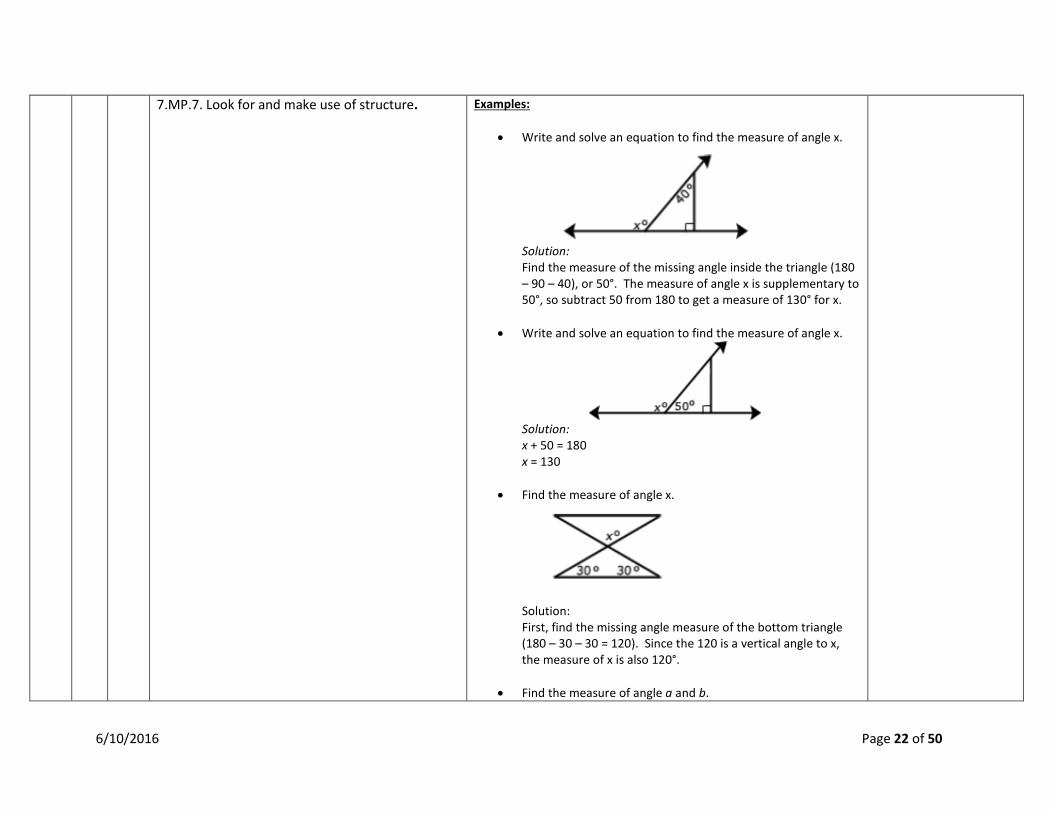
• Write and solve an equation to find the measure of angle x.
Solution: Find the measure of the missing angle inside the triangle (180 – 90 – 40), or 50°. The measure of angle x is supplementary to 50°, so subtract 50 from 180 to get a measure of 130° for x.
• Write and solve an equation to find the measure of angle x.
Solution: x + 50 = 180 x = 130
• Find the measure of angle x.
Solution: First, find the missing angle measure of the bottom triangle (180 – 30 – 30 = 120). Since the 120 is a vertical angle to x, the measure of x is also 120°.
• Find the measure of angle a and b.
6/10/2016 Page 22 of 50

Note: Not drawn to scale. Solution: Because, the 45°, 50° angles and b form are supplementary angles, the measure of angle b would be 85°. The measures of the angles of a triangle equal 180° so 75° + 85°+ a = 180°. The measure of angle a would be 20°.
• Write and solve the equations to find the measure of s and t.
Solution:
The measure of angle t is 11◦ and the measure of angle s is 71◦
6/10/2016 Page 23 of 50

• In a complete sentence, describe the angle relationships in the
diagram. Then, write an equation for the angle relationship shown in the figure and solve for x.
Solution:
6/10/2016 Page 24 of 50

7th Grade Math Third Quarter
Unit 7: Geometry Topic B: 2D Shapes
Students continue work with geometry as they use equations and expressions to study area and perimeter. In this topic, students derive the formula for area of a circle by dividing a circle of radius 𝑟𝑟 into pieces of pi and rearranging the pieces so that they are lined up, alternating direction, and form a shape that resembles a rectangle. This “rectangle” has a length that is 1
2 the circumference and a width of 𝑟𝑟. Students determine that the area of this rectangle (reconfigured from a circle of the same area) is the product of its length and
its width: 12𝐶𝐶 ∙ 𝑟𝑟 = 1
22𝜋𝜋𝑟𝑟 ∙ 𝑟𝑟 = 𝜋𝜋𝑟𝑟2 (7.G.B.4). The precise definitions for diameter, circumference, pi, and circular region or disk will be developed during this topic with significant
time being devoted to student understanding of each term. In addition to representing this value with the 𝜋𝜋 symbol, the fraction and decimal approximations allow for students to continue to practice their work with rational number operations. Students expand their knowledge of finding areas of composite figures on a coordinate plane (6.G.A.1) to include circular regions.
Big Idea:
• Real world and geometric structures are composed of shapes and spaces with specific properties. • Shapes are defined by their properties. • Shapes have a purpose for designing structures. • Figures can be composed of and deconstructed into smaller, simpler figures. • Attributes of objects and shapes can be uniquely measured in a variety of ways, using a variety of tools, for a variety of purposes.
Essential Questions:
• How are specific characteristics and a classification system useful in analyzing and designing structures? • How does our understanding of geometry help us to describe real-world objects? • How is algebra applied when solving geometric problems? • What is the relationship between the circumference and area of a circle? Why does it have that relationship? • How do I find the measure of a figure for which I don't have a formula?
Vocabulary Two dimensional, area, perimeter, inscribed, circumference, radius, diameter, pi, compose, decompose, semi-circle
Grade
Domain
Standard
AZ College and Career Readiness Standards Explanations & Examples Resources
7 G 4 B. Solve real-life and mathematical problems involving angle measure, area, surface area, and volume.
Explanation: This is the students’ initial work with circles. Knowing that a circle is created by connecting all the points equidistant from a point (center) is essential to understanding the relationships between radius, diameter,
Eureka Math: Module 3 Lessons 16-20 Big Ideas:
6/10/2016 Page 25 of 50
Know the formulas for the area and circumference of a circle and use them to solve problems; give an informal derivation of the relationship between the circumference and area of a circle. 7.MP.1. Make sense of problems and persevere in solving them. 7.MP.2. Reason abstractly and quantitatively. 7.MP.3. Construct viable arguments and critique the reasoning of others. 7.MP.4. Model with mathematics. 7.MP.5. Use appropriate tools strategically. 7.MP.6. Attend to precision. 7.MP.7. Look for and make use of structure. 7.MP.8. Look for and express regularity in repeated reasoning.
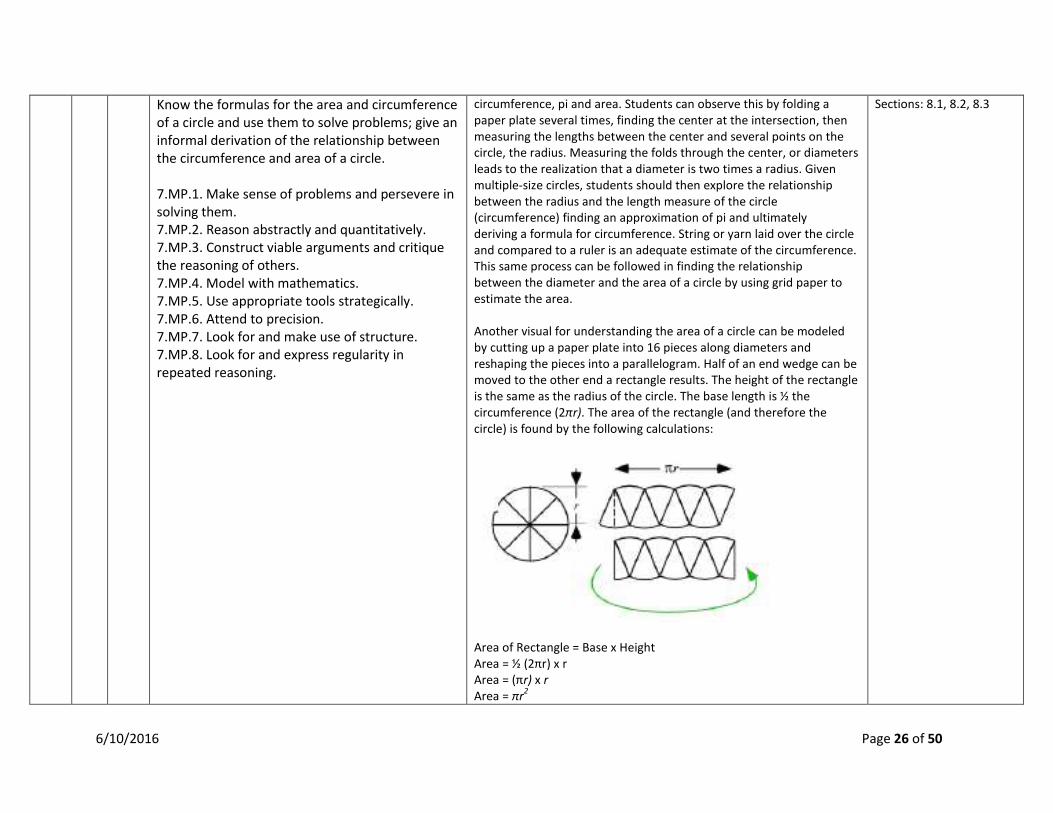
circumference, pi and area. Students can observe this by folding a paper plate several times, finding the center at the intersection, then measuring the lengths between the center and several points on the circle, the radius. Measuring the folds through the center, or diameters leads to the realization that a diameter is two times a radius. Given multiple-size circles, students should then explore the relationship between the radius and the length measure of the circle (circumference) finding an approximation of pi and ultimately deriving a formula for circumference. String or yarn laid over the circle and compared to a ruler is an adequate estimate of the circumference. This same process can be followed in finding the relationship between the diameter and the area of a circle by using grid paper to estimate the area. Another visual for understanding the area of a circle can be modeled by cutting up a paper plate into 16 pieces along diameters and reshaping the pieces into a parallelogram. Half of an end wedge can be moved to the other end a rectangle results. The height of the rectangle is the same as the radius of the circle. The base length is ½ the circumference (2πr). The area of the rectangle (and therefore the circle) is found by the following calculations:
Area of Rectangle = Base x Height Area = ½ (2πr) x r Area = (πr) x r Area = πr2
Sections: 8.1, 8.2, 8.3
6/10/2016 Page 26 of 50
Area of Circle = πr2 In figuring area of a circle, the squaring of the radius can also be explained by showing a circle inside a square. Again, the formula is derived and then learned. After explorations, students should then solve problems, set in relevant contexts, using the formulas for area and circumference. “Know the formula” does not mean memorization of the formula. To “know” means to have an understanding of why the formula works and how the formula relates to the measure (area and volume) and the figure. This understanding should be for all students. Building on these understandings, students generate the formulas for circumference and area. Students solve problems (mathematical and real-world) involving circles or semi-circles. Students build on their understanding of area from 6th grade to find the area of left-over materials when circles are cut from squares and triangles or when squares and triangles are cut from circles. Note: Because pi is an irrational number that neither repeats nor terminates, the measurements are approximate when 3.14 is used in place of π. Examples:
• The seventh grade class is building a mini golf game for the school carnival. The end of the putting green will be a circle. If the circle is 10 feet in diameter, how many square feet of grass carpet will they need to buy to cover the circle? How might you communicate this information to the salesperson to make sure you receive a piece of carpet that is the correct size? (Use 3.14 for pi)
Solution: Area = πr2
6/10/2016 Page 27 of 50
Area = 3.14 (5)2 Area ≈ 78.5 ft2 To communicate this information, ask for a 9 ft by 9 ft square of carpet.
• Students measure the circumference and diameter of several circular objects in the room (clock, trash can, door knob, wheel, etc.). Students organize their information and discover the relationship between circumference and diameter by noticing the pattern in the ratio of the measures. Students write an expression that could be used to find the circumference of a circle with any diameter and check their expression on other circles.
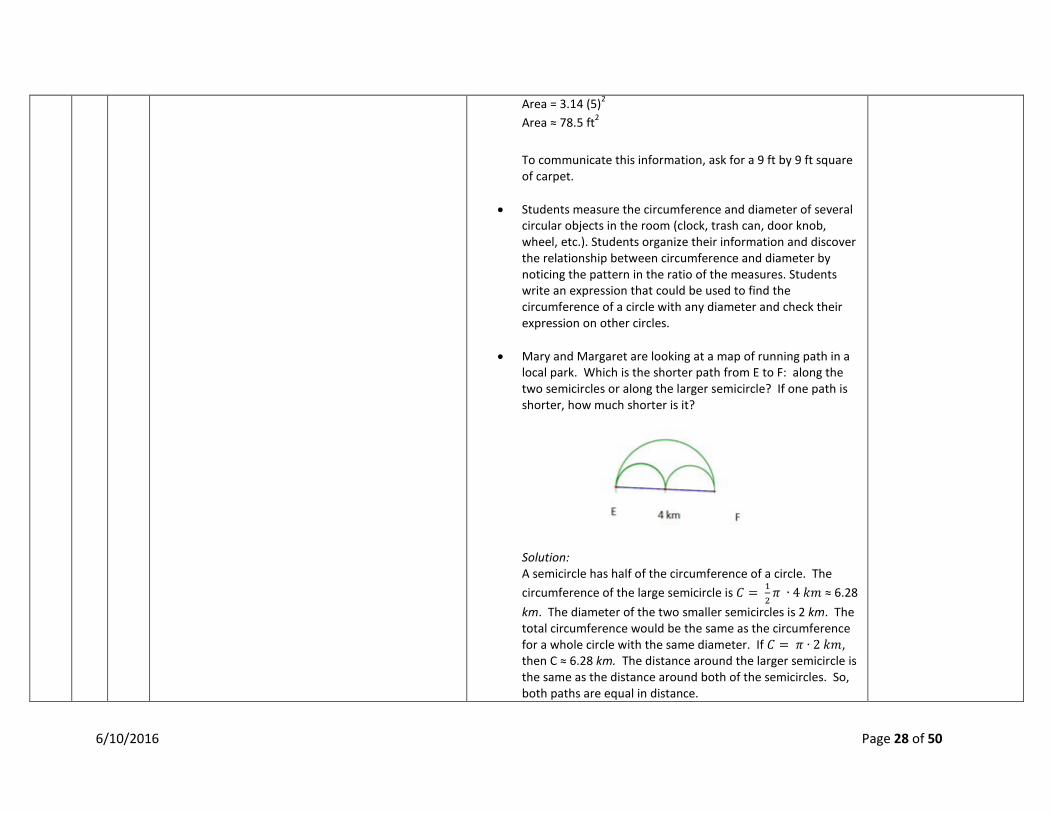
• Mary and Margaret are looking at a map of running path in a local park. Which is the shorter path from E to F: along the two semicircles or along the larger semicircle? If one path is shorter, how much shorter is it?
Solution: A semicircle has half of the circumference of a circle. The circumference of the large semicircle is 𝐶𝐶 = 1
2𝜋𝜋 ∙ 4 𝑘𝑘𝑘𝑘 ≈ 6.28
km. The diameter of the two smaller semicircles is 2 km. The total circumference would be the same as the circumference for a whole circle with the same diameter. If 𝐶𝐶 = 𝜋𝜋 ∙ 2 𝑘𝑘𝑘𝑘, then C ≈ 6.28 km. The distance around the larger semicircle is the same as the distance around both of the semicircles. So, both paths are equal in distance.
6/10/2016 Page 28 of 50

Note: Make a point of telling students that an answer in exact form is in terms of π, not substituting an approximation of pi.
• Suzanne is making a circular table out of a square piece of
wood. The radius of the circle that she is cutting is 3 feet. How much waste will she have for this project? Express your answer to the nearest square foot. Draw a diagram to assist you in solving the problem. What does the distance 3 feet represent in this problem? What information is needed to solve the problem? Does your solution answer the problem as stated? Solution:
o 3 feet represents the radius of the circular table. o The area of the circle and the area of the square are
needed so that we can subtract the area of the circle from the area of the square to determine the amount of waste. The waste will be the area left over from the square after cutting out the circular region. Area of Square: We need the side length; the side length is equal to the diameter of the circle which is twice the radius of the circle which equals 6 feet. The area of a square is found by squaring the side length; so, A = 6 ft ∙ 6 ft = 36 ft2 . Area of Circle: We need the radius; the radius is given as 3 feet. The area of a circle is πr2. So, the
6/10/2016 Page 29 of 50

area is π ∙ (3 ft )2 = 9π ft2 ≈ 28.26 ft2. The amount of waste will be the difference between the area of the square and the area of the circle; so, 36 ft2 - 28.26 ft2 ≈ 7.74 ft2.
o The amount of waste Suzanne will have for this project is 7.74 ft2. This answers the question asked.
• Find the area in the rectangle between the two quarter circles
if AF = 7 ft, FB = 9 ft, and HD = 7 ft. Use 𝜋𝜋 ≈ 227
.
Solution: The area between the quarter circles can be found by subtracting the area of the two quarter circles from the area of the rectangle. The area of the rectangle is the product of the lengths of the sides. Side AB has a length of 16 ft and Side AD has a length of 14 ft. The area of the rectangle is A= 16 ft ∙ 14 ft = 224 ft2. The area of the two quarter circles is the same as the area of a semicircle, which is half the area of a circle.
𝐴𝐴 ≈12∙ 𝜋𝜋 ∙ 𝑟𝑟2
𝐴𝐴 ≈12∙
227∙ (7𝑓𝑓𝑓𝑓)2
𝐴𝐴 ≈12∙
227∙ 49𝑓𝑓𝑓𝑓2
𝐴𝐴 ≈ 77𝑓𝑓𝑓𝑓2
6/10/2016 Page 30 of 50

The area between the two quarter circles is 224 ft2 – 77 ft2 = 147 ft2.
• Find the area of the shaded region using π ≈ 3.14
area of the triangle + area of the semicircle = area of the shaded region
The area is approximately 81.12 cm2.
7 G 6 B. Solve real-life and mathematical problems involving angle measure, area, surface area, and volume. Solve real-world and mathematical problems involving area, volume and surface area of two- and three-dimensional objects composed of triangles, quadrilaterals, polygons, cubes, and right prisms. 7.MP.1. Make sense of problems and persevere in solving them.
Explanation: Students continue work from 5th and 6th grade to work with area of two- dimensional figures (composite shapes). At this level, students determine the dimensions of the figures given the area. Examples:
• The Smith family is renovating a few aspects of their home. The following diagram is of a new kitchen countertop. Approximately how many square feet of counter space is there?
Eureka Math: Module 6 Lessons 20-22 Big Ideas: Sections: 8.4
6/10/2016 Page 31 of 50

7.MP.2. Reason abstractly and quantitatively. 7.MP.3. Construct viable arguments and critique the reasoning of others. 7.MP.4. Model with mathematics. 7.MP.5. Use appropriate tools strategically. 7.MP.6. Attend to precision.
The total area of counter space in square inches:
The total area of counter space in square feet:
There is approximately 13.1 ft2 of counter space.
• Patty is interested in expanding her backyard garden.
Currently, the garden plot has a length of 4 ft and a width of 3 ft. Patty plans on extending the length of the plot by 3ft and the width by 2 ft. Draw a diagram that shows the change in dimension and area of Patty’s garden as she expands it. The diagram should show the original garden as well as the expanded garden.
6/10/2016 Page 32 of 50
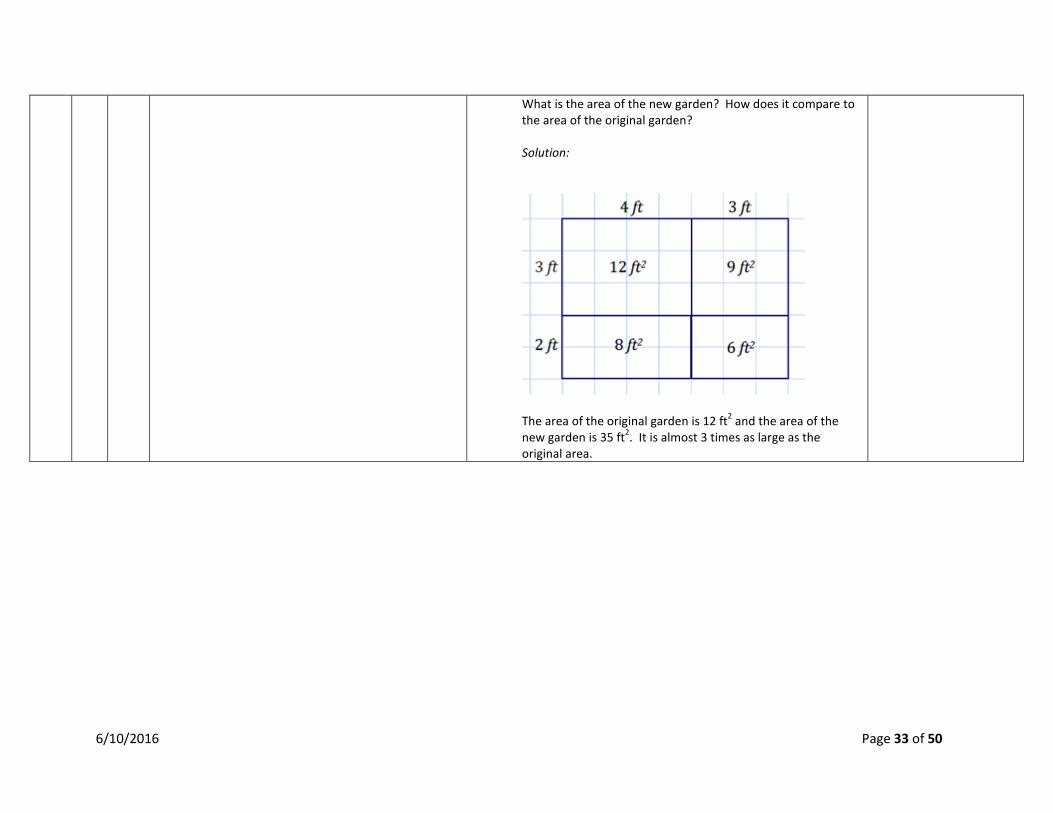
What is the area of the new garden? How does it compare to the area of the original garden? Solution:
The area of the original garden is 12 ft2 and the area of the new garden is 35 ft2. It is almost 3 times as large as the original area.
6/10/2016 Page 33 of 50

Accelerated 7th Grade Math Third Quarter Unit 7: Geometry
Topic C: 3-D figures – Surface Area and Volume Students build upon their work in Grade 6 with surface area and nets to understand that surface area is simply the sum of the area of the lateral faces and the base(s) (6.G.A.4). In Grade 7, they continue to solve real-life and mathematical problems involving surface area and volume of prisms, e.g., rectangular, triangular, focusing on problems that involve fractional values for length (7.G.B.6). Topic C introduces the idea of a slice (or cross section) of a three-dimensional figure. Students explore the two-dimensional figures that result from taking slices of right rectangular prisms and right rectangular pyramids parallel to the base, parallel to a lateral face, and slices that are not parallel to the base nor lateral face, but are skewed slices (7.G.A.3). The goal of the first three lessons is to get students to consider three-dimensional figures from a new perspective. The subjects of surface area and volume in this topic are not new to students, but provide opportunities for students to expand their knowledge by working with challenging applications. In Grade 6, students verified that the volume of a right rectangular prism is the same whether it is found by packing it with unit cubes or by multiplying the edge lengths of the prism (6.G.A.2). In Grade 7, the volume formula 𝑉𝑉 = 𝐵𝐵ℎ, where 𝐵𝐵 represents the area of the base, will be tested on a set of three-dimensional figures that extends beyond right rectangular prisms to right prisms in general. Students will apply their previous knowledge to the learning of the volume formulas for cones, cylinders, and spheres (8.G.C.9). In Grade 6, students practiced composing and decomposing two-dimensional shapes into shapes they could work with to determine area (6.G.A.1). Now, they learn to apply this skill to volume as well. The most challenging problems in these topics are not pure area or pure volume questions, but problems that incorporate a broader mathematical knowledge such as rates, ratios, and unit conversion. It is this use of multiple skills and contexts that distinguishes real-world problems from purely mathematical ones (7.G.B.6).
Big Idea:
• Real world and geometric structures are composed of shapes and spaces with specific properties. • Shapes are defined by their properties. • Shapes have a purpose for designing structures. • Three-dimensional figures have relationships to specific two-dimensional figures. • Planes that cut polyhedra create related two-dimensional figures. • Attributes of objects, shapes, and solids can be uniquely measured in a variety of ways, using a variety of tools, for a variety of purposes. • Three-dimensional objects with curved surfaces can be described, classified, and analyzed by their attributes. These attributes are useful in solving
problems involving or modeled by these objects.
Essential Questions:
• How are forms and objects created or represented? • How are specific characteristics and a classification system useful in analyzing and designing structures? • How does our understanding of geometry help us to describe real-world objects? • What is the relationship between 2-dimensional shapes, 3-dimensional shapes and our world? • How are cross sections of solid figures used to solve real-life problems? • How do I find the measure of a figure for which I don't have a formula? • How do we determine the volume of objects with curved surfaces? • What attributes of three-dimensional objects are important to be able to measure and quantify? Why?
Vocabulary Three dimensional, pyramids, prism, cross sections, planar section, face, base, surface area, volume, vertex, right triangular prism, right rectangular pyramid, compose, decompose, volume, cylinder, cone, sphere
6/10/2016 Page 34 of 50

Grade
Domain
Standard
AZ College and Career Readiness Standards Explanations & Examples Resources
7 G 3 A. Draw, construct, and describe geometrical figures and describe the relationships between them. Describe the two-dimensional figures that result from slicing three- dimensional figures, as in plane sections of right rectangular prisms and right rectangular pyramids. 7.MP.2. Reason abstractly and quantitatively. 7.MP.4. Model with mathematics. 7.MP.5. Use appropriate tools strategically. 7.MP.7. Look for and make use of structure.
Explanation: This cluster focuses on the importance of visualization in the understanding of Geometry. Being able to visualize and then represent geometric figures on paper is essential to solving geometric problems. Students need to describe the resulting face shape from cuts made parallel and perpendicular to the bases of right rectangular prisms and pyramids. Cuts made parallel will take the shape of the base; cuts made perpendicular will take the shape of the lateral (side) face. Cuts made at an angle through the right rectangular prism will produce a parallelogram;
If the pyramid is cut with a plane (green) parallel to the base, the intersection of the pyramid and the plane is a square cross section (red).
Eureka Math: Module 6 Lessons 16-19 Big Ideas: Sections: Extension 9.5
6/10/2016 Page 35 of 50

If the pyramid is cut with a plane (green) passing through the top vertex and perpendicular to the base, the intersection of the pyramid and the plane is a triangular cross section (red).
6/10/2016 Page 36 of 50
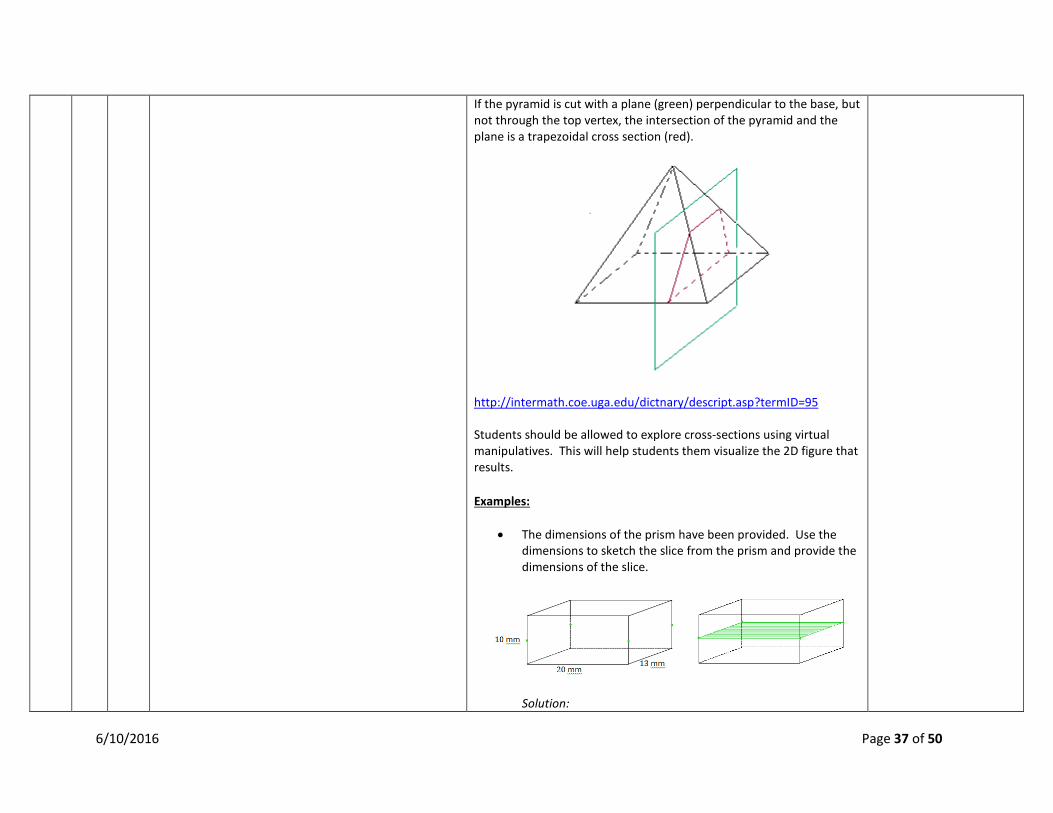
If the pyramid is cut with a plane (green) perpendicular to the base, but not through the top vertex, the intersection of the pyramid and the plane is a trapezoidal cross section (red).
http://intermath.coe.uga.edu/dictnary/descript.asp?termID=95 Students should be allowed to explore cross-sections using virtual manipulatives. This will help students them visualize the 2D figure that results. Examples:
• The dimensions of the prism have been provided. Use the dimensions to sketch the slice from the prism and provide the dimensions of the slice.
Solution:
6/10/2016 Page 37 of 50

• The right rectangular prism has been sliced with a plane
perpendicular to BCEH. Label the vertices of the figure defined by the slice as WXYZ.
o What is the shape of this figure? How do you know? o To which other face is the slice perpendicular? o What is the length of ZY?
Solution:
The slice is a rectangle. Since the slice was made perpendicular to BCEH, we know that ∠𝑝𝑝 𝑎𝑎𝑎𝑎𝑎𝑎 ∠𝑦𝑦 are right angles. Since ∠𝑝𝑝 is a right angle, we know that WX must be perpendicular to face BCEH. WX lies in face ABCD, which is perpendicular to both BCEH and to ADFG, so WX is perpendicular to ABCD. This means that WX must also be perpendicular to WZ. A similar argument can be made for ∠𝑦𝑦 of the slice, making all four angles of WXYZ right angles and making WXYZ a rectangle. The slice is perpendicular to the face ADFG and the length of ZY is 6 inches.
6/10/2016 Page 38 of 50

• Can a right rectangular pyramid be sliced at an angle so that the resulting slice looks like the figure below? If it is possible, draw an example of such a slice in the following pyramid.
Solution: Yes, the figure can be the result of slicing a rectangular pyramid at an angle as seen below.
7 G 6 B. Solve real-life and mathematical problems involving angle measure, area, surface area, and volume. Solve real-world and mathematical problems involving area, volume and surface area of two- and three-dimensional objects composed of triangles,
Explanation: Students continue work from 5th and 6th grade to work with area, volume and surface area of two- dimensional and three-dimensional objects (composite shapes). Students will work with right prisms and right pyramids; however, they will not work with cylinders, as circles are not polygons. At this level, students determine the dimensions of the figures given the area or volume.
Eureka Math: Module 3 Lessons 21-26 Module 6 Lessons 23-27 Big Ideas: Sections: 9.1 – 9.5
6/10/2016 Page 39 of 50
quadrilaterals, polygons, cubes, and right prisms. 7.MP.1. Make sense of problems and persevere in solving them. 7.MP.2. Reason abstractly and quantitatively. 7.MP.3. Construct viable arguments and critique the reasoning of others. 7.MP.4. Model with mathematics. 7.MP.5. Use appropriate tools strategically. 7.MP.6. Attend to precision.
Surface area formulas are not the expectation with this standard. Building on work with nets in the 6th grade, students should recognize that finding the area of each face of a three-dimensional figure and adding the areas will give the surface area. No nets will be given at this level; however, students could create nets to aid in surface area calculations. Students understanding of volume can be supported by focusing on the area of base times the height to calculate volume. Students solve for missing dimensions, given volume. Students select appropriate tools (MP.5) and look for and make use of structure (MP.7) as they investigate 3---dimensional figures. They also model with mathematics as they solve multi---step real---life measurement problems (MP.4). Examples:
• A triangle has an area of 6 square feet. The height is four feet. What is the length of the base?
Solution: One possible solution is to use the formula for the area of a triangle and substitute in the known values, then solve for the missing dimension. The length of the base would be 3 feet.
• The surface area of a cube is 96 in2. What is the volume of the
cube?
Solution: The area of each face of the cube is equal. Dividing 96 by 6 gives an area of 16 in2 for each face. Because each face is a square, the length of the edge would be 4 in. The volume could then be found by multiplying 4 x 4 x 4 or 64 in3.
• Huong covered the box to the right with sticky-backed
decorating paper. The paper costs 3¢ per square inch. How
6/10/2016 Page 40 of 50

much money will Huong need to spend on paper?
Solution:
The surface area can be found by using the dimensions of each face to find the area and multiplying by 2. The surface area is the sum of these areas, or 222 in2. If each square inch of paper cost $0.03, the cost would be $6.66.
• Jennie purchased a box of crackers from the deli. The box is in
the shape of a triangular prism (see diagram below). If the volume of the box is 3,240 cubic centimeters, what is the height of the triangular face of the box? How much packaging material was used to construct the cracker box? Explain how you got your answer.
Front: 7 in. x 9 in. = 63 in2 x 2 = 126 in2 Top: 3 in. x 7 in. = 21 in2 x 2 = 42 in2 Side: 3 in. x 9 in. = 27 in2 x 2 = 54 in2
6/10/2016 Page 41 of 50

Solution: Volume can be calculated by multiplying the area of the base (triangle) by the height of the prism. Substitute given values and solve for the area of the triangle V = Bh 3,240 cm3 = B (30cm) 3,240 cm3 = B(30cm) 30 cm 30 cm
108 cm2 = B (area of the triangle)
To find the height of the triangle, use the area formula for the triangle, substituting the known values in the formula and solving for height. The height of the triangle is 12 cm.
The problem also asks for the surface area of the package. Find the area of each face and add: 2 triangular bases: ½ (18 cm)(12 cm ) = 108 cm2 x 2 = 216 cm2 2 rectangular faces: 15 cm x 30 cm = 450 cm2 x 2 = 900 cm2 1 rectangular face: 18 cm x 30 cm = 540 cm2
6/10/2016 Page 42 of 50

Adding 216 cm2 + 900 cm2 + 540 cm2 gives a total surface area of 1656 cm2.
• Determine the surface area and volume of the right prism
below:
Solution: Surface Area:
Volume:
6/10/2016 Page 43 of 50

• A decorative bathroom faucet has a 3 in x 3 in square pipe that flows into a basin in the shape of an isosceles trapezoid prism like the one shown in the diagram. If it takes one minute and twenty seconds to fill the basin completely, what is the approximate rate of flow from the faucet in feet per second?
Solution:
Based on the rate of water flowing out of the faucet, the volume of water can also be calculated as follows:
8 G 9 C. Solve real-world and mathematical problems involving volume of cylinders, cones, and spheres
Explanation: “Know the formula” does not mean memorization of the formula. To “know” means to have an understanding of why the formula works
8th Grade Eureka Math: Module 5 Lesson 9-11 Module 7 Lesson 19-22
6/10/2016 Page 44 of 50

Know the formulas for the volumes of cones, cylinders, and spheres and use them to solve real-world and mathematical problems.
8.MP.1. Make sense of problems and persevere in solving them. 8.MP.2. Reason abstractly and quantitatively. 8.MP.3. Construct viable arguments and critique the reasoning of others. 8.MP.4. Model with mathematics. 8.MP.5. Use appropriate tools strategically. 8.MP.6. Attend to precision. 8.MP.7. Look for and make use of structure. 8.MP.8. Look for and express regularity in repeated reasoning
and how the formula relates to the measure (volume) and the figure. This understanding should be for all students. Students build on understandings of circles and volume from 7th grade to find the volume of cylinders, finding the area of the base 𝜋𝜋𝑟𝑟2 and multiplying by the number of layers (the height).
To motivate the formula of the volume of a cone, use cylinders and cones with the same base and height. Fill he cone with rice or water and pour into the cylinder. Students will discover/experience that 3 cones full are needed to fill the cylinder. This non-mathematical derivation of the formula for the volume of a cone, V = 1/3πr2h, will help most students remember the formula. Students understand that the volume of a cylinder is 3 times the volume of a cone having the same base area and height or that the volume of a cone is 1/3 the volume of a cylinder having the same base area and height.
A sphere can be enclosed with a cylinder, which has the same radius and height of the sphere (Note: the height of the cylinder is twice the radius of the sphere)
8th Grade Big Ideas: Sections: 7.3, 7.5
6/10/2016 Page 45 of 50

If the sphere is flattened, it will fill 2/3 of the cylinder. Based on this model, students understand that the volume of a sphere is 2/3 the volume of a cylinder with the same radius and height. The height of the cylinder is the same as the diameter of the sphere or 2𝑟𝑟. Using this information, the formula for the volume of the sphere can be derived in the following way:
A video that illustrates the volume of a sphere can be found at: http://www.youtube.com/watch?v=aLyQddyY8ik Students should experience many types of real-world applications using these formulas. They should be expected to explain and justify their solutions. Examples:
6/10/2016 Page 46 of 50
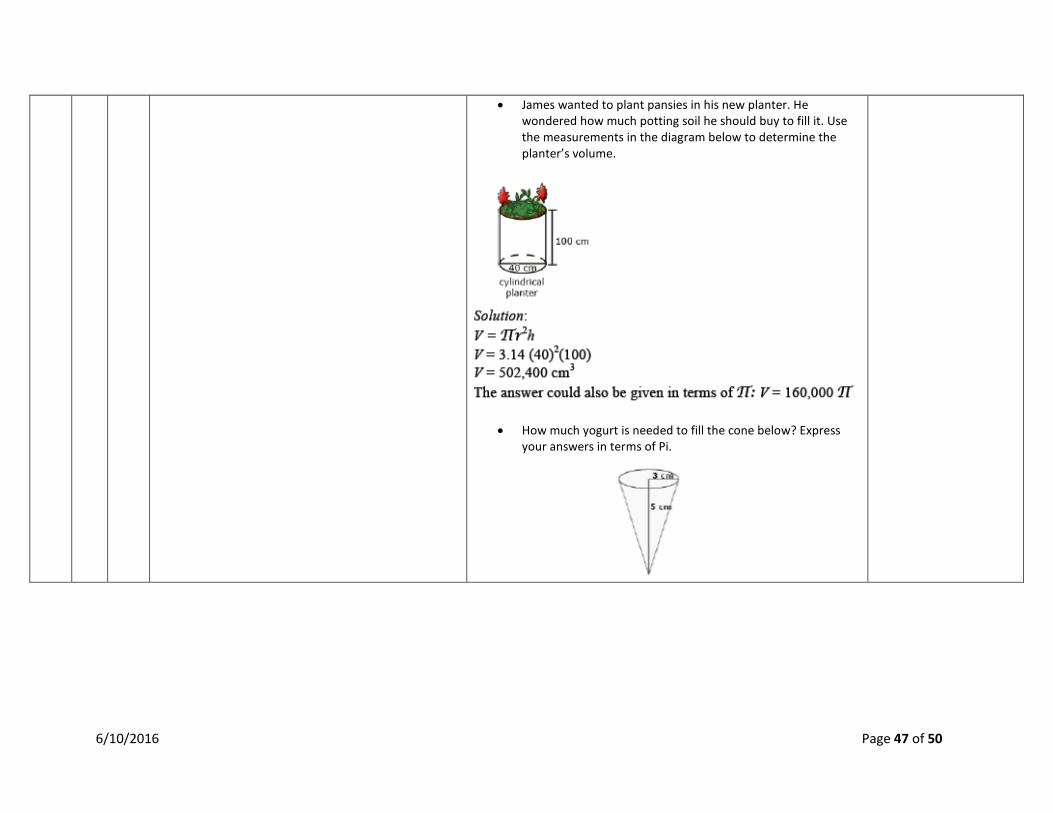
• James wanted to plant pansies in his new planter. He wondered how much potting soil he should buy to fill it. Use the measurements in the diagram below to determine the planter’s volume.
• How much yogurt is needed to fill the cone below? Express your answers in terms of Pi.
6/10/2016 Page 47 of 50

• Approximately, how much air would be needed to fill a soccer ball with a radius of 14 cm?
• Which of the two figures below has the greater volume?
Justify your answer.
The volume of the cone is
6/10/2016 Page 48 of 50

The volume of the sphere is
The volume of the sphere is larger than the volume of the cone.
• Find the volume of the truncated cone.
Solution: Let x represent the height of the small cone that was removed. Setting up a proportion yields:
6/10/2016 Page 49 of 50

Subtracting the volume of the small cone from the volume of the large cone:
The difference of these volumes gives the volume of the truncated cone which is 336π cm3.
6/10/2016 Page 50 of 50