highway 213 corridor alternative mobility targets standards in compliance with the transportation...
TRANSCRIPT
Final Report
Highway 213 Corridor Alternative
Mobility Targets
Oregon City, Oregon
Draft
December 2017

Final Report
Highway 213 Corridor Alternative Mobility Targets
Oregon City, Oregon
Prepared For:
Dayna Webb, P.E.
Public Works Department
City of Oregon City
PO Box 3040
625 Center Street
Oregon City, Oregon 97045
(503) 974-5508
Prepared By:
Kittelson & Associates, Inc.
610 SW Alder, Suite 700
Portland, OR 97205
(503) 228-5230
Project Manager: Susan Wright, P.E.
Project Principal: Hermanus Steyn, P.E.
Project Analyst: Kristine Connolly
Project No. 20651
December 2017

Highway 213 Corridor Alternative Mobility Targets Table of Contents
December 2017
iii Kittelson & Associates, Inc.
TABLE OF CONTENTS
Executive Summary ................................................................................................................................ 2
Introduction…... ..................................................................................................................................... 5
Policy Context .............................................................................................................................................................................. 6
Existing Performance Measure and Target ................................................................................................................................. 7
Process………….. .................................................................................................................................... 10
Technical Memorandum #1/TAG and CAG Meeting #1 ............................................................................................................ 10
Technical Memorandum #2/TAG and CAG Meeting #2 ............................................................................................................ 10
Technical Memorandum #3/TAG and CAG Meeting #3 ............................................................................................................ 11
Existing Conditions ............................................................................................................................... 13
Geometric Characteristics ......................................................................................................................................................... 13
Planned Area Improvements ..................................................................................................................................................... 13
Operations ................................................................................................................................................................................. 18
Alternatives Analysis ............................................................................................................................ 21
Alternatives Development – OR213 and Beavercreek Road ..................................................................................................... 21
Alternatives Evaluation – OR213 and Beavercreek Road .......................................................................................................... 26
Alternatives – OR213 and Redland Road ................................................................................................................................... 30
Alternative Mobility Target and Financially Feasible Improvements Assessment .............................. 32
Alternative Mobility Target ....................................................................................................................................................... 32
Safety and Capacity Analysis ..................................................................................................................................................... 32
Safety and Capacity Improvements ........................................................................................................................................... 32
Conclusions................................................................................................................................................................................ 44
Highway 213 Corridor Alternative Mobility Targets Table of Contents
December 2017
iv Kittelson & Associates, Inc.
APPENDICES
Appendix A – CAG and TAG Meeting Notes and Technical Memorandums
Appendix B – Oregon City GIS Maps
Appendix C – BlueMAC Data
Appendix D – Crash Data
Appendix E – Traffic Volumes
Appendix F – Operations Analysis
Appendix G – Cost Estimates

Section 1
Executive Summary

Highway 213 Corridor Alternative Mobility Targets Executive Summary
December 2017
2 Kittelson & Associates, Inc.
EXECUTIVE SUMMARY
Oregon City’s 2013 Transportation System Plan (TSP) determined that the Highway 213 (OR213)
corridor from Redland Road to Molalla Avenue (including the intersection of Beavercreek Road) will
exceed the current mobility target in 2035, resulting in more congestion than is allowed. The OR213
intersection with Molalla Avenue is anticipated to meet the target; however, Beavercreek Road and
Redland Road are not anticipated to meet the target.
The existing mobility target at the OR213/Beavercreek Road intersection is a volume-to-capacity (v/c)
ratio at or below 0.99 during the peak first and second hours. The existing mobility target at the
OR213/Redland Road intersection is a v/c ratio at or below 1.1 during the peak first hour and 0.99
during the peak second hour, as this intersection is located in a regional center. The alternatives that
would meet the existing mobility targets at the OR213/Beavercreek Road and OR213/Redland Road
intersections are not cost feasible, given the financial constraints of the City and other agency partners.
These alternatives can be further considered in the future if additional funding becomes available.
Lacking the financial capability of implementing major capacity-increasing projects at these locations,
alternative mobility targets are necessary at each of these intersections; however, some improvements
are feasible in the cost-constrained TSP to improve safety and minimize future congestion.
The following improvements are recommended for the intersection of OR213 and Beavercreek Road:
• Construct a westbound right-turn merge lane. High visibility pavement markings and signage are
recommended for pedestrians and bicycles to cross the channelized lane safely, and
consideration should be given to installing a rectangular rapid flash beacon (RRFB) for increased
visibility.
• Infill sidewalk on Beavercreek Road from south of the Coltrane Path to north of Marjorie Lane.
• Install various safety improvements outlined on pages 33 and 35 of this report.
The above improvements will be added as projects in the TSP for future consideration.
For the intersection of OR213 and Beavercreek Road, the following mobility standards apply:
• During the first, second and third hours, a maximum v/c ratio of 1.00 shall be maintained.
Calculation of the maximum v/c ratio will be based on an average annual weekday peak hour.
For the intersection of OR213 and Redland Road, the following mobility standards apply:
• During the first and second hours, a maximum v/c ratio of 1.10 shall be maintained. Calculation
of the maximum v/c ratio will be based on an average annual weekday peak hour.
• During the third hour, a maximum v/c ratio of 1.05 shall be maintained. Calculation of the
maximum v/c ratio will be based on an average annual weekday peak hour.

Highway 213 Corridor Alternative Mobility Targets Executive Summary
December 2017
3 Kittelson & Associates, Inc.
Changes to the TSP to incorporate these improvements and the alternative mobility targets will require
a Legislative public review process before the City’s Planning Commission and City Commission. The
alternative mobility target and financially feasible improvements that are needed will need to be
agreed upon by ODOT and approved by the Oregon Transportation Commission.

Section 2
Introduction

Highway 213 Corridor Alternative Mobility Targets Introduction
December 2017
5 Kittelson & Associates, Inc.
INTRODUCTION
Oregon City’s 2013 Transportation System Plan (TSP) determined that the Highway 213 (OR213)
corridor from Redland Road to Molalla Avenue (including the intersection of Beavercreek Road) will
exceed the current mobility target in 2035, resulting in more congestion than is allowed. The TSP
recommended a project be conducted to identify what improvements would be necessary to meet the
current target or whether an alternative mobility target is justified. The OR213 intersection with
Molalla Avenue is anticipated to meet the target; however, Beavercreek Road and Redland Road are
not anticipated to meet the target.
This project provides an overview of these two intersections including safety, operations, and cost
analysis of the potential improvements at these intersections and identifies potential alternative
mobility targets that would be necessary in conjunction with financially feasible operational and safety
improvements. If alternative mobility targets are not adopted for the corridor, Oregon City will not be
able to approve zone changes consistent with the Beavercreek Concept Plan. Outright zoned
development will also be hindered until funding can be secured for long-term improvements.
The intersection of OR213 and Beavercreek Road is shown in Exhibit 1, and the intersection of OR213
and Redland Road is shown in Exhibit 2.
Exhibit 1 – Highway 213 (OR213) and Beavercreek Road Intersection

Highway 213 Corridor Alternative Mobility Targets Introduction
December 2017
6 Kittelson & Associates, Inc.
Exhibit 2 – Highway 213 (OR213) and Redland Road Intersection
POLICY CONTEXT
Mobility targets are the measure by which the state assesses the existing or forecasted operational
conditions of a facility. As such, they are a key component the Oregon Department of Transportation
(ODOT) uses to determine the need for, or feasibility of providing highway, or other transportation
system improvements. They impact local land use and transportation planning as well as development
review. Recent years have seen notable changes to Oregon’s transportation planning and land use
policies and requirements. These changes reflect statewide policy to support transportation solutions
that encourage economic development, contribute to public health, offer multi-modal choices for all
users, and reflect the uncertain fiscal realities and limited transportation funding.
Oregon’s Transportation Planning Rule (TPR)
Mobility targets for state highways, as established in this policy or as otherwise adopted by the Oregon
Transportation Commission (OTC) as alternative mobility targets, are considered the highway system
performance standards in compliance with the Transportation Planning Rule (TPR) (OAR 660-012),
including applicability for actions that fall under Section -0060 of the TPR.
The TPR Section -0060 applies when cities or counties are considering zone changes or plan
amendments that would allow for additional development that would significantly impact or worsen
the performance of existing or planned transportation facilities. Currently, significant impacts are found
to exist when levels of automobile traffic cause roadway facilities to exceed motorized vehicle
standards, such as mobility targets. If there is a significant impact, jurisdictions are required to “ensure
that allowed land uses are consistent with the identified function, capacity, and performance standards
of the facility measured at the end of the planning period identified in the adopted Transportation
System Plan.”

Highway 213 Corridor Alternative Mobility Targets Introduction
December 2017
7 Kittelson & Associates, Inc.
Oregon Highway Plan Policy 1F
The Oregon Highway Plan (OHP) defines polices and investment strategies for Oregon’s state highway
system for the next 20 years. The OHP gives policy and investment direction to corridor plans and
transportation system plans that are being prepared around the state, but it leaves the responsibility
for identifying specific projects and modal alternatives to those plans.
The OHP Policy 1F establishes mobility targets (as defined by motorized vehicle volume-to-capacity
ratios) for state facilities that vary by region, facility classification, and whether or not the roadway is
located inside an urban growth boundary (UGB). It states, “It is the policy of the State of Oregon to
maintain acceptable and reliable levels of mobility on the state highway system, consistent with
expectation for each facility type, location and functional objectives. Highway mobility targets will be
the initial tool to identify deficiencies and consider solutions for vehicular mobility on the state system.
Specifically, mobility targets shall be used for:
• Identifying state highway mobility performance expectations for planning and plan
implementation;
• Evaluating the impacts on state highways of amendments to transportation plans,
acknowledged comprehensive plans and land use regulations pursuant to the Transportation
Planning Rule (OAR 660-12-0060); and
• Guiding operations decisions such as managing access and traffic control systems to maintain
acceptable highway performance.”
The OHP Policy 1F allows for development of alternative mobility targets in areas where it is “infeasible
or impractical to meet the mobility targets”. The policy allows for the use of alternative mobility targets
to “balance overall transportation system efficiency with multiple objectives of the area being
addressed.” It requires that targets “shall be clear and objective and shall provide standardized
procedures to ensure consistent application of the selected measure. The alternative mobility target(s)
shall be adopted by the Oregon Transportation Commission as an amendment to the OHP.” The OHP
currently includes alternative mobility targets in many locations throughout the State; however, none
have been adopted within the Portland Metro area to date.
EXISTING PERFORMANCE MEASURE AND TARGET
Mobility, or congestion, may be measured and regulated in a variety of ways. In the context of this
project, mobility performance measures are methods to objectively measure the transportation
system, such as travel time, or reliability. Mobility targets describe an acknowledged acceptable level of
performance for a measure, such as a certain level of congestion.
The existing mobility targets for the OR213 corridor set forth in the Oregon Highway Plan (OHP) and the
2013 TSP are based on volume-to-capacity Ratio (v/c). The v/c ratio is a measure that reflects mobility
and quality of travel. It compares roadway demand (vehicle volumes) with roadway supply (carrying
capacity). For example, a v/c of 1.00 indicates the roadway facility is operating at its capacity. An
intersection can have an overall v/c ratio of 1.00 yet have v/c ratios greater than 1.00 for individual

Highway 213 Corridor Alternative Mobility Targets Introduction
December 2017
8 Kittelson & Associates, Inc.
movements where it may take more than one signal cycle to get through the intersection and queues
build up. The following mobility target is set forth in the 2013 TSP for the two study intersections:
• OR213/Beavercreek Road intersection: required to operate at or below a v/c ratio of 0.99
during the peak first and second hours.
• OR213/Redland Road intersection: required to operate at or below a v/c ratio of 1.1 during the
peak first hour and 0.99 during the peak second hour.
The Synchro model (a traffic model used to evaluate v/c ratios and other metrics) analysis completed
for the 2013 TSP shows the OR213/Beavercreek Road intersection operating with an intersection v/c
ratio of 0.83 for the p.m. peak hour under 2011 existing conditions. The TSP did not include an analysis
of the intersection of OR213 and Redland Road. Under 2017 existing traffic volumes and conditions, the
intersection operates with a v/c ratio of 0.91. The TSP analysis also indicates that by 2035, without
improvement, the intersection will function beyond the current mobility target. Under 2035 Planned
System Conditions (which includes planned, but potentially unfunded, roadway improvements), the
intersection is expected to operate with a v/c ratio of 1.05, exceeding the existing mobility target (a
maximum v/c ratio of 0.99). The southbound left-turn and eastbound left-turn movements exhibit
higher than average v/c ratios, while the westbound left-turn and northbound left-turn movements
exhibit lower than average v/c ratios.
Table 1 – OR213/Beavercreek Road Intersection Operations
Year PM Peak Volume-to-Capacity Ratio (v/c)
2011 (2013 TSP Existing Conditions) 0.83
2017 Existing Conditions (May Counts) 0.91
2035 (2013 TSP Forecast) 1.05
The 2013 TSP did not include analysis of the OR213/Redland Road intersection. However, a long-term
project to improve capacity at the OR213/Redland Road intersection is identified (project D79). The
improvements identified in the TSP are part of Phase 2 of the “Jughandle” project, a project that
focused on the intersection of OR213 and Washington Street that was implemented in 2013. The Phase
2 improvements, including improvements at OR213/Redland Road are already 90% designed. The
improvements identified in Phase 2 future construction include an additional northbound and
southbound through lane resulting in three northbound and three southbound lanes through the
intersection. As this long-term solution has been identified, much of the analysis in the following
sections of this report is focused on the OR213/Beavercreek Road intersection for the purpose of
identifying a long-term improvement which will meet the existing mobility target for the corridor.

Section 3
Process

Highway 213 Corridor Alternative Mobility Targets Process
December 2017
10 Kittelson & Associates, Inc.
PROCESS
A Community Advisory Group (CAG) and Technical Advisory Group (TAG) were formed to help the City
evaluate the feasibility and practicality of the alternatives set forth in this project. Three technical
memorandums were produced and presented individually to the TAG and CAG. The following section
outlines the contents of these memorandums and outcomes of the conversations with each group. All
meeting notes and technical memorandums can be found in Appendix “A”.
TECHNICAL MEMORANDUM #1/TAG AND CAG MEETING #1
Potential improvements for the intersection of Beavercreek Road and OR213 that focused on
significantly increasing the intersection capacity to meet the current mobility target were presented to
the TAG and CAG in December 2016 and January 2017. None of the alternatives were determined to be
financially feasible, even by the 2035 horizon year of the TSP given the financial constraints of the city
and other agency partners. In addition, some of the potential alternatives could have additional
consequences including right-of-way impacts, environmental impacts, and could potentially complicate
the provision of services for bicyclists, pedestrians, and transit users. Nonetheless, it is recommended
that the alternatives be documented in the TSP for additional future consideration as part of the TSP’s
unconstrained plan. The unconstrained plan includes projects that are not currently anticipated to be
financially feasible by 2035 but are projected to be needed and could be implemented if additional
funding becomes available in the future.
TECHNICAL MEMORANDUM #2/TAG AND CAG MEETING #2
Because achieving the mobility target through a major capacity-expanding project at this intersection
was determined to be beyond the financial capabilities of the city and its partner agencies, an
alternative mobility target is necessary. A menu of potential alternative performance measures,
reasonable target ranges, and a list of potentially feasible improvements to increase capacity and safety
in the corridor was presented to the TAG and CAG in March 2017. The majority of TAG and CAG
members agreed that an alternative mobility target allowing intersection volume-to-capacity ratios to
exceed the current targets for no more than a specified number of hours per day would be appropriate
for the corridor. The TAG and CAG were also in favor of further investigation of potential improvements
to increase safety and capacity at the Beavercreek Road and OR213 intersection. Some improvements
were identified that, while not allowing the mobility standard to be fully met, would increase the
intersection capacity, improve safety, and are within the financial capabilities of the city and its partner
agencies. The specific projects identified by the TAG and CAG for additional analysis were: 1) the
provision of a merge lane for westbound right-turning vehicles at the OR213/Beavercreek Road
intersection and 2) elimination of the second westbound left-turn lane at the OR213/Beavercreek Road
intersection to increase left-turn storage on eastbound Beavercreek Road at Maple Lane Road. These
improvements minimize future congestion and could be included in the cost-constrained TSP.

Highway 213 Corridor Alternative Mobility Targets Process
December 2017
11 Kittelson & Associates, Inc.
TECHNICAL MEMORANDUM #3/TAG AND CAG MEETING #3
The CAG and TAG reaffirmed support of an alternative mobility target allowing intersection volume-to-
capacity ratios to exceed the existing targets for no more than a specified number of hours per day. In
conjunction with alternative mobility targets, both groups were supportive of providing a merge lane
for westbound right-turning vehicles at OR213/Beavercreek Road, but were not in favor of near-term or
partial improvements at OR213/Redland Road, as it was determined that these would not be cost-
feasible.

Section 4
Existing Conditions

Highway 213 Corridor Alternative Mobility Targets Existing Conditions
December 2017
13 Kittelson & Associates, Inc.
EXISTING CONDITIONS
The existing conditions analysis identifies the transportation conditions and current operational and
geometric characteristics of the roadways within the study area.
GEOMETRIC CHARACTERISTICS
At the OR213/Beavercreek Road intersection, OR213 has a 4-lane section and a speed limit of 55 mph
and is classified as an Expressway to the north and a District Highway to the south. Beavercreek Road is
classified as a Major Arterial with a 4/5-lane section and a speed limit of 35 mph. OR213 is under the
jurisdiction of the Oregon Department of Transportation (ODOT), the west leg of Beavercreek Road is
under the jurisdiction of Oregon City, and the east leg is under the jurisdiction of Clackamas County. OR
213 and Beavercreek Road are both designated as a Local Truck Routes in the City’s TSP at the study
intersection. The City designated truck routes in the TSP to ensure trucks can efficiently travel through
and access major destinations in the City.
Sidewalks are provided along the north and south sides of Beavercreek Road, and a multi-use path is
provided along OR213 south of Beavercreek Road along the east side of the highway. Bicycle lanes are
provided along Beavercreek Road. TriMet operates Bus Route 32 between Clackamas Community
College and Milwaukie City Hall. There are stops located on the west leg of Beavercreek Road at the
intersection for both directions of travel (i.e. far-side for westbound and near-side for eastbound).
There is a stream running under the north leg of OR213 at the intersection, with corresponding
wetlands. There are also geologic hazards in the vicinity of the intersection, with steep slopes and
landslides primarily on the northwest corner. More details can be found in the Oregon City GIS maps in
Appendix “B”. The presence of these features increases the expense of any improvements requiring
additional widening, as significant earthwork, culvert extensions, or wetland mitigation may be
necessary.
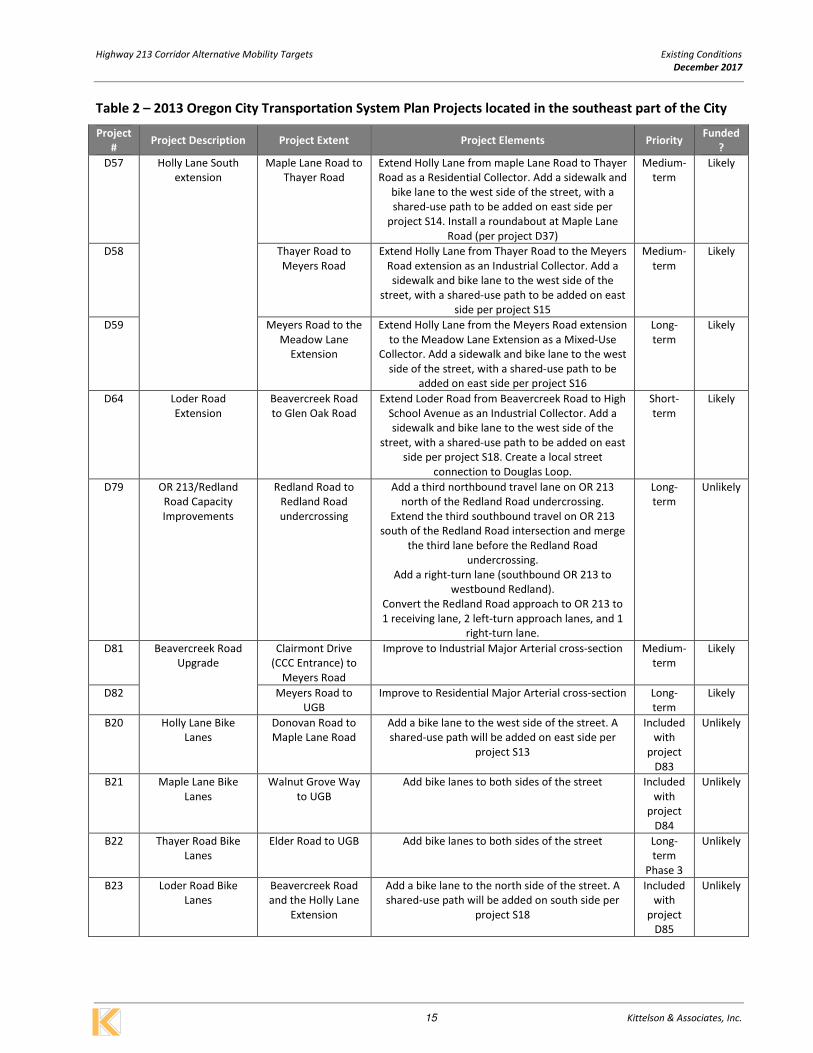
PLANNED AREA IMPROVEMENTS
The City’s TSP includes projects which may impact operations, safety, and travel patterns at the
OR213/Beavercreek Road intersection. Many of the projects will increase connectivity in the vicinity of
the OR213/Beavercreek Road intersection via parallel routes and roadway extensions between these
parallel routes, providing alternate routes for those who do not need to pass through the intersection.
All new roads and roadway upgrade projects will include facilities for bicycles and pedestrians. In
addition, the TSP includes projects specifically to complete and enhance the bicycle and pedestrian
networks. The roadway projects listed in the TSP which are likely to increase connectivity and impact
safety and operations at the OR213/Beavercreek Road intersection are included in Table 2 and Figure 1.
Figure 1 includes only those projects impacting vehicle travel and capacity.

Highway 213 Corridor Alternative Mobility Targets Existing Conditions
December 2017
14 Kittelson & Associates, Inc.
Table 2 – 2013 Oregon City Transportation System Plan Projects located in the southeast part of the City
Project
# Project Description Project Extent Project Elements Priority
Funded
?
D14
Southbound OR 213
Advanced Warning
System
Southbound OR
213, north of the
Beavercreek Road
intersection
Install a queue warning system for southbound
drivers on OR 213 to automatically detect queues
and warn motorists in advance via a Variable
Message Sign
Short-
term Likely
D37
Maple Lane
Road/Holly Lane
Operational
Enhancement
Maple Lane
Road/Holly Lane Install a single-lane roundabout
Long-
term Unlikely
D38
Maple Lane
Road/Walnut Grove
Way Operational
Enhancement
Maple Lane
Road/Walnut Grove
Way
Install a single-lane roundabout or realign Maple
Lane Road in correlation with development
Long-
term Unlikely
D39
Beavercreek
Road/Glen Oak Road
Operational
Enhancement
Beavercreek
Road/Glen Oak
Road
Install a roundabout Long-
term Unlikely
D44
Beavercreek
Road/Loder Road
Extension
Operational
Enhancement
Beavercreek
Road/Loder Road
Extension
Install a roundabout Medium-
term Likely
D46 Meyers Road West
Extension
OR 213 to High
School Avenue
Extend Meyers Road from OR 213 to High School
Avenue as an Industrial Minor Arterial. Create a
local street connection to Douglas Loop.
Short-
term Likely
D47 Meyers Road East
extension
Beavercreek Road
to the Meadow
Lane Extension
Extend Meyers Road from Beavercreek Road to
the Meadow Lane Extension as an Industrial Minor
Arterial. Between the Holly Lane and Meadow
Lane extensions, add a sidewalk and bike lane to
the south side of the street, with a shared-use
path to be added on north side per project S19.
Modify the existing traffic signal at Beavercreek
Road
Medium-
term
Likely
D54 Clairmont Drive
extension
Beavercreek Road
to Holly Lane South
Extension
Extend Clairmont Drive from Beavercreek Road to
the Holly Lane South extension as an Industrial
Collector. Add a sidewalk and bike lane to the
south side of the street, with a shared-use path to
be added on north side per project S17
Long-
term
Likely
D55 Glen Oak Road
extension
Beavercreek Road
to the Meadow
Lane Extension
Extend Glen Oak Road from Beavercreek Road to
the Meadow Lane Extension as a Residential
Collector. Install a roundabout at Beavercreek
Road (per project D39)
Long-
term
Likely
D56 Timbersky Way
extension
Beavercreek Road
to the Meadow
Lane Extension
Extend Timbersky Way from Beavercreek Road to
the Meadow Lane Extension as a Residential
Collector. Add a sidewalk and bike lane to the
south side of the street, with a shared-use path to
be added on north side per project S20
Long-
term
Likely
Highway 213 Corridor Alternative Mobility Targets Existing Conditions
December 2017
15 Kittelson & Associates, Inc.
Table 2 – 2013 Oregon City Transportation System Plan Projects located in the southeast part of the City
Project
# Project Description Project Extent Project Elements Priority
Funded
?
D57 Holly Lane South
extension
Maple Lane Road to
Thayer Road
Extend Holly Lane from maple Lane Road to Thayer
Road as a Residential Collector. Add a sidewalk and
bike lane to the west side of the street, with a
shared-use path to be added on east side per
project S14. Install a roundabout at Maple Lane
Road (per project D37)
Medium-
term
Likely
D58 Thayer Road to
Meyers Road
Extend Holly Lane from Thayer Road to the Meyers
Road extension as an Industrial Collector. Add a
sidewalk and bike lane to the west side of the
street, with a shared-use path to be added on east
side per project S15
Medium-
term
Likely
D59 Meyers Road to the
Meadow Lane
Extension
Extend Holly Lane from the Meyers Road extension
to the Meadow Lane Extension as a Mixed-Use
Collector. Add a sidewalk and bike lane to the west
side of the street, with a shared-use path to be
added on east side per project S16
Long-
term
Likely
D64 Loder Road
Extension
Beavercreek Road
to Glen Oak Road
Extend Loder Road from Beavercreek Road to High
School Avenue as an Industrial Collector. Add a
sidewalk and bike lane to the west side of the
street, with a shared-use path to be added on east
side per project S18. Create a local street
connection to Douglas Loop.
Short-
term
Likely
D79 OR 213/Redland
Road Capacity
Improvements
Redland Road to
Redland Road
undercrossing
Add a third northbound travel lane on OR 213
north of the Redland Road undercrossing.
Extend the third southbound travel on OR 213
south of the Redland Road intersection and merge
the third lane before the Redland Road
undercrossing.
Add a right-turn lane (southbound OR 213 to
westbound Redland).
Convert the Redland Road approach to OR 213 to
1 receiving lane, 2 left-turn approach lanes, and 1
right-turn lane.
Long-
term
Unlikely
D81 Beavercreek Road
Upgrade
Clairmont Drive
(CCC Entrance) to
Meyers Road
Improve to Industrial Major Arterial cross-section Medium-
term
Likely
D82 Meyers Road to
UGB
Improve to Residential Major Arterial cross-section Long-
term
Likely
B20 Holly Lane Bike
Lanes
Donovan Road to
Maple Lane Road
Add a bike lane to the west side of the street. A
shared-use path will be added on east side per
project S13
Included
with
project
D83
Unlikely
B21 Maple Lane Bike
Lanes
Walnut Grove Way
to UGB
Add bike lanes to both sides of the street Included
with
project
D84
Unlikely
B22 Thayer Road Bike
Lanes
Elder Road to UGB Add bike lanes to both sides of the street Long-
term
Phase 3
Unlikely
B23 Loder Road Bike
Lanes
Beavercreek Road
and the Holly Lane
Extension
Add a bike lane to the north side of the street. A
shared-use path will be added on south side per
project S18
Included
with
project
D85
Unlikely

Highway 213 Corridor Alternative Mobility Targets Existing Conditions
December 2017
16 Kittelson & Associates, Inc.
Table 2 – 2013 Oregon City Transportation System Plan Projects located in the southeast part of the City
Project
# Project Description Project Extent Project Elements Priority
Funded
?
B24 Loder Road Bike
Lanes
Holly Lane
Extension to the
UGB
Add bike lanes to both sides of the street Included
with
project
D85
Unlikely
B25 High School Avenue
Shared Roadway
Meyers Road to
Glen Oak Road
Add wayfinding and shared lane markings Long-
term
Phase 4
Unlikely
B26 Glen Oak Road Bike
Lanes
Coquille Drive to
Augusta Drive
Add bike lanes to both sides of the street Long-
term
Phase 3
Unlikely
B27 Coquille Drive
Shared Roadway
Glen Oak Road to
Turtle Bay Drive
Add wayfinding and shared lane markings Long-
term
Phase 4
Unlikely
B29 Beavercreek Road
Bike Lanes
Pebble Beach Drive
to UGB
Add bike lanes to both sides of the street Included
with
project
D82
Likely
W22 Holly Lane Sidewalk
Infill
Donovan Road to
Maple Lane Road
Complete sidewalk gaps on west side of the street.
A shared-use path will be added on east side per
project S13
Included
with
project
D83
Unlikely
W23 Maple Lane Road
Sidewalk Infill
Beavercreek Road
to UGB
Complete sidewalk gaps on both sides of the street Included
with
project
D84
Unlikely
W24 Thayer Road
Sidewalk Infill
Maple Lane Road to
UGB
Complete sidewalk gaps on both sides of the street Long-
term
Phase 3
Unlikely
W25 Loder Road Sidewalk
Infill
Beavercreek Road
to the Holly Lane
Extension
Complete sidewalk gaps on north side of the
street. A shared-use path will be added on south
side per project S18.
Included
with
project
D85
Unlikely
W26 Loder Road Sidewalk
Infill
Holly Lane
Extension to the
UGB
Complete sidewalk gaps on both sides of the street Included
with
project
D85
Unlikely
W27 High School Avenue
Sidewalk Infill
Meyers Road to
Glen Oak Road
Complete sidewalk gaps on the west side of the
street
Long-
term
Phase 3
Unlikely
W28 Glen Oak Road
Sidewalk Infill
OR 213 to High
School Avenue
Complete sidewalk gaps on both sides of the street Long-
term
Phase 2
Unlikely
W29 Coquille Drive to
Augusta Drive
Complete sidewalk gaps on both sides of the street Long-
term
Phase 3
Unlikely
W31 OR 213 Sidewalk
Infill
Molalla Avenue to
Conway Drive
Complete sidewalk gaps on both sides of the street Included
with
project
D77
Unlikely

Highway 213 Corridor Alternative Mobility Targets Existing Conditions
December 2017
18 Kittelson & Associates, Inc.
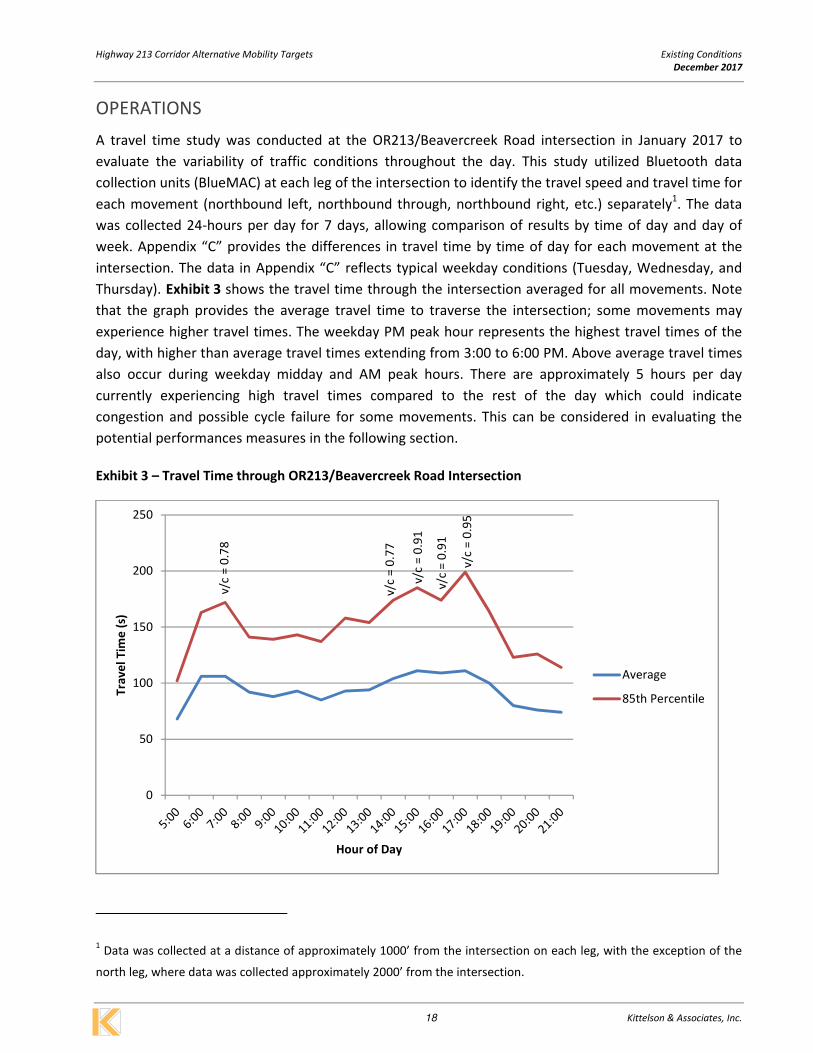
OPERATIONS
A travel time study was conducted at the OR213/Beavercreek Road intersection in January 2017 to
evaluate the variability of traffic conditions throughout the day. This study utilized Bluetooth data
collection units (BlueMAC) at each leg of the intersection to identify the travel speed and travel time for
each movement (northbound left, northbound through, northbound right, etc.) separately1. The data
was collected 24-hours per day for 7 days, allowing comparison of results by time of day and day of
week. Appendix “C” provides the differences in travel time by time of day for each movement at the
intersection. The data in Appendix “C” reflects typical weekday conditions (Tuesday, Wednesday, and
Thursday). Exhibit 3 shows the travel time through the intersection averaged for all movements. Note
that the graph provides the average travel time to traverse the intersection; some movements may
experience higher travel times. The weekday PM peak hour represents the highest travel times of the
day, with higher than average travel times extending from 3:00 to 6:00 PM. Above average travel times
also occur during weekday midday and AM peak hours. There are approximately 5 hours per day
currently experiencing high travel times compared to the rest of the day which could indicate
congestion and possible cycle failure for some movements. This can be considered in evaluating the
potential performances measures in the following section.
Exhibit 3 – Travel Time through OR213/Beavercreek Road Intersection
1 Data was collected at a distance of approximately 1000’ from the intersection on each leg, with the exception of the
north leg, where data was collected approximately 2000’ from the intersection.
v/c
= 0
.78
v/c
= 0
.77
v/c
= 0
.91
v/c
= 0
.91
v/c
= 0
.95
0
50
100
150
200
250
Tra
ve
l T
ime
(s)
Hour of Day
Average
85th Percentile

Highway 213 Corridor Alternative Mobility Targets Existing Conditions
December 2017
19 Kittelson & Associates, Inc.
The cycle length of the traffic signal at the OR213/Beavercreek intersection is approximately 120
seconds. Exhibit 3 shows that during the a.m. and p.m. peak hour periods, the average time it takes to
traverse the intersection is 110 seconds. Average travel time and v/c ratio are not directly linked;
however, the average travel times increase and decrease with v/c ratio. Table 3 provides volume-to-
capacity ratios for the five highest volume hours of the day2. These v/c ratios are noted on Exhibit 3
during their corresponding hour.
Table 3 – 2017 Existing Intersection Operations for the Five Highest Volume Hours (OR213/Beavercreek
Road)
Highest Hour Time of Day Total Entering Volume V/C
1st
4-5 PM 6052 0.91
2nd
5-6 PM 5983 0.95
3rd
3-4 PM 5808 0.91
4th
2-3 PM 4948 0.77
5th
7-8 AM 4626 1.073
2 2017 30
th highest hour volumes were estimated by adjusting May 2017 count data by a seasonal factor of 7% to
summer peak volumes.
3 The v/c ratio for the AM peak hour is 1.07 due the high volume of westbound right-turns. If the westbound right-turns
are excluded the intersection v/c is 0.78.

Section 5
Alternatives Analysis

Highway 213 Corridor Alternative Mobility Targets Alternatives Analysis
December 2017
21 Kittelson & Associates, Inc.
ALTERNATIVES ANALYSIS
ALTERNATIVES DEVELOPMENT – OR213 AND BEAVERCREEK ROAD
Alternatives to modify the existing intersection configuration and traffic control, which would bring the
intersection into compliance with the current mobility standards in the year 2035, were identified and
include:
• Addition of lanes to current configuration,
• Quadrant road in the southwest quadrant of the intersection,
• Variations of displaced left-turns (also referred to as continuous flow intersection), and
• Grade-separated interchange forms.
The potential operational impacts of each alternative are shown in Table 4 and evaluated for a variety
of additional considerations in Table 5.
Alternative 1: Triple Left-Turns
To maintain the current mobility standard with the existing intersection control, a third southbound
left-turn lane and a third northbound through lane through the intersection would be required to bring
the intersection back to a v/c ratio of 0.90. A conceptual sketch of Alternative 1 can be seen in Exhibit
4. The existing separate northbound right-turn lane (not reflected in Exhibit 4) would be maintained.
The effectiveness of the additional northbound through lane is dependent on the planned extension of
Meyers Road from Beavercreek Road to OR213 which would allow some eastbound right-turns at the
intersection to be converted to northbound through movements based on the new network
connectivity.
Exhibit 4 – Alternative 1: Triple Left-Turns

Highway 213 Corridor Alternative Mobility Targets Alternatives Analysis
December 2017
22 Kittelson & Associates, Inc.
Alternative 2: Quadrant Road
A quadrant road, or indirect left, in the southwest corner of the intersection would allow southbound
left-turns to be prohibited at the OR213/Beavercreek Road intersection. These vehicles would instead
travel southbound through the intersection, turn right onto a new street to the south that would
connect to Fir Street, and make a right-turn onto Beavercreek Road to continue east on their desired
route. A third southbound through lane and third eastbound through lane would be necessary to
accommodate the large volumes traveling through the intersection twice instead of once. This would
reduce overall intersection delay but increase travel time for the southbound left-turn movement. The
widening is likely to impact the culvert and retaining walls on the northwest and northeast corners of
the intersection. The parcel where the connection to Fir Street shown in Exhibit 5 is currently under
development, making this connection infeasible. A quadrant road on the southeast corner was also
considered, but the additional travel time incurred by circling the shopping center, or the impacts of
cutting through the shopping center, made this alternative infeasible.
Exhibit 5 – Alternative 2: Quadrant Road Alternative

Highway 213 Corridor Alternative Mobility Targets Alternatives Analysis
December 2017
23 Kittelson & Associates, Inc.
Alternatives 3 & 4: Displaced Left-Turns
In a displaced left-turn4, or continuous flow, intersection, left-turns are removed from the main
intersection and relocated to a new upstream signal. With proper coordination, vehicles are able to
make a left-turn simultaneously with opposing through traffic. Displaced left-turn intersection
alternatives would reduce the number of signal phases and conflict points in the OR213/Beavercreek
Road intersection, thereby improving capacity and safety, but would require coordinated partial signals
on the approaches with displaced left-turns. The heaviest left-turn movements at the
OR213/Beavercreek Road intersection are on the southbound and eastbound approaches. Exhibit 6
shows a sketch of a displaced left-turn for the southbound approach only. Exhibit 7 shows a sketch of
displaced left-turns for both the southbound and eastbound approaches. In either case, the
southbound approach requires dual left-turn lanes. Consideration could be given to prohibiting the
northbound and westbound left-turn movements as these movements have minimal traffic volumes
and have alternate routes; however, these restrictions are not mandatory. Additional analysis
(microsimulation) is necessary to fully understand the benefits of these potential restrictions.
Alternative 3 includes impacts to the culvert and retaining walls in the northeast corner of the
intersection. Alternative 4 includes culvert and retaining wall impacts to both the northwest and
northeast corners of the intersection.
Exhibit 6 – Alternative 3: Displaced Southbound Left-Turns
4 Steyn, H., Z. Bugg, B. Ray, and A. Daleiden. Displaced Left-Turn Informational Guide. FHWA, Washington, D.C., 2014.
http://safety.fhwa.dot.gov/intersection/alter_design/pdf/fhwasa14068_dlt_infoguide.pdf

Highway 213 Corridor Alternative Mobility Targets Alternatives Analysis
December 2017
24 Kittelson & Associates, Inc.
Exhibit 7 – Alternative 4: Displaced Southbound and Eastbound Left-Turns
Alternatives 5 – 7: Grade-Separated Interchange Alternatives
Several grade-separated interchange configurations were considered including full diamond, half
diamond (i.e., southbound off-ramp and northbound on-ramp only) and single-point interchanges. A
project to construct an interchange at this location was removed from the 2013 TSP Update. The
interchange was eliminated due to livability, multi-modal access and funding constraints within the
2035 planning horizon. Additionally, at the request of ODOT as it was determined to be financially
infeasible given other regional priorities. The construction of an interchange at the OR213/Beavercreek
Road intersection would have many challenges and impacts on surrounding land uses as shown in
Exhibit 8 through Exhibit 10.

Highway 213 Corridor Alternative Mobility Targets Alternatives Analysis
December 2017
25 Kittelson & Associates, Inc.
Exhibit 8 – Alternative 5: Half Diamond Interchange Alternative
Exhibit 9 – Alternative 6: Full Diamond Interchange Alternative

Highway 213 Corridor Alternative Mobility Targets Alternatives Analysis
December 2017
26 Kittelson & Associates, Inc.
Exhibit 10 – Alternative 7: Single Point Interchange Alternative
ALTERNATIVES EVALUATION – OR213 AND BEAVERCREEK ROAD
The following provides an overview of operational analysis conducted on each alternative and
summarizes the qualitative assessment for each alternative.
Operations Analysis
Planning level operational analysis was conducted using the CAP-X tool developed by FHWA5, which can
be used to evaluate alternative intersection forms and interchanges. The tool provides a total
intersection (v/c) ratio. It was used for all alternatives to provide a consistent comparison of
alternatives, but was found to be less conservative than Synchro in the base condition. Table 4
summarizes the v/c ratios provided by CAP-X for each alternative. If one of these alternatives is
identified as potential viable solution, it should be modeled in VISSIM to refine the forecast v/c ratio.
5 Transportation Systems Institute (TSI). Capacity Analysis for Planning of Junctions. Version 1.2. 2011.
http://tsi.cecs.ucf.edu/index.php/cap-x
Highway 213 Corridor Alternative Mobility Targets Alternatives Analysis
December 2017
27 Kittelson & Associates, Inc.
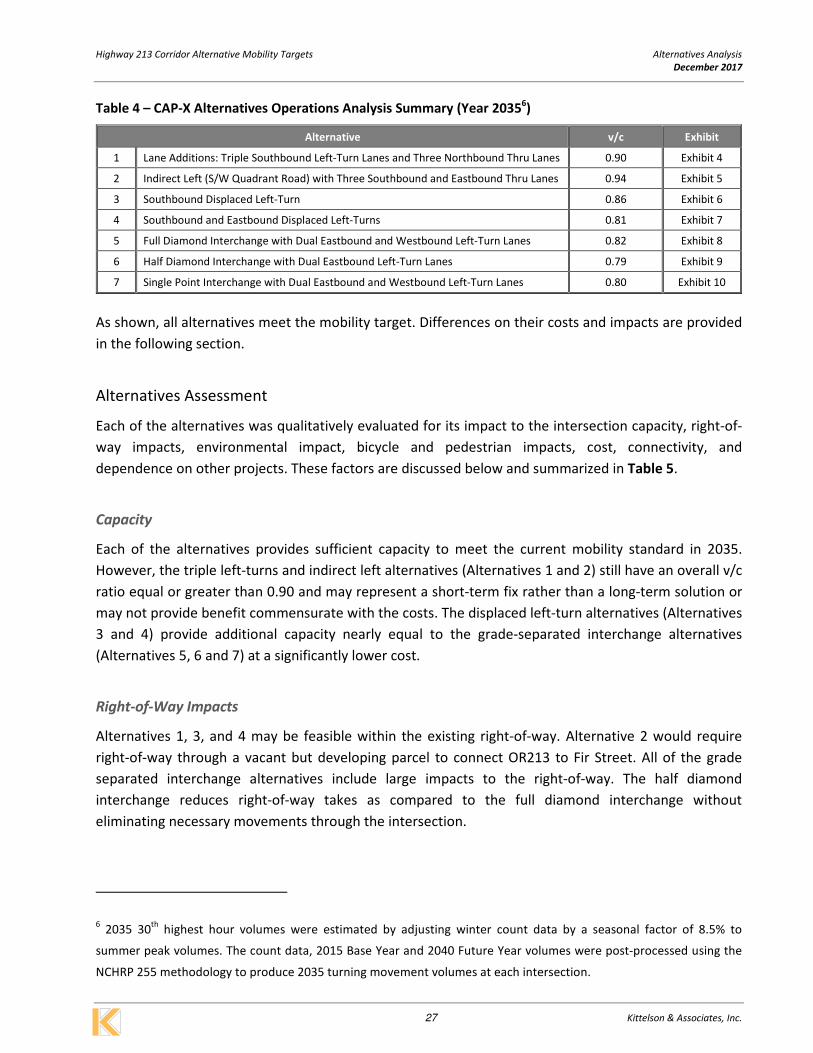
Table 4 – CAP-X Alternatives Operations Analysis Summary (Year 20356)
Alternative v/c Exhibit
1 Lane Additions: Triple Southbound Left-Turn Lanes and Three Northbound Thru Lanes 0.90 Exhibit 4
2 Indirect Left (S/W Quadrant Road) with Three Southbound and Eastbound Thru Lanes 0.94 Exhibit 5
3 Southbound Displaced Left-Turn 0.86 Exhibit 6
4 Southbound and Eastbound Displaced Left-Turns 0.81 Exhibit 7
5 Full Diamond Interchange with Dual Eastbound and Westbound Left-Turn Lanes 0.82 Exhibit 8
6 Half Diamond Interchange with Dual Eastbound Left-Turn Lanes 0.79 Exhibit 9
7 Single Point Interchange with Dual Eastbound and Westbound Left-Turn Lanes 0.80 Exhibit 10
As shown, all alternatives meet the mobility target. Differences on their costs and impacts are provided
in the following section.
Alternatives Assessment
Each of the alternatives was qualitatively evaluated for its impact to the intersection capacity, right-of-
way impacts, environmental impact, bicycle and pedestrian impacts, cost, connectivity, and
dependence on other projects. These factors are discussed below and summarized in Table 5.
Capacity
Each of the alternatives provides sufficient capacity to meet the current mobility standard in 2035.
However, the triple left-turns and indirect left alternatives (Alternatives 1 and 2) still have an overall v/c
ratio equal or greater than 0.90 and may represent a short-term fix rather than a long-term solution or
may not provide benefit commensurate with the costs. The displaced left-turn alternatives (Alternatives
3 and 4) provide additional capacity nearly equal to the grade-separated interchange alternatives
(Alternatives 5, 6 and 7) at a significantly lower cost.
Right-of-Way Impacts
Alternatives 1, 3, and 4 may be feasible within the existing right-of-way. Alternative 2 would require
right-of-way through a vacant but developing parcel to connect OR213 to Fir Street. All of the grade
separated interchange alternatives include large impacts to the right-of-way. The half diamond
interchange reduces right-of-way takes as compared to the full diamond interchange without
eliminating necessary movements through the intersection.
6 2035 30
th highest hour volumes were estimated by adjusting winter count data by a seasonal factor of 8.5% to
summer peak volumes. The count data, 2015 Base Year and 2040 Future Year volumes were post-processed using the
NCHRP 255 methodology to produce 2035 turning movement volumes at each intersection.

Highway 213 Corridor Alternative Mobility Targets Alternatives Analysis
December 2017
28 Kittelson & Associates, Inc.
Environmental Impacts
For all alternatives, any widening on the north side of Beavercreek Road, east or west of OR213 would
impact the stream and wetlands and require mitigation. They would also require extending the existing
culvert crossing under OR213 on the north side of Beavercreek Road and reconstruction of the retaining
walls in the northwest and northeast corners of the intersection. Additional investigation is necessary
to fully understand the costs of these potential impacts and to determine if the culvert can be extended
or has to be upgraded or if the widening could be accommodated utilizing existing right-of-way on the
south side of Beavercreek Road.
Alternative 1 is the only alternative with the potential to not impact the northwest and northeast
corners. Alternative 3 may impact the northeast corner only. Alternatives 2 and 4 would impact the
northwest and northeast corners and Alternatives 5, 6, and 7 would have significant impacts in the
northwest and northeast quadrants.
Bicycle and Pedestrian Impacts
All alternatives can accommodate bicycles and pedestrians; however, Alternatives 1 and 2 include
additional through lanes and would increase the intersection crossing distances which is an undesirable
impact. Alternatives 3 and 4 reduce the crossing distances but result in two-stage crossing of some legs
of the intersection. Alternatives 5, 6, and 7 increase and decrease crossing distances depending on the
leg of the intersection and result in cyclists and pedestrians navigating two major intersections instead
of one.
Cost
The costs of adding additional lanes, indirect lefts, or displaced left-turns are all of similar magnitude
and may require extending or reconstructing the culvert and reconstructing retaining walls. Alternatives
3 and 4 also require the addition of partial signals on one or both of the southbound and eastbound
legs of the intersection, respectively. Each of the interchange alternatives (Alternatives 5, 6 and 7) are
assumed to be cost-prohibitive at a minimum cost of $25,000,000.
Connectivity
Turning movements to and from the south leg of OR213 are minimal due to the presence of parallel
routes and/or other road network connections. The half diamond interchange alternative (Alternative
6) eliminates these movements, thereby improving capacity at the intersection. There is the potential
to further improve the capacity of the displaced left-turn alternatives (Alternatives 3 and 4) by
prohibiting the northbound and westbound left-turn movements as these movements have minimal
traffic volumes; however, this is not a requirement of the alternatives. The connectivity improvements
in the TSP are important to the flexibility and viability of these alternatives.

Highway 213 Corridor Alternative Mobility Targets Alternatives Analysis
December 2017
29 Kittelson & Associates, Inc.
Dependence on Other Projects
As noted in the discussion of connectivity above, the half diamond interchange alternative (Alternative
6) is dependent on other projects in the area to provide the parallel routes necessary to accommodate
the movements eliminated from the OR213/Beavercreek Road intersection. The practicality of the
additional northbound through lane in the triple left-turns alternative (Alternative 1) is also dependent
on the provision of road extensions, particularly the planned Meyers Road extension to OR213.
Table 5 – Alternatives Evaluation
Alternative Additional
Capacity
Right-of-Way
Impacts
Environmental
Impact
Bike/Ped
Impacts Cost
Eliminates
Movements?
Existing None None None No
Improvement NA No
1
Triple Southbound
Left / Three
Northbound Thru
Some None to Minimal None to
Minimal
Increased
Crossing
Distances
Medium
($5-$10M) No
2A Indirect Left (S/W
Quadrant Road)
Some
v/c=0.90
New Connection
on Industrial
Land
NW and NE
Corners
Increased
Crossing
Distances
Medium
($5-$8M) No
2B
Indirect Left (S/W
and S/E Quadrant
Roads)
Unknown
New Connection
on Industrial
Land and
Shopping Center
Impacts
NW and NE
Corners
Increased
Crossing
Distances
Medium
($10-$15M) No
3 Southbound
Displaced Left-Turn
Significant
v/c=0.86 None to Minimal NE Corner
Reduced
Crossing
Distances
Medium
($5-$10M)
Would
provide
additional
benefit
4
Southbound and
Eastbound Displaced
Left-Turns
Significant
v/c=0.81 None to Minimal
NW and NE
Corners
Reduced
Crossing
Distances
Medium
($8-$12M)
Would
provide
additional
benefit
5 Full Diamond
Interchange
Significant
v/c=0.82 High
NW and NE
Quadrants
Two
intersections
High
(>$25M) Yes
6 Half Diamond
Interchange
Significant
v/c=0.79 High
NW and NE
Quadrants
Two
intersections
High
(>$25M) No
7 Single Point
Interchange
Significant
v/c=0.80 High
NW and NE
Quadrants
Increased
Crossing
Distances
High
(>$25M) No
The following alternatives were identified for further review to determine physical and financial
feasibility:
• Alternative 1: Triple Left-Turns
• Alternative 3: Displaced Southbound Left-Turns
• Alternatives 5 & 7: Full Diamond Interchange and Single Point Interchange
Table 6 lists these alternatives, as well as their relative benefits, constraints, opportunities, and risks.

Highway 213 Corridor Alternative Mobility Targets Alternatives Analysis
December 2017
30 Kittelson & Associates, Inc.
Table 6 – Intersection Alternatives Considered
Alternative Benefits Opportunities Constraints Risks
Alternative 1:
Triple Left-Turns
Meets current mobility
target in 2035
North and east
legs of
intersection
Cost; vehicle
navigation of
three left-turn
lanes
Increase sideswipe crashes
through turn and
downstream weave
Alternative 3:
Displaced
Southbound Left
Turns
Meets current mobility
target in 2035
North leg of
intersection
Cost; impact to
existing culvert
and retaining
walls
Driver confusion with new
intersection type for
Oregon
Alternative 5: Full
Diamond
Interchange
Meets current mobility
target in 2035; greatly
increases capacity for
through traffic on OR213
All approaches of
the intersection
Cost; right-of-way Increased intersection
exposure (i.e., two large
ramp terminals) for
pedestrians and bicyclists
Alternative 7:
Single-Point
Interchange
Meets current mobility
target in 2035; greatly
increases capacity for
through traffic on OR213
All approaches of
the intersection
Cost; right-of-way
Potential improvements for the intersection of Beavercreek Road and OR213 that focused on
significantly increasing the intersection capacity to meet the current mobility target were presented to
the TAG and CAG in December 2016 and January 2017. None of the alternatives were determined to be
financially feasible, even by the 2035 horizon year of the TSP given the financial constraints of the city
and other agency partners. In addition, some of the potential alternatives could have additional
consequences including right-of-way impacts, environmental impacts, and could potentially complicate
the provision of services for bicyclists, pedestrians, and transit users. These alternatives can be further
considered in the future if additional funding becomes available.
ALTERNATIVES – OR213 AND REDLAND ROAD
As Phase 2 of the “Jughandle” Project (D79 in the TSP) has already been identified to resolve capacity
deficiencies at OR213/Redland Road, no additional alternatives were developed for the intersection.
Section 6
Alternative Mobility Target and Financially Feasible
Improvements Assessment
Highway 213 Corridor Alternative Mobility Targets Alternative Mobility Target and Financially Feasible Improvements Assessment
December 2017
32 Kittelson & Associates, Inc.
ALTERNATIVE MOBILITY TARGET AND FINANCIALLY FEASIBLE
IMPROVEMENTS ASSESSMENT
ALTERNATIVE MOBILITY TARGET
The OR213/Beavercreek Road and OR213/Redland Road intersections are currently experiencing
deficiencies in capacity and safety for vehicular modes of travel. Mobility is currently measured by using
v/c to measure the average level of congestion for motorists entering all legs of an intersection.
Technical Memo #2 in Appendix “A” documents the menu of performance measure options that were
discussed with the TAG and CAG to measure congestion both at an intersection and along the Highway
213 corridor, from Redland Road to Molalla Avenue.
The majority of TAG and CAG members agreed that an alternative mobility target allowing intersection
volume-to-capacity ratios to exceed the existing targets for no more than a specified number of hours
per day would be appropriate for the corridor based on a range of considerations including ease of
application and applicability to development review. The following sections describe the safety and
operational analysis that was used to recommend cost-feasible improvements and corresponding
alternative mobility targets.
SAFETY AND CAPACITY ANALYSIS
The TSP does not identify a large capacity project at the intersection of OR213 and Beavercreek Road,
but several smaller feasible projects are identified. The TSP identifies a large capacity project at the
intersection of OR213 and Redland Road, but it is not likely to be funded. Because achieving the
mobility standard through a major capacity-expanding project at these intersections has been
determined to be beyond the financial capabilities of the city and its partner agencies, an alternative
mobility target will be necessary. As a result of this study, some improvements were identified that,
while not allowing the mobility standard to be fully met, would increase the intersection capacity,
improve safety, and are within the financial capabilities of the city and its partner agencies. Safety and
operational improvements are identified below that minimize future congestion and can be included in
the cost-constrained TSP.
SAFETY AND CAPACITY IMPROVEMENTS
Safety and capacity improvements to OR213 from Redland Road to Molalla Avenue (including the
Beavercreek Road intersection) could be implemented in tandem with the proposed alternative
mobility targets. These approaches, while not providing adequate capacity to meet the current mobility
target, would increase capacity and/or safety at the intersection, providing an overall improvement.
Table 7 lists these improvements, as well as their relative benefits, constraints, opportunities, and risks.

Highway 213 Corridor Alternative Mobility Targets Alternative Mobility Target and Financially Feasible Improvements Assessment
December 2017
33 Kittelson & Associates, Inc.
Table 7 – Intersection Improvement Approaches Considered
Improvement Benefits Opportunities Constraints Risks
Increase all-red time Reduces red-light
running crashes,
particularly turning
and angle crashes
All
approaches
of the
intersection
Reduces intersection capacity
and increases queueing. Helps
reduce turning and angle
crashes, which are not
prevalent at this intersection.
Increase rear-end
crashes, the most
common type at
signalized
intersection
Install red-light
cameras
Reduces red-light
running crashes,
particularly turning
and angle crashes
All
approaches
of the
intersection
Community Opposition. Helps
reduce turning and angle
crashes, which are not
prevalent at this intersection.
Increase rear-end
crashes, the most
common type at
signalized
intersection
Increase shoulder
width
Safer bicycle travel North leg of
intersection
Costs/Impacts to retaining wall N/A
Improve lighting Increase safety for all
modes
North and
south legs of
intersection
N/A N/A
Provide merge lane
for WB to NB right
turning vehicles
Reduce queuing
between OR213 and
Maple Lane, and
increase capacity of
westbound approach
North leg of
intersection
Retaining wall in northeast
corner of the intersection
Increase sideswipe
crashes
Eliminate westbound
left-turn lane and
extend eastbound left
turn storage onto
Maple Lane
Reduce queuing and
crashes related to
queues on
Beavercreek Road at
Maple Lane
East leg of
intersection
Rerouting of westbound lefts
to Meyers Road and potential
increased travel time
Confusion by
drivers resulting in
illegal maneuvers
The TAG and CAG were in favor of further investigation of potential improvements to increase safety
and capacity at the Beavercreek Road and OR213 intersection. The specific projects identified by the
TAG and CAG for additional analysis included: 1) the provision of a merge lane for westbound right-
turning vehicles and 2) elimination of the second westbound left-turn lane to increase left-turn storage
on eastbound Beavercreek Road at Maple Lane Road. The provision of a westbound right-turn merge
lane is described in the following sections and shown in Figure 2. The elimination of the second
westbound left-turn lane to increase left-turn storage on eastbound Beavercreek Road at Maple Lane
Road was highly supported by the CAG and was found to be viable and not impact the intersection v/c
ratio; however it is recommended that this be considered at a later date in combination with potential
improvements at the Beavercreek Road/Maple Lane intersection.
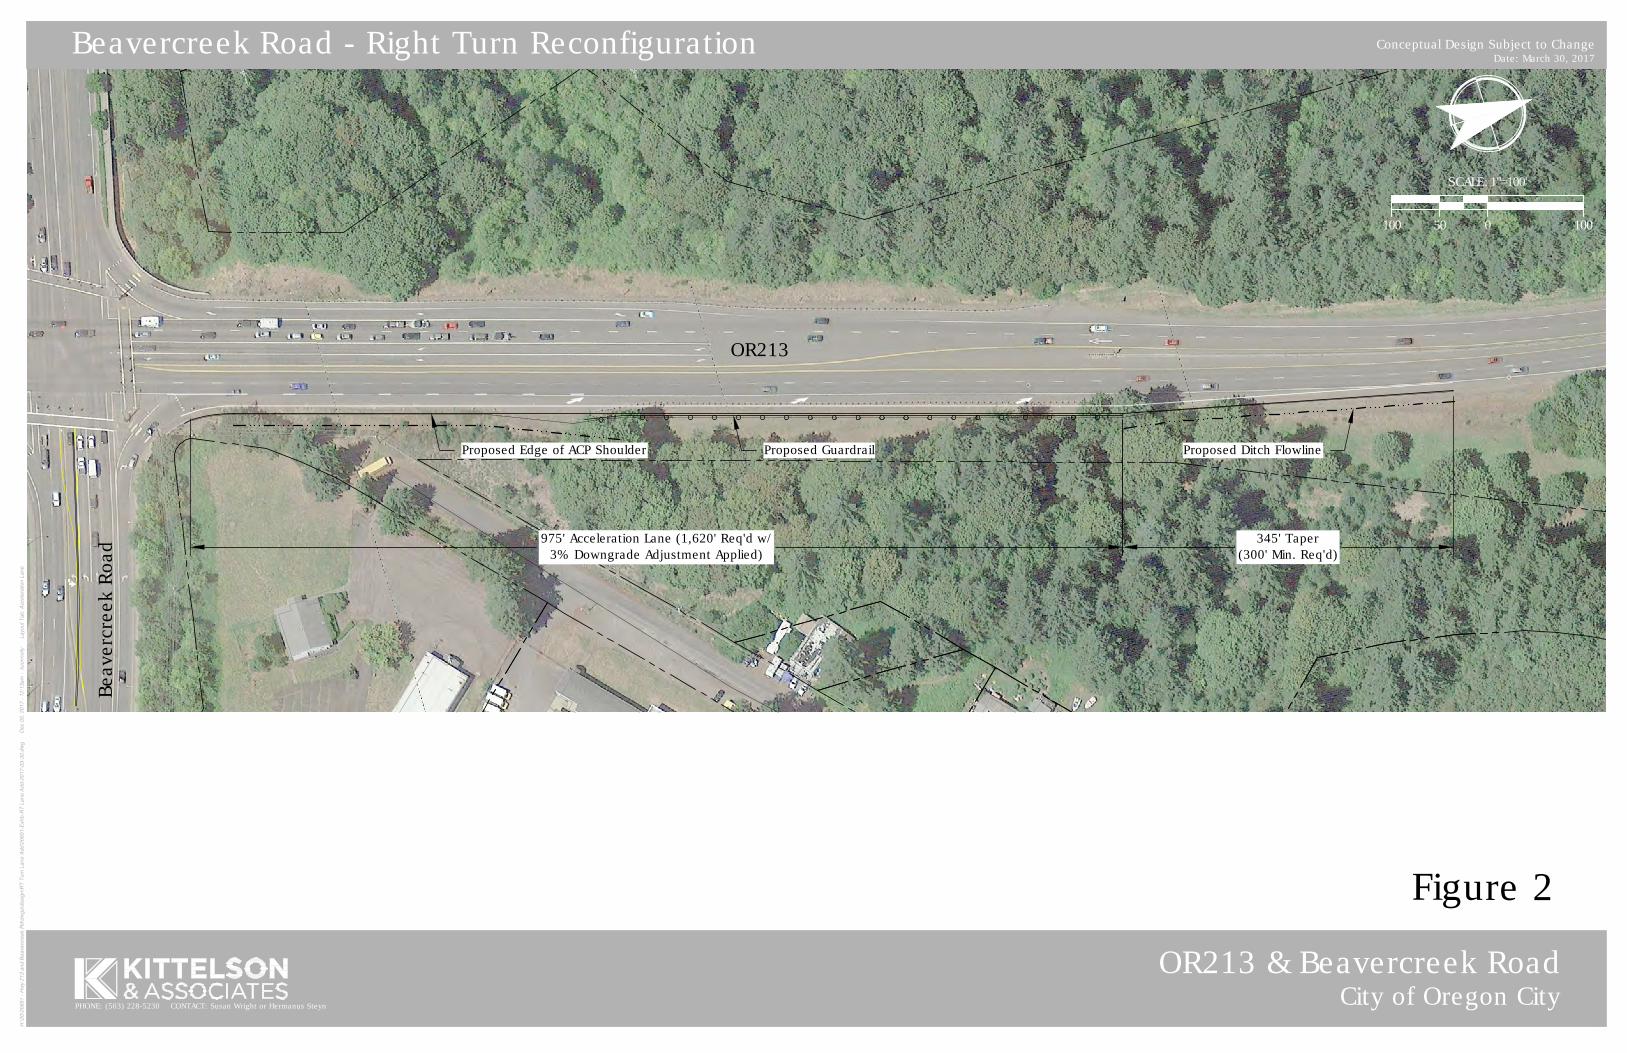
PHONE: CONTACT:
OR213 & Beavercreek Road
City of Oregon City
Beavercreek Road - Right Turn Reconfiguration
Conceptual Design Subject to Change
Date: March 30, 2017
Susan Wright or Hermanus Steyn(503) 228-5230
0
SCALE: 1"=100'
100100 50
Beavercreek Road
OR213
Proposed Guardrail
975' Acceleration Lane (1,620' Req'd w/
3% Downgrade Adjustment Applied)
345' Taper
(300' Min. Req'd)
Proposed Edge of ACP Shoulder Proposed Ditch Flowline
Figure 2

Highway 213 Corridor Alternative Mobility Targets Alternative Mobility Target and Financially Feasible Improvements Assessment
December 2017
35 Kittelson & Associates, Inc.
Additional safety improvements identified by the City for further investigation, or to be included as part
of future projects in the area include:
• Install intersection enhancements including potential raised crosswalks, bike lane striping
continuation, ladder-style crosswalks, and lane narrowing.
• Add wayfinding signage for people walking and biking.
• Enhance bike lanes on Beavercreek Road with additional markings and green striping in
transition areas.
• Add buffers to bike lanes on Beavercreek Road where feasible.
• Add ADA curb ramps in the OR213/Beavercreek Road area where missing.
• Add pedestrian facilities to Maple Lane Road between Beavercreek Road and Thayer Road.
• Add transit stop amenities to existing stops in the area.
The following provides an overview of safety and operations at OR213/Beavercreek Road and
OR213/Redland Road, and cost estimates of potential cost-feasible safety and operational
improvements that could be implemented at the OR213/Beavercreek Road intersection in conjunction
with alternative mobility targets.
Safety Analysis
The OR213/Beavercreek Road intersection was identified in the 2013 TSP as a high collision
intersection. The Oregon Department of Transportation (ODOT) Crash Analysis and Reporting Unit
provided crash records at the intersection for the 5-year period from January 2010 through December
2014. Table 8 summarizes the reported crash data. The crash data is included in Appendix “D”.
Table 8 - OR213/Beavercreek Road Intersection Crash Summary and Crash Rate Assessment (2010-2014)
PDO = Property Damage Only
Crash Rate = crashes per million entering vehicles
The intersection was in the top 5% of the ODOT Safety Priority Index System (SPIS) List for the years
2012-2014. The SPIS List is maintained by ODOT and updated each year with the latest available year of
crash records and traffic volumes. 2012-2014 is the most current SPIS list. The intersection also has a
crash rate that exceeds the Critical Crash Rate meaning that it exceeds the crash rate of other
comparable intersections.
As shown in Table 8, the most predominant crash type at the OR213/Beavercreek Road intersection is
rear-end crashes. Beavercreek Road is the first at-grade intersection on OR213 for over two miles south
of Redland Road, in a corridor that generally feels rural. A lack of driver expectation of southbound
queues from the signal may contribute to the high number of reported rear-end crashes at the
Crash Type Severity
Total
Critical
Crash Rate
by
Intersection
Type
Critical
Crash
Rate by
Volume
Observed
Crash Rate
at
Intersection
Observed
Crash
Rate>Critic
al Crash
Rate?
Rear-
End Turning Angle Other PDO Injury Fatal
116 7 5 5 58 74 1 133 0.59 0.50 1.20 Yes

Highway 213 Corridor Alternative Mobility Targets Alternative Mobility Target and Financially Feasible Improvements Assessment
December 2017
36 Kittelson & Associates, Inc.
intersection. The reported fatality occurred in 2011, and was an angle crash in which the driver ran a
red light under dark and rainy conditions. The 2010-2014 crash rate of 1.20 is already lower than the
crash rate of 2.05 identified in the 2013 TSP, indicating that safety and/or driver attentiveness have
improved in recent years. Lengthening the dual eastbound left-turn lanes to provide additional storage
(Project D27; funded) and an advanced queue warning system on southbound 213 will further improve
safety at the intersection.
Crash data for the OR213/Redland Road intersection was obtained from the February 2017 Serres Farm
Annexation Traffic Impact Study for the 3-year period from January 2013 through December 2015.
Table 9 summarizes the reported crash data. The crash data is included in Appendix “D”.
Table 9 - OR213/Redland Road Intersection Crash Summary and Crash Rate Assessment (2013-2015)
PDO = Property Damage Only
Crash Rate = crashes per million entering vehicles
Both the OR213/Beavercreek Road and OR213/Redland Road intersections have observed crash rates
which exceed the Critical Crash Rate, meaning that they exceed the crash rate of other comparable
intersections. For this reason, applicable TSP planned improvements and other potential improvements
were analyzed at each intersection to determine their impact on the expected crash frequency at each
intersection. Table 10 summarizes the improvements in the TSP.
Table 10 – 2013 Oregon City Transportation System Plan Projects located in the southeast part of the City
Project # Project Description Project Extent Project Elements Priority Funded?
D14
Southbound OR 213
Advanced Warning
System
Southbound OR
213, north of the
Beavercreek Road
intersection
Install a queue warning system for southbound
drivers on OR 213 to automatically detect queues
and warn motorists in advance via a Variable
Message Sign
Short-
term Likely
D79
OR 213/Redland
Road Capacity
Improvements
Redland Road to
Redland Road
Undercrossing
Add a third northbound travel lane on OR 213 north
of the Redland Road undercrossing.
Extend the third southbound travel on OR 213
south of the Redland Road intersection and merge
the third lane before the Redland Road
undercrossing.
Add a right-turn lane (southbound OR 213 to
westbound Redland).
Convert the Redland Road approach to OR 213 to 1
receiving lane, 2 left-turn approach lanes, and 1
right-turn lane.
Long-
term
Not
Likely
In addition to these planned improvements, the impact of a westbound right-turn merge lane at
OR213/Beavercreek Road and an additional southbound through lane (shared with the southbound
right-turn lane) at OR213/Redland Road were analyzed. The intersections and improvements were
Crash Type Severity
Total
Critical
Crash Rate
by
Intersection
Type
Critical
Crash
Rate by
Volume
Observed
Crash Rate
at
Intersection
Observed
Crash
Rate>Critic
al Crash
Rate?
Rear-
End Turning Angle Other PDO Injury Fatal
22 4 0 1 8 19 0 27 0.39 0.54 0.44 Yes
Highway 213 Corridor Alternative Mobility Targets Alternative Mobility Target and Financially Feasible Improvements Assessment
December 2017
37 Kittelson & Associates, Inc.
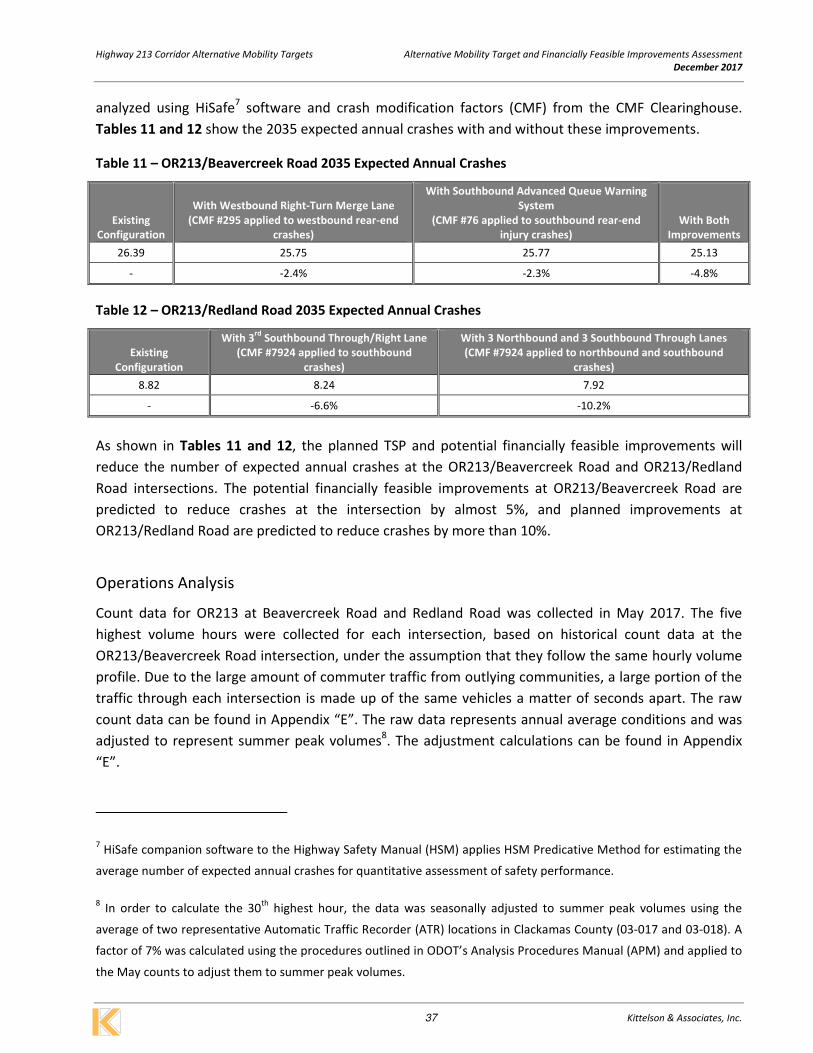
analyzed using HiSafe7 software and crash modification factors (CMF) from the CMF Clearinghouse.
Tables 11 and 12 show the 2035 expected annual crashes with and without these improvements.
Table 11 – OR213/Beavercreek Road 2035 Expected Annual Crashes
Table 12 – OR213/Redland Road 2035 Expected Annual Crashes
As shown in Tables 11 and 12, the planned TSP and potential financially feasible improvements will
reduce the number of expected annual crashes at the OR213/Beavercreek Road and OR213/Redland
Road intersections. The potential financially feasible improvements at OR213/Beavercreek Road are
predicted to reduce crashes at the intersection by almost 5%, and planned improvements at
OR213/Redland Road are predicted to reduce crashes by more than 10%.
Operations Analysis
Count data for OR213 at Beavercreek Road and Redland Road was collected in May 2017. The five
highest volume hours were collected for each intersection, based on historical count data at the
OR213/Beavercreek Road intersection, under the assumption that they follow the same hourly volume
profile. Due to the large amount of commuter traffic from outlying communities, a large portion of the
traffic through each intersection is made up of the same vehicles a matter of seconds apart. The raw
count data can be found in Appendix “E”. The raw data represents annual average conditions and was
adjusted to represent summer peak volumes8. The adjustment calculations can be found in Appendix
“E”.
7 HiSafe companion software to the Highway Safety Manual (HSM) applies HSM Predicative Method for estimating the
average number of expected annual crashes for quantitative assessment of safety performance.
8 In order to calculate the 30
th highest hour, the data was seasonally adjusted to summer peak volumes using the
average of two representative Automatic Traffic Recorder (ATR) locations in Clackamas County (03-017 and 03-018). A
factor of 7% was calculated using the procedures outlined in ODOT’s Analysis Procedures Manual (APM) and applied to
the May counts to adjust them to summer peak volumes.
Existing
Configuration
With Westbound Right-Turn Merge Lane
(CMF #295 applied to westbound rear-end
crashes)
With Southbound Advanced Queue Warning
System
(CMF #76 applied to southbound rear-end
injury crashes)
With Both
Improvements
26.39 25.75 25.77 25.13
- -2.4% -2.3% -4.8%
Existing
Configuration
With 3rd
Southbound Through/Right Lane
(CMF #7924 applied to southbound
crashes)
With 3 Northbound and 3 Southbound Through Lanes
(CMF #7924 applied to northbound and southbound
crashes)
8.82 8.24 7.92
- -6.6% -10.2%

Highway 213 Corridor Alternative Mobility Targets Alternative Mobility Target and Financially Feasible Improvements Assessment
December 2017
38 Kittelson & Associates, Inc.
Metro provided 2015 Base Year and 2040 Future Year hourly turn movement volumes for
OR213/Beavercreek Road and OR213/Redland Road. These volumes reflect the most current land use
assumptions and include full build-out of Oregon City’s urban growth boundary areas in addition to
growth in the rest of the region, including through traffic from outlying communities. These hourly plots
can be found in Appendix “E”. The count data, 2015 Base Year and 2040 Future Year volumes were
post-processed using the NCHRP 2559 methodology to produce 2040 turning movement volumes at
each intersection under both the annual average and 30th
highest hour conditions. The calculations for
this process can be found in Appendix “E”.
A Synchro (traffic model used to evaluate v/c ratios and other metrics) analysis was conducted for the
five highest traffic volume hours at the OR213/Beavercreek Road and OR213/Redland Road
intersections under both the annual average (typical May peak hours) and 30th
highest hour (typical
August peak hour) conditions. The results of this analysis are summarized in Tables 13 and 14. The full
reports can be found in Appendix “F”.
Table 13 – 2040 Synchro Volume-to-Capacity Analysis Summary: Annual Average Conditions
1The 5
th highest overall volume hour at OR213/Beavercreek Road under the existing intersection configuration has a higher v/c
because certain movements in this hour exhibit higher volumes than in the peak hour. For example, during the morning peak the
westbound right-turn movement is significantly higher than during the afternoon peak, impacting v/c.
Table 14 – 2040 Synchro Volume-to-Capacity Analysis Summary: 30th
Highest Hour Conditions
1The 5
th highest overall volume hour at OR213/Beavercreek Road under the existing intersection configuration has a higher v/c
because certain movements in this hour exhibit higher volumes than in the peak hour. For example, during the morning peak the
westbound right-turn movement is significantly higher than during the afternoon peak, impacting v/c.
The analysis in Tables 13 and 14 shows that, without improvements, the OR213/Beavercreek Road and
OR213/Redland Road intersections will exceed current mobility targets in 2040 (shown in red). With
potentially financially feasible improvements in place (i.e. a westbound right-turn merge lane at
OR213/Beavercreek), the intersections will still exceed the existing mobility targets under 30th
highest
9 This document sets forth procedures to refine computerized traffic volume forecasts by comparing base year and
future year volumes to count data.
Scenario
Peak Hour
4:00 pm
2nd
Highest Hour
5:00 pm
3rd
Highest Hour
3:00 pm
4th
Highest Hour
2:00 pm
5th
Highest Hour
7:00 am
213/Beavercreek 1.11 1.11 1.10 0.96 1.341
213/Beavercreek with Right-Turn
Merge Lane 0.98 1.00 0.99 0.87 0.90
213/Redland 1.10 1.09 1.04 0.99 0.91
Scenario
Peak Hour
4:00 pm
2nd
Highest Hour
5:00 pm
3rd
Highest Hour
3:00 pm
4th
Highest Hour
2:00 pm
5th
Highest Hour
7:00 am
213/Beavercreek 1.15 1.15 1.14 1.00 1.391
213/Beavercreek with Right-Turn
Merge Lane 1.01 1.04 1.03 0.90 0.93
213/Redland 1.13 1.12 1.07 1.02 0.94

Highway 213 Corridor Alternative Mobility Targets Alternative Mobility Target and Financially Feasible Improvements Assessment
December 2017
39 Kittelson & Associates, Inc.
hour traffic conditions. Therefore, it is recommended that alternative mobility targets be based on
average annual conditions, allowing the v/c ratio to exceed 0.99 for one hour per day at the
OR213/Beavercreek Road intersection (upper limit of 1.0) and three hours per day at the
OR213/Redland Road intersection (upper limit of 1.1).
Merge Analysis
The intersection of OR213 and Beavercreek Road was evaluated to ensure that the segment north of
Beavercreek Road on OR213 would provide acceptable traffic operations with the proposed merge
lane. The evaluation was performed both for a merge length of 1,300’ and 2,000’. A 1,300’ merge meets
ODOT standards based on a length reduction for grade. A 2,000’ merge exceeds ODOT standards for the
existing grade on OR213 and places the end of the merge within a horizontal curve. Additionally, the
analysis below shows that the 2,000’ merge has a negative impact on delay due to greater difficulty
merging at higher speeds.
Segment Analysis Methodology
A traffic simulation analysis was conducted using the 2040 annual average traffic volumes and the
proposed westbound right-turn merge lane. The simulation analysis used the SimTraffic software
(sample graphic shown in Exhibit 11). The parameters were adjusted according to the ODOT Analysis
and Procedures Manual (APM). The traffic simulation generates random patterns of vehicle movements
consistent with the peak hour traffic volumes, so that no single simulation generates “the” answer. The
AM and PM peak hour traffic volumes were each run through the SimTraffic simulation five times. The
results of the five simulation runs were averaged to generate the final results. This is consistent with
standard recommended methodologies for reporting results from traffic simulations. The outputs
include:
• Average speeds and delays on the segment in the northbound direction.
• Average delays on the westbound right-turn movement.
The simulation is sensitive to delays caused by difficult merge or lane-change movements. If any of
these movements are particularly difficult, the simulation would report slow speeds or queues on the
affected segments.

Highway 213 Corridor Alternative Mobility Targets Alternative Mobility Target and Financially Feasible Improvements Assessment
December 2017
40 Kittelson & Associates, Inc.
Exhibit 11 – Sample Traffic Simulation (SimTraffic), OR213/Beavercreek Road Intersection
Segment Speeds
The Highway Capacity Manual defines level of service for urban street segments based on travel speed
as a percentage of free-flow speed. Level of service (LOS) C corresponds to an average speed between
50 and 67 percent of free-flow speed. Assuming a free-flow speed of 55 mph on OR213 north of
Beavercreek Road, LOS C operation would be an average speed between 27.5 and 36.9 mph.
The average speeds and delays for OR213 through the westbound to northbound merge from
Beavercreek Road (north of the signal) based on the simulation analysis are reported in Table .

Highway 213 Corridor Alternative Mobility Targets Alternative Mobility Target and Financially Feasible Improvements Assessment
December 2017
41 Kittelson & Associates, Inc.
Table 15 – OR213 and Beavercreek Road Speeds and Delays, 2040 Annual Average Volumes
Scenario Peak Hour
Average Speed
(mph)
Average Delay
per Vehicle
(seconds)
1300’ Merge AM 34.0 9.8
PM 36.0 8.1
2000’ Merge AM 39.0 10.1
PM 41.0 8.3
Average speeds are within an acceptable (LOS C) range for the proposed 1,300’ merge and even higher
for the 2,000’ merge. Keeping in mind that most vehicles are accelerating from a stop through the
Beavercreek Road signal, and will not have to slow significantly during the merge, the difference in
speeds is primarily attributed to the additional distance for vehicles already on OR213 to accelerate.
Additionally, the average delay per vehicle is higher with the 2,000’ merge, indicating that the merging
maneuver actually creates more conflicts when there are higher speeds on OR213.
The segment merge analysis shows that acceptable levels of service can be maintained with a 1,300’
merge lane for the westbound right-turn movement. A 2,000’ merge would occur within a horizontal
curve on OR213, increasing the risk of sideswipe and run-off-the-road crashes. Therefore, it is
recommended that a 1,300’ merge length be provided.
Westbound Right Turn Operations
The traffic simulation tested the operations of the proposed free-right turn lane from westbound
Beavercreek Road to northbound OR213. The operational analysis considered the capacity of the right-
turn lane as well as the capacity of the merge with northbound traffic on OR213, but does not reflect
delay caused by pedestrian movements at the intersection.
Table 16 – OR213 and Beavercreek Road Westbound Right-Turn Delay, 2040 Annual Average Volumes
Scenario Peak Hour
Average Delay per Vehicle
(seconds)
1300’ Merge AM 13.6
PM 16.6
2000’ Merge AM 13.9
PM 16.5
The average delays on the right-turn movement are similar with either the 1300’ or 2000’ merge, as
shown in Table 16. The longer merge does not significantly reduce delay, and in fact increases delay
during the AM peak hour, which is the critical westbound right-turn movement volume.
Pedestrian Crossing
High visibility pavement markings and signage are recommended for pedestrians and bicycles to cross
the channelized lane safely, and consideration should be given to installing enhanced pedestrian
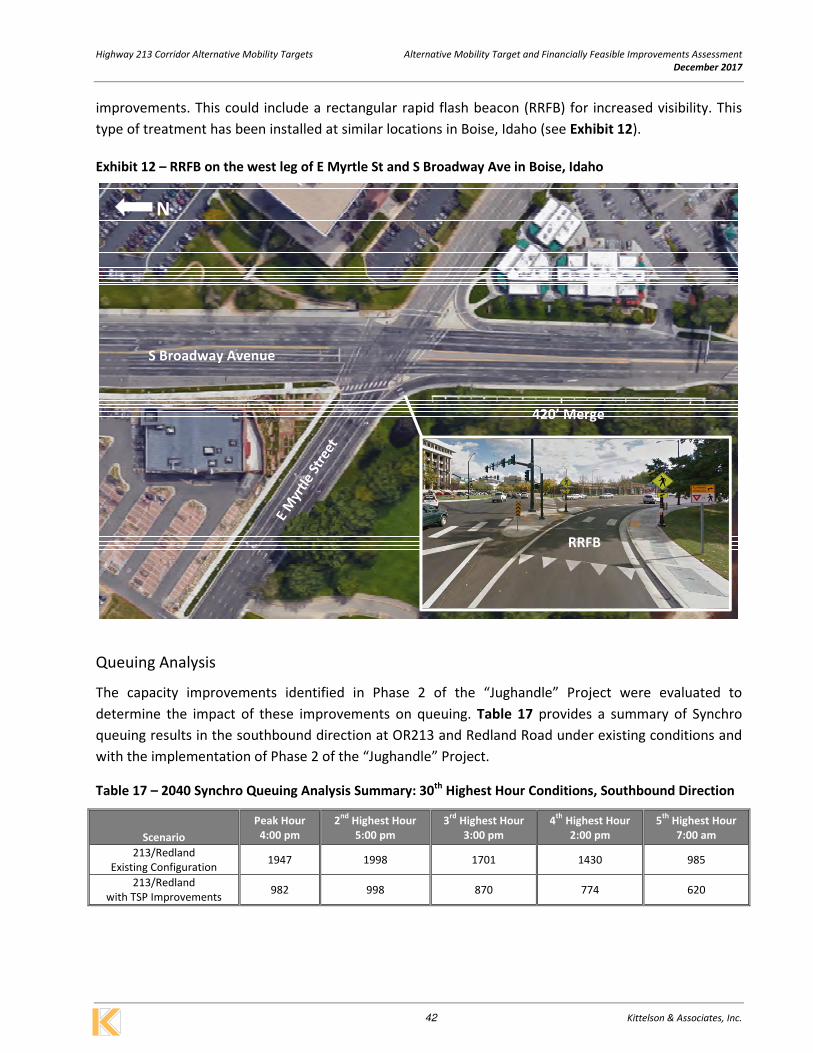
Highway 213 Corridor Alternative Mobility Targets Alternative Mobility Target and Financially Feasible Improvements Assessment
December 2017
42 Kittelson & Associates, Inc.
improvements. This could include a rectangular rapid flash beacon (RRFB) for increased visibility. This
type of treatment has been installed at similar locations in Boise, Idaho (see Exhibit 12).
Exhibit 12 – RRFB on the west leg of E Myrtle St and S Broadway Ave in Boise, Idaho
Queuing Analysis
The capacity improvements identified in Phase 2 of the “Jughandle” Project were evaluated to
determine the impact of these improvements on queuing. Table 17 provides a summary of Synchro
queuing results in the southbound direction at OR213 and Redland Road under existing conditions and
with the implementation of Phase 2 of the “Jughandle” Project.
Table 17 – 2040 Synchro Queuing Analysis Summary: 30th
Highest Hour Conditions, Southbound Direction
Scenario
Peak Hour
4:00 pm
2nd
Highest Hour
5:00 pm
3rd
Highest Hour
3:00 pm
4th
Highest Hour
2:00 pm
5th
Highest Hour
7:00 am
213/Redland
Existing Configuration 1947 1998 1701 1430 985
213/Redland
with TSP Improvements 982 998 870 774 620
S Broadway Avenue
420’ Merge
RRFB
N

Highway 213 Corridor Alternative Mobility Targets Alternative Mobility Target and Financially Feasible Improvements Assessment
December 2017
43 Kittelson & Associates, Inc.
The results in Table 17 show that the TSP improvements reduce the queues towards the I-205
interchange by approximately half. However, without the TSP improvements the southbound queues in
Synchro are around 1800-1900 feet which is just past 213/Washington St/Clackamas River Drive.
Cost Estimates
The cost of adding an additional northbound and southbound through lane at OR213/Redland Road,
consistent with TSP project D79, was recently estimated by OBEC to be almost $10 million.
The cost of the westbound right-turn merge lane at OR213/Beavercreek Road is estimated to be
approximately $2.7 million based on the design shown in Figure 2. This estimate does not include right-
of-way acquisition.
The KAI and OBEC cost estimates, as well as exhibits of the proposed financially feasible improvements
at OR213/Beavercreek Road can be found in Appendix “G”.

Highway 213 Corridor Alternative Mobility Targets Alternative Mobility Target and Financially Feasible Improvements Assessment
December 2017
44 Kittelson & Associates, Inc.
CONCLUSIONS
The intersection improvement alternatives that would meet the existing mobility target at the
OR213/Beavercreek Road intersection are not cost feasible, given the financial constraints of the City
and other agency partners. These alternatives can be further considered in the future if additional
funding becomes available.
Phase 2 of the “Jughandle” project at the OR213/Redland Road intersection is not part of the financially
constrained plan in the 2013 TSP. Like the OR213/Beavercreek Road intersection, major capacity-
increasing improvements at this intersection were determined to be beyond the financial capabilities of
the city and its partner agencies during the TSP development process. It is recommended that this
planned improvement for three through lanes in the northbound and southbound directions remain in
the unconstrained TSP project list.
Lacking the financial capability of implementing major capacity-increasing projects at these locations,
alternative mobility targets are necessary at each of these intersections; however, some improvements
may be feasible in the cost-constrained TSP to improve safety and minimize future congestion.
The following alternative mobility targets are recommended:
For the intersection of OR213 and Beavercreek Road, the following mobility standards apply:
• During the first, second and third hours, a maximum v/c ratio of 1.00 shall be maintained.
Calculation of the maximum v/c ratio will be based on an average annual weekday peak hour.
For the intersection of OR213 and Redland Road, the following mobility standards apply:
• During the first and second hours, a maximum v/c ratio of 1.10 shall be maintained. Calculation
of the maximum v/c ratio will be based on an average annual weekday peak hour.
• During the third hour, a maximum v/c ratio of 1.05 shall be maintained. Calculation of the
maximum v/c ratio will be based on an average annual weekday peak hour.
In conjunction with these alternative mobility targets, the financially feasible improvement to construct
a westbound right-turn merge lane at OR213/Beavercreek Road should be included in the City’s
financially unconstrained plan. The merge lane should have a length of approximately 1300’, including
the taper. High visibility pavement markings and signage are recommended for pedestrians and bicycles
to cross the channelized lane safely, and consideration should be given to installing a rectangular rapid
flash beacon (RRFB) for increased visibility.

Appendix A
CAG and TAG Meeting Notes and
Technical Memorandums

Appendix B
Oregon City GIS Maps

Appendix C
BlueMAC Data

Appendix D
Crash Data

Appendix E
Traffic Volumes

Appendix F
Operations Analysis

Appendix G
Cost Estimates