highly time-resolved evaluation technique of instantaneous title ohshima, s...
TRANSCRIPT

TitleHighly time-resolved evaluation technique of instantaneousamplitude and phase difference using analytic signals for multi-channel diagnosticsa)
Author(s)
Ohshima, S.; Kobayashi, S.; Yamamoto, S.; Nagasaki, K.;Mizuuchi, T.; Kado, S.; Okada, H.; Minami, T.; Lee, H. Y.;Zang, L.; Kenmochi, N.; Kasajima, K.; Ohtani, Y.; Shi, N.;Nagae, Y.; Konoshima, S.; Sano, F.
Citation Review of Scientific Instruments (2014), 85(11)
Issue Date 2014-11
URL http://hdl.handle.net/2433/189550
Right © 2014 AIP Publishing LLC
Type Journal Article
Textversion publisher
Kyoto University

Highly time-resolved evaluation technique of instantaneous amplitude and phasedifference using analytic signals for multi-channel diagnosticsa)S. Ohshima, S. Kobayashi, S. Yamamoto, K. Nagasaki, T. Mizuuchi, S. Kado, H. Okada, T. Minami, H. Y. Lee,
L. Zang, N. Kenmochi, K. Kasajima, Y. Ohtani, N. Shi, Y. Nagae, S. Konoshima, and F. Sano
Citation: Review of Scientific Instruments 85, 11E814 (2014); doi: 10.1063/1.4891102 View online: http://dx.doi.org/10.1063/1.4891102 View Table of Contents: http://scitation.aip.org/content/aip/journal/rsi/85/11?ver=pdfcov Published by the AIP Publishing Articles you may be interested in Density fluctuation measurements using beam emission spectroscopy on Heliotron Ja) Rev. Sci. Instrum. 83, 10D535 (2012); 10.1063/1.4734039 Experimental study of parametric dependence of electron-scale turbulence in a spherical tokamaka) Phys. Plasmas 19, 056125 (2012); 10.1063/1.4719689 Magnetic X-points, edge localized modes, and stochasticitya) Phys. Plasmas 17, 062505 (2010); 10.1063/1.3449301 Turbulence, magnetic fields, and plasma physics in clusters of galaxiesa) Phys. Plasmas 13, 056501 (2006); 10.1063/1.2179053 Role of nonlinear toroidal coupling in electron temperature gradient turbulencea) Phys. Plasmas 12, 056125 (2005); 10.1063/1.1894766
This article is copyrighted as indicated in the article. Reuse of AIP content is subject to the terms at: http://scitationnew.aip.org/termsconditions. Downloaded to IP:
130.54.110.71 On: Wed, 03 Sep 2014 05:05:26

REVIEW OF SCIENTIFIC INSTRUMENTS 85, 11E814 (2014)
Highly time-resolved evaluation technique of instantaneous amplitude andphase difference using analytic signals for multi-channel diagnosticsa)
S. Ohshima,1,b) S. Kobayashi,1 S. Yamamoto,1 K. Nagasaki,1 T. Mizuuchi,1 S. Kado,1
H. Okada,1 T. Minami,1 H. Y. Lee,3 L. Zang,1,2 N. Kenmochi,2 K. Kasajima,2 Y. Ohtani,2
N. Shi,1 Y. Nagae,2 S. Konoshima,1 and F. Sano1
1Institute of Advanced Energy, Kyoto University, Uji, Kyoto 611-0011, Japan2Graduate School of Energy Science, Kyoto University, Uji, Kyoto 611-0011, Japan3Korea Advanced Institute of Science and Technology, Daejeon 305-701, South Korea
(Presented 5 June 2014; received 5 June 2014; accepted 12 July 2014; published online 6 August2014)
A fluctuation analysis technique using analytic signals is proposed. Analytic signals are suitableto characterize a single mode with time-dependent amplitude and frequency, such as an MHDmode observed in fusion plasmas since the technique can evaluate amplitude and frequency at aspecific moment without limitations of temporal and frequency resolutions, which is problematicin Fourier-based analyses. Moreover, a concept of instantaneous phase difference is newly intro-duced, and error of the evaluated phase difference and its error reduction techniques using condi-tional/ensemble averaging are discussed. These techniques are applied to experimental data of thebeam emission spectroscopic measurement in the Heliotron J device, which demonstrates that thetechnique can describe nonlinear evolution of MHD instabilities. This technique is widely applica-ble to other diagnostics having necessity to evaluate phase difference. © 2014 AIP Publishing LLC.[http://dx.doi.org/10.1063/1.4891102]
I. INTRODUCTION
On conventional spectral analysis techniques on the basisof Fourier transform, there is a crucial trade-off between tem-poral and frequency resolutions based on uncertainty princi-ple, �t · �ω∼ 1/2, since the concept is based on the idea thatan arbitrary wave is described by the sum of waves havingdifferent frequency components. The techniques are a power-ful tool to analyze multi-frequency fluctuation such as turbu-lence and have demonstrated successful results in almost allthe research filed in science. However, this is not intuitivelyplausible to express a single mode with time-dependent fre-quency and amplitude, for example, MHD phenomena ob-served in fusion devices. For instance, if we apply short-timefast Fourier transform (FFT) to the signal of cyclic MHD ac-tivities appearing repeatedly within shot time period, the spec-trum broadening in time and frequency domains would beobserved in the spectrogram although the amplitude and fre-quency of the waveform can simply be expressed and definedas x(t) = A(t)exp (i
∫ω(t)dt)), where the A(t) and ω(t) are time
dependent amplitude and frequency, respectively.In this article, a new fluctuation analysis technique using
analytic signals is proposed to clarify detailed temporal be-havior of fluctuations. The details of the analysis techniqueusing analytic signals, introduction of the concept of instan-taneous phase difference and discussion for the error, and anapplication to experimental data will be shown and discussed.
a)Contributed paper, published as part of the Proceedings of the 20th Top-ical Conference on High-Temperature Plasma Diagnostics, Atlanta, Geor-gia, USA, June 2014.
b)Author to whom correspondence should be addressed. Electronic mail:[email protected]
II. FLUCTUATION ANALYSIS USINGANALYTIC SIGNALS
A. Basic analysis technique using analytic signals
An analytic signal, defined as X(t) = A(t)exp(iθ (t)), is acomplex function where A(t) and θ (t) are the mean instanta-neous amplitude and instantaneous phase and its time deriva-tive ω(t) = d/dt(θ (t)) is instantaneous frequency of the signal,respectively.1 This expression is suitable to express temporaldevelopment of a single mode such as a MHD instability. Theanalytic signal is expressed as X(t) = x(t) + i/π
∫x(t′)/(t −
t′)dt′, which means that the real part, Re(X(t)), corresponds tothe real signal x(t). In other words, the real signal is the pro-jection of the analytic signal on real axis. The second term,the convolution operation, is known as Hilbert transform.Mathematically this calculation is equal to the followingexpression:
X(t) = 2/(2π )∫ ∞
0S(ω) exp(iωt)dω,
which corresponds to the inverse Fourier transform of the realpart of Fourier spectrum S(ω) and is easily achieved by con-ventional FFT routines. Here the amplitude (A(t) = |X(t)|) andthe argument (θ (t) = arg(X(t))) of the analytic signal are therequired instantaneous amplitude and the instantaneous phaseat a specific moment.
This technique was applied to a test signal and the re-sult was compared to those of other analysis techniques, FFTand wavelet analyses, in Figure 1. Figure 1(a) shows the testsignal which is a realistic time-series signal prepared to sim-ulate bursting MHD activity with time dependent amplitudeA(t) and frequency ω(t), described as A(t)sin (i
∫ω(t)dt)). We
assumed that the frequency rapidly chirps down from 90 to
0034-6748/2014/85(11)/11E814/4/$30.00 © 2014 AIP Publishing LLC85, 11E814-1
This article is copyrighted as indicated in the article. Reuse of AIP content is subject to the terms at: http://scitationnew.aip.org/termsconditions. Downloaded to IP:
130.54.110.71 On: Wed, 03 Sep 2014 05:05:26

11E814-2 Ohshima et al. Rev. Sci. Instrum. 85, 11E814 (2014)
FIG. 1. (a) Test signal to simulated cyclic MHD activities and the spectrogram obtained with (b) short time FFT and (c) wavelet analysis. (d) Instantaneousamplitude and frequency evaluated using analytic signal technique.
40 kHz (ω(t) = 2π f(t), f(t) = −50 · (t − t0) + 65 [kHz]) andthe amplitude grows and decays with Gaussian shape (A(t)= exp(t − t0)2/(0.2)2) with a period of 1 ms (here t0 = 0.5,1.5, 2.5, . . . ms). The time resolution of the test signal is 1μs. Figure 1(b) clearly shows that the FFT analysis failedto catch the time evolution of the signal since its time win-dow for FFT is 256 μs, which is a realistic choice on theanalysis, and the width is much longer than the time scaleof the evolution. The spectrogram of the wavelet analysis ismore smoothed compared with the FFT result, however, thebroadening of the spectrum in time and frequency domainsstill remains, as shown in Fig. 1(c), where Morlet wavelet isemployed as mother wavelet. It is quite difficult to have a dis-cussion about temporal evolution less than the time and fre-quency resolutions of ∼0.1 ms and ∼5 kHz in these analyses.By contrast, analytic signal method can successfully evaluatethe instantaneous amplitude and instantaneous frequency, asshown in Fig. 1(d).
B. Evaluation of instantaneous phase difference
Based on the analytic signal method, we newly introducea concept of instantaneous phase difference, which is use-ful to clarify the temporal development of phase differencebetween two signals in detail. The instantaneous phase dif-ference ϕ(t) (=θ2(t) − θ1(t)) between two analytic signals,X1, 2(t) = |X1, 2(t)|exp (iθ1, 2(t)), can be easily obtained to takeinner product of the two signals as X1(t)* · X2(t) = |X1(t)| ·|X2(t)|exp (iϕ(t)). This enables us to evaluate phase differenceat a specific moment without the limitation of the uncertaintyprinciple.
The instantaneous phase difference was evaluated usingtwo simulated test signals, one is the same test signal usedin Sec. II A, A(t)sin (i
∫ω(t)dt) and the other is the test signal
plus Gaussian white noise, A(t)sin (i∫ω(t − τ )dt) + noise(t).
Note that the constant of time lag τ was introduced with re-
gard to the coherent component. The standard deviation ofthe noise(t) is assumed to be 10% of the maximum ampli-tude of the coherent mode component here. Figures 2(a) and2(b) show the two simulated signals, and Figs. 2(c) and 2(d)show the instantaneous phase differences between the twosignals with different time lag τ = 0 μs and 25 μs. As seen inFigure 2(c), the phase difference was appropriately evaluatedto be zero in the case of no time lag when the fluctuation am-plitude of the coherent mode is larger than the noise level.Meanwhile, the phase difference varies in time in the case of
FIG. 2. (a) Test signal defined in Sec. II A, (b) test + Gaussian white noisesignal, and (c) instantaneous phase difference between the signal in case ofthe time lag τ = 0 μs and (d) τ = 25 μs.
This article is copyrighted as indicated in the article. Reuse of AIP content is subject to the terms at: http://scitationnew.aip.org/termsconditions. Downloaded to IP:
130.54.110.71 On: Wed, 03 Sep 2014 05:05:26
11E814-3 Ohshima et al. Rev. Sci. Instrum. 85, 11E814 (2014)
τ = 25 μs, and this is because the instantaneous frequencyis not constant and changes linearly in time, and the time laginduces linearly time-dependent phase difference between thesignals, as ϕ(t) ∼ τ t. These results conclude that the techniqueis effectively utilized to elucidate the temporal behavior of co-herent modes.
C. Error estimation of instantaneous phase differenceand its reduction with ensemble/conditional average
In this section, error of the phase difference evaluation isdiscussed. The phase difference evaluated with analytic sig-nals can be expressed as tan(ϕ(t)) = I/R, where I and R indi-cate the real and imaginary part of X*(t) · Y(t), respectively.By taking the total differential for the expression, the amountof error can be written as
�ϕ = (R0�I − I0�R)/(R0I0)2, (1)
and R and I are assumed to be R = R0 + �R and I = I0+ �I. The leading term and perturbation term correspondto the components for the coherent and the noise part, re-spectively. Similarly, the perturbation terms for the analyticsignal of X and Y are also introduced and expressed as X= X0 + �X (=|X0|exp(iθ x) + |�X|exp(iεx)) and Y = Y0+ �Y (=|Y0|exp(iθ y) + |�Y|exp(iεy)), and as a result we ob-tain the following expressions:
R0 + �R = Re(X∗ · Y )
= |X0||Y0| cos(φ) + |Y0||�X| cos(α)
+|X0||�Y | cos(β),
and
I0 + �I = |X0||Y0| sin(ϕ) + |Y0||�X| sin(α)
+|X0||�Y | sin(β),
where ϕ = θ y − θ x, α = θ y − εx, and β = εy − θ x. The firstterm is the required phase difference between the coherentcomponents. By substituting the above expression to Eq. (1),the amount of the error can be expressed as
�ϕ = |�X|/|X0| sin(εX − θX) + |�Y |/|Y0| sin(εY − θY ).
Based on the above expression, ensemble averaging or con-ditional averaging can be expected to reduce the noise of theevaluated phase difference, since the perturbation term �Xshould converge to zero if we take ensemble or conditionalaverage. The term for the sine function regarding the phasedifference between the mode component and random compo-nent should also converge to zero.
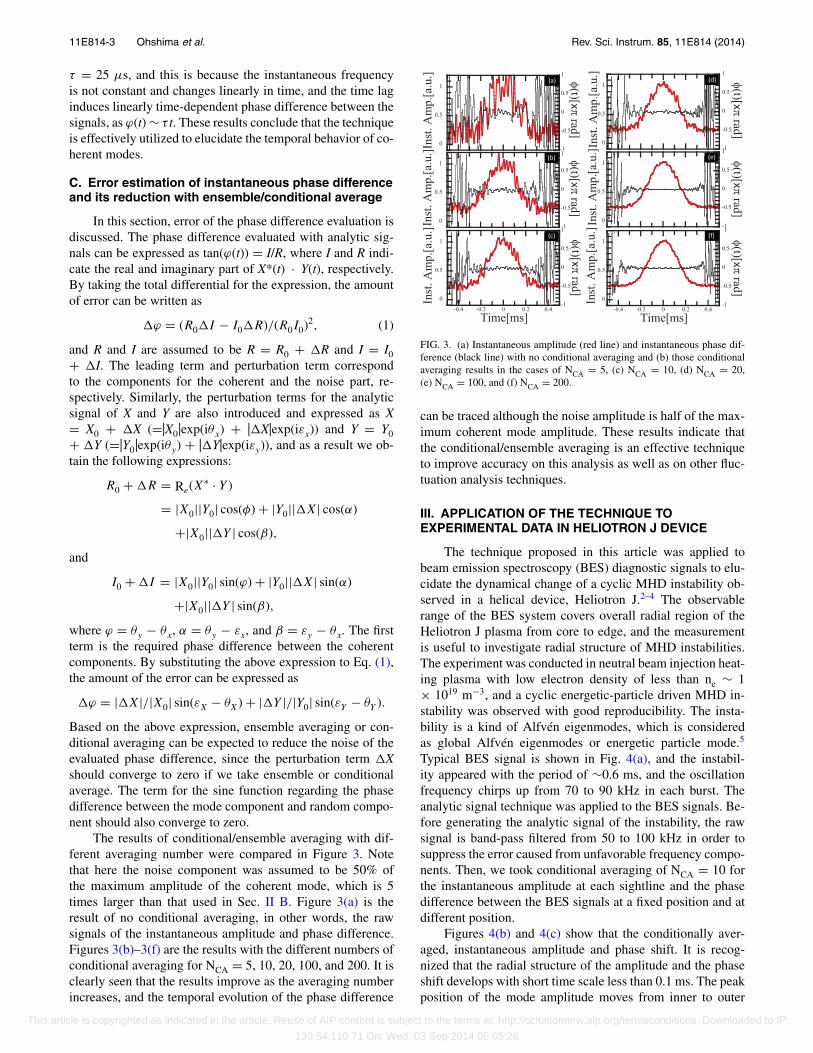
The results of conditional/ensemble averaging with dif-ferent averaging number were compared in Figure 3. Notethat here the noise component was assumed to be 50% ofthe maximum amplitude of the coherent mode, which is 5times larger than that used in Sec. II B. Figure 3(a) is theresult of no conditional averaging, in other words, the rawsignals of the instantaneous amplitude and phase difference.Figures 3(b)–3(f) are the results with the different numbers ofconditional averaging for NCA = 5, 10, 20, 100, and 200. It isclearly seen that the results improve as the averaging numberincreases, and the temporal evolution of the phase difference
FIG. 3. (a) Instantaneous amplitude (red line) and instantaneous phase dif-ference (black line) with no conditional averaging and (b) those conditionalaveraging results in the cases of NCA = 5, (c) NCA = 10, (d) NCA = 20,(e) NCA = 100, and (f) NCA = 200.
can be traced although the noise amplitude is half of the max-imum coherent mode amplitude. These results indicate thatthe conditional/ensemble averaging is an effective techniqueto improve accuracy on this analysis as well as on other fluc-tuation analysis techniques.
III. APPLICATION OF THE TECHNIQUE TOEXPERIMENTAL DATA IN HELIOTRON J DEVICE
The technique proposed in this article was applied tobeam emission spectroscopy (BES) diagnostic signals to elu-cidate the dynamical change of a cyclic MHD instability ob-served in a helical device, Heliotron J.2–4 The observablerange of the BES system covers overall radial region of theHeliotron J plasma from core to edge, and the measurementis useful to investigate radial structure of MHD instabilities.The experiment was conducted in neutral beam injection heat-ing plasma with low electron density of less than ne ∼ 1× 10¹⁹ m−3, and a cyclic energetic-particle driven MHD in-stability was observed with good reproducibility. The insta-bility is a kind of Alfvén eigenmodes, which is consideredas global Alfvén eigenmodes or energetic particle mode.5
Typical BES signal is shown in Fig. 4(a), and the instabil-ity appeared with the period of ∼0.6 ms, and the oscillationfrequency chirps up from 70 to 90 kHz in each burst. Theanalytic signal technique was applied to the BES signals. Be-fore generating the analytic signal of the instability, the rawsignal is band-pass filtered from 50 to 100 kHz in order tosuppress the error caused from unfavorable frequency compo-nents. Then, we took conditional averaging of NCA = 10 forthe instantaneous amplitude at each sightline and the phasedifference between the BES signals at a fixed position and atdifferent position.
Figures 4(b) and 4(c) show that the conditionally aver-aged, instantaneous amplitude and phase shift. It is recog-nized that the radial structure of the amplitude and the phaseshift develops with short time scale less than 0.1 ms. The peakposition of the mode amplitude moves from inner to outer
This article is copyrighted as indicated in the article. Reuse of AIP content is subject to the terms at: http://scitationnew.aip.org/termsconditions. Downloaded to IP:
130.54.110.71 On: Wed, 03 Sep 2014 05:05:26

11E814-4 Ohshima et al. Rev. Sci. Instrum. 85, 11E814 (2014)
FIG. 4. (a) Typical signal of the burst measured with BES at r/a = 0.701. (b) Conditionally averaged instantaneous amplitude and (c) phase shift of the coherentmode of t = −0.3 ms to +0.3 ms. (d) Reconstructed mode structure of the instability at t = 0.3 ms on a poloidal cross section.
region of the plasma. The structural change of the phase shiftmeans that the mode is distorted within the time scale of eachburst activity. These nonlinear behaviors of the mode shouldhave a correlation with the radial transport of fast ions sincethis coherent mode is driven by fast ions.
Time evolution of the two dimensional mode structurecan be reconstructed on the basis of the result shown above.Fig. 4(d) is an example of the reconstructed 2D mode struc-ture on a poloidal cross section at the moment of t = 0.0 ms.The mode structure on a poloidal cross section was expressedas a two dimensional function of n(r, θ , t) = A(r, t) exp(i(mθ
− 2π f · t +δ(r,t))), where the parameters A(r, t), m, f, and δ(r,t)are instantaneous fluctuation amplitude as a function of ra-dial position r and time t, poloidal mode number, the modefrequency, and the phase shift of the fluctuation with a fixedmagnetic probe signal. The instantaneous fluctuation ampli-tude and phase shift shown in Figs. 4(b) and 4(c) were usedin this calculation. Rotating in ion diamagnetic direction, themode grows and then the spiral structure is formed at thetiming when the mode has maximum amplitude, and finallythe structure disappears. These kinds of nonlinear behavior ofMHD fluctuations are widely observed in fusion plasma, andin such a situation this technique is useful to characterize thetemporal behavior of MHD modes.6
IV. SUMMARY
Highly time-resolved analysis technique using analyticsignals was proposed. The technique can evaluate fluctuation
amplitude, frequency, and phase difference at a specificmoment, which can describe temporal development of asingle mode such as MHD phenomena. Error of the instan-taneous phase difference was discussed, and the result sug-gests that the error can be reduced by ensemble or condi-tional averaging. Practically this technique was applied toexperimental data in Heliotron J device, and was evidencedthat the technique can clarify the time evolution of nonlin-ear behavior for a MHD instability. This technique can beutilized in all the diagnostics to evaluate phase difference,including a magnetic probe array, an interferometer, and areflectometer.
ACKNOWLEDGMENTS
The authors are grateful to the Heliotron J staff for theirarrangement and support of the experiments. This work isperformed with the support and under the auspices of the Col-laboration Program of the Laboratory for Complex EnergyProcesses, IAE, Kyoto University and the NIFS CollaborativeResearch Program (NIFS10KUHL030, NIFS11KUHL043,and NIFS12KUHL047).
1L. Cohen, Time–Frequency Analysis (Prentice-Hall, New York, 1995).2T. Obiki et al., Plasma Phys. Control. Fusion 42, 1151 (2000).3F. Sano et al., Nucl. Fusion. 45, 1557 (2005).4S. Kobayashi et al., Rev. Sci. Instrum. 83, 10D535 (2012).5S. Yamamoto et al., Fusion Sci. Technol. 51, 92 (2007).6W. W. Heidbrink et al., Phys. Plasmas 15, 055501 (2008).
This article is copyrighted as indicated in the article. Reuse of AIP content is subject to the terms at: http://scitationnew.aip.org/termsconditions. Downloaded to IP:
130.54.110.71 On: Wed, 03 Sep 2014 05:05:26