highlights of the fourth quarter
TRANSCRIPT
Q4INTERIM REPORT 2020
Itera | Q4 20201

PRESENTERS AND AGENDA
2
Highlights of the quarter
Business review
Financial review
Outlook
Arne MjøsChief Executive Officer
Bent HammerChief Financial Officer
Itera | Q4 2020

HIGHLIGHTS OF THE FOURTH QUARTER
3
High growth and
profitability in
core digital
business (81%
of total)
Gross profit
growth of 14%
EBIT margin of
10.0% (16.1%)
Business
Accelerating in
B2B market
segments
Strong book-
to-bill of 1.6 in
core digital
business
Downscaling of
own data
centres and
migration to
cloud
Grow people
Named Top 10
European Digital
Banking solution
provider
Number of
employees
increased by 57
last 12 months
Cash & Dividend
Strong 12 month
rolling cash flow
from operations of
NOK 102 million
Proposed
ordinary dividend
of NOK 0.25 per
share
Itera | Q4 2020
Total business
Revenue NOK
168.2 (146.0)
million, up by
15% y-o-y
Gross profit
NOK 149.5
(127.2) million,
up by 18% y-o-y
Adjusted EBIT
of NOK 16.8
(18.6) million,
10.0% (12.7%)
margin

HIGHLIGHTS OF THE FOURTH QUARTER
Itera | Q4 20204
Revenues
NOK million
Core digital business:
• Gross profit growth of 14.0% (12.1% YTD)
• EBIT margin of 10.0% (11.8% YTD)
Total business:
• Gross profit growth of 17.5% (12.5% YTD)
• Adjusted EBIT margin of 10.0% (10.7% YTD)
EBIT, adjusted
NOK million
143143
128
146162
151138
168
Q1 Q2 Q3 Q4
2019 2020
13.8 13.9
9.9
18.6 19.2
15.8 14.5
16.8
Q1 Q2 Q3 Q4
2019 2020

Itera | Q4 20205
Business review

2020 HIGHLIGHTS
Itera | Q4 20206
Top 25 in innovation 5 years in a row
10% new customers and industries
Strong partnerships CogniteDNV GLMicrosoft
Top 4 Global &Top 1 Europe inProject Management
Strengthen core digital businesscapabilities
Strong talent attraction
150+ certifications
Increasing summer internships and graduates despite Covid 19
11%Growth in core digital business
24%Growth in hybrid business
Sustainability is a core part of our business model

CRISIS IMPACT ON DIGITAL BUSINESS
TRANSFORMATION
Itera | Q4 20207
2%7%
20%
5%
35%
29%
1%
Not significantpart of plan
Slowed,reduced,delayed
Continuingunchanged
Focus shiftedsame pace
Same focusaccelerated
Shifted focusaccelerated
Other
65% accelerate
digital business
transformation
Source: Gartner Symposium 2020
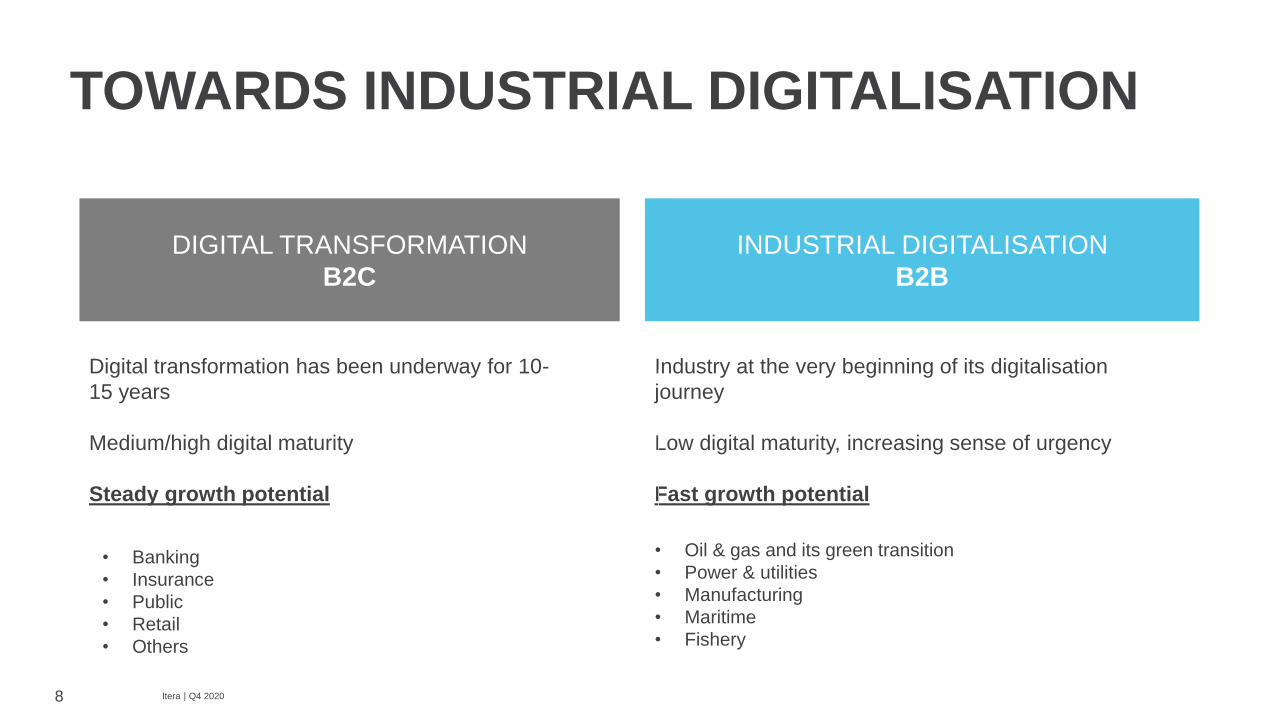
TOWARDS INDUSTRIAL DIGITALISATION
Itera | Q4 20208
DIGITAL TRANSFORMATION
B2C
INDUSTRIAL DIGITALISATION
B2B
Digital transformation has been underway for 10-
15 years
Medium/high digital maturity
Steady growth potential
Industry at the very beginning of its digitalisation
journey
Low digital maturity, increasing sense of urgency
Fast growth potential
• Banking
• Insurance
• Public
• Retail
• Others
• Oil & gas and its green transition
• Power & utilities
• Manufacturing
• Maritime
• Fishery

DIGITALISATION = SUSTAINABILITY
Itera | Q4 20209
Digital
Signage
Environment
Social
Economy
Municipal
Command &
Control Center
Responsive Store
Intelligent
Supply Chain
Devices Connected
Fleet
Automated Car
System
Traffic Sensors &
Cameras
Logistics
Optimisation
Factory
Optimisation
Traffic Flow
OptimisationHome
Energy
Management
Building
Optimisation
Smart
Grid
Comms
Network
Optimisation
SUSTAINABLE
DIGITAL
BUSINESSES

Itera | Q4 202010
WE UNDERSTAND THE
USERNew use cases
WE UNDERSTAND THE
BUSINESSData centric
WE UNDERSTAND THE
TECHNOLOGYArtificial intelligence
THE SPECIALIST
IN CREATING
SUSTAINABLE
DIGITAL BUSINESS

STRONG INTERNATIONAL TRACTION
Itera | Q4 202011
TOP 25 MOST
INNOVATIVE COMPANY
IN NORWAY
TOP 1 IN THE WORLD IN
CROSS-BORDER
DELIVERY
TOP 1 IN EUROPE
WITHIN PROJECT
MANAGEMENT
TOP 10 EUROPEAN
DIGITAL BANKING
SOLUTION PROVIDER
Award by Innovasjonsmagasinetacross all industries in Norway 2016, 2017, 2018, 2019 and 2020
Award by the Global Sourcing Association 2018
Award by the Global PMO Alliance in 2020
Award by Banking CIO Outlook in 2020

NORDIC ORIGIN WITH AN
INTERNATIONAL APPROACH
• The Nordics is often positioned as digital and sustainable front-runners that gives us an attractive position for international customers
• We are growing together with international customers and partners based on our ONE Itera model across borders
• We will consider moving into new geographies if the opportunity is substantial, long-term value and controllable risks
Itera | Q4 202012

REVITALISING OUR BRAND
Itera | Q4 202013
We are launching a new
revitalised brand in Q1:
• more professional
outlook
• stronger international
position
• high value partner
COMPLEXCHALLENGES
HUMANSOLUTIONS

TRANSFORMING THE ENERGY SECTOR
MIDSTREAM
POWER GRIDNEW ENERGY
PROSUMER
RENEWABLE
POWER
GENERATION
RETAIL
Data-
driven
industrial
insight
Data-driven
industrial
insight
Power generation
desentralised flexibility
and grid balancing
Smart
infrastructure
Smart
consumption and
grid balancing
Renewable power
generation
Renewable power
generation
RENEWABLE
POWER
GENERATION
Itera | Q4 202014
SMART ENERGY

TOWARDS AI POWERED WELL EXPLORATION
Itera | Q4 202015
• The Released Well Initiative is an example of digital
transformation of Norwegian Continental Shelf where large
volume of historical drilling cutting samples from released
wells digital are made available to the public
• About 1600 wells until now
• 600 000 cuttings samples
• Pandion Energy teamed up with Itera to build upon this
initiative to assess, visualise and analyse large amount of
well cuttings data and use AI solutions powered by cloud
technology to transform the way geoscientists work
• The new solution Cutting Insight enables Pandion Energy
to make more data-driven and sustainable decisions such
as:
• seek exploration and delimitation opportunities in areas with possible access to renewable electricity
• include the carbon cost in the calculations for new investments
SMART ENERGY
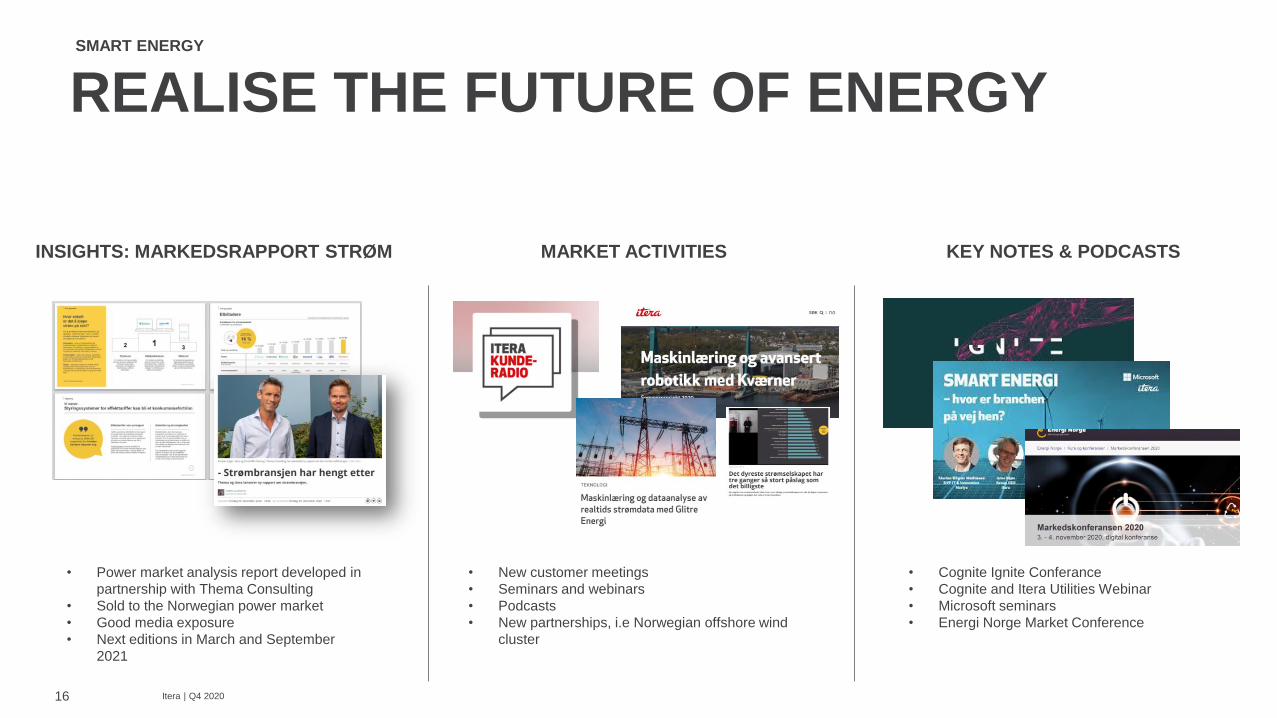
REALISE THE FUTURE OF ENERGY
INSIGHTS: MARKEDSRAPPORT STRØM KEY NOTES & PODCASTSMARKET ACTIVITIES
SMART ENERGY
• Power market analysis report developed in
partnership with Thema Consulting
• Sold to the Norwegian power market
• Good media exposure
• Next editions in March and September
2021
• New customer meetings
• Seminars and webinars
• Podcasts
• New partnerships, i.e Norwegian offshore wind
cluster
• Cognite Ignite Conferance
• Cognite and Itera Utilities Webinar
• Microsoft seminars
• Energi Norge Market Conference
Itera | Q4 202016

HIGH VALUE CREATION DELIVERY
• To succeed in digital transformation, our customers reorganise themselves into a product-based structure which is cross-functional and orchistrated around customer problems to increase time-to-market
• The increase in service- and product-based delivery is a big opportunity for Itera since we can distribute our work as ONE Itera with a full range of services across borders
Itera | Q4 202017
Cost of resources and
optimisation of IT processes
Optimising the customer
experience as a service
Embracing the product end to
end as a living.
Process-based Delivery Service-based Delivery
Process Service Value
Product-based Delivery

TOWARDS DELIVERY AT SCALE
Itera | Q4 202018
• Our Delivery Factory at Scale consists of a full range of services and capabilities as ONE Itera across borders
• Accelerate digitalisation
• Total experience end-to-end
• New revenue models, i.e. subscription-based
• We are investing in a Cloud Center of Excellence that will provide a scaling engine for massive data
• Investments estimated to MNOK 15
• Managing everything as a code
• Both B2C and B2E customers
Customer 1 Customer NProducts
«as a Service»
Delivery Factory at Scale
Cloud Center of Excellence (CCoE)
Partners

OWN DATA CENTER TRANSITION
Itera | Q4 202019
• By the end of 2020, almost 2/3 of the
business volume of our data centre
operations had been successfully migrated to
the cloud by customers.
• Most of the remaining customers will be
engaged to move to the cloud by end of 2021
81 %93 %
99 %
19 %7 %
1 %
Q4-2020 Q1-2021 Q4-2021
Core digital business Own data centres

ORDER INTAKE
Itera | Q4 202020
Book-to-bill ratio*) of 1.6 in Q4 for core digital business
ORDER INTAKE FROM NEW AND EXISTING CUSTOMERS
*) The book-to-bill ratio is the ratio of orders received to the amount of revenue for a specific period for Itera units
Order intake from selected new and existing
customers

CUSTOMER DEVELOPMENT
Itera | Q4 202021
• New business• Existing customers accounted for 92.8%
(86.3%) of revenues in Q4 2020
• New customers won over the past year generated revenues of NOK 12.1 (20.0) million in Q4 2020
Revenue customers split (in MNOK)
• Good visibility• Share of revenue from top 30 customers 80%
(75%)
• High customer concentration signifies
• Strategic relationships
• Full range of services
• Hybrid delivery across borders
* Existing customers defined as customers that were invoiced in the corresponding quarter last year
** New customers defined as customers won since end of corresponding quarter last year
Largest customers’ share of revenue
134 129 126 111 126 142 134 127 156
7 14 18 17 20 20 16 11 12
0%
10%
20%
30%
40%
50%
60%
70%
80%
90%
100%
Q4-18 Q1-19 Q2-19 Q3-19 Q4-19 Q1-20 Q2-20 Q3-20 Q4-20
Existing customers* New customers**
0 %
10 %
20 %
30 %
40 %
50 %
60 %
70 %
80 %
90 %
100 %
Q4-18 Q1-19 Q2-19 Q3-19 Q4-19 Q1-20 Q2-20 Q3-20 Q4-20
Top 30 Top 10

SKILLED AND INNOVATIVE EMPLOYEES
Itera | Q4 202022
• 569 employees at the end of the quarter• Up 13 from last quarter and 57 from same
period last year
• 7 quarters of sequential growth
• Nearshore ratio of 47% (49%)• Our hybrid delivery model of onshore and
nearshore consultants are increasing our price competitiveness as well as providing a high degree of scalability through access to a very large resource pool
Number of employees end of quarter by shore
Year-over-year growth in no. of employees
38%
40%
42%
44%
46%
48%
50%
0
100
200
300
400
500
600
Q417
Q118
Q218
Q318
Q418
Q119
Q219
Q319
Q419
Q120
Q220
Q320
Q420
Onshore Nearshore Nearshoring ratio
96
70
-5
17
-5 -1
13 13
25
3931
5157
-20
0
20
40
60
80
100
120
Q417
Q118
Q218
Q318
Q418
Q119
Q219
Q319
Q419
Q120
Q220
Q320
Q420
Itera | Q4 202023
Financial review

KEY FIGURES
Itera | Q4 202024
• High FTE-driven growth
• Revenue and depreciation incl. 2.8m contract termination
fee and expense, respectively
• Personnel exp high due to restructuring costs, FX and
bonus accruals
• Continued strong cash flow from operations
2020 2019 Change 2020 2019 Change
NOK Million 10-12 10-12 % 1-12 1-12 %
Sales revenue 168.2 146.0 15 % 619.1 560.3 10 %
Gross profit 149.5 127.2 18 % 543.6 483.0 13 %
Personnel expenses 110.5 87.9 26 % 392.4 348.3 13 %
Other opex 13.6 11.3 20 % 46.0 42.7 8 %
EBITDA 29.2 28.0 4 % 108.9 92.0 18 %
EBITDA margin 17.3 % 19.2 % -1.9 pts 17.6 % 16.4 % 1.2 pts
Depreciation 12.4 9.5 31 % 42.5 35.8 19 %
EBIT 13.0 18.6 (30 %) 62.6 56.2 11 %
EBIT margin 7.7 % 12.7 % -5 pts 10.1 % 10.0 % 0.1 pts
EBIT adj. 16.8 18.6 (10 %) 66.4 56.2 18 %
EBIT margin adj. 10.0 % 12.7 % -2.8 pts 10.7 % 10.0 % 0.7 pts
Profit before taxes 12.4 17.6 (30 %) 61.8 53.6 15 %
Profit for the period 9.7 14.2 (32 %) 48.2 41.6 16 %
Net cash flow from operations 37.6 43.1 (13 %) 101.7 80.0 27 %
Cash and cash equivalents 54.4 53.1 2 % 54.4 53.1 2 %
Equity ratio 15.2 % 19.2 % -4.1 pts 15.2 % 19.2 % -4.1 pts
Employees at end of period 569 512 11 % 569 512 11 %
Employees in average 562 508 11 % 538 498 8 %

BUSINESS SEGMENTS
Itera | Q4 202025
• Core digital business • Growing at high speed and profitability
• Data centre operations • MNOK 2.8 of termination fees with corresponding financial lease write-
downs
• MNOK 3.8 in restructuring charges from downsizing
Share of revenue
19 %
81 %
Data centretransformation
Core digitalbusiness
Revenue growth Q4 YTD
Core digital business 14.7 % 10.8 %
Data centre transformation 17.5 % 9.0 %
Total 15.2 % 10.5 %
Gross profit growth Q4 YTD
Core digital business 14.0 % 12.1 %
Data centre transformation 41.9 % 15.3 %
Total 17.5 % 12.5 %
EBIT margin Q4 YTD
Core digital business 10.0 % 11.8 %
Data centre transformation -2.0 % 2.9 %
Total 7.7 % 10.1 %
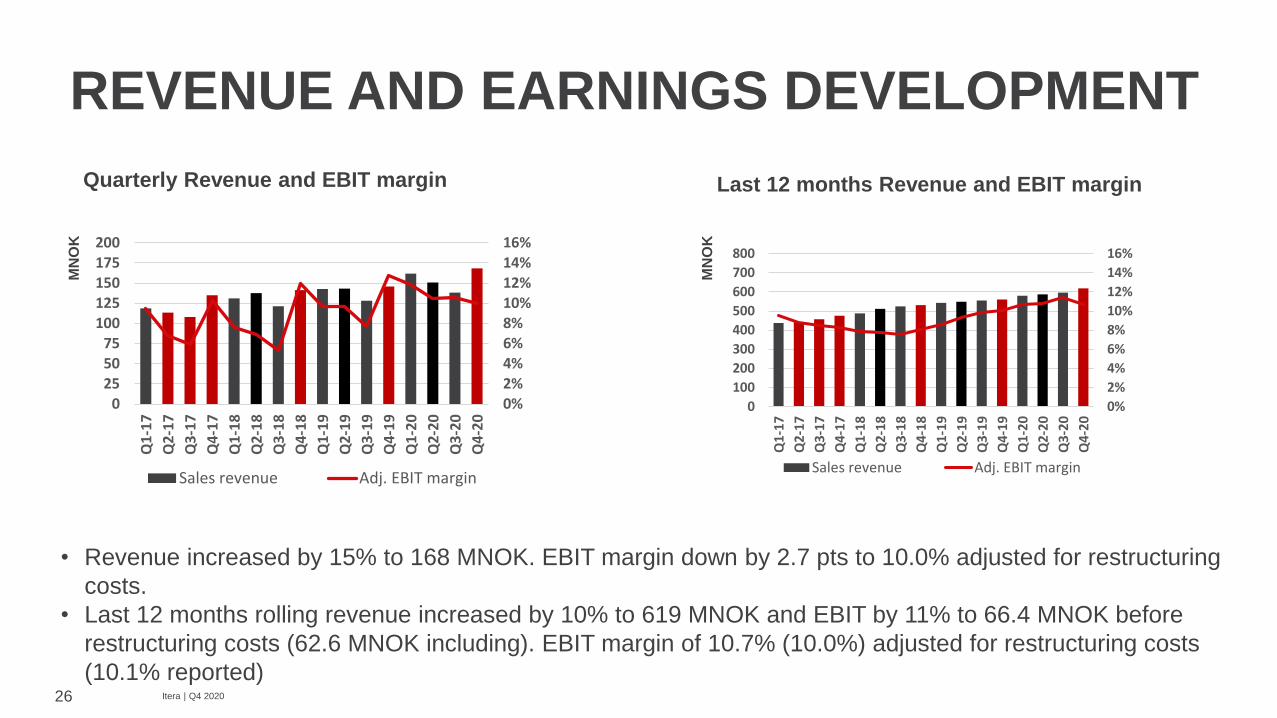
REVENUE AND EARNINGS DEVELOPMENT
Itera | Q4 202026
• Revenue increased by 15% to 168 MNOK. EBIT margin down by 2.7 pts to 10.0% adjusted for restructuring
costs.
• Last 12 months rolling revenue increased by 10% to 619 MNOK and EBIT by 11% to 66.4 MNOK before
restructuring costs (62.6 MNOK including). EBIT margin of 10.7% (10.0%) adjusted for restructuring costs
(10.1% reported)
Quarterly Revenue and EBIT margin Last 12 months Revenue and EBIT margin
MN
OK
MN
OK
0%2%
4%6%8%10%12%14%16%
0 25
50 75
100 125 150 175 200
Q1-
17
Q2-
17
Q3-
17
Q4-
17
Q1-
18
Q2-
18
Q3-
18
Q4-
18
Q1-
19
Q2-
19
Q3-
19
Q4-
19
Q1-
20
Q2-
20
Q3-
20
Q4-
20
Sales revenue Adj. EBIT margin
0%
2%
4%
6%
8%
10%
12%
14%
16%
0
100
200
300
400
500
600
700
800
Q1-
17
Q2-
17
Q3-
17
Q4-
17
Q1-
18
Q2-
18
Q3-
18
Q4-
18
Q1-
19
Q2-
19
Q3-
19
Q4-
19
Q1-
20
Q2-
20
Q3-
20
Q4-
20
Sales revenue Adj. EBIT margin

REVENUE SPLIT
Itera | Q4 202027
Revenue increased by 15% y-o-y• Service revenues from own consultants
increased by 15% to NOK 114 million
• Subscription revenue increased by 7% to
NOK 40 million
• 3rd party service revenue increased by
33% to NOK 8 million
• Other revenue, incl. HW/SW sales,
increased by 62% to NOK 7 million
Revenue percentage split (rolling 12 months)
Revenue split (quarterly figures)NOK Million
90 86 87 75 88 95 96 8399 112 104 91
114
33 33 3334
3535 35
3637
3838
39
40
Q4
-17
Q1
-18
Q2
-18
Q3
-18
Q4
-18
Q1
-19
Q2
-19
Q3
-19
Q4
-19
Q1
-20
Q2
-20
Q3
-20
Q4
-20
Services Subscriptions 3rd party services Other
0 %10 %20 %30 %40 %50 %60 %70 %80 %90 %
100 %Q
4-1
7
Q1
-18
Q2
-18
Q3
-18
Q4
-18
Q1
-19
Q2
-19
Q3
-19
Q4
-19
Q1
-20
Q2
-20
Q3
-20
Q4
-20
Services Subscriptions 3rd party services Other

57
80
102
Q4-18 Q4-19 Q4-20
STATEMENT OF CASH FLOW
Itera | Q4 202028
12 month rolling
cash flow from operations
(NOK Million)
• Cash flow from operations NOK 37.6 (43.1) million in Q4
• 12 month rolling cash flow from operations was NOK 102 million
2020 2019 2020 2019
NOK Million 10-12 10-12 1-12 1-12
Cash flow from operations (EBITDA) 29.2 28.0 108.9 92.0
Change in balance sheet items 8.5 15.1 (7.1) (12.0)
Net cash flow from operating activities 37.6 43.1 101.7 80.0
Net cash flow from investment activities (4.8) (4.9) (17.0) (18.8)
Purchase of own shares - - (18.8) (0.1)
Sale of shares 1.4 1.1 7.3 2.1
Principal elements of lease payments (3.6)
Instalment of lease liabilities (1.5) (2.5) (8.6) (9.1)
External dividend paid (32.4) - (48.6) (44.7)
Net cash flow from financing activities (36.1) (1.4) (68.8) (51.8)
Net change in bank deposits and cash (3.3) 35.7 1.3 (2.2)
Bank deposits at the end of the period 54.4 53.1 54.4 53.1
New borrowing related to leasing - 3.4 2.4 11.5

Itera | Q4 202029
DIVIDEND AND OWN SHARES
• The Board has proposed an ordinary dividend of NOK 0.25 per
share based on 2020 results
• Share price was NOK 15.0 at the end of Q4 2020, an increase
of 30% from NOK 11.5 at the end of Q4 2019.
• Current holding of own shares is unchanged at 1,269,136
shares. Value at 31 Dec 2020 was MNOK 19.0
• Consistent high distribution of earnings
-0.10
0.00
0.10
0.20
0.30
0.40
0.50
0.60
0.70
0.80
0.90
2006 2007 2008 2009 2010 2011 2012 2013 2014 2015 2016 2017 2018 2019 2020
NO
K p
er
shar
e
Dividend Share buy-back Share capital payback EBIT
29

53 54
87 87
61 49
4133
-
50
100
150
200
250
300
Q4-19 Q4-20
MN
OK
34 46
26 37
165
158
Q4-20 Q4-19
STATEMENT OF FINANCIAL POSITION
Itera | Q4 202030
• Equity ratio of 15% (19%) per 31 December (17% excl. IFRS 16 Leasing)
• Cash balance of MNOK 54 (MNOK 53)
• Total balance reduced by MNOK 17 to MNOK 224
Assets Equity and Liabilities
Receivables and
WIP
Cash
Current
liabilities
Non-current
liabilities
Equity
Non-current
assets
Right –of-
use assets

Itera | Q4 202031
Outlook

OUTLOOK
Itera | Q4 202032
• Attractive market driven by sustainability and digitalisation after Covid-19
• Itera is well positioned through its full ranges of services, attractive hybrid delivery model across borders and strong industrial partnerships
• Expect to complete transformation of own data centres to the cloud with short-term revenue drop
• Investment in a leading edge Cloud Centre of Excellence with high scalability and increasing recurring revenue
• Profitable growth and cash flow are key focus areas.
• Larger projects and customers expected to continue to increase revenue visibility, efficiency and scalability.
Itera does not provide guidance to the market on future prospects.
32

Q&A session
33

TOP 20 SHARE-HOLDERS
*Arne Mjøs Invest AS holds a future contract expiring 19 March 2021 on 2,800,000 shares at an average price
of NOK 9.9736 per share. The total controlling interest of Arne Mjøs is thus 26,848,214 shares (32.7%).
No. Name % Nat. Shareholding
1 ARNE MJØS INVEST AS* 29.26 NOR 24 048 214
2 OP CAPITAL AS 5.45 NOR 4 478 110
3 GIP AS 4.80 NOR 3 945 000
4 EIKESTAD AS 4.26 NOR 3 500 000
5 SEPTIM CONSULTING AS 3.53 NOR 2 900 000
6 SPAREBANK 1 MARKETS AS 3.41 NOR 2 800 000
7 BOINVESTERING AS 3.22 NOR 2 650 000
8 GAMST INVEST AS 2.92 NOR 2 399 165
9 JØSYRA INVEST AS 2.68 NOR 2 200 000
10 MARXPIST INVEST AS 2.47 NOR 2 031 588
11 VERDIPAPIRFONDET STOREBRAND VEKST 1.86 NOR 1 529 077
12 ITERA ASA 1.54 NOR 1 269 136
13 FRAMAR INVEST AS 1.13 NOR 925 000
14 AANESTAD PANAGRI AS 1.10 NOR 900 000
15 HØGBERG 0.95 NOR 782 045
16 ALTEA PROPERTY DEVELOPMENT AS 0.85 NOR 700 000
17 NYVANG 0.77 NOR 630 000
18 GRØSLAND 0.74 NOR 610 000
19 JENSEN 0.74 DEN 609 100
20 MORTEN JOHNSEN HOLDING AS 0.73 NOR 600 000
TOP 20 72.40 59 506 435
34
COPYRIGHT AND DISCLAIMER
Itera | Q4 202035
Copyright
Copyright of all published material including photographs, drawings and images in this document remains vested in
Itera and third party contributors as appropriate. Accordingly, neither the whole nor any part of this document shall be
reproduced in any form nor used in any manner without express prior permission and applicable acknowledgements.
No trademark, copyright or other notice shall be altered or removed from any reproduction.
Disclaimer
This Presentation includes and is based, inter alia, on forward-looking information and statements that are subject to
risks and uncertainties that could cause actual results to differ. These statements and this Presentation are based on
current expectations, estimates and projections about global economic conditions, the economic conditions of the
regions and industries that are major markets for Itera ASA and Itera ASA’s (including subsidiaries and affiliates) lines
of business. These expectations, estimates and projections are generally identifiable by statements containing words
such as “expects”, “believes”, “estimates” or similar expressions. Important factors that could cause actual results to
differ materially from those expectations include, among others, economic and market conditions in the geographic
areas and industries that are or will be major markets for Itera ASA. Although Itera ASA believes that its expectations
and the Presentation are based upon reasonable assumptions, it can give no assurance that those expectations will
be achieved or that the actual results will be as set out in the Presentation. Itera ASA is making no representation or
warranty, expressed or implied, as to the accuracy, reliability or completeness of the Presentation, and neither Itera
ASA nor any of its directors, officers or employees will have any liability to you or any other persons resulting from
your use.
