highlights for the 2...restructuring and productivity in the shipyard industry. services turnover in...
TRANSCRIPT


1
HIGHLIGHTS FOR THE 2ND QUARTER 2015. Financial highlights for the quarter were:
Turnover in the quarter was MNOK 816 (617). 2nd quarter EBITDA reported at MNOK 138 (-10). Net profit in the quarter was MNOK +109 (-35). Total EPS for the quarter was NOK 1,20 (-0,41). Order backlog at the end of the quarter was MNOK 4 004 (3 377). Order intake in the quarter was MNOK 868 (691). Change in governing agreements for TTS Hua Hai Ships Equipment Co Ltd.
(THH) gives basis for full consolidation of the company. One time effect included in the EBITDA, MNOK 104.
KEY FIGURES
(*) Order backlog includes 50% of backlog in the 50/50 owned Chinese companies.
Q2 turnover of MNOK 816 (617) is influenced by change in consolidation method related to THH. Turnover reported from THH in Q2/2015 is MNOK 261. EBITDA in the 2nd quarter was MNOK 137,8, up from MNOK -10,3 in the 2nd quarter last year. The EBITDA in the quarter include a one-time effect of MNOK 103,7 related to change of control in THH. (ref note 13). Stable positive margin within the RCN and Services segments, combined with reduced losses within the Offshore and CBT segments has improved the overall margin compared with the same period last year. The order intake for the 2nd quarter of 2015 was MNOK 868, compared to MNOK 691 in the 2nd quarter of 2014, the main reason for the increase is improved order intake in the Services and MPGC segments, and a stable order intake in the RoRo/Cruise/Navy segment. The order backlog* at the end of 2nd quarter was MNOK 4 004 (3 337), up from MNOK 3 247 at the end of 1st quarter 2015. *including 50% of the order backlog, 446 (640), from JV companies in China.
MNOK 2015 2014 2015 2014 2014Turnover 816 617 1 404 1 170 2 454 EBITDA 137,8 -10,3 138,4 -39 105,2 EBITDA margin (%) 16,9 -1,7 9,9 -3,3 4,3 Order intake 868 598 1 210 1 288 2 446 Order backlog* 4 004 3 377 4 004 3 377 3 627
EPS (NOK) Total 1,20 -0,41 0,88 -0,95 0,21 EPS (NOK) Continued 1,20 -0,41 0,88 -0,95 -0,25
Q2 Full YearQ2 YTD

2
TOTAL ASSETS AND NET INTEREST BEARING DEBT Total assets at the end of 2nd quarter 2015 was MNOK 3 150, an increase of MNOK 740 since 2014. The change is mainly an effect of the changed consolidation related to TTS Hua Hai Ships Equipment Co Ltd. Net working capital is negative MNOK 22 . In the 2nd quarter of 2015 net interest bearing debt decreased by MNOK 176 to MNOK 181. Consolidation of TTS Hua Hai represents a reduction in net interest bearing debt of MNOK 239. TTS has covenants for both equity ratio and 12 months rolling EBITDA related to its debt and bonding facilities with Nordea and DNB, which were negotiated in 4th quarter 2014. At the end of the 2nd quarter 2015, the group is in compliance with the covenants (ref. note 14). The debt- and bonding facilities mature in the 4th quarter 2015. The Group's bank loans of MNOK 100 have been classified as short term debt in the reported balance at 30 June. There were no conversions in the subordinated convertible bond in the second quarter. There are no significant changes of the principal bondholders compared to 31.12.2014.
ACCOUNTING PRINCIPLES The company has prepared the interim financial report in accordance with IAS 34. The accounting principles applied are explained in detail in the 2014 annual report. There are no changes to the accounting principles in 2015.
SEGMENTS As from the 3rd quarter of 2014, TTS reports its operations in 6 business segments. RoRo/Cruise/Navy (RCN)
The RCN segment continues to report positive quarterly figures, which reflect TTS Group's strong position in the PCTC-market. The outlook for the segment is positive, and the backlog has improved in the quarter. Backlog is expected to give a sound basis for satisfactory turn-over and margins in the quarters to come. Proven solutions, and repeat orders from key customers within the PCTC market gives basis for expected high activity.
MNOK 2015 2014 2015 2014 2014Turnover 160 154 319 288 599 EBITDA 16 19 31 30 77 Order backlog 785 867 785 867 854
Q2 Full YearQ2 YTD

3
Container/Bulk/Tank (CBT)
*Order backlog includes 50% of backlog from JV companies in China. Change of consolidation, from the equity method and into full consolidation related to the 50/50 owned company, TTS Hua Hai Ships Equipment Co Ltd (THH), is basis for the reported increase in revenue and margin. Included in periodic EBITDA is a one-time revaluation effect of MNOK 103,7. Turnover from fully owned companies within the segment is reduced from MNOK 112 in 2014 to 57 in 2015. Turnover is affected by generally lower activity outside China, as well as fierce market competition. Focus on overall efficiency, restructuring and the Momentum initiative compensates for the effect of reduced turnover, to improve the EBITDA- margin compared to last year. Profit allocation from JV-companies in the 2nd quarter shows a loss of MNOK 4,5. The order back log is still acceptable due to strong order intake in 2014 in THH, however 2nd quarter order intake is cyclic low as an effect of current market conditions in the bulk segment. The outlook is affected by the strong market competition in Korea. The newbuilding activity is expected to pick up as a result of increased rates in the capsize segment. Offshore
As an effect of the market, the reported turnover is significantly reduced compared to 2014. Implemented cost reduction measures, and better project control, has reduced EBITDA losses. Order backlog is still decreasing, due to low order intake caused by the challenging market. Based on market expectations goodwill allocated to the segment has been impaired by MNOK 9,2 during the quarter. There is no remaining goodwill allocated to the segment. TTS has taken strong cost-reducing measures to adjust activities and capacity to the current market. Following the segment restructuring in 2014, new adjustments are being executed in 2015 in order to match capacity with order backlog and market conditions. The Offshore market is expected to remain harsh going forward into 2016. The segment is expected to show low utilization and low margins in the quarters to come, and the segment will have a constant focus to adjust cost and capacity to prevailing market conditions.
MNOK 2015 2014 2015 2014 2014Turnover 318 112 385 225 422 EBITDA 111 1 113 4 -5 Order backlog *) 2 075 1 396 2 075 1 396 1 687
Q2 Full YearQ2 YTD
MNOK 2015 2014 2015 2014 2014Turnover 92 130 171 251 572 EBITDA -8 -30 -32 -56 -50 Order backlog 273 490 273 490 254
Q2 Full YearQ2 YTD
4
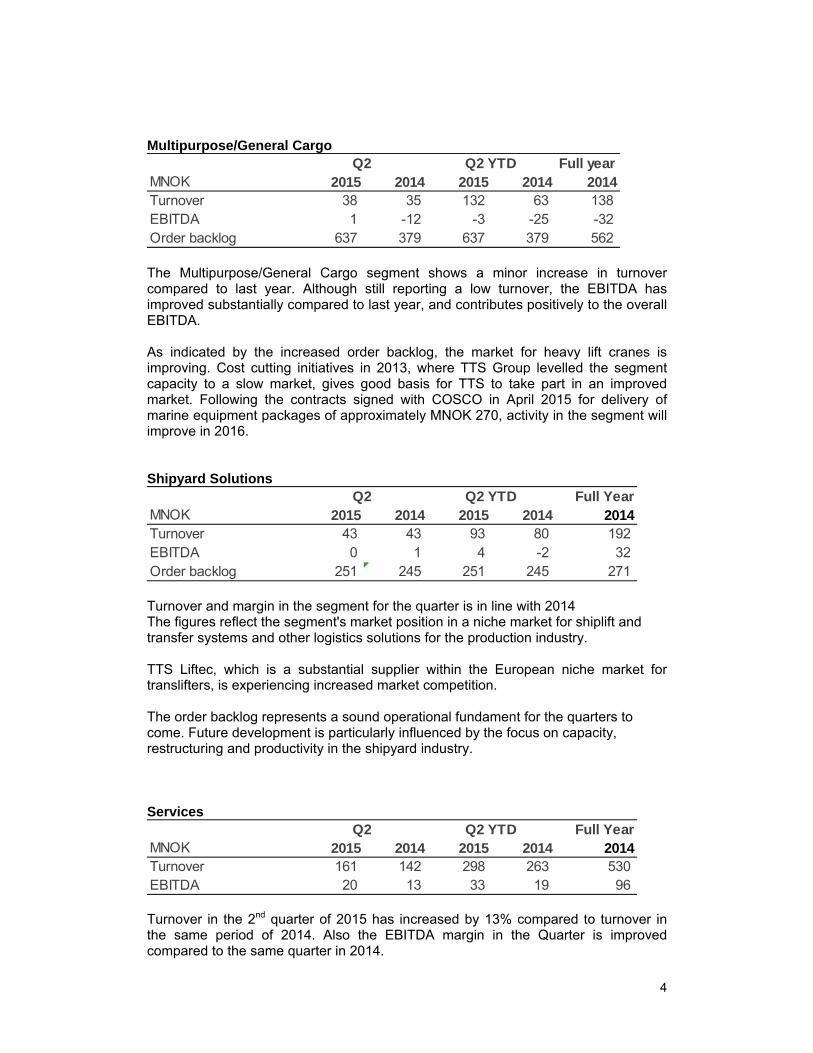
Multipurpose/General Cargo
The Multipurpose/General Cargo segment shows a minor increase in turnover compared to last year. Although still reporting a low turnover, the EBITDA has improved substantially compared to last year, and contributes positively to the overall EBITDA. As indicated by the increased order backlog, the market for heavy lift cranes is improving. Cost cutting initiatives in 2013, where TTS Group levelled the segment capacity to a slow market, gives good basis for TTS to take part in an improved market. Following the contracts signed with COSCO in April 2015 for delivery of marine equipment packages of approximately MNOK 270, activity in the segment will improve in 2016. Shipyard Solutions
Turnover and margin in the segment for the quarter is in line with 2014 The figures reflect the segment's market position in a niche market for shiplift and transfer systems and other logistics solutions for the production industry. TTS Liftec, which is a substantial supplier within the European niche market for translifters, is experiencing increased market competition. The order backlog represents a sound operational fundament for the quarters to come. Future development is particularly influenced by the focus on capacity, restructuring and productivity in the shipyard industry. Services
Turnover in the 2nd quarter of 2015 has increased by 13% compared to turnover in the same period of 2014. Also the EBITDA margin in the Quarter is improved compared to the same quarter in 2014.
Full yearMNOK 2015 2014 2015 2014 2014Turnover 38 35 132 63 138 EBITDA 1 -12 -3 -25 -32 Order backlog 637 379 637 379 562
Q2 Q2 YTD
MNOK 2015 2014 2015 2014 2014Turnover 43 43 93 80 192 EBITDA 0 1 4 -2 32 Order backlog 251 245 251 245 271
Q2 Full YearQ2 YTD
MNOK 2015 2014 2015 2014 2014Turnover 161 142 298 263 530 EBITDA 20 13 33 19 96
Q2 Full YearQ2 YTD

5
Market demand in the segment, and toward TTS historical install base provides a basis for improved turnover and profit margin. The service market remains influenced by low ship charter rates in some segments. OUTLOOK The total shipbuilding market is expected to improve in line with increased demand for sea transport. TTS Group expects a period of future growth, and our market share has increased in some segments. Within the RoRo/Cruise/Navy segment, the PCTC market is still positive, and we expect the strong market to continue. The Multipurpose General Cargo segment has shown a positive development, which we expect to continue, particularly in the Chinese market. Going forward we are expecting the Services market to be relatively stable. Market expectations for the Container/Bulk/Tank segment in the Chinese market are generally positive, with increased activity in the overall Container market. The challenging market for bulk vessels remain, although a positive effect is expected from tonnage scrapping in the medium/ long term basis. New build activity within the tank sector is good, however some indication on lower activity. The Offshore market is expected to remain harsh going forward into 2016. During 2014 and 2015 TTS Group has implemented initiatives to adjust capacity towards a shifted demand and to improve internal processes, and focus on the overall value chain. Market initiatives are taken to provide ship-type solutions to key customers. The effects of the actions taken are expected to contribute positively in the quarters to come. TTS Group works actively to grow its product portfolio and service offering. Sales of larger bundled equipment packages and solutions will improve efficiency for both shipyards and ship owners. The company has therefore organized its business units based on ship-type, with the aim to offer complete equipment packages for ship types to increase the order value per ship, and increase TTS’ market position, both in China and internationally. In order to position the TTS Group for this growth, the Board of Directors of TTS Group continues the strategic process initiated in February 2015 to explore opportunities for both acquisitions and partnerships.
6
Statement on compliance Today, the Board of Directors, the President & CEO and the CFO has reviewed and approved the consolidated financial statements related to TTS Group ASA as of 30. June 2015. To the best of our knowledge we confirm that;
the consolidated financial statements for the first half of 2014 have been prepared in accordance with IFRSs and IFRICs as adopted by the European Union, IFRSs as issued by IASB, and additional Norwegian disclosure requirements in the Norwegian Accounting Act
the information presented in the financial statements gives a true and fair view of the company's and the group's assets, liabilities, financial position and results for the period viewed in their entirety
the information presented in the financial statement gives a true and fair view of the development, performance, financial position, principle risk and uncertainties of the group.
Bergen, 18 August 2015 THE BOARD AND MANAGEMENT OF TTS GROUP ASA
Trym Skeie CHAIRMAN OF THE BOARD
Bjarne Skeie DIRECTOR
Toril Eidesvik DIRECTOR
Marianne Sandal DIRECTOR
Gisle Rike DIRECTOR
Anita Kråkenes DIRECTOR
Ole Henrik Askvik DIRECTOR
Björn Andersson PRESIDENT & CEO
Henrik Solberg-Johansen CFO

7
TTS Group ASA Q2.2015 / 30.06.2015
NOK 1 000
Unaudited/ Urevidert
Unaudited/ Urevidert
Unaudited/ Urevidert
Unaudited/ Urevidert*
Audited/ Revidert
PROFIT AND LOSS ACCOUNT/ RESULTAT YTD 30.06.2015 YTD 30.06.2014 2nd quarter 2015 2nd quarter 2014 YTD 31.12.2014
Income from projects/ Driftsinntekter 1 404 483 1 170 331 811 126 616 589 2 453 658
Other operating income/ Andre driftsinntekter - - - - -
Total operating income/ Sum driftsinntekter 1 404 483 1 170 331 811 126 616 589 2 453 658
Raw materials and consumables used/ Varekostnad 876 894 675 182 516 707 374 927 1 419 801
Other operating costs/ Andre driftskostnader 501 749 537 452 260 793 252 003 942 968
Result from JV ( - is income)/ Resultat fra JV ( - er inntekt) -112 586 -3 575 -104 204 6 -14 325
EBITDA/ Driftsresultat før avskrivninger 138 426 -38 728 137 831 -10 346 105 215
Depreciation/ Avskrivninger 29 892 19 626 21 310 9 891 43 766
Other depreciation/write-downs/ Andre avskrivninger/nedskrivninger - - - - -
Operating profit/ Driftsresultat 108 534 -58 354 116 521 -20 238 61 449
Financial income/ Finansinntekter 16 578 34 191 4 282 13 171 98 173
Financial expense/ Finanskostnader 30 245 52 505 2 574 22 689 136 361
Net finance/ Netto finans -13 668 -18 315 1 708 -9 517 -38 188
Profit/loss before tax/ Resultat før skattekostnader 94 866 -76 669 118 228 -29 755 23 261
Tax/ Skattekostnad 13 930 5 697 9 412 5 569 45 079
Net result continued business/ Periodens resultat videreført virksomhet 80 936 -82 365 108 816 -35 325 -21 819
Net result divested business/ Resultat fra avhendet virksomhet 0 - - - 39 562
Net result/ Netto resultat 80 936 -82 365 108 816 -35 325 17 743
Attributable to equity holders of the company / Majoritet 73 153 -82 365 101 033 -35 325 17 743
Attributable to non-controlling interests/ Minoritetsinteresser 7 784 - 7 784 - -
NET RESULT FOR THE YEAR/ Oppstilling av totalresultatet
Net result for the period/ Periodens resultat 80 936 -82 365 108 816 -35 325 17 743
Actuarial gain/loss on defined pension benefit plan/ Estimatavvik pensjoner - - - - -30 700
Translation differences/ Omregningsdifferanser 10 338 -12 076 9 617 4 797 55 289
Total comprehensive income/ Totalresultat 91 274 -94 441 118 433 -30 528 42 332
Attributable to equity holders of the company / Majoritet 75 991 -94 441 103 150 -30 528 42 332
Attributable to non-controlling interests/ Minoritetsinteresser 15 282 - 15 282 - -
Earnings per share (NOK) continued business/ Fortjeneste pr. aksje (NOK) videreført virksomhet 0,88 -0,95 1,20 -0,41 -0,25
Diluted earnings per share (NOK) continued business/ Utvannet fortjeneste pr. aksje (NOK) videreført virksomhet 0,88 -0,95 1,20 -0,41 -0,25
Earnings per share (NOK) divested business/ Fortjeneste pr. aksje (NOK) avhendet virksomhet - - - - 0,46
Diluted earnings per share (NOK) divested business/ Utvannet fortjeneste pr. aksje (NOK) avhendet virksomhet - - - - 0,46
Earnings per share (NOK)/ Fortjeneste pr. aksje (NOK) 0,88 -0,95 1,20 -0,41 0,21
Diluted earnings per share (NOK)/ Utvannet fortjeneste pr. aksje (NOK) 0,88 -0,95 1,20 -0,41 0,21
Average number of shares used as calculation basis for diluted EPS (000)/ Gjennomsnittlig antall utestående aksjer som basis for utvannet EPS (000) 86 493 86 457 86 493 86 452 86 443
Consolidated statement of comprehensive income / Konsolidert oppstilling av totalresultat

8
Unaudited/ Urevidert
Unaudited/ Urevidert
Audited/ Revidert
NOK 1 000 30.06.2015 30.06.2014 31.12.2014
Intangible assets/ Immaterielle eiendeler 889 705 663 014 663 535
Tangible assets/ Varige driftsmidler 156 606 141 611 160 897
Financial assets/ Finansielle anleggsmidler 89 859 93 881 102 582
Assets available for sale/ Eiendeler tilgjengelig for salg 0 28 686 0
Sum anleggsmidler/ Total non-current assets 1 136 171 927 192 927 014
Inventories/ Varer 269 436 205 348 189 264
Total receivables/ Kortsiktige fordringer 1 412 714 886 204 1 164 597
Bank deposits/cash/ Bankinnskudd/kontanter 331 695 87 845 130 602
Total current assets/ Sum omløpsmidler 2 013 845 1 179 397 1 484 463
Total assets/ Sum eiendeler 3 150 016 2 106 589 2 411 477
Share capital/ Aksjekapital 9 526 9 526 9 526
Other equity/ Annen egenkapital 677 431 463 458 600 836
Non-controlling interests / Minoritetseiere 195 751 - -
Total equity/ Sum egenkapital 882 707 472 984 610 362
Provisions/ Avsetning for forpliktelser 53 147 101 574 31 740
Long term interest bearing debt/ Langsiktig rentebærende gjeld 92 104 86 011 88 143
Long term liabilities/ Langsiktig gjeld 145 251 187 585 119 883
Current interest bearing debt/ Kortsiktig rentebærende gjeld 417 427 294 712 297 764
Current liabilities/ Kortsiktig gjeld 1 704 630 1 151 308 1 383 468
Total current liabilities / Sum kortsiktig gjeld 2 122 057 1 446 020 1 681 232
Total liabilities/ Sum gjeld 2 267 309 1 633 605 1 801 115
Total equity and liabilities/ Sum egenkapital og gjeld 3 150 016 2 106 589 2 411 477
Condensed consolidated statement of financial position / Konsolidert oppstilling av finansiell stilling
Condenced consolidated statement of cash flows/ Kontantstrømoppstilling
Unaudited/ Urevidert
Unaudited/ Urevidert
Audited/ Revidert
NOK 1000 YTD 30.06.2015 YTD 30.06.2014 YTD 31.12.2014
EBITDA/ Driftsresultat før avskrivninger 138 426 -38 728 105 215
Change in net current assets/ Endring i netto omløpsmidler -120 544 -131 359 -255 220
Cash from operations/ Kontantstrøm fra operasjonelle aktiviteter 17 882 -170 087 -150 005
Aquisition of non-current assets / Kjøp av varige driftsmidler -248 156 -17 510 -46 096
Proceeds discontinued business/ Netto salgssum avhendet virksomhet 0 - 39 562
Other investing activities/ Andre investeringsaktiviteter 112 000 5 495 33 604
Cash from investments/ Kontantstrøm fra investeringsaktiviteter -136 156 -12 015 27 070
New loans and repayment/ Opptak og nedbetaling av lån 112 899 141 966 134 659
Paid-in equity/ Innbetaling av egenkapital 211 718 - -
Payments to shareholders/ Utbetaling til aksjonærer - - -
Net interest paid/ Netto betalte renter -11 445 -14 985 -32 727
Cash from financing/ Kontantstrøm fra finansieringsaktiviteter 313 172 126 981 101 932
Change in cash/ Endring i kontantbeholdning 194 898 -55 121 -21 003
Cash position OB/ Kontantbeholdning IB 130 602 155 570 155 570
Effect of exchange rate changes on cash/ Effekt av valutakursendring bank 6 196 -12 605 -3 966
Cash position CB/ Kontantbeholdning UB 331 695 87 845 130 603
Consolidated statement of changes in equity/ Konsolidert oppstilling av endringer i egenkapital
NOK 1 000Share capital /
AksjekapitalTreasury shares/
Egne aksjer
Share premium reserve/
Overkursfond
Other equity/ Annen
egenkapital
Shareholders equity /
Majoritetsandel
Non controlling
interest / Minoritet
Total equity / Total
egenkapital
Equity as of 1.1.2015/ Egenkapital 1.1.2015 9 526 -12 149 378 451 469 610 362 - 610 362
Comprehensive income/ Totalresultat - - - 75 991 75 991 15 282 91 274
Sale treasury shares/ Salg egne aksjer - - - - - -
Options cost/ Opsjonsplaner - - - 603 603 603
Equity transactions with non controlling interests/ Egenkapitaltransaksjoner med minoritetsinteresser - 211 718 211 718
Dividend distributed/ Utbetaling utbytte - -31 250 -31 250
Equity CB/ Egenkapital UB 9 526 -12 149 378 528 064 686 957 195 750 882 707

9
NOTES TO UNAUDITED INTERIM FINANCIAL STATEMENTS 2ND QUARTER 2015 Note 1 General information Reporting entity TTS Group ASA is registered and domiciled in Norway, and the head office is located in Bergen. The consolidated financial statements cover TTS Group ASA including its subsidiaries. As of 2nd quarter 2015, changes in the joint venture agreement related to the jointly owned 50/50 % company TTS Hua Hai Co Ships Equipment Co Ltd. in China, require TTS to change its consolidation method from the equity method to full consolidation. Operation in TTS SCM commenced as of 2nd quarter 2015, and is fully consolidated into TTS accounts as of start-up date. Jointly controlled companies are accounted for using the equity method. The Board of Directors approved the consolidated financial statements for the year ended 31st of December 2014 on 15th of April 2015. The annual report 2014 for the TTS Group and for TTS Group ASA, including the consolidated financial statements for the TTS Group, the separate financial statements for TTS Group ASA and the auditors' opinion from KPMG, are available at our website www.ttsgroup.com. Basis of preparation TTS Group’s financial reports are prepared in accordance with International Financial Reporting Standards (IFRS), as adopted by the European Union. The unaudited consolidated financial statements for 2nd quarter 2015 have been prepared in accordance with IAS 34 Interim Financial Statements. The interim accounts do not include all the information required for a full financial statement and should therefore be read in connection with the consolidated financial statements of 2014. The accounting principles applied is the same as those described in the consolidated financial statements of 2014. This condensed consolidated 2nd quarter interim report of 2015 was approved by the Board on 18th of August 2015. Judgments, estimates and assumptions The preparation of the interim report requires the use of judgments, estimates and assumptions that affect the application of accounting principles and the reported amounts of assets and liabilities, income and expenses. Actual future outcome may differ from these estimates. In preparing these consolidated interim financial statements, the key assessments made by the management in applying the Group’s accounting principles and the key sources of estimation uncertainty were the same as those that applied to the consolidated financial statements for the financial year ended 31st of December 2014.

10
Note 2 Segment information
Comparative figures of Q2/14, Q1/14 and 31.12.2013 have been restated to reflect the change in segment reporting introduced in 3rd quarter 2014. As of Q2/2015 TTS Hua Hai are consolidated on a 100% basis into TTS Group accounts. The activity is reported as part of the Container/Bulk Tank segment. One time effect of MNOK 103,7 are recognized in Q2/15 periodic EBITDA. As of Q2/2015 TTS SCM are consolidated on a 100% basis into TTS Group accounts. The activity is reported as part of the Multipurpose General Cargo segment.
From 3rd quarter 2014 TTS Group changed its segment reporting.
RoRo/cruise/navy (RCN) Container/bulk/tank (incl. JV-companies) (CBT) Offshore Multipurpose/General cargo (MPGC) Shipyard Solutions Services
The RCN segment delivers complete cargo handling solutions to RoRo, PCTC, cruise and navy vessel, including terminal loading and passenger systems. Product range includes external and internal ramps, covers and doors, liftable decks, passenger gangways and linkspan systems. The segment has earlier been reporting as part of the Marine Division. The CBT segment delivers complete cargo handling solutions to the container, tanker and bulk vessels. Product range includes 10-40 t winches, 15-50 t cranes and specialized hatch covers designs. The segment has earlier been reporting as part of the Marine Division. The Offshore segment delivers support solutions to the offshore based oil industry and the supporting service industry. Product range includes 15-50 t offshore cranes, 40-400 t heave compensated cranes, mooring winches, internal and external covers and doors. The segment has earlier been reporting as part of the Offshore and Heavy Lift division. The MPGC segment delivers supporting solutions to the vessels which is designed to operate in the multipurpose or general cargo market, requiring specialized operating capabilities. Product range includes 40-900 t heavy lift cranes, side loading systems, hatch covers and mooring winches. The segment has earlier been reporting as part of the Offshore and Heavy Lift division. The Shipyard Solutions segment includes shiplift and transfer systems, as well as complete production lines to the yard industry. Products range includes shiplift system, ship transfer systems, multiwheelers and translifters. This segment has earlier been reporting as part of the Marine Division. The Services segment includes service and after sales for all segments within TTS. This enables TTS to offer service and after sale worldwide for the full range of its products.
Turnover EBITDA Turnover EBITDA Turnover EBITDA Turnover EBITDA Turnover EBITDA
Roro, cruise, navy 2015 159 16,2 160 15,1 319 31,32014 157 25,3 154 21,4 154 19,4 135 11,1 599 77,3
Container, bulk, tank 2015 313 110,9 72 1,9 385 112,82014 105 -7,5 92 -0,9 112 2,3 112 1,3 422 -4,8
Offshore 2015 92 -8,1 79 -23,7 171 -31,82014 210 32,5 111 -26,4 130 -30,0 121 -26,1 572 -50,0
Multipurpose General Cargo 2015 38 0,7 94 -3,7 132 -3,02014 47 -1,1 28 -6,1 35 -11,7 28 -13,0 138 -32,0
Shipyard Solutions 2015 42 0,2 51 4,3 93 4,52014 53 27,1 59 7,1 43 1,2 37 -2,9 192 32,5
Services 2015 162 19,7 136 13,4 298 33,12014 162 64,0 105 13,1 142 12,8 120 6,5 530 96,4
Corporate / Other 2015 0 -1,7 2 -6,7 2 -8,42014 0 1,4 0 -5,9 0 -4,4 0 -5,3 0 -14,2
Total 2015 811 137,8 593 0,6 1 404 138,42014 734 141,8 549 2,2 617 -10,3 554 -28,4 2 453 105,22013 638 -110,0 565 -82,2 758 36,8 732 25,1 2 693 -130,3
Q4 Q3 Q2 Q1 Full year / YTD

11
Note 3 Share capital and equity As per 30th of June 2015 TTS Group ASA has issued 86 605 660 shares, each with a face value of NOK 0.11 giving a share capital of total NOK 9 526 623. TTS Group ASA holds 112 882 own shares. During the 2nd quarter 2015 leading employees was awarded 600.000 new shares options. Exercise price per share was set to NOK 4,75. 230.000 share options expired. As per the end of 2nd quarter 2015 the leading employees holds 1.037.500 outstanding share options. Note 4 Earnings per share Earnings per share (EPS) are based upon the weighted average number of shares outstanding during the period. Diluted EPS includes the effect of the assumed conversion of potentially dilutive instruments. The components of the numerator for the basic and diluted EPS are as follows:
The components of the denominator for the calculation of basic and diluted EPS are as follows:
Accordingly, the basic and diluted EPS for the quarter is as follows:
Note 5 Related parties Note 21 and accounting principles section 2.2 in the consolidated financial statements of 2014 describe the principles related to elimination of transactions between group subsidiaries. Eliminated transactions have no significance for the financial position and profit for the period. The Group has carried out various transactions with subsidiaries and joint ventures. All the transactions have been carried out as part of the ordinary operations and at arm’s length prices.
Earnings per share/ Resultat per aksje : YTD YTD YTD30.06.2015 30.06.2014 Q2 2015 Q2 2014 31.12.2014
Net income available to shareholders, continued business/ Resultat tilordnet selskapets aksjonærer, videreført virksomhet 75 991 -82 365 101 033 -35 325 -21 819 Effect of dilution/ Utvanningseffekt - - - - - Diluted net income available to shareholders, continued business/ Utvannet resultat tilordnet selskapets aksjonærer, videreført virksomhet 75 991 -82 365 101 033 -35 325 -21 819
Net income available to shareholders, divested business/ Resultat tilordnet selskapets aksjonærer, avhendet virksomhet - - - - 39 562 Effect of dilution/ Utvanningseffekt - - - - - Diluted net income available to shareholders, divested business/ Resultat tilordnet selskapets aksjonærer, avhendet virksomhet - - - - 39 562
Net income available to shareholders/ Utvannet resultat tilordnet selskapets aksjonærer 75 991 -82 365 101 033 -35 325 17 743 Effect of dilution/ Utvanningseffekt - - - - - Diluted net income available to shareholders/ Utvannet resultat tilordnet selskapets aksjonærer 75 991 -82 365 101 033 -35 325 17 743
30.06.2015 30.06.2014 Q2 2015 Q2 2014 31.12.2014Weighted average number of shares outstanding/ Gjennomsnittlig utestående aksjer 86 493 86 457 86 493 86 452 86 443 Effect of dilution/ Utvanningseffekt - - - - - Diluted numbers of shares/ Utvannet gjennomsnittlig utestående aksjer 86 493 86 457 86 493 86 452 86 443
30.06.2015 30.06.2014 Q2 2015 Q2 2014 31.12.2014Earnings per share (NOK)/ Fortjeneste pr. aksje (NOK) 0,879 -0,953 1,200 -0,409 0,205 Diluted earnings per share (NOK)/ Utvannet fortjeneste pr. aksje (NOK) 0,879 -0,953 1,200 -0,409 0,205
30.06.2015 30.06.2014 31.12.2014
Current receivables/ Kortsiktige fordringer 31 067 22 932 28 472
Current liabilities/ Kortsiktig gjeld -1 748 -5 987 -2 198
29 319 16 945 26 274 Net receivables (+) / liabilities (-) to/from Joint Ventures/ Netto fordringer (+) / gjeld (-)
Balance sheet items to/from Joint Ventures/ Balanseposter til/fra felleskontrollert virksomhet

12
Note 6 Tax TTS Group is taxable in more than one jurisdiction based on its operations. A loss in one jurisdiction may not be offset against taxable income in another jurisdiction. Thus, the Group may pay tax within some jurisdictions even though it might have an overall loss or have tax losses exceeding taxable profit at the consolidated level. Based on challenging markets in the offshore market, deferred tax asset in the Norwegian companies were impaired by MNOK 20 in the 4th quarter 2014. Deferred tax Deferred income tax reflects the impact of temporary differences between the amount of assets and liabilities recognized for financial purposes and such amounts recognized for tax purposes. The net recognized deferred tax consists of the following:
Recognized deferred tax asset primarily relates to tax losses in the Norwegian companies. The criteria that have been utilized to estimate that future taxable profit can be utilized against deferred tax losses are; • The Group will have taxable profits before unused tax losses expire • The Group has sufficient temporary differences • Tax losses result from particular identifiable causes Based on challenging market outlook in the Offshore segment, deferred tax asset Norwegian companies was impaired at 31.12.2014.
30.06.2015 30.06.2014 31.12.2014
Gross deferred tax asset1)/ Brutto utsatt skattefordel 1) 45 423 61 156 31 152
Gross deferred tax liability1)/ Brutto utsatt skatteforpliktelse1) -53 354 -29 958 -31 336
-7 931 31 198 -183 1) Gross deferred tax asset is recognized as intangible assets and gross deferred tax liability is recognized as provisions
Net deferred tax asset (+) / liability (-)/ Netto utsatt skattefordel (+) / -forpliktelse (-)
1) Brutto utsatt skattefordel er innregnet som immateriell eiendel og brutto utsatt skatteforpliktelse er innregnet som avsetning for forpliktelser

13
Note 7 Goodwill and other intangible assets TTS Group tests the value of goodwill and other intangible assets annually or at the end of each reporting period if any indication that the assets may be impaired. TTS shares are freely traded at Oslo Stock Exchange. Closing price of last trading date in June 2015 was NOK 4,75 per share, indicating a nominal trade value of TTS of MNOK 411. Book value of the equity at 30.06.2015 was MNOK 882,7 including minority interest. For the subsidiary NMF which was acquired in the 3rd quarter of 2012, the inherent CGU relates to the total activity in the company. Although the results have been weaker than expected, improved utilization in the newbuild section, and a strong development in the cross-related service section, support that the value in use is higher than the book value. Future market development may have material impact on the impairment test. During the past two years, the Offshore segment in TTS has experienced substantial losses on its activity, combined with a low order intake. Changes in the segment structure combined with market conditions which remain challenging, give basis for impairment of goodwill allocated to the segment. An impairment of goodwill of MNOK 9,2 is allocated in the quarter. Governing agreements for the 50/50 owned company TTS Hua Hai (THH) has been changed during the quarter. The changes have required a renewed evaluation of the control evaluation defined in IFRS 10. Based on the evaluation it's been concluded that TTS has the power to control relevant activities which directly influences the risk and return from operational activity in THH. Consequently THH is consolidated on 100% basis as of 2nd quarter 2015. The effects of the change are presented as acquisition in table below. TTS Liftec, which is a well-recognized supplier within the European niche market for translifters is experiencing increased market competition. Future market development could have material impact on the impairment test. TTS Group considers that there are no major events, changes in assumptions or other new information indicating a change in the valuation of goodwill or other intangible assets from year-end 2014 in the other business segments. Future market development could have material impact on the impairment test. Overview of goodwill and other intangible assets are as follows:
Note 8 Non-current assets
30.06.2015 30.06.2014 31.12.2014 30.06.2015 30.06.2014 31.12.2014
Net book value, beginning of period/ Bokført verdi, periodestart 564 464 538 119 538 119 67 918 77 693 77 693
Acquisition/ Oppkjøp 130 818 - - 91 618 - -
Divestment/ Avhendelse - - - - - -
Additions/ Tilgang i året - 0 -273 -419
Depreciations/Amortizations/ Avskrivninger - - - -5 044 -3 269 -12 179
Impairment/ Nedskrivninger -9 150 - - - -
Foreign currency differences/ Omregningsdifferanser -3 151 -10 171 26 345 6 808 -638 2 822
Net book value, end of period/ Bokført verdi, periodeslutt 682 981 527 948 564 464 161 301 73 513 67 918
Other intangible assets /Andre immaterielle eiendelerGoodwill / Goodwill
30.06.2015 30.06.2014 31.12.2014
Net book value, beginning of period/ Bokført verdi, periodestart 160 897 136 049 136 049
Acquisition/ Oppkjøp 2 979 - -
Divestment/ Avhendelse - -500 -500
Additions/ Tilgang i året 5 704 17 678 47 015
Depreciations/Amortizations/ Avskrivninger -13 816 -13 044 -31 782
Impairment/ Nedskrivninger - - -
Foreign currency differences/ Omregningsdifferanser 842 1 428 10 115
Net book value, end of period/ Bokført verdi, periodeslutt 156 606 141 611 160 897
Non-current assets/ anleggsmidler

14
Note 9 Investments in Joint Ventures
As per 30.6.2015 investments in Joint Ventures include TTS Bo Hai Machinery Co Ltd. and Jiangnan TTS Ships Equipment Manufacturing Co Ltd. TTS Hua Hai holds a 40% share portion in Jiangnan. Governing agreements for the 50/50 owned company, TTS Hua Hai Ships Equipment Co Ltd. is changed during the quarter. Changes have been evaluated with respect to definitions in IFRS 10, and TTS have concluded its ability to control the THH. As an effect THH is consolidated on 100% basis as of 2nd quarter 2015. Note 10 Inventories
Note 11 Financial assets measured at fair value The Group has one financial asset measured at fair value in accordance with IFRS 13.
TTS is familiar with ongoing negotiations between Sigma Drilling and STX on final settlement related to the cancellation of the contract, which may give basis for a positive outcome for the owners of Sigma Drilling. At the end of Q2/2015 negotiations are still ongoing. Note 12 Net result divested operations In March 2015 TTS Group finalized the discussions with Cameron related to final release of hold back amount from Cameron related to the sale of the Energy-division in 2012. The release has no material effects on 2015 figures. Note 13 Change of control in 50/50 owned companies Governing agreements for the 50/50 owned company, TTS Hua Hai Ships Equipment Ltd Co. is changed during the quarter. The changes have required a renewed evaluation of the control assessment defined in IFRS 10. Based on the evaluation it's been concluded that TTS have the power to control relevant activities which directly influences the risk and return from operational activity in THH. Consequently the company is consolidated on 100% basis as of 2nd quarter 2015. A preliminary fair value assessment of TTS Hua Hai (THH) based on the discounted cash flow approach is the basis for revaluation and reallocation of THH assets, implementing of non-controlling equity interests in the consolidated accounts, and
Changes in Joint Ventures: - input to note:30.06.2015 31.12.2014 31.12.2014
Net book value, beginning of period/ Bokført verdi, periodestart 102 582 104 002 104 002
Acquisition/ Oppkjøp 66 006
Divestment/ Avhendelse - - -
Reclassification/ Reklassifisering -81 876 - -
Share of profit (+) / loss (-)/ Andel overskudd (+) / underskudd (-) 1 007 3 575 14 325
Share of dividend received/ Utbytte mottatt - -5 495 -5 796
Foreign currency differences/ Omregningsdifferanser 2 140 -8 200 -9 949
Net book value, end of period/ Bokført verdi, periodeslutt 89 859 93 881 102 582
30.06.2015 30.06.2014 31.12.2014Inventories, incl non current/ Råvarer og ferdigvarer ink l. ukurans 296 379 240 236 225 947 Obsolescence/ Ukurans -26 944 -34 888 -36 683 Total inventories/ Sum varelager 269 436 205 348 189 264
Sigma Drilling ASOwnership/
EierandelFair value/
Virkelig verdiOwnership/
EierandelFair value/
Virkelig verdiOwnership/
EierandelFair value/
Virkelig verdi16,1 % - 16,1 % 28 673 16,1 % -
30.06.2015 30.06.2014 31.12.2014

15
profit recognition related to the attributable excess values of the 50% share TTS hold in THH.
Note 14 Financial risk management The Group's objectives and principles of financial risk management are consistent with what stated in the consolidated financial statements for the fiscal year 2014. There has been no execution related to the subordinated bond facility during the 2nd quarter of 2015. The nominal amount and conversion price of the convertible bond loan is unchanged from 4th quarter 2014 and is MNOK 95.3, giving right to 19.184.104 shares upon conversion. The overdraft facility of MNOK 300 with Nordea has been unchanged during 2nd quarter of 2015. Guarantee facility of MNOK 500 with Nordea were increased to MNOK 550 during 1st quarter. Loan facility of MNOK 100, with DNB is unchanged during the 2nd quarter. Guarantee facility with DnB of MNOK 140 has been increased to MNOK 190 during 2nd quarter 2015. At the end of 2nd quarter 2015 TTS-group has drawn MNOK 100 of total MNOK 100 of the 3 year term loan facility in the bank agreement established in December 2012, ref Note 12 in the 2014 annual report. In addition the group has drawn MNOK 243 of the total MNOK 300 overdraft facility. Covenants for both equity ratio and 12 months rolling EBITDA related to the debt facilities with Nordea and DNB were renegotiated in the 4th quarter 2014. The equity covenant requires an equity-portion of 20,0% at all times. Nominal value of remaining bond-debt is to be included in the basis for the calculation. Rolling 12 months NIBD/EBITDA covenant has been waived until 4Q2015. In the period Q4-2014 until 3Q-2015 a new EBITDA covenant is applied.
Amounts in MNOK / Beløp i MNOK MNOK
Equity ‐ Fair value assessment / Egenkapital‐ Virkelig verdi vurdering 404
Fair value of net identified assets/ Virkelig verdi av aktiva ‐856
Fair value of identified liabilities/ Virkelig verdi av passiva 642
Goodwill / Goodwill 190
Intangible assets / Immaterielle eiendeler 107
Tangible fixed assets / Varige driftsmidler 3
Financial fixed assets / Finansielle driftsmidler 67
Total fixed assets / Sum driftsmidler 177
Inventories, acc receivables / Varelager/ kunderfordringer o.l 193
Short term receivables/ Andre kortsiktige fordringer 267
Cash / Kontanter og bankekvivalenter 220
Total current assets / Sum omløpsmidler 680
Total assets / Sum eiendeler 1 046
Equity / Egenkapital 404
Long term liabilities / Langsiktig gjeld 23
Short term liabilities / Kortsiktig gjeld 619
Total equity and liabilities/ Sum egenkapital og gjeld 1 046
Preliminary allocation of fair value of assets, debt and goodwill related to TTS Hua Hai/
Foreløpig allokeing av virkelig verdi for aktiva, passiva og goodwill relatert til TTS Hua Hai

16
The debt and bonding facilities with Nordea and DNB mature in the 4th quarter 2015. The Group's bank loans of MNOK 100 have consequently been classified as short term debt in the reported balance at 30 June. The consolidation of TTS Hua Hai and TTS SCM have significant effects on the cash flow, however no cash is transferred. An adjustment of the cash flow statement to reflect the change would reduce cash flow from operation going from a positive MNOK 18, to a negative MNOK 154. Simultaneously cash from investing activities would be reduced from MNOK -136 to MNOK -34. Cash from financing to be reduced from MNOK 313 to MNOK 101 represented by minority equity interest of MNOK 212. Additional information regarding financial risk management is available in the annual report 2014. Note 15 Subsequent events On the 8th of July 2015 TTS Marine GmbH, entered into two new agreements for delivery of anchor and mooring winches with a total order value of approx. 37 MNOK. Deliveries are scheduled to 2016/2017. On the 22nd June 2015 TTS Handling Systems AS entered into an agreement for purchase of Syncrolift assets. Closing was subject to customary closing conditions, and was completed in august 2015. Additional information on subsequent events is available at www.newsweb.no - ticker TTS
(MNOK) Q4-14 Q1-15 Q2-15 Q3-15EBITDA covenant accumulated ≥ 31 ≥ 31 ≥ 53 ≥ 80