higher education futures - meta-themes and tools
TRANSCRIPT
Higher Education Futures -Meta-Themes and Tools
Louisiana Board of RegentseLearning Speaker Series
April 21, 2021
Louis Soares
Chief Learning and Innovation Officer
Overview
• ACE & Me• Snapshot of LA Board of Regents• What’s Normal in Higher Education Today?• The Future• 21st Century System Characteristics• Discussion
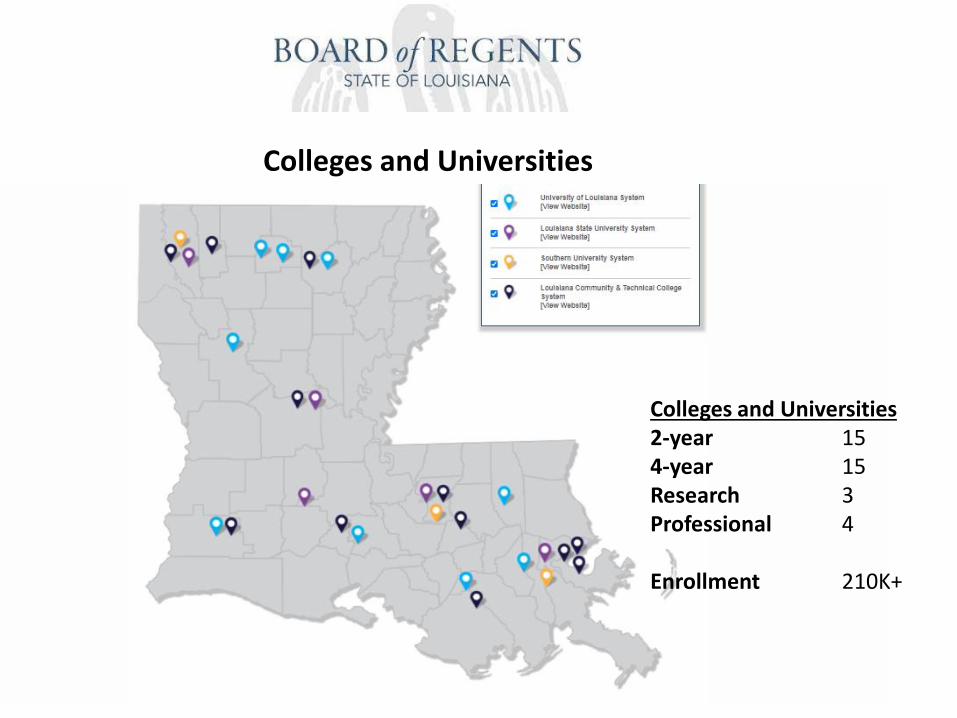
Colleges and Universities
Colleges and Universities2-year 154-year 15Research 3Professional 4
Enrollment 210K+
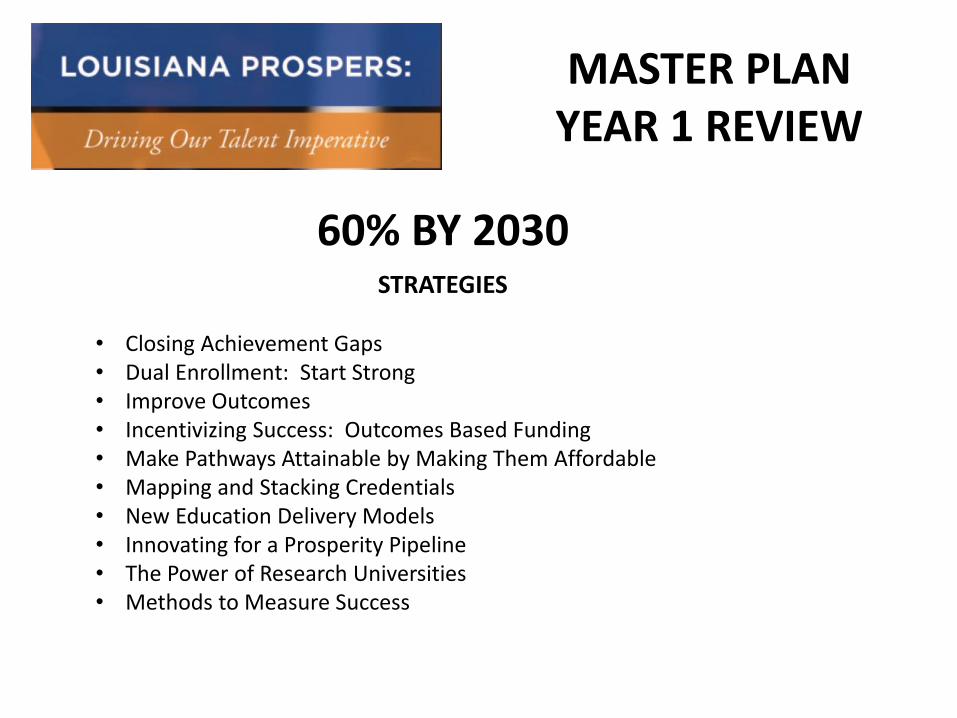
STRATEGIES
• Closing Achievement Gaps • Dual Enrollment: Start Strong• Improve Outcomes• Incentivizing Success: Outcomes Based Funding• Make Pathways Attainable by Making Them Affordable• Mapping and Stacking Credentials• New Education Delivery Models• Innovating for a Prosperity Pipeline• The Power of Research Universities• Methods to Measure Success
MASTER PLANYEAR 1 REVIEW
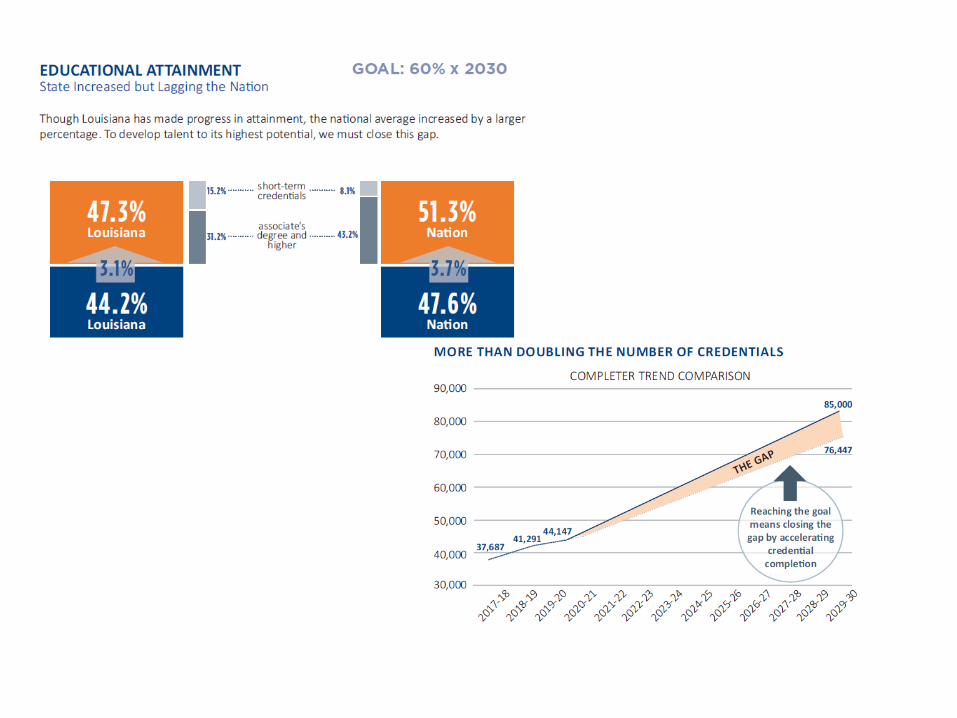
60% BY 2030
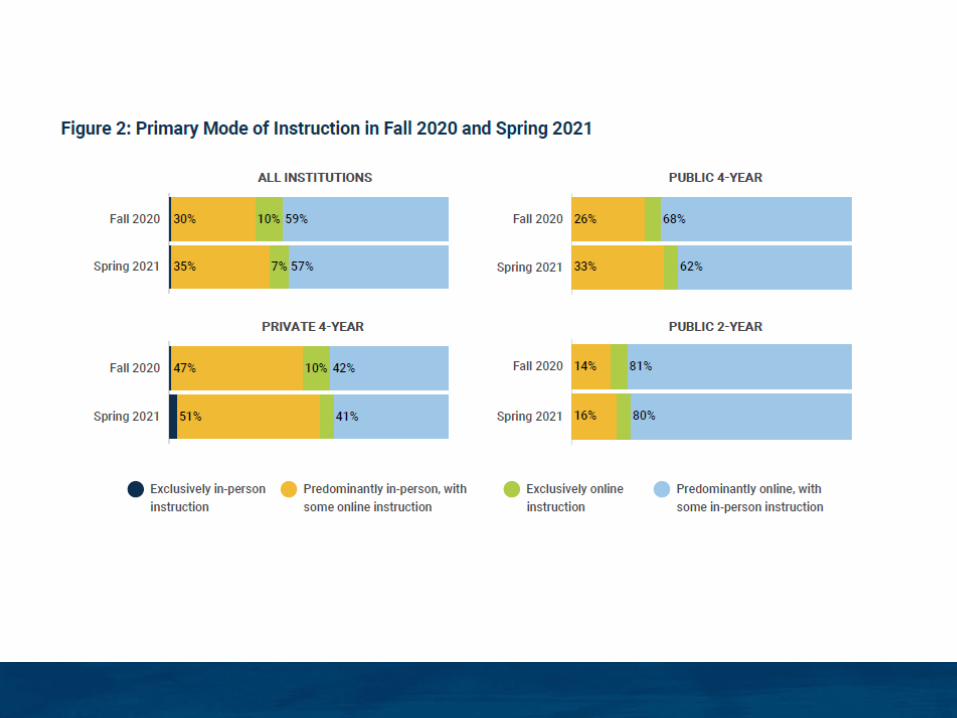
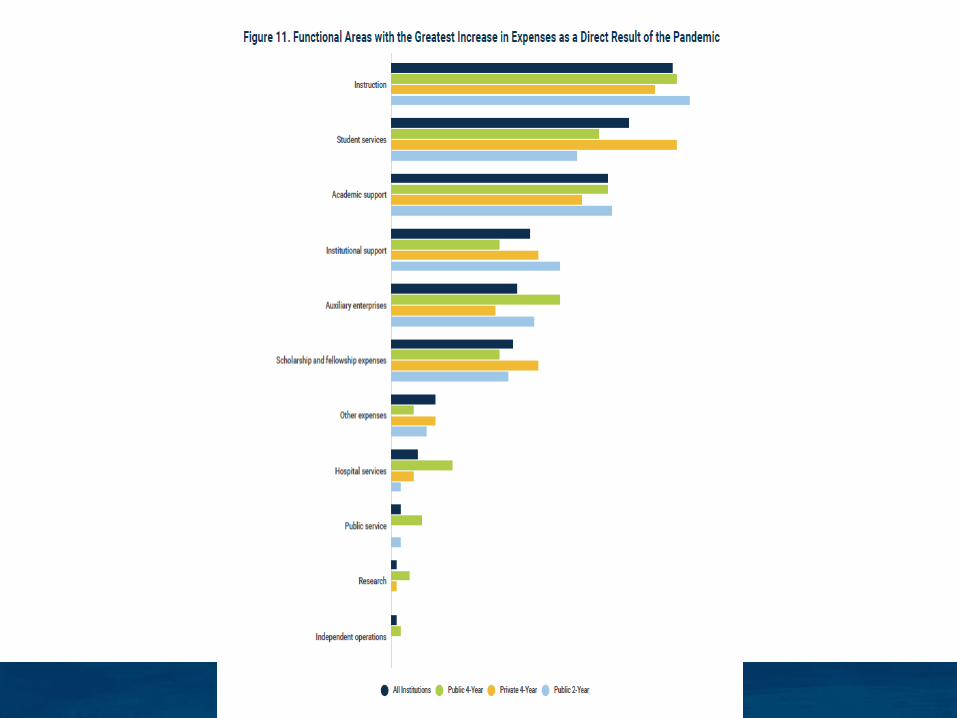

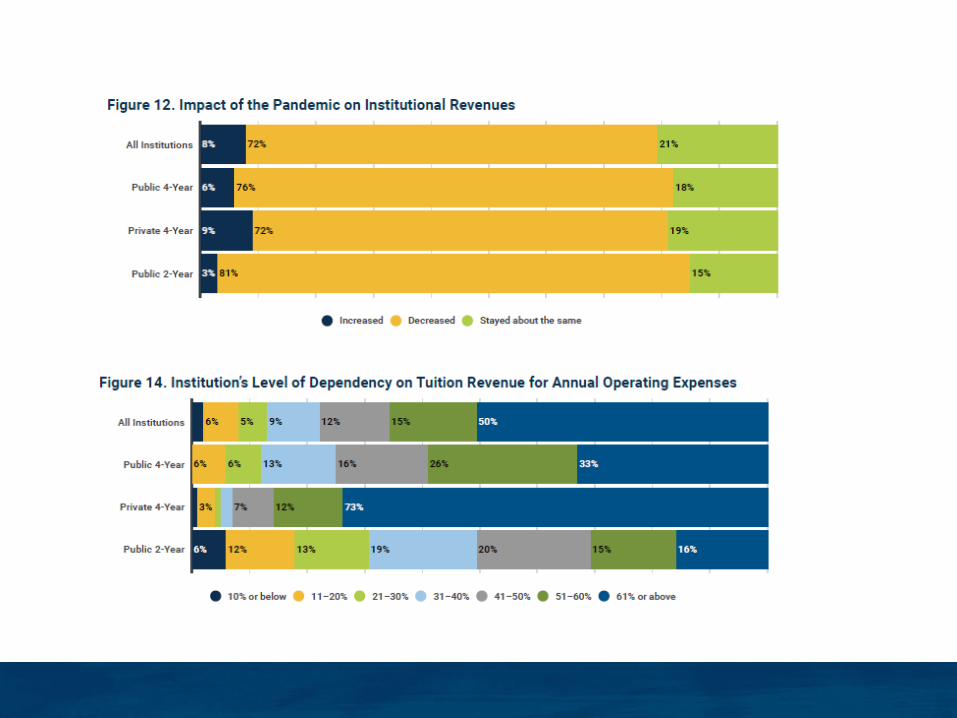
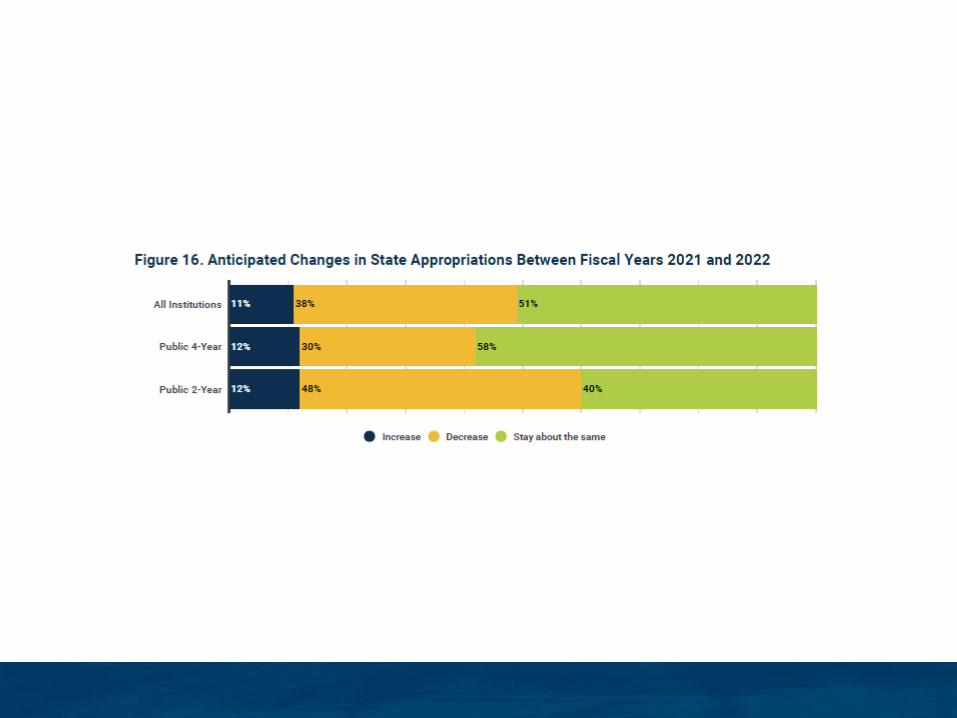


Figure 4. Workers with less education faced more job losses since March 2020.

Source: MorningStar, March 2021
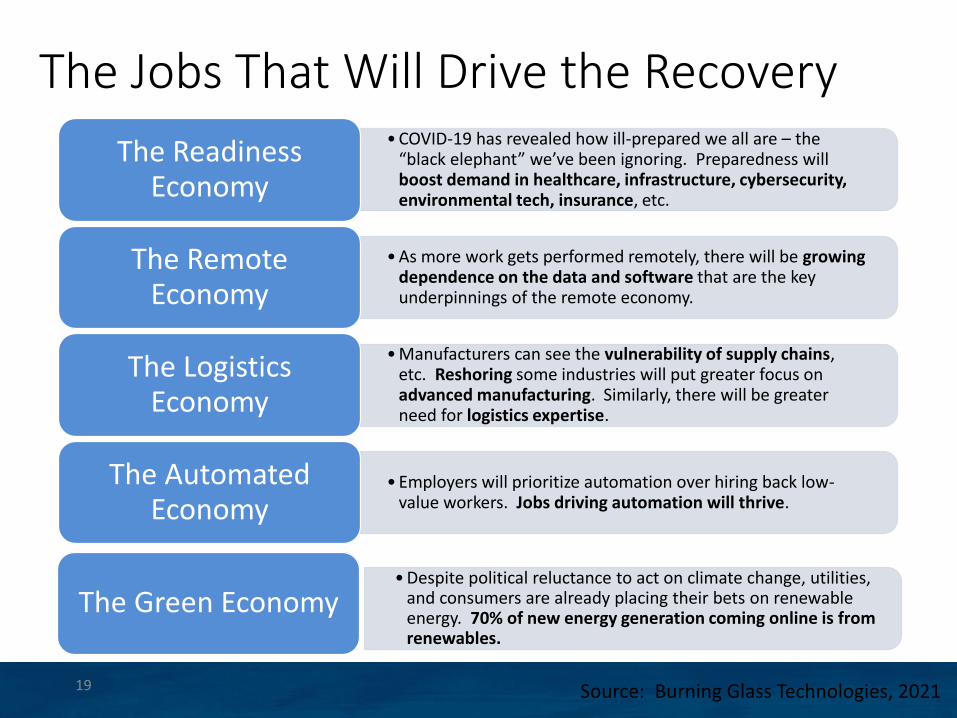
The Jobs That Will Drive the Recovery
19
• COVID-19 has revealed how ill-prepared we all are – the “black elephant” we’ve been ignoring. Preparedness will boost demand in healthcare, infrastructure, cybersecurity, environmental tech, insurance, etc.
The Readiness Economy
• As more work gets performed remotely, there will be growing dependence on the data and software that are the key underpinnings of the remote economy.
The Remote Economy
• Manufacturers can see the vulnerability of supply chains, etc. Reshoring some industries will put greater focus on advanced manufacturing. Similarly, there will be greater need for logistics expertise.
The Logistics Economy
• Employers will prioritize automation over hiring back low-value workers. Jobs driving automation will thrive.
The Automated Economy
The Green Economy• Despite political reluctance to act on climate change, utilities,
and consumers are already placing their bets on renewable energy. 70% of new energy generation coming online is from renewables.
Source: Burning Glass Technologies, 2021
THE FUTURE

21
Source: Brookings analysis of BLS, Census, EMSI, Moodys, and McKinsey data, January 2019
73%
59% 58% 57%53% 51% 49% 47% 44% 43% 42% 41% 41% 40% 37% 36% 35% 34% 34%
27%
0
10
20
30
40
50
60
70
80
Au
tom
atio
n P
ote
nti
al b
y 2
03
0 (
%)
Average potential = 46%
20.2 million 400,000
# of workers in industry
Robots Changing the EconomyAUTOMATION POTENTIAL BY INDUSTRY
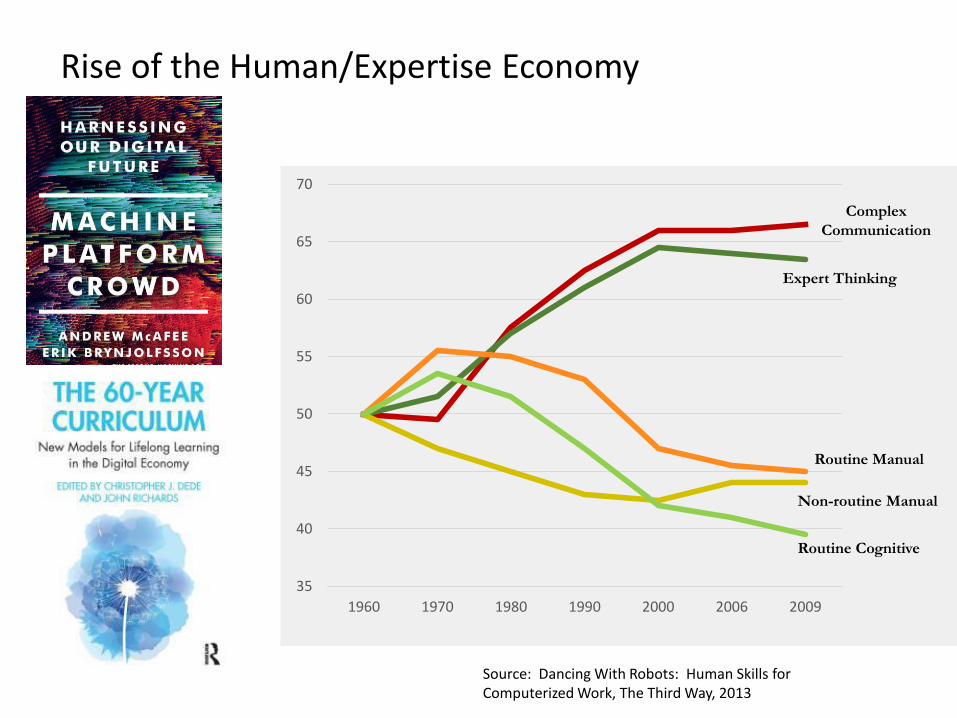
Rise of the Human/Expertise Economy
35
40
45
50
55
60
65
70
1960 1970 1980 1990 2000 2006 2009
Complex
Communication
Expert Thinking
Routine Manual
Non-routine Manual
Routine Cognitive
Source: Dancing With Robots: Human Skills for Computerized Work, The Third Way, 2013

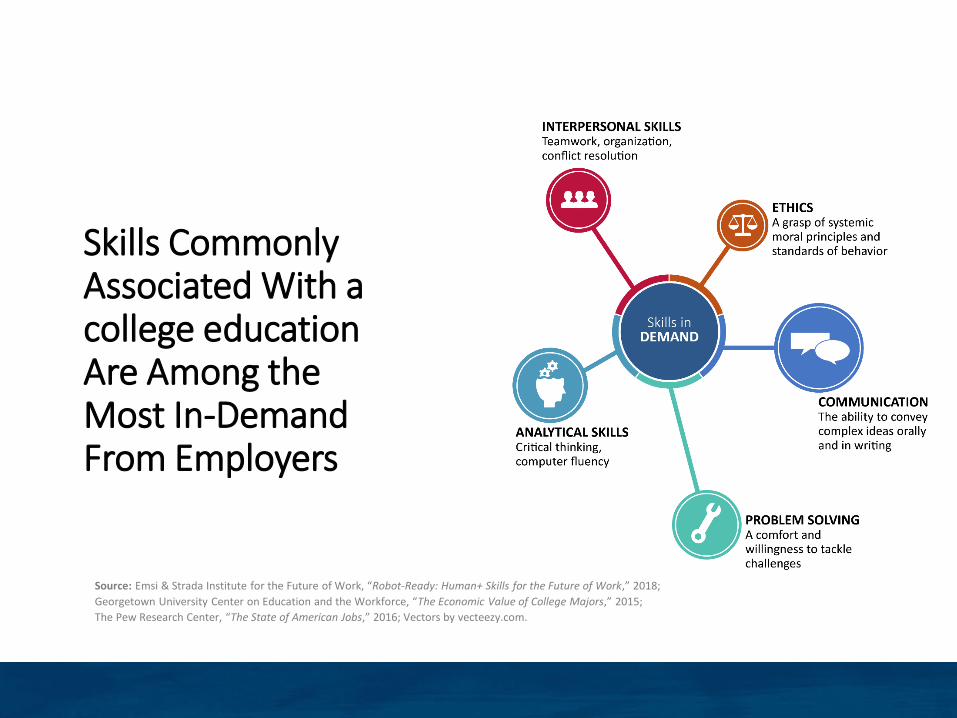
Skills Commonly Associated With a college education Are Among the Most In-Demand From Employers
Source: Emsi & Strada Institute for the Future of Work, “Robot-Ready: Human+ Skills for the Future of Work,” 2018;
Georgetown University Center on Education and the Workforce, “The Economic Value of College Majors,” 2015;
The Pew Research Center, “The State of American Jobs,” 2016; Vectors by vecteezy.com.
Yet, an array of pressures are upending traditional postsecondary education
• Economic/Financial
• Social/Demographics
• Technological
• Accountability
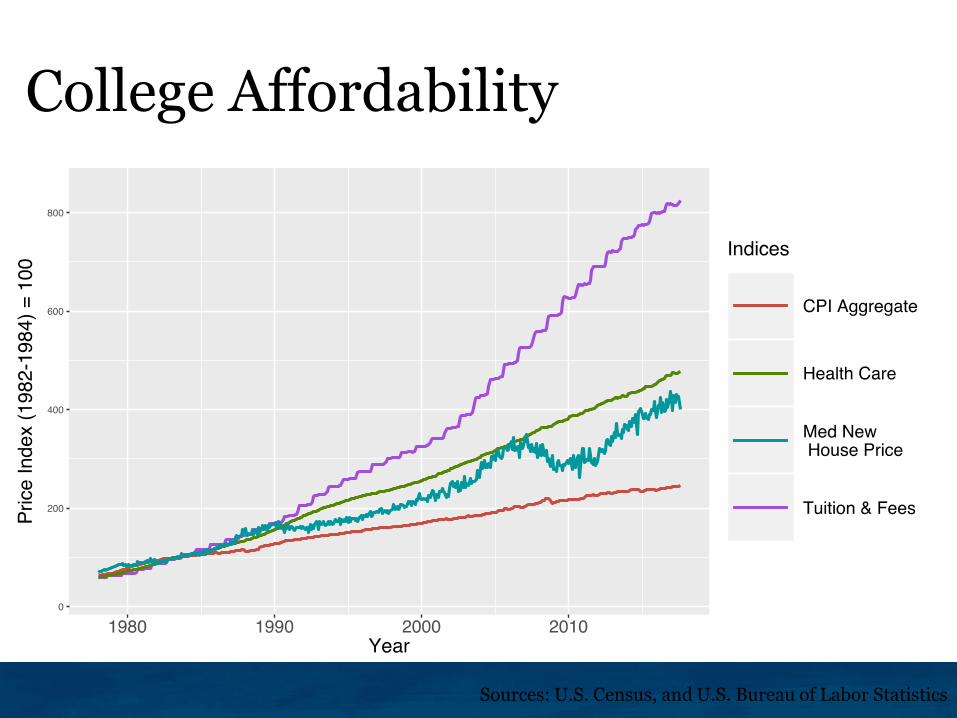
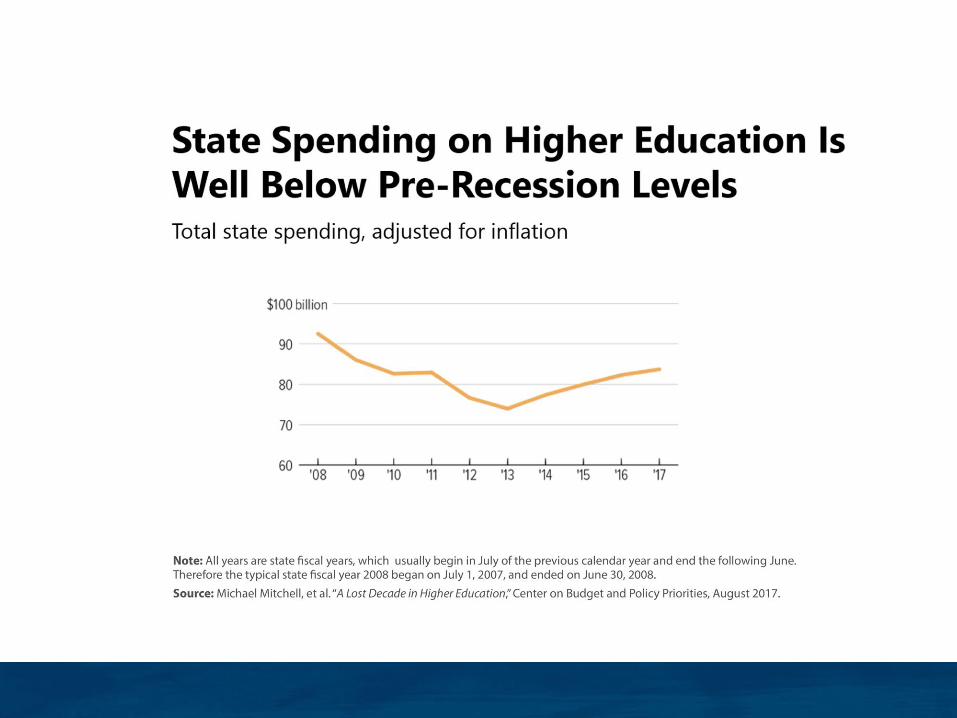
College Affordability
Sources: U.S. Census, and U.S. Bureau of Labor Statistics

Tuition and fees continue to riseAverage Published Tuition and Fees in 2018
Dollars by Sector, 1988-89 to 2018-19
Source: The College Board, Trends in College Pricing 2018, Figure 3.
In 1987, the student share of public higher education total educational revenues was 23%. By 2017 it had increased to 46%.
The student share of public higher educational revenues is expected to rise above 50% during the next economic downturn.
29
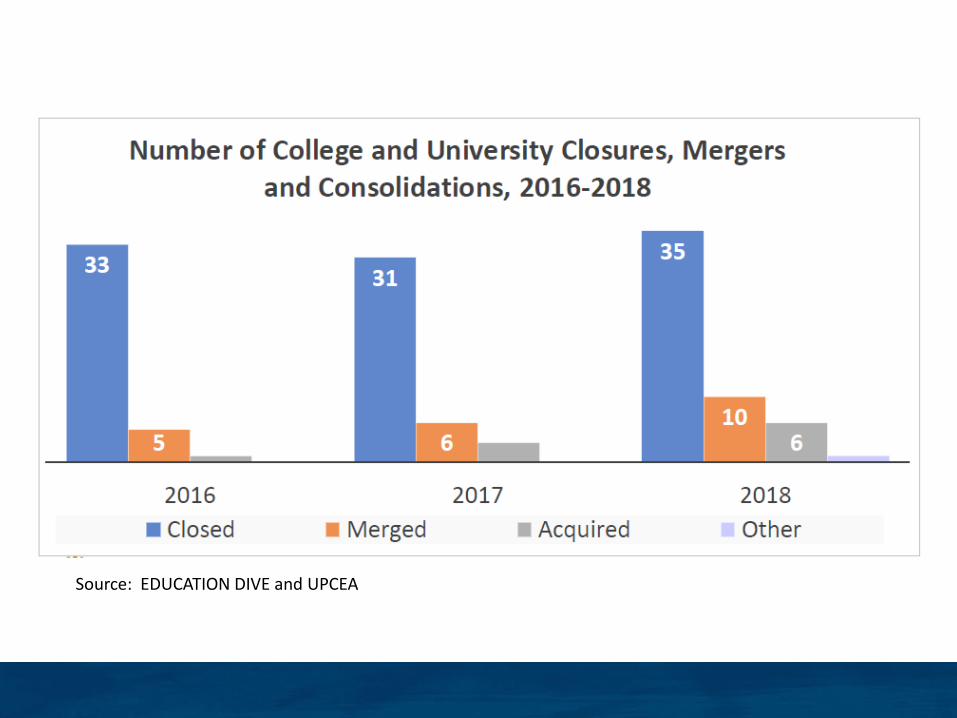
Source: EDUCATION DIVE and UPCEA
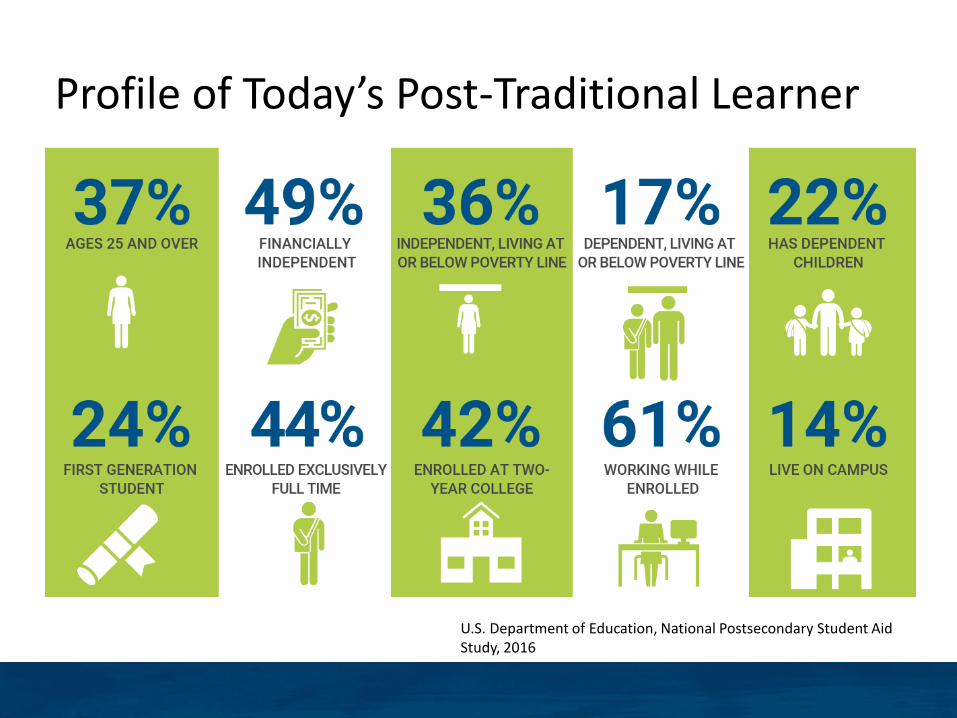
Profile of Today’s Post-Traditional Learner
U.S. Department of Education, National Postsecondary Student Aid Study, 2016
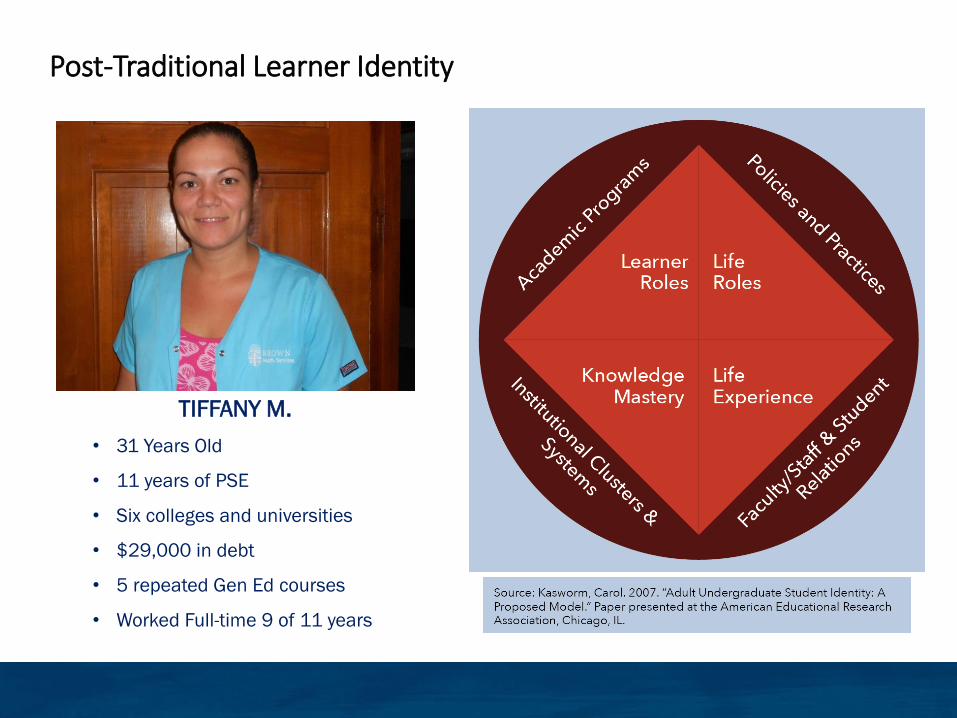
Post-Traditional Learner Identity
TIFFANY M.
• 31 Years Old
• 11 years of PSE
• Six colleges and universities
• $29,000 in debt
• 5 repeated Gen Ed courses
• Worked Full-time 9 of 11 years
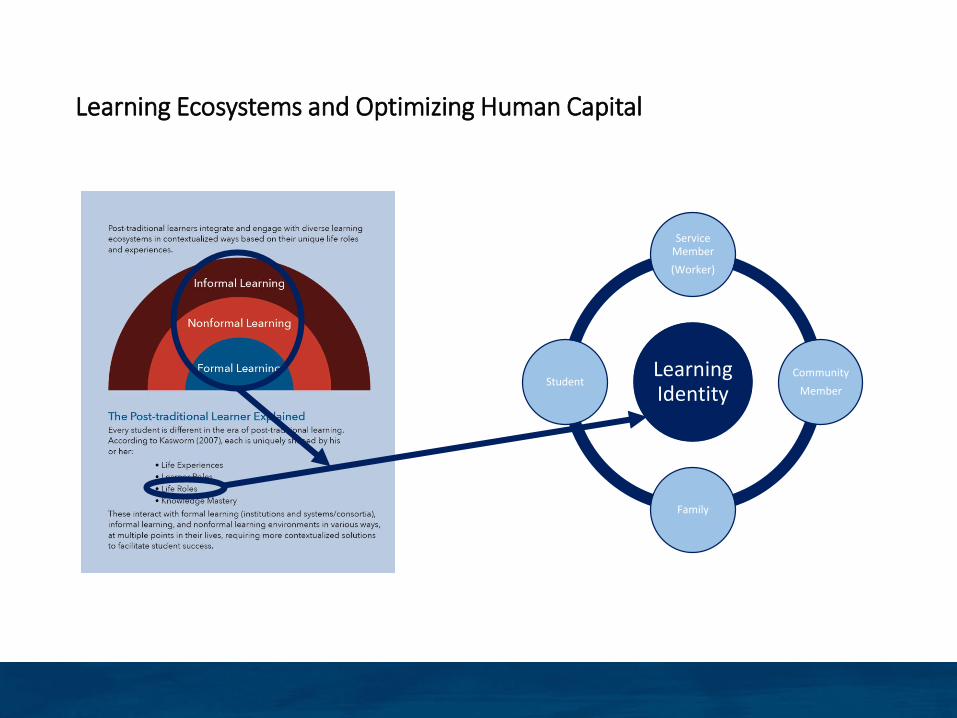
Learning Ecosystems and Optimizing Human Capital
Learning Identity
Service Member
(Worker)
Community
Member
Family
Student
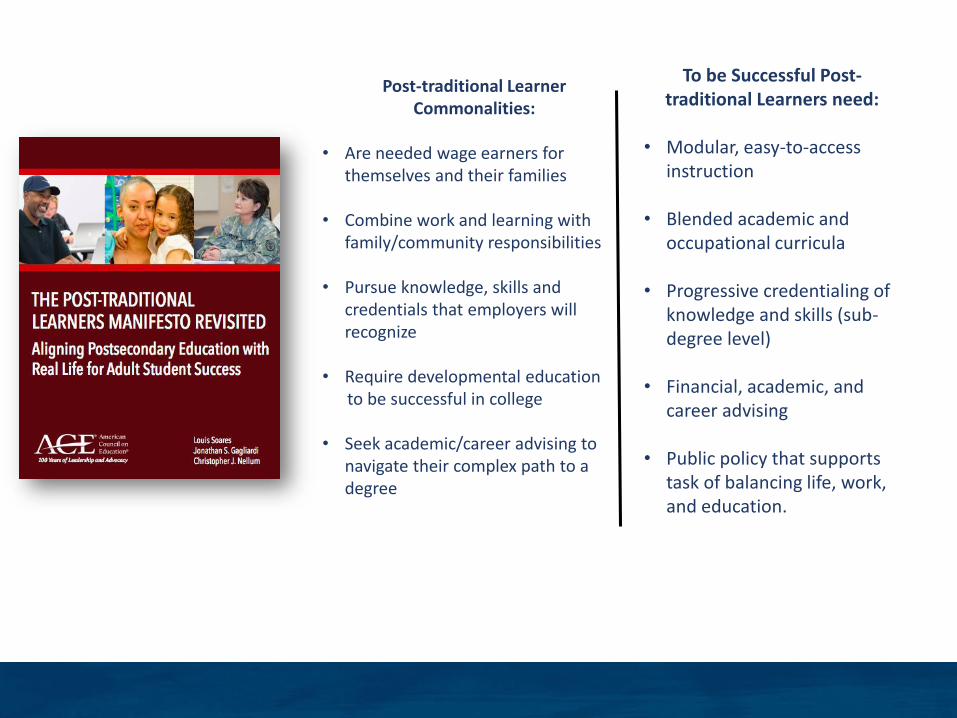
Post-traditional Learner Commonalities:
• Are needed wage earners for themselves and their families
• Combine work and learning with family/community responsibilities
• Pursue knowledge, skills and credentials that employers will recognize
• Require developmental education to be successful in college
• Seek academic/career advising to navigate their complex path to a degree
To be Successful Post-traditional Learners need:
• Modular, easy-to-access instruction
• Blended academic and occupational curricula
• Progressive credentialing of knowledge and skills (sub-degree level)
• Financial, academic, and career advising
• Public policy that supports task of balancing life, work, and education.

3,000,000
3,200,000
3,400,000
3,600,000
Source: Calculations based on Western Interstate Commission for Higher Education (2016)
Projected Drop in Traditional College-Going Age
Forecasted number of high school graduates by year of high school graduation, 2011 to 2032

Technology
Artificial Intelligence
Education Analytics
VR/Simulation
Adaptive Learning
.
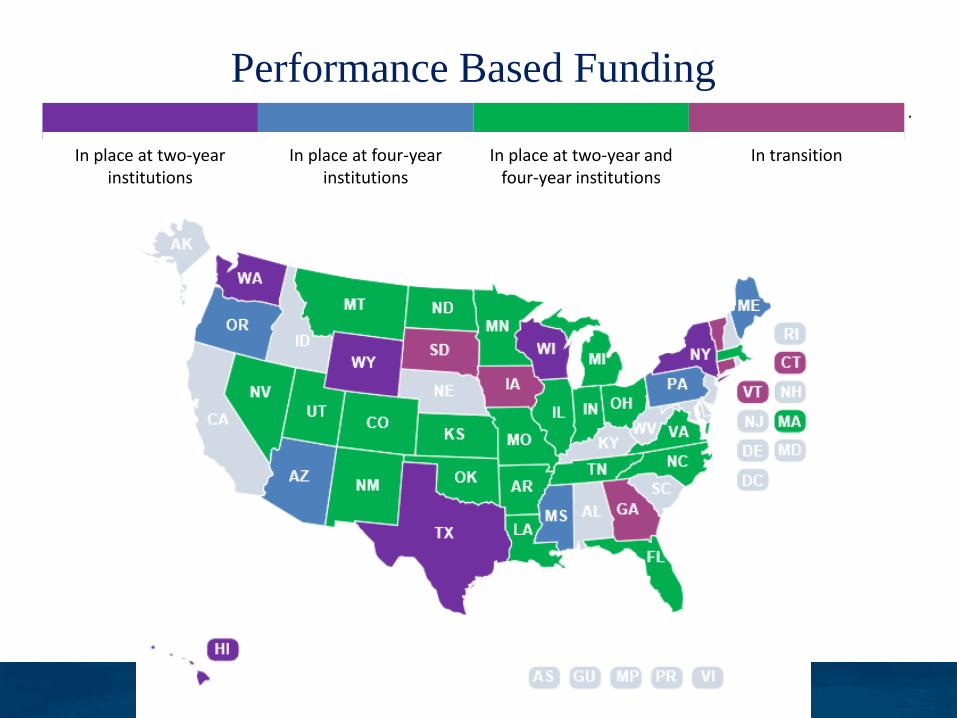
In place at two-year institutions
In place at four-year institutions
In place at two-year and four-year institutions
In transition
Performance Based Funding
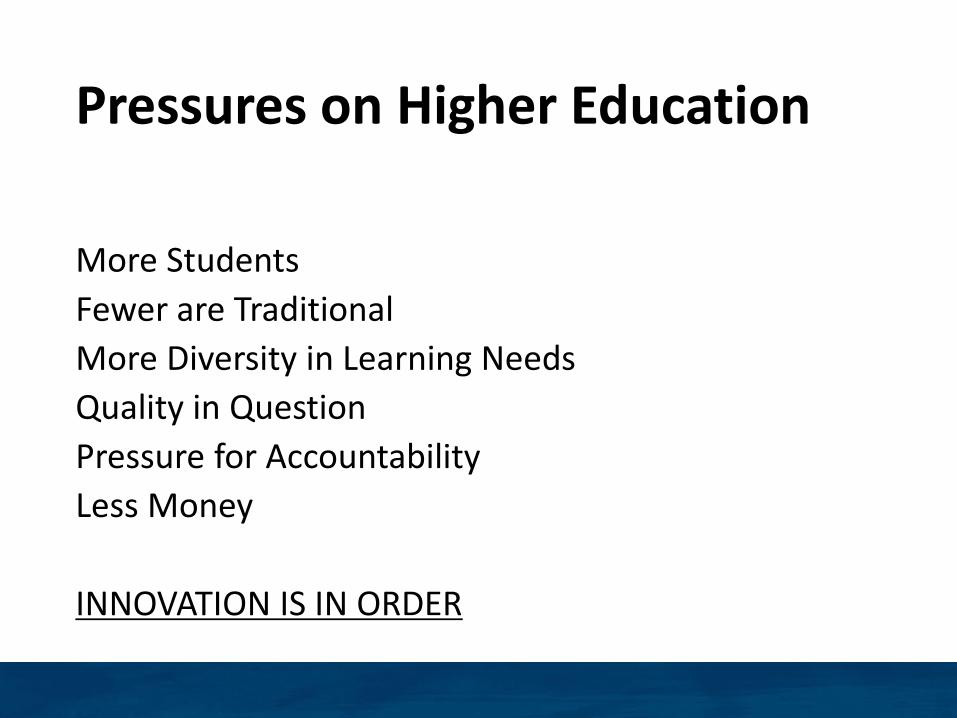
Pressures on Higher Education
More Students
Fewer are Traditional
More Diversity in Learning Needs
Quality in Question
Pressure for Accountability
Less Money
INNOVATION IS IN ORDER
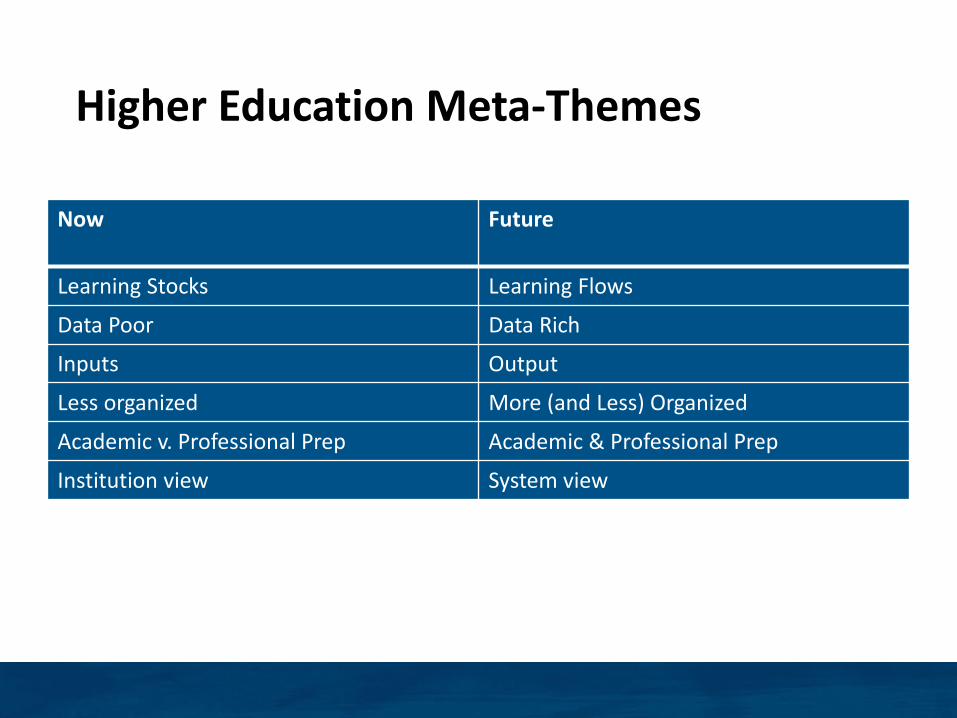
Higher Education Meta-Themes
Now Future
Learning Stocks Learning Flows
Data Poor Data Rich
Inputs Output
Less organized More (and Less) Organized
Academic v. Professional Prep Academic & Professional Prep
Institution view System view
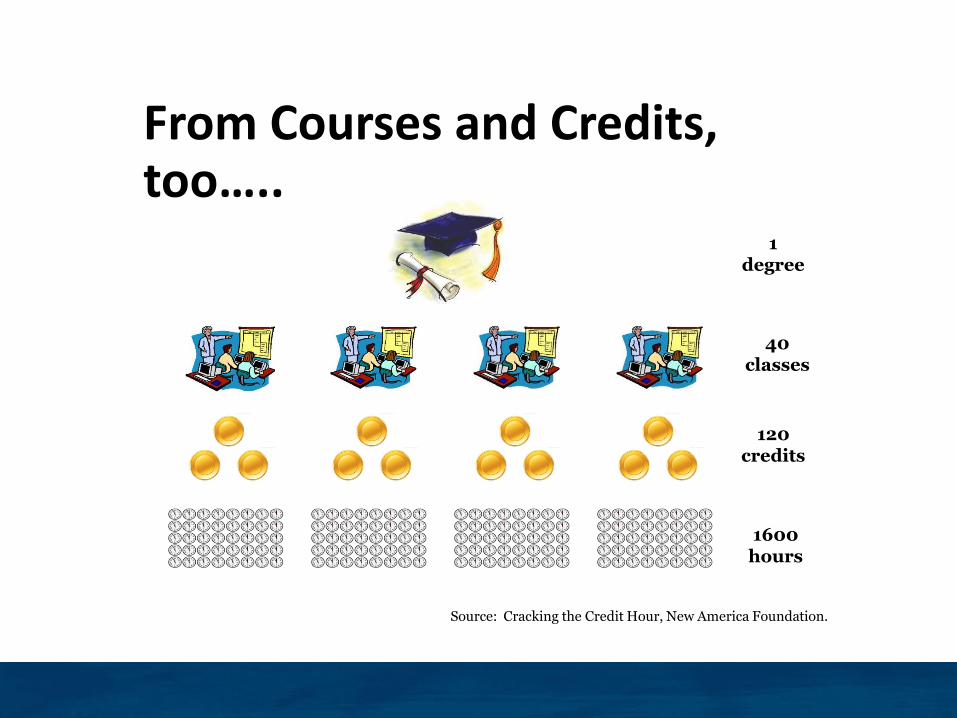
From Courses and Credits, too…..
40 classes
1 degree
120 credits
1600 hours
Source: Cracking the Credit Hour, New America Foundation.
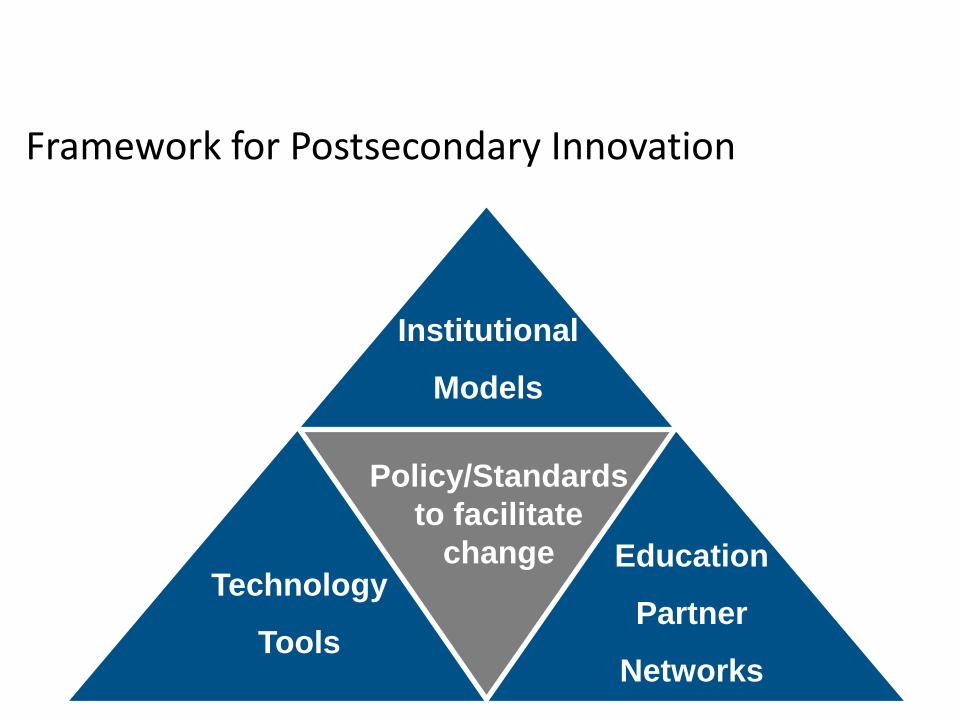
Institutional
Models
Education
Partner
Networks
Technology
Tools
Policy/Standards
to facilitate
change
Framework for Postsecondary Innovation
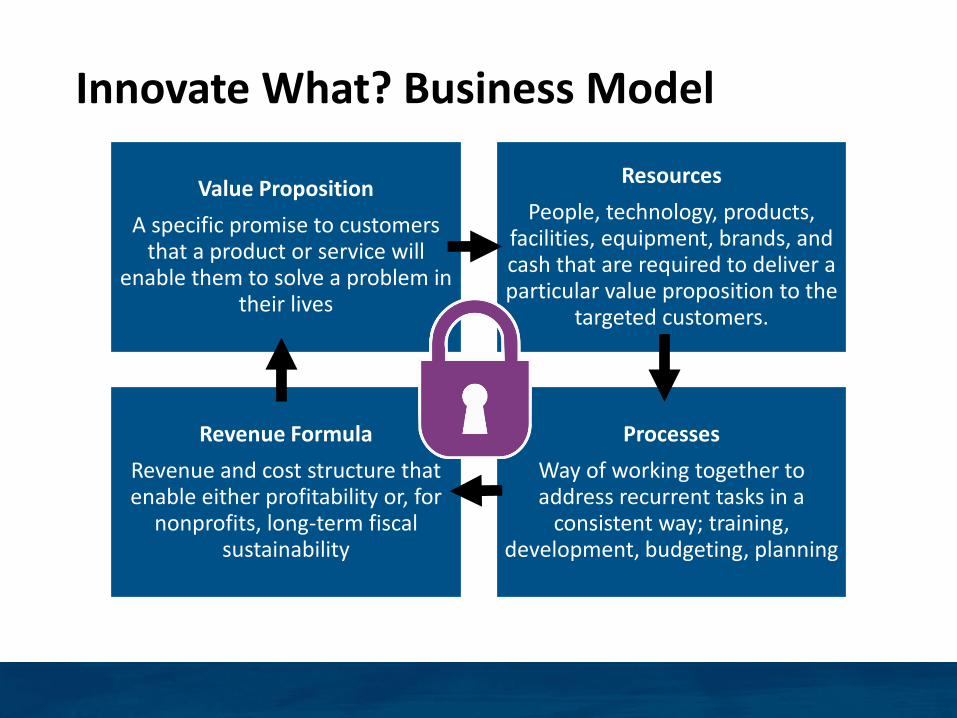
Innovate What? Business Model
Value Proposition
A specific promise to customers that a product or service will
enable them to solve a problem in their lives
Resources
People, technology, products, facilities, equipment, brands, and cash that are required to deliver a particular value proposition to the
targeted customers.
Revenue Formula
Revenue and cost structure that enable either profitability or, for
nonprofits, long-term fiscal sustainability
Processes
Way of working together to address recurrent tasks in a
consistent way; training, development, budgeting, planning
43
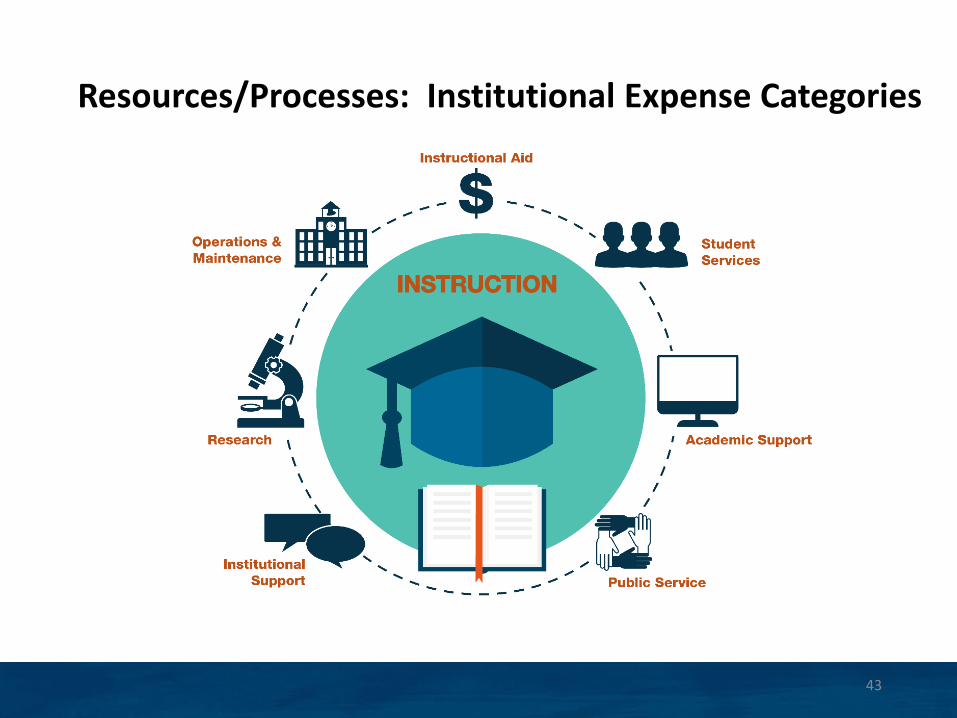
Resources/Processes: Institutional Expense Categories
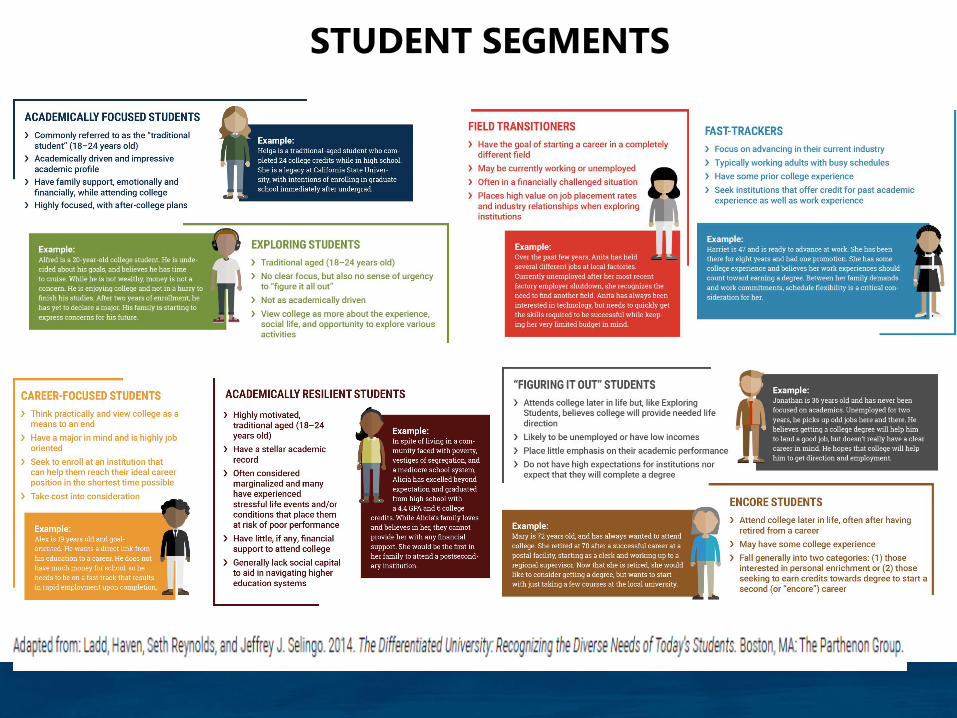
STUDENT SEGMENTS
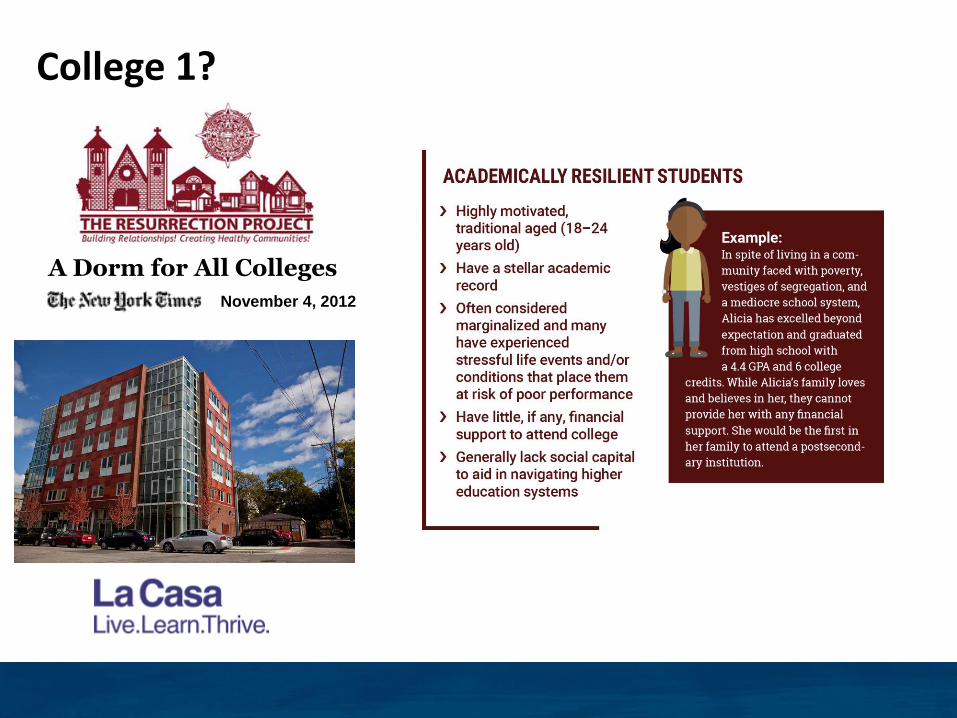

College 2?
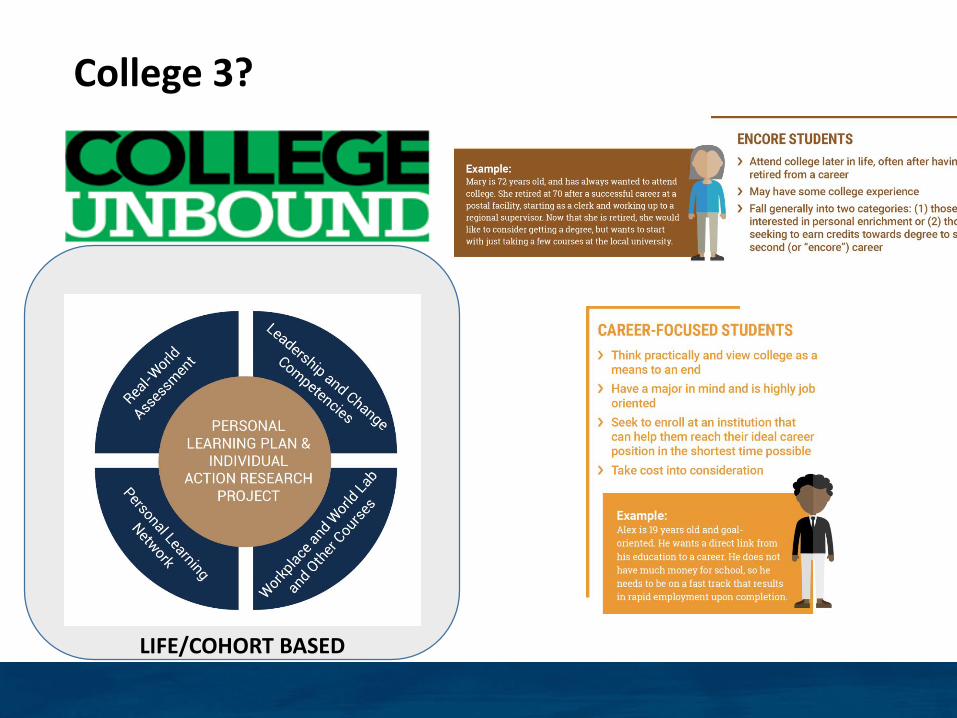
College 3?
STUDENT’S LIFE
LIFE/COHORT BASED
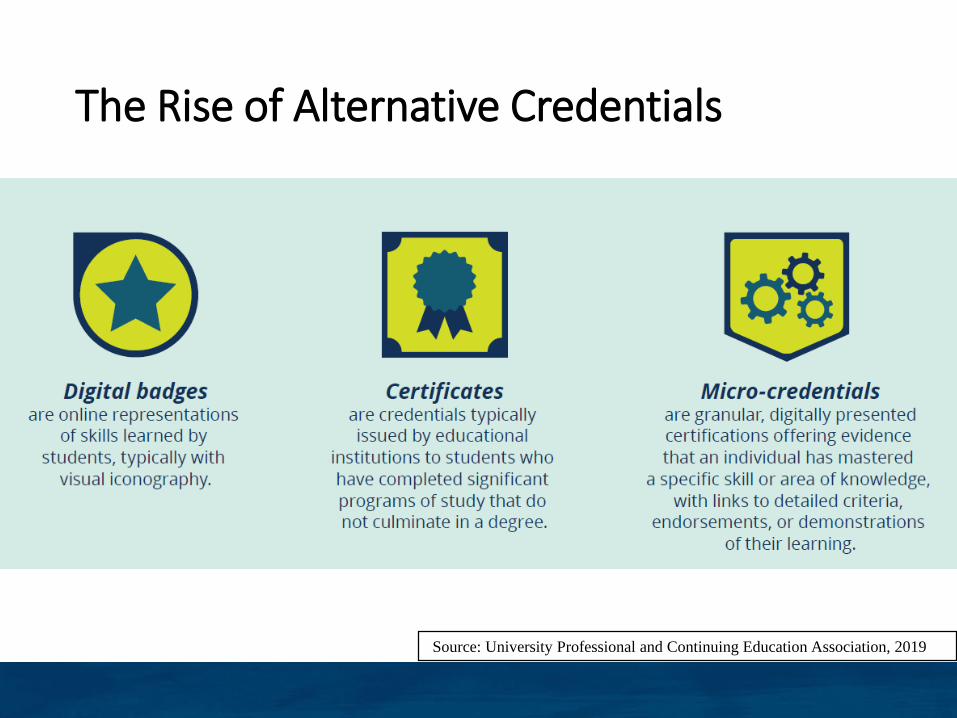
The Rise of Alternative Credentials
Source: University Professional and Continuing Education Association, 2019
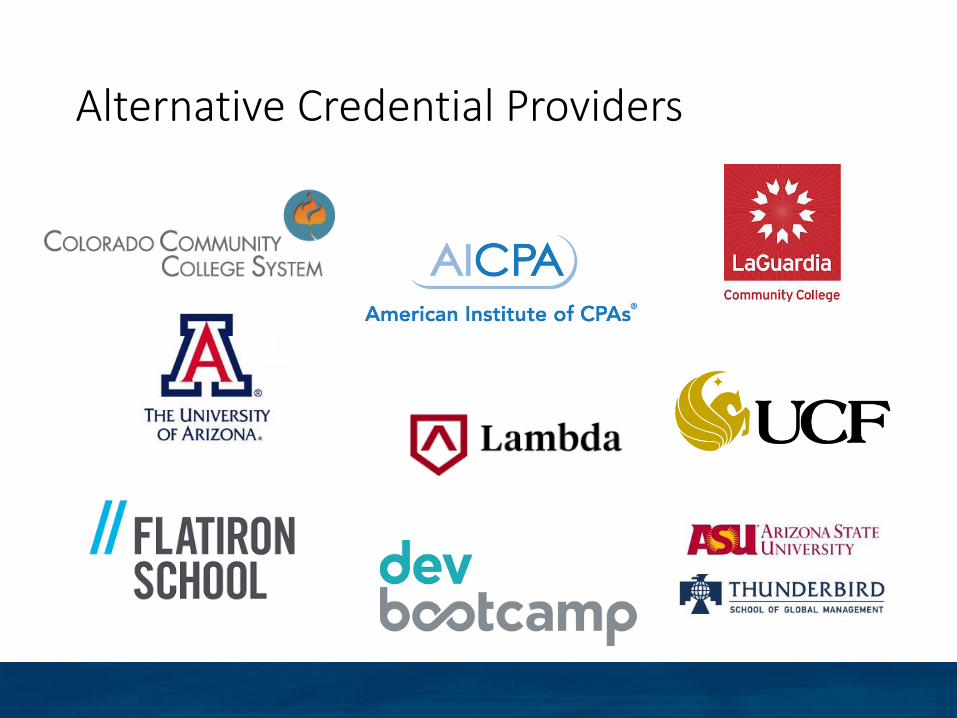
Alternative Credential Providers
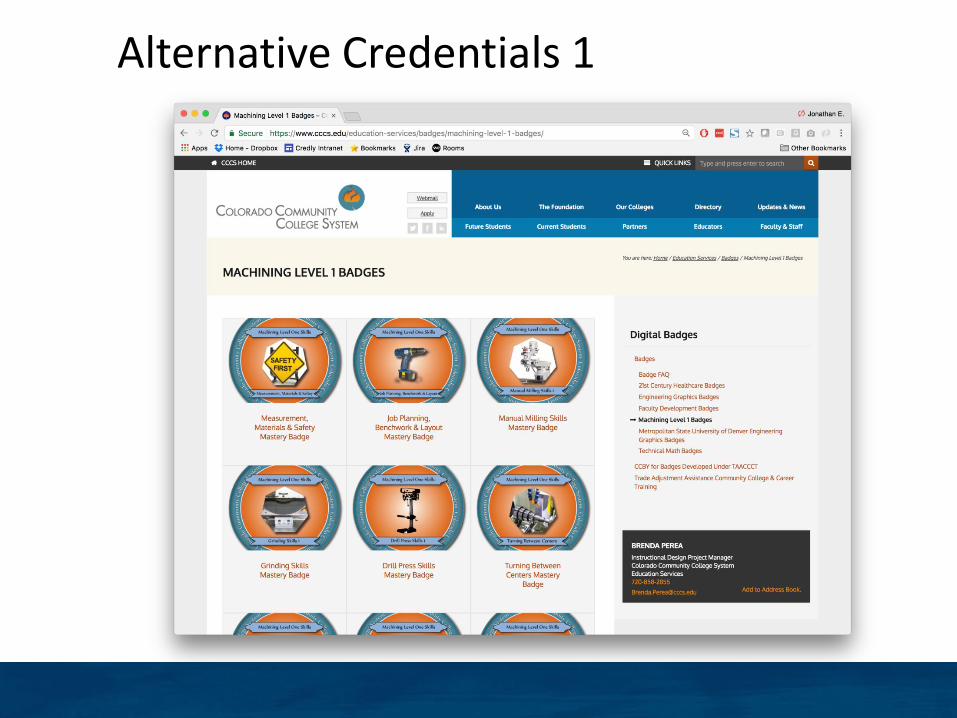
Alternative Credentials 1

Alternative Credentials 2
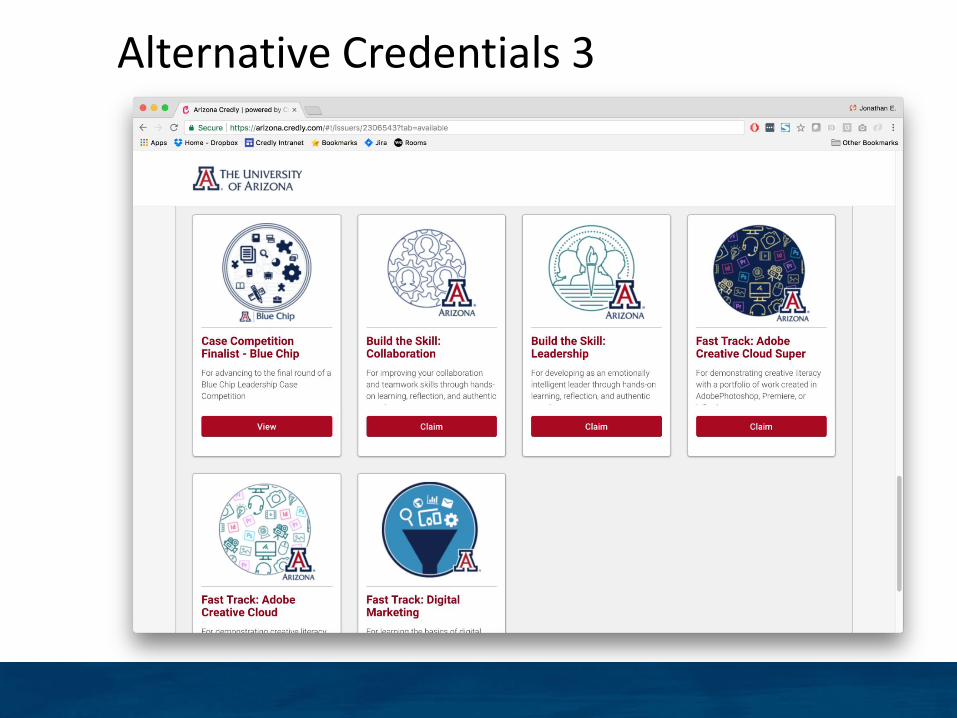
Alternative Credentials 3

21st Century Higher Education System Characteristics
• Learner Centered
• Technology Enabled (learning and management)
• Faculty guided and curated
• Intentionally geared to career and life success
• Provide stackable recognized credentials based on competence
• Incorporate non-collegiate e.g. apprenticeship
• Eliminate “transfer tax”
• Different “models” for different institutional missions

THANKS
Looking Forward to the Discussion!