high temperature co-electrolysis of steam and co2 in an
TRANSCRIPT

General rights Copyright and moral rights for the publications made accessible in the public portal are retained by the authors and/or other copyright owners and it is a condition of accessing publications that users recognise and abide by the legal requirements associated with these rights.
Users may download and print one copy of any publication from the public portal for the purpose of private study or research.
You may not further distribute the material or use it for any profit-making activity or commercial gain
You may freely distribute the URL identifying the publication in the public portal If you believe that this document breaches copyright please contact us providing details, and we will remove access to the work immediately and investigate your claim.
Downloaded from orbit.dtu.dk on: Dec 17, 2021
High Temperature Co-electrolysis of Steam and CO2 in an SOC stack: Performanceand Durability
Chen, Ming; Høgh, Jens Valdemar Thorvald; Nielsen, Jens Ulrik ; Bentzen, Janet Jonna; Ebbesen, SuneDalgaard; Hendriksen, Peter Vang
Published in:Proceedings of 10th European SOFC Forum
Publication date:2012
Link back to DTU Orbit
Citation (APA):Chen, M., Høgh, J. V. T., Nielsen, J. U., Bentzen, J. J., Ebbesen, S. D., & Hendriksen, P. V. (2012). HighTemperature Co-electrolysis of Steam and CO
2 in an SOC stack: Performance and Durability. In Proceedings of
10th European SOFC Forum (pp. A1101)
10th European SOFC Forum 26 - 29 June 2012, Lucerne Switzerland
SOE cell and stack operation Chapter 09 - Session A11 - 4/90
A1101
High Temperature Co-electrolysis of Steam and CO2 in an SOC stack: Performance and Durability
Ming Chen (1), Jens Valdemar Thorvald Høgh (1), Jens Ulrik Nielsen (2),
Janet Jonna Bentzen (1), Sune Dalgaard Ebbesen (1), Peter Vang Hendriksen (1) (1) Department of Energy Conversion and Storage, Technical University of Denmark, DK-
4000 Roskilde / Denmark (2) Topsoe Fuel Cell A/S, Nymoellevej 66, DK-2800 Kgs. Lyngby / Denmark
Tel.: +45 4677 5757 Fax: +45 4677 5858
Abstract High temperature electrolysis based on solid oxide electrolysis cells (SOECs) is a very promising technology for energy storage or production of synthetic fuels. By electrolysis of steam, the SOEC provides an efficient way of producing high purity hydrogen and oxygen [1]. Furthermore, the SOEC units can be used for co-electrolysis of steam and CO2 to produce synthesis gas (CO+H2), which can be further processed to a variety of synthetic fuels such as methane, methanol or DME [2]. Previously we have shown at stack level that Ni/YSZ electrode supported SOEC cells can be operated at 850 oC and -0.5 A/cm2 with no long term degradation, as long as the inlet gases to the Ni/YSZ electrode were cleaned [3]. In this work, co-electrolysis of steam and carbon dioxide was studied in a TOFC® 10-cell stack, containing 3 different types of Ni/YSZ electrode supported cells with a footprint of 12X12 cm2. The stack was operated at 800 oC and -0.75 A/cm2 with 60% conversion for a period of 1000 hours. One type of the cells showed no long term degradation but actually activation during the entire electrolysis period, while the other two types degraded. The performance and durability of the different cell types is discussed with respect to cell material composition and microstructure. The results of this study show that long term electrolysis is feasible without notable degradation also at lower temperature (800 oC) and higher current density (-0.75 A/cm2).

10th European SOFC Forum 26 - 29 June 2012, Lucerne Switzerland
SOE cell and stack operation Chapter 09 - Session A11 - 5/90
Introduction In recent years, there has been an increased focus on development of solid oxide electrolysis technology for hydrogen or synthesis gas (CO+H2) production. Via high temperature electrolysis in solid oxide electrolysis cells (SOECs), electrical energy can be converted to chemical energy and stored as H2 or synthesis gas via electrolysis of steam or co-electrolysis of steam and CO2 [1-3]. These energy carriers may be stored and later either reconverted to electricity or used in the transportation sector. As high-value commodities the electrolysis products, including oxygen, can also be used for further chemical synthesis. High temperature electrolysis has a great potential to be used as a grid modulator in future energy systems based on high amount of fluctuating renewable energy. For SOEC to become a competitive technology for commercialization, durability is one of the crucial issues. Long-term stability under realistic operating conditions for 5-10 years operation is generally required [4-5]. Among various operating parameters, current density and temperature are the two most important. It is advantageous to operate SOECs at high current density in order to decrease production cost. Operating an SOEC stack at low temperature has several advantages, such as minimization of interconnect corrosion and therefore possibility of using inexpensive metallic interconnects, and possible minimization of reactions between different cell components. Previously we have shown at stack level that Ni/YSZ electrode supported SOEC cells can be operated at 850 oC and -0.5 A/cm2 with no long term degradation, as long as the inlet gases to the Ni/YSZ electrode were cleaned [3]. The aim of the present study is to examine the durability of Ni/YSZ electrode supported SOEC cells at higher current density and lower temperature, also at the stack level. Further, the performance and durability of different types of Ni/YSZ electrode supported cells is investigated.
1. Experiments 1.1. Stack manufacturing A TOFC® 10-cell stack was used in the present study. The stack was assembled with 3 different types of planar Ni/YSZ electrode supported cells with a footprint of 12X12 cm2 (active area: 9.6X9.6 cm2). All the cells have a Ni/YSZ support, a Ni/YSZ active fuel electrode, a YSZ electrolyte and an oxygen electrode. Type A and B cells have a LSM/YSZ composite oxygen electrode, prepared by “Production method A” and “Production method B” respectively, while Type C cells have a LSCF/CGO electrode with a CGO barrier layer at the interface between the electrolyte and the oxygen electrode. The cell detail can be found elsewhere [6-7]. The stack consists of ten repeating units (RU), which includes cells and interconnects. The interconnects were made of Crofer22APU with a protective coating at the oxygen electrode side. Voltage probes in contact with the interconnect plates were used to determine the voltage over each RU within the stack. The measured voltage represents the contribution for the entire RU (cell, interconnect, and contact between the cell and the interconnect). The stack was assembled at Topsoe Fuel Cell A/S (TOFC) and a schematic presentation of the stack assembly can be found elsewhere [3]. Table 1 lists cell type for each RU within the stack.

10th European SOFC Forum 26 - 29 June 2012, Lucerne Switzerland
SOE cell and stack operation Chapter 09 - Session A11 - 6/90
Table 1 Cell type for the ten RUs in the stack.
RU no. Cell no. Cell type
01 (bottom) 01 A (Ni/YSZ-YSZ-LSM/YSZ, by Production method A)
02 02 B (Ni/YSZ-YSZ-LSM/YSZ, by Production method B)
03 03 C (Ni/YSZ-YSZ-CGO-LSCF/CGO)
04 04 A (Ni/YSZ-YSZ-LSM/YSZ, by Production method A)
05 05 B (Ni/YSZ-YSZ-LSM/YSZ, by Production method B)
06 06 C (Ni/YSZ-YSZ-CGO-LSCF/CGO)
07 07 A (Ni/YSZ-YSZ-LSM/YSZ, by Production method A)
08 08 B (Ni/YSZ-YSZ-LSM/YSZ, by Production method B)
09 09 C (Ni/YSZ-YSZ-CGO-LSCF/CGO)
10 (top) 10 A (Ni/YSZ-YSZ-LSM/YSZ, by Production method A)
1.2. Performance characterization The nickel oxide in the Ni/YSZ electrode was reduced to nickel in hydrogen at start-up. After reduction, the performance of the individual RUs was investigated by performing DC characterization at varying gas mixtures at the Ni/YSZ electrode (50% H2O – 50% H2 or 45% CO2 – 45% H2O – 10% H2), while pure oxygen was supplied to the LSM/YSZ or LSCF/CGO electrode. The following gases from Air Liquide were used in the study: pure oxygen, industrial grade, O2 ≥ 99.5%; hydrogen, N30, H2 ≥ 99.9%; CO2 ≥ 99.7%. Steam was produced by reacting oxygen with hydrogen. The gases supplied to the Ni/YSZ electrode were cleaned before entering the stack, following a procedure described by Ebbesen et al. [8]. The total flow rate to the Ni/YSZ electrodes was 540 l/h for 45% CO2 – 45% H2O – 10% H2 or 360 l/h for 50% H2O – 50% H2. The total flow rate to the LSM/YSZ or LSCF/CGO oxygen electrodes was 201.6 l/h for both cases. DC characterizations were carried out by recording polarization curves (i-V curves) in both electrolysis cell mode (EC mode) and fuel cell mode (FC mode). The area specific resistance (ASR) of the individual RUs was then calculated from the i-V curves as the chord from open circuit voltage (OCV) to the voltage over the RU measured at a current density of -0.15 A/cm2 (EC mode) or 0.15 A/cm2 (FC mode). 1.3. Durability of the stack The durability during co-electrolysis of steam and carbon dioxide was studied at 800 oC, with 45% CO2 – 45% H2O – 10% H2 (total flow rate: 540 l/h) flowed to the Ni/YSZ electrodes and pure oxygen (total flow rate: 60 l/h) to the LSM/YSZ and LSCF/CGO electrodes. The stack was first operated at -0.5 A/cm2 for 70 hours and afterwards at -0.75 A/cm2 for about 1000 hours. A middle-term DC characterization was carried out after being at -0.75 A/cm2 for 570 hours. The test was then restarted and continued at -0.75 A/cm2 for another 400 hours. Based on Faraday‟s law, the fuel conversion rate was calculated to be 40% for a current density of -0.5 A/cm2 and 60% for -0.75 A/cm2. After the electrolysis durability test, the DC characterization was performed again to investigate the performance change of the individual RUs. 1.4. Post-mortem characterization Post-mortem analysis using scanning electron microscopy (SEM) was carried out on the individual cells. For each cell, a section close to the fuel gas inlet was fractured from the full cell, vacuum embedded in Struers epoxy resin (Epofix), ground using SiC paper, polished using 6, 3, and 1 µm diamond paste. The cross-sections of the samples were examined using a Supra 35 scanning electron microscope from Carl Zeiss equipped with a field emission gun (FE-SEM) and an energy-dispersive X-ray spectrometer (EDXS) from Thermo Electron Corporation. Supra 35 has a state-of-the-art electron optic system
10th European SOFC Forum 26 - 29 June 2012, Lucerne Switzerland
SOE cell and stack operation Chapter 09 - Session A11 - 7/90
configured for high resolution and high contrast specifically in low voltage applications. Two SEM modes were used: low voltage (LV) and backscattered electron (BSE) SEM. For LV SEM, the Inlens detector was used with an accelerating voltage of 0.95 kV. LV SEM imaging using the Inlens detector provides information on percolation of Ni in the Ni/YSZ electrode. Ni grains in the Inlens image appear either light or dark, indicating either electrical percolation or that the Ni grain is electrically insulated from the Ni network, respectively. For BSE, an accelerating voltage of 15kV was used. The samples were carbon coated to eliminate the surface charging. In addition, EDXS analysis was performed using the aforementioned SEM in conjunction with Noran System Six software.
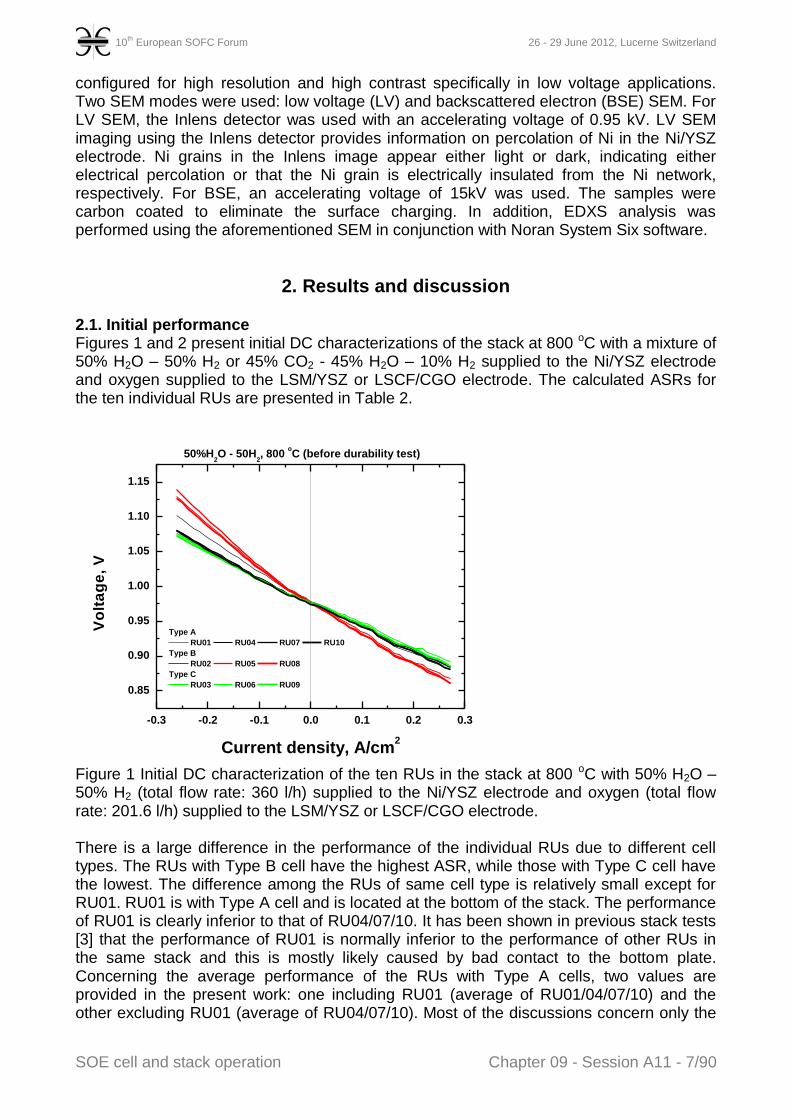
2. Results and discussion 2.1. Initial performance Figures 1 and 2 present initial DC characterizations of the stack at 800 oC with a mixture of 50% H2O – 50% H2 or 45% CO2 - 45% H2O – 10% H2 supplied to the Ni/YSZ electrode and oxygen supplied to the LSM/YSZ or LSCF/CGO electrode. The calculated ASRs for the ten individual RUs are presented in Table 2.
-0.3 -0.2 -0.1 0.0 0.1 0.2 0.3
0.85
0.90
0.95
1.00
1.05
1.10
1.15
Vo
lta
ge
, V
Current density, A/cm2
Type A
RU01 RU04 RU07 RU10
Type B
RU02 RU05 RU08
Type C
RU03 RU06 RU09
50%H2O - 50H
2, 800
oC (before durability test)
Figure 1 Initial DC characterization of the ten RUs in the stack at 800 oC with 50% H2O – 50% H2 (total flow rate: 360 l/h) supplied to the Ni/YSZ electrode and oxygen (total flow rate: 201.6 l/h) supplied to the LSM/YSZ or LSCF/CGO electrode. There is a large difference in the performance of the individual RUs due to different cell types. The RUs with Type B cell have the highest ASR, while those with Type C cell have the lowest. The difference among the RUs of same cell type is relatively small except for RU01. RU01 is with Type A cell and is located at the bottom of the stack. The performance of RU01 is clearly inferior to that of RU04/07/10. It has been shown in previous stack tests [3] that the performance of RU01 is normally inferior to the performance of other RUs in the same stack and this is mostly likely caused by bad contact to the bottom plate. Concerning the average performance of the RUs with Type A cells, two values are provided in the present work: one including RU01 (average of RU01/04/07/10) and the other excluding RU01 (average of RU04/07/10). Most of the discussions concern only the

10th European SOFC Forum 26 - 29 June 2012, Lucerne Switzerland
SOE cell and stack operation Chapter 09 - Session A11 - 8/90
value excluding RU01. With respect to different cell types, the RUs with Type C cells showed the best performance in all the DC characterizations, with an average ASR of 0.35 Ω cm2 in 50% H2O – 50% H2 for both EC and FC modes and 0.47 Ω cm2 in 45% CO2 - 45% H2O – 10% H2 for EC mode. The RUs with Type A cells showed higher ASR, while those with Type B cells showed the highest. As identical interconnect plates were used for all the RUs, the performance difference should be to a large degree related to different cell types and further to different oxygen electrodes (LSM/YSZ by production method A and B and LSCF/CGO). It is expected that the LSCF/CGO oxygen electrode shall have similar or better performance than the LSM/YSZ electrode at 800 oC. Both Type A and B cells have LSM/YSZ oxygen electrode, the performance difference is probably due to different interface structure at the electrolyte-oxygen electrode interface caused by different production methods. The Type A cells have also been characterized via single cell testing (the detailed results will be reported elsewhere) at 800 oC, with 45% CO2 - 45% H2O – 10% H2 supplied to the Ni/YSZ electrode and oxygen to the LSM/YSZ electrode. The fuel flow rate to the Ni/YSZ electrode was adjusted to be similar to the stack testing condition, i.e. 5.86 m3/h m2 cell area. The ASR was measured as 0.41 Ω cm2. The average ASR for the RUs with Type A cells (excluding RU01) was measured to be 0.51 Ω cm2 (Table 2). The difference between ASR of the cell from single cell testing and ASR of the RU from the stack testing can be ascribed to the interconnect plate contact resistance, which was calculated as 0.10 Ω cm2 for the RUs with Type A cells. This is consistent with the value reported in the previous study (0.09 Ω cm2 at 850 oC) [3]. It can therefore be concluded that in the present study the cells performed as expected in the stack according to the initial DC characterizations.
-0.5 -0.4 -0.3 -0.2 -0.1 0.0 0.10.80
0.85
0.90
0.95
1.00
1.05
1.10
1.15
1.20
1.25
1.30
Vo
lta
ge
, V
Current density, A/cm2
Type A
RU01 RU04 RU07 RU10
Type B
RU02 RU05 RU08
Type C
RU03 RU06 RU09
45%CO2 - 45%H
2O - 10H
2, 800
oC (before durability test)
Figure 2 Initial DC characterization of the ten RUs in the stack at 800 oC with 45% CO2 - 45% H2O – 10% H2 (total flow rate: 540 l/h) supplied to the Ni/YSZ electrode and oxygen (total flow rate: 201.6 l/h) supplied to the LSM/YSZ or LSCF/CGO electrode. Table 2 Area specific resistances (ASRs) calculated from the initial DC characterization of the ten RUs in the stack at 800 oC with either 50% H2O – 50% H2 (total flow rate: 360 l/h) or 45% CO2 - 45% H2O – 10% H2 (total flow rate: 540 l/h) supplied to the Ni/YSZ electrode, while oxygen (total flow rate: 201.6 l/h) was supplied to the LSM/YSZ or LSCF/CGO electrode.

10th European SOFC Forum 26 - 29 June 2012, Lucerne Switzerland
SOE cell and stack operation Chapter 09 - Session A11 - 9/90
Repeating unit (RU) ASR, Ω cm2
50% H2O – 50% H2 45% CO2 - 45% H2O – 10% H2
Electrolysis mode
Fuel cell mode
Electrolysis mode
Type A 01 0.44 0.40 0.55
04 0.38 0.36 0.50
07 0.38 0.36 0.52
10 0.38 0.37 0.51
Average_RU01/04/07/10 0.39 0.37 0.52
Average_RU04/07/10 0.38 0.36 0.51
Type B 02 0.53 0.45 0.63
05 0.57 0.48 0.71
08 0.54 0.46 0.68
Average_RU02/05/08 0.55 0.46 0.67
Type C
03 0.34 0.34 0.44
06 0.35 0.35 0.49
09 0.37 0.35 0.49
Average_RU03/06/09 0.35 0.35 0.47
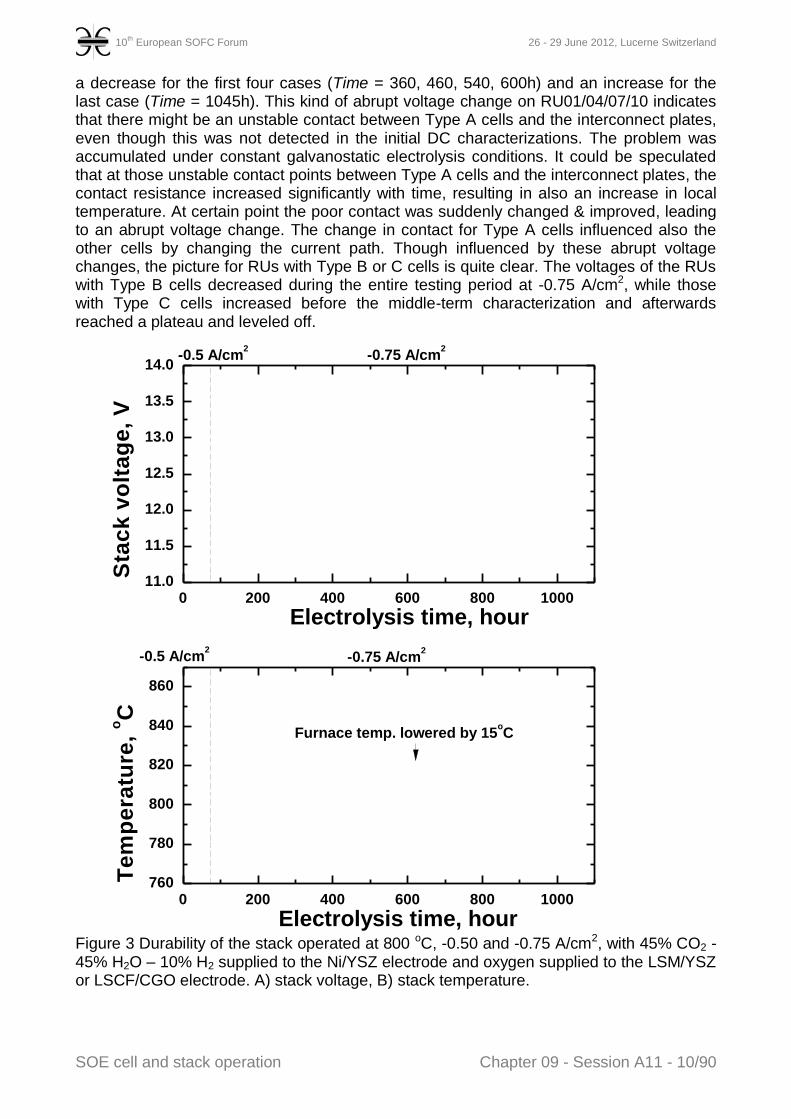
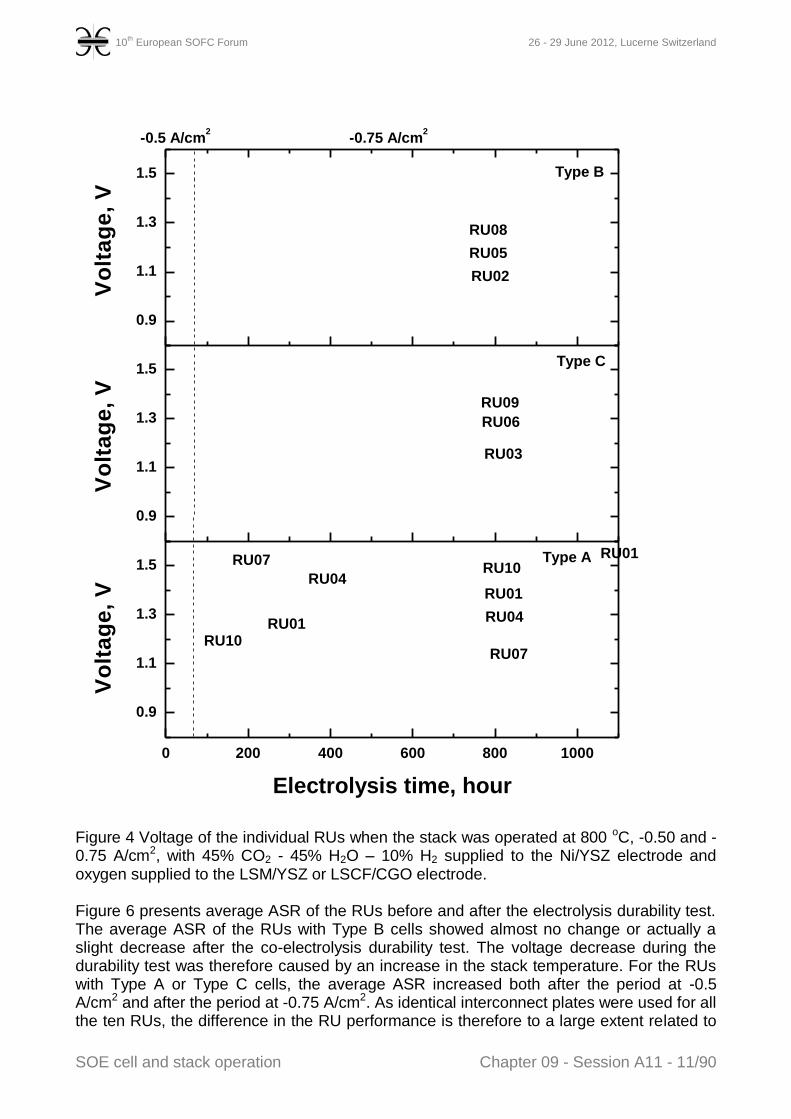
2.2. Durability The durability of the stack and of the individual RUs were examined after the initial DC performance characterization. The evolution of the stack voltage and temperature is plotted in Figure 3. The stack was first operated at -0.5 A/cm2 for 70 hours and afterwards at -0.75 A/cm2 for about 1000 hours. A middle-term DC characterization was carried out after being at -0.75 A/cm2 for 570 hours. The test was then restarted and continued at -0.75 A/cm2 for another 400 hours. During the entire testing period, the furnace temperature was kept constant, except for at Time = 620h where it was lowered intentionally by 15 oC. Accordingly this caused an increase in the voltages of the stack and of the individual RUs. For the period at -0.5 A/cm2, the stack voltage increased 0.16 V (from 11.36 to 11.52 V, corresponding to a degradation rate of 2.3 mV/h), accompanied with a temperature increase of 3 oC (from 794 to 797 oC). The temperature increase is probably caused by an increase in the resistance of the RUs. At -0.75 A/cm2, the stack voltage exhibited a number of abrupt drops/jumps. The last one happened at Time = 1045 h, where the stack voltage increased 0.62 V (from 12.80 to 13.42 V), accompanied with a temperature decrease of 16 oC (from 827 to 811 oC). For the testing period at -0.75 A/cm2 and excluding the last jump, the stack voltage increased 0.10 V (from 12.70 to 12.80 V, corresponding to a degradation rate of 0.10 mV/h), accompanied with a temperature increase of 27 oC (from 800 to 827 oC). The voltage evolution for the ten individual RUs is plotted in Figure 4 and the evaluated degradation rates are presented in Figure 5. The difference between the individual RUs is to a large extent related to different cell types. At -0.5 A/cm2, the voltages of the RUs with Type A or C cells increased while those with Type B cells decreased. The difference became larger at -0.75 A/cm2. The RUs with Type A cells gave a quite noisy picture. They showed fast degradation, with an abrupt voltage drop/jump of 200 – 400 mV after certain period and afterwards degraded again. This kind of phenomenon happened first to RU10 at Time = 360h, then RU04 at Time = 460h, RU07 at Time = 540h, RU 01 at Time = 600h, and in the end RU01 at Time = 1045h. During this abrupt voltage change, the voltages of the other RUs were also affected, increasing a few tens of mV. The stack voltage exhibited
10th European SOFC Forum 26 - 29 June 2012, Lucerne Switzerland
SOE cell and stack operation Chapter 09 - Session A11 - 10/90
a decrease for the first four cases (Time = 360, 460, 540, 600h) and an increase for the last case (Time = 1045h). This kind of abrupt voltage change on RU01/04/07/10 indicates that there might be an unstable contact between Type A cells and the interconnect plates, even though this was not detected in the initial DC characterizations. The problem was accumulated under constant galvanostatic electrolysis conditions. It could be speculated that at those unstable contact points between Type A cells and the interconnect plates, the contact resistance increased significantly with time, resulting in also an increase in local temperature. At certain point the poor contact was suddenly changed & improved, leading to an abrupt voltage change. The change in contact for Type A cells influenced also the other cells by changing the current path. Though influenced by these abrupt voltage changes, the picture for RUs with Type B or C cells is quite clear. The voltages of the RUs with Type B cells decreased during the entire testing period at -0.75 A/cm2, while those with Type C cells increased before the middle-term characterization and afterwards reached a plateau and leveled off.
0 200 400 600 800 100011.0
11.5
12.0
12.5
13.0
13.5
14.0-0.75 A/cm
2-0.5 A/cm
2
Electrolysis time, hour
Sta
ck
vo
lta
ge
, V
0 200 400 600 800 1000760
780
800
820
840
860
Furnace temp. lowered by 15oC
Electrolysis time, hour
-0.75 A/cm2
-0.5 A/cm2
Te
mp
era
ture
, oC
Figure 3 Durability of the stack operated at 800 oC, -0.50 and -0.75 A/cm2, with 45% CO2 - 45% H2O – 10% H2 supplied to the Ni/YSZ electrode and oxygen supplied to the LSM/YSZ or LSCF/CGO electrode. A) stack voltage, B) stack temperature.
10th European SOFC Forum 26 - 29 June 2012, Lucerne Switzerland
SOE cell and stack operation Chapter 09 - Session A11 - 11/90
0 200 400 600 800 1000
0.9
1.1
1.3
1.5
0.9
1.1
1.3
1.5
0.9
1.1
1.3
1.5
RU01RU07
RU04
RU01RU10
RU07
RU04
RU01
RU10
Vo
lta
ge
, V
Electrolysis time, hour
Type A
RU03
RU06
RU09
Type C
Vo
lta
ge
, V
RU02
RU05
RU08
-0.75 A/cm2
Type B
Vo
lta
ge
, V
-0.5 A/cm2
Figure 4 Voltage of the individual RUs when the stack was operated at 800 oC, -0.50 and -0.75 A/cm2, with 45% CO2 - 45% H2O – 10% H2 supplied to the Ni/YSZ electrode and oxygen supplied to the LSM/YSZ or LSCF/CGO electrode. Figure 6 presents average ASR of the RUs before and after the electrolysis durability test. The average ASR of the RUs with Type B cells showed almost no change or actually a slight decrease after the co-electrolysis durability test. The voltage decrease during the durability test was therefore caused by an increase in the stack temperature. For the RUs with Type A or Type C cells, the average ASR increased both after the period at -0.5 A/cm2 and after the period at -0.75 A/cm2. As identical interconnect plates were used for all the ten RUs, the difference in the RU performance is therefore to a large extent related to

10th European SOFC Forum 26 - 29 June 2012, Lucerne Switzerland
SOE cell and stack operation Chapter 09 - Session A11 - 12/90
the different cell types and further to the difference on the oxygen electrode side. The Type B cells have the worst initial performance but the best durability. They showed the best performance after 1000 hours at -0.75 A/cm2. The Type A cells, though also having a LSM/YSZ oxygen electrode but produced differently, experienced contact problem and gave a noisy picture. The Type C cells, having a LSCF/CGO oxygen electrode, showed the best initial performance, but degraded under galvanostatic electrolysis conditions. After 1000 hours at -0.75 A/cm2, the performance is inferior to that of the Type B cells.
-0.2
0.0
0.2
0.4
0.6
RU03/06/09
(Type C)
RU02/05/08
(Type B)
RU04/07/10
(Type A)
RU01/04/07/10
(Type A)
Av
era
ge
de
gra
da
tio
n r
ate
, m
V/h
At -0.5 A/cm2 (5-65 h)
Period I at -0.75 A/cm2 (100-600 h)
Period II at -0.75 A/cm2 (700-1000 h)
At -0.75 A/cm2 (100-1000 h)
Figure 5 Average voltage degradation rates of the individual RUs when the stack was operated at 800 oC, -0.50 and -0.75 A/cm2, with 45% CO2 - 45% H2O – 10% H2 supplied to the Ni/YSZ electrode and oxygen supplied to the LSM/YSZ or LSCF/CGO electrode.
0.2
0.4
0.6
0.8
1.0
1.2
1.4
1.6
1.8
RU03/06/09
(Type C)
RU02/05/08
(Type B)
RU04/07/10
(Type A)
AS
R,
cm
2
Before electrolysis durability test
After 70h at -0.5 A/cm2 (Time=70h)
After 570h at -0.75 A/cm2 (Time=640h)
After electrolysis durability test
RU01/04/07/10
(Type A)
Figure 6 Average ASRs calculated from the DC characterization of the ten RUs in the stack before the electrolysis durability test, after 70h at -0.5 A/cm2 (Time = 70h), after 570h at -0.75 A/cm2 (Time = 640h) and after the entire electrolysis durability test. The DC characterization was carried out at 800 oC with 45% CO2 - 45% H2O – 10% H2 supplied to the Ni/YSZ electrode and oxygen supplied to the LSM/YSZ or LSCF/CGO electrode.
10th European SOFC Forum 26 - 29 June 2012, Lucerne Switzerland
SOE cell and stack operation Chapter 09 - Session A11 - 13/90
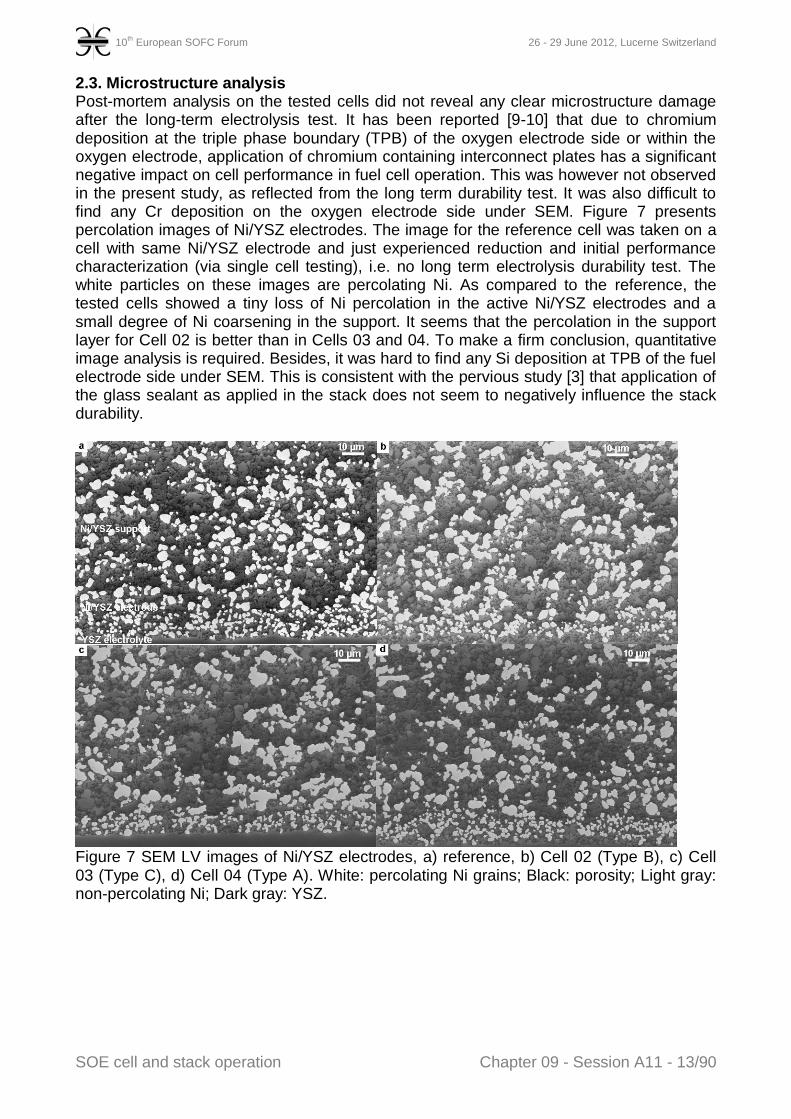
2.3. Microstructure analysis Post-mortem analysis on the tested cells did not reveal any clear microstructure damage after the long-term electrolysis test. It has been reported [9-10] that due to chromium deposition at the triple phase boundary (TPB) of the oxygen electrode side or within the oxygen electrode, application of chromium containing interconnect plates has a significant negative impact on cell performance in fuel cell operation. This was however not observed in the present study, as reflected from the long term durability test. It was also difficult to find any Cr deposition on the oxygen electrode side under SEM. Figure 7 presents percolation images of Ni/YSZ electrodes. The image for the reference cell was taken on a cell with same Ni/YSZ electrode and just experienced reduction and initial performance characterization (via single cell testing), i.e. no long term electrolysis durability test. The white particles on these images are percolating Ni. As compared to the reference, the tested cells showed a tiny loss of Ni percolation in the active Ni/YSZ electrodes and a small degree of Ni coarsening in the support. It seems that the percolation in the support layer for Cell 02 is better than in Cells 03 and 04. To make a firm conclusion, quantitative image analysis is required. Besides, it was hard to find any Si deposition at TPB of the fuel electrode side under SEM. This is consistent with the pervious study [3] that application of the glass sealant as applied in the stack does not seem to negatively influence the stack durability.
Figure 7 SEM LV images of Ni/YSZ electrodes, a) reference, b) Cell 02 (Type B), c) Cell 03 (Type C), d) Cell 04 (Type A). White: percolating Ni grains; Black: porosity; Light gray: non-percolating Ni; Dark gray: YSZ.

10th European SOFC Forum 26 - 29 June 2012, Lucerne Switzerland
SOE cell and stack operation Chapter 09 - Session A11 - 14/90
3. Conclusion In this work, co-electrolysis of steam and carbon dioxide was studied in a TOFC® 10-cell stack, containing 3 different types of Ni/YSZ electrode supported cells with a footprint of 12X12 cm2. The cells differ mainly in the oxygen electrode, where Type A and B cells have LSM/YSZ oxygen electrodes but produced differently while Type C cells have an LSCF/CGO electrode instead. The stack was operated at 800 oC and -0.75 A/cm2 with 60% conversion for a period of 1000 hours. The RUs (repeating units) with Type A cells experienced a contact problem and gave a quite noisy picture. The RUs with Type B cells showed no long term degradation and a small ASR decrease after electrolysis. Those with Type C cells showed the best initial performance, but degraded under galvanostatic electrolysis conditions. The results of this study show that long term electrolysis is feasible without notable degradation also at lower temperature (800 oC) and higher current density (-0.75 A/cm2).
Acknowledgement This work was financially supported by the Energinet.dk through the projects ForskEL 2010-1-10432 “planSOEC-R&D and commercialization roadmap for SOEC electrolysis” with a grant of 2 million DKr and ForskEL 2011-1-10609 “Development of SOEC cells and stacks” with a grant of 13.252 million DKr.
References [1] A. Brisse, J. Schefold, M. Zahid, Inter. J. Hydrogen Energy, 33 (2008), 5375. [2] S. D. Ebbesen and M. Mogensen, J. Power Sources, 193 (2009), 349. [3] S. D. Ebbesen, J. Høgh, K. A. Nielsen, J. U. Nielsen, M. Mogensen, Int. J. Hydrogen
Energy, 36 (2011), 7363. [4] C. Graves, S. D. Ebbesen, M. Mogensen, and K. S. Lackner, Renewable and
Sustainable Energy Rev., 15 (2011), 1. [5] Q. Fu, C. Mabilat, M. Zahid, A. Brisse, and L. Gautier, Energy Environ. Sci., 3 (2010),
1382. [6] S. D. Ebbesen, C. Graves, A. Hauch, S. H. Jensen, and M. Mogensen, J.
Electrochem. Soc., 157 (2010), B1419. [7] J. Nielsen, A. Hagen, and Y. L. Liu, Solid State Ionics, 181 (2010), 517. [8] S. D. Ebbesen and M. Mogensen, European Patent Application (EP2362475A1) -
Method and system for purification gas streams for solid oxide cell, 2011. [9] K. Hilpert, D. Das, M. Miller, D. H. Peck, and R. Weiss, J. Electrochem. Soc., 143
(1996), 3642. [10] Y. Matsuzaki and I. Yasuda, J. Electrochem. Soc., 148 (2001), A126.