high-tech services to companies in the city: therise of the modern economy in brazil
TRANSCRIPT

High-tech services to companies in the city: therise of the modern economy in Brazil
Ana Maria Bonomi Barufi
NEREUS – University of São Paulo, Brazil
Smart People in Smart Cities
Banská Bystrica
August 28-30, 2016

Industry-Space: the dynamics of industrial development
• R1: agriculture share in GDP is high
• R2: urbanization requires industrial development, as well as services for final consumption
• R3: breaking the middle income trap –diversification in the demand from families for services, and industrial development demands new types of services – increase industrial density, decreases manufacture/GDP, increase in commercial services/GDP.
• R4: more advanced industrial development –increased industrial density and more commercial services, while industry/GDP decreases even more. Industry invests on innovations in the service sector (IoT, big data, cloud computing, etc.) - Helper et al. (2012)
Industrial share in GPD (%) – D1
Ind
ust
rial
Den
sity
–D
2
Co
mm
ercial se
rvices share in
GD
P –
D3
R1 R2
R3R4
Source: Arbache (2012)
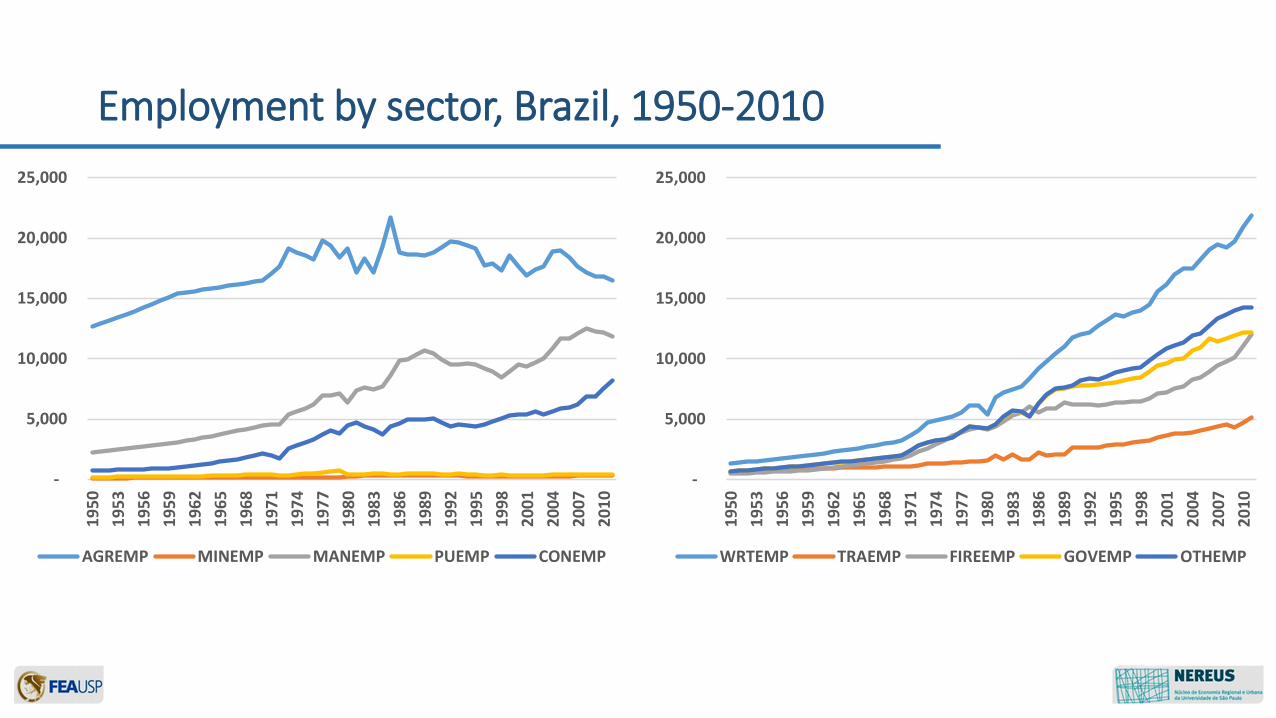
Employment by sector, Brazil, 1950-2010
-
5,000
10,000
15,000
20,000
25,000
19
50
19
53
19
56
19
59
19
62
19
65
19
68
19
71
19
74
19
77
19
80
19
83
19
86
19
89
19
92
19
95
19
98
20
01
20
04
20
07
20
10
WRTEMP TRAEMP FIREEMP GOVEMP OTHEMP
-
5,000
10,000
15,000
20,000
25,000
19
50
19
53
19
56
19
59
19
62
19
65
19
68
19
71
19
74
19
77
19
80
19
83
19
86
19
89
19
92
19
95
19
98
20
01
20
04
20
07
20
10
AGREMP MINEMP MANEMP PUEMP CONEMP

% Employment by sector, Brazil, 1950-2010
0.0%
10.0%
20.0%
30.0%
40.0%
50.0%
60.0%
70.0%
19
50
19
53
19
56
19
59
19
62
19
65
19
68
19
71
19
74
19
77
19
80
19
83
19
86
19
89
19
92
19
95
19
98
20
01
20
04
20
07
20
10
s_AGREMP s_MINEMP s_MANEMP s_PUEMP s_CONEMP
0.0%
5.0%
10.0%
15.0%
20.0%
25.0%
19
50
19
53
19
56
19
59
19
62
19
65
19
68
19
71
19
74
19
77
19
80
19
83
19
86
19
89
19
92
19
95
19
98
20
01
20
04
20
07
20
10
s_WRTEMP s_TRAEMP s_FIREEMP s_GOVEMP s_OTHEMP

• Services may reduce costs and/or add value to manufacturing
• Services in Brazil have one of the highest shares in the economy in the developing world – close to developed economies, but with a different composition
Development paths
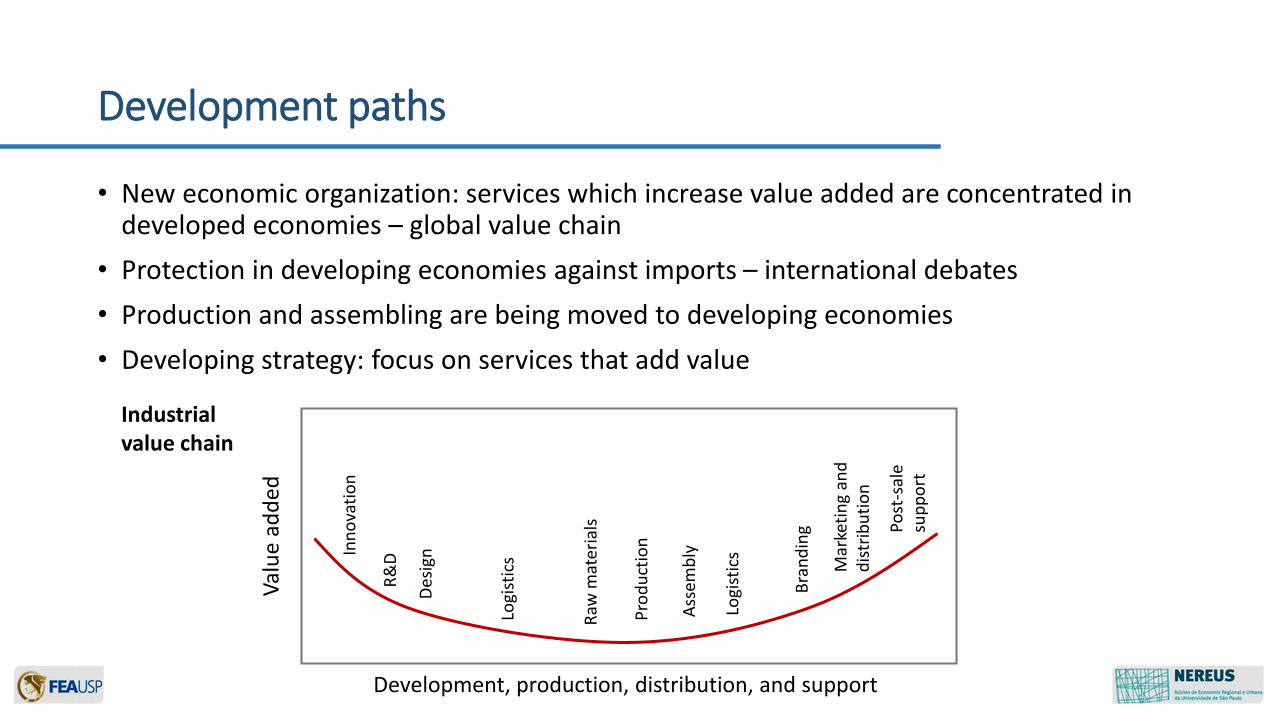
• New economic organization: services which increase value added are concentrated in developed economies – global value chain
• Protection in developing economies against imports – international debates
• Production and assembling are being moved to developing economies
• Developing strategy: focus on services that add value
Development paths
Inn
ova
tio
n
Development, production, distribution, and support
Val
ue
add
ed
R&
D
Des
ign
Logi
stic
s
Raw
mat
eria
ls
Pro
du
ctio
n
Ass
emb
ly
Logi
stic
s
Bra
nd
ing
Mar
keti
ng
and
d
istr
ibu
tio
n
Post
-sal
e su
pp
ort
Industrial value chain
• Opportunity-motivated entrepreneurship tends to flourish in urban regions with high levels of economic growth and diversity of economic activities (Bosma and Sternberg, 2014)
• High growth firms tend to be favoured by different factors than firms in general (Li et al., 2015)
• ICT firms co-locate and benefit from knowledge spillovers (Lasch et al., 2011)
Empirical Literature
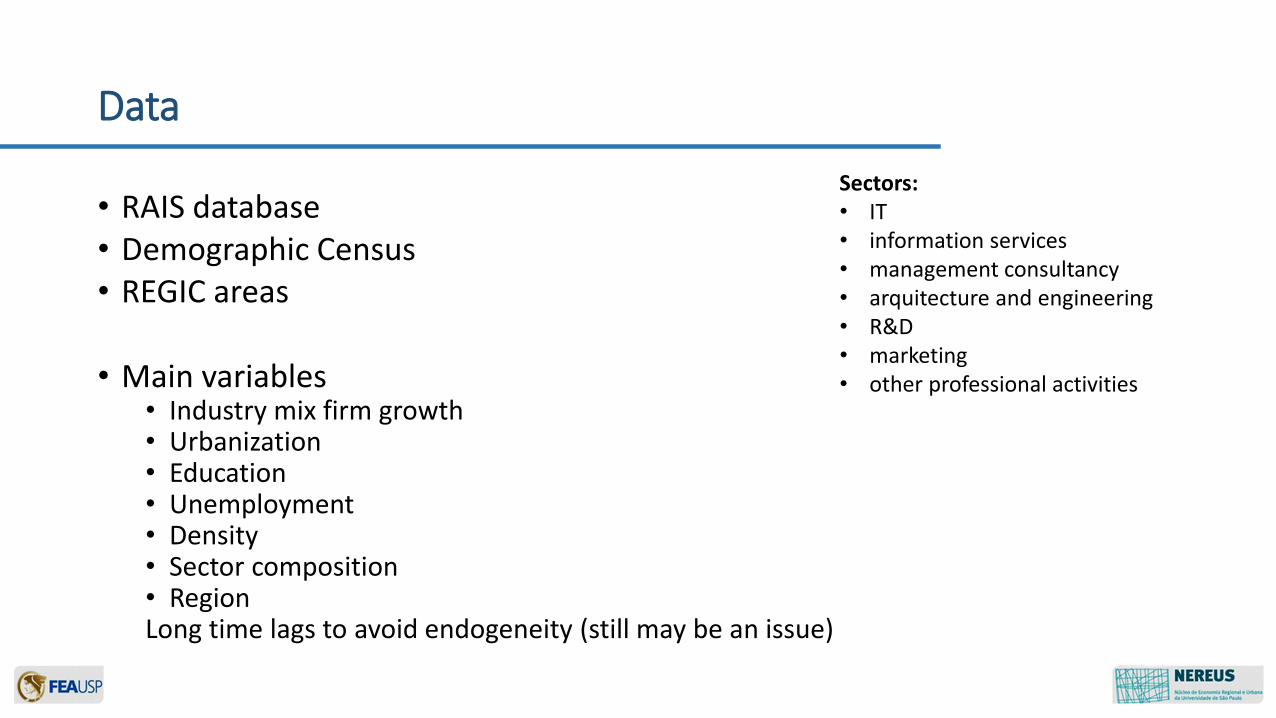
Data
• RAIS database• Demographic Census• REGIC areas
• Main variables• Industry mix firm growth• Urbanization• Education• Unemployment• Density• Sector composition• RegionLong time lags to avoid endogeneity (still may be an issue)
Sectors: • IT• information services• management consultancy• arquitecture and engineering• R&D• marketing• other professional activities
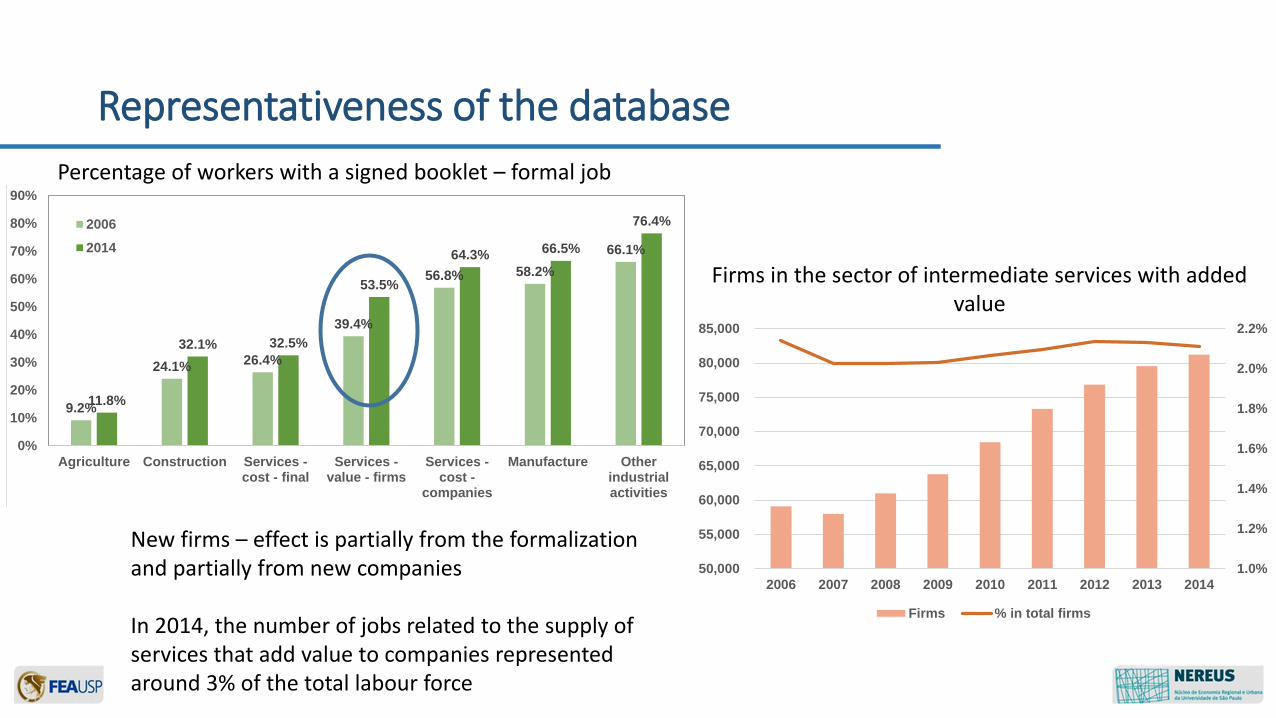
Representativeness of the database
9.2%
24.1%26.4%
39.4%
56.8% 58.2%
66.1%
11.8%
32.1% 32.5%
53.5%
64.3%66.5%
76.4%
0%
10%
20%
30%
40%
50%
60%
70%
80%
90%
Agriculture Construction Services -cost - final
Services -value - firms
Services -cost -
companies
Manufacture Otherindustrialactivities
Título do Gráfico
2006
2014
Percentage of workers with a signed booklet – formal job
New firms – effect is partially from the formalization and partially from new companies
In 2014, the number of jobs related to the supply of services that add value to companies represented around 3% of the total labour force
1.0%
1.2%
1.4%
1.6%
1.8%
2.0%
2.2%
50,000
55,000
60,000
65,000
70,000
75,000
80,000
85,000
2006 2007 2008 2009 2010 2011 2012 2013 2014
Firms % in total firms
Firms in the sector of intermediate services with added value

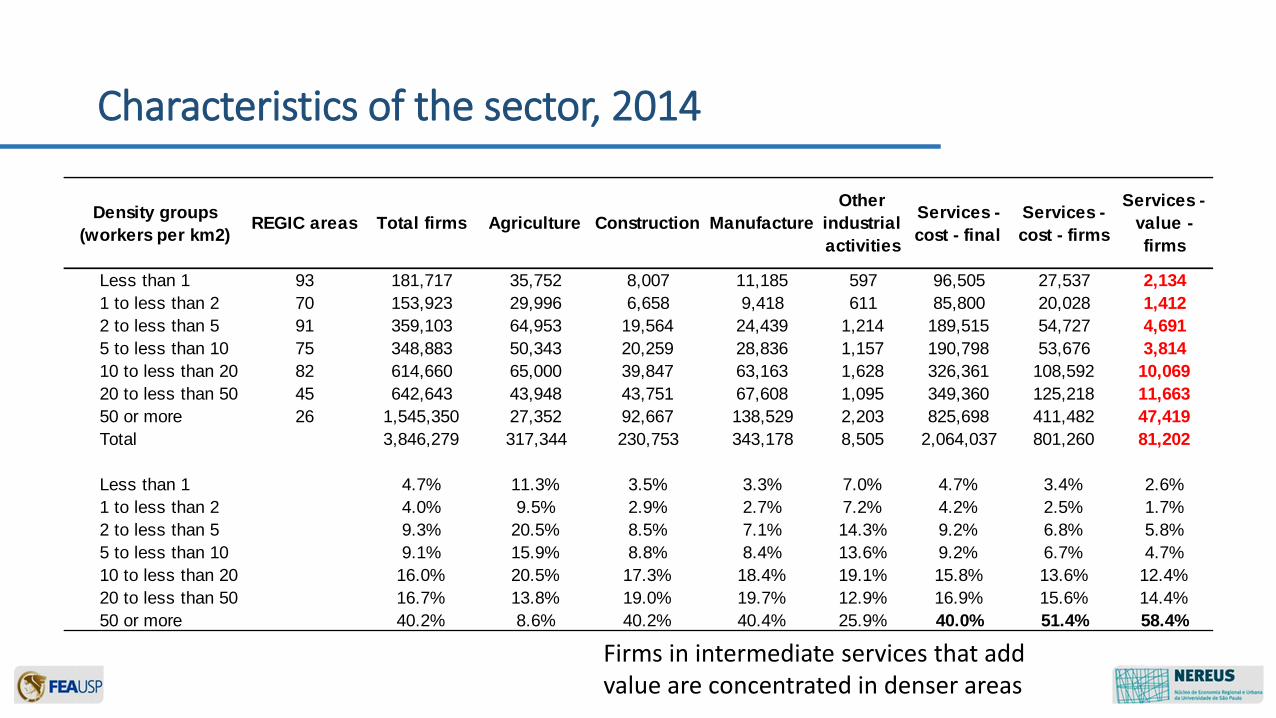
Characteristics of the sector, 2014
Firms in intermediate services that add value employ more educated workers
3.1%
5.3%
9.5%
14.5%
21.3%
25.3%
38.4%
0.0% 10.0% 20.0% 30.0% 40.0% 50.0%
Agriculture
Construction
Manufacture
Services - cost - companies
Other industrial activities
Services - cost - final
Services - value - firms
% with bachelor
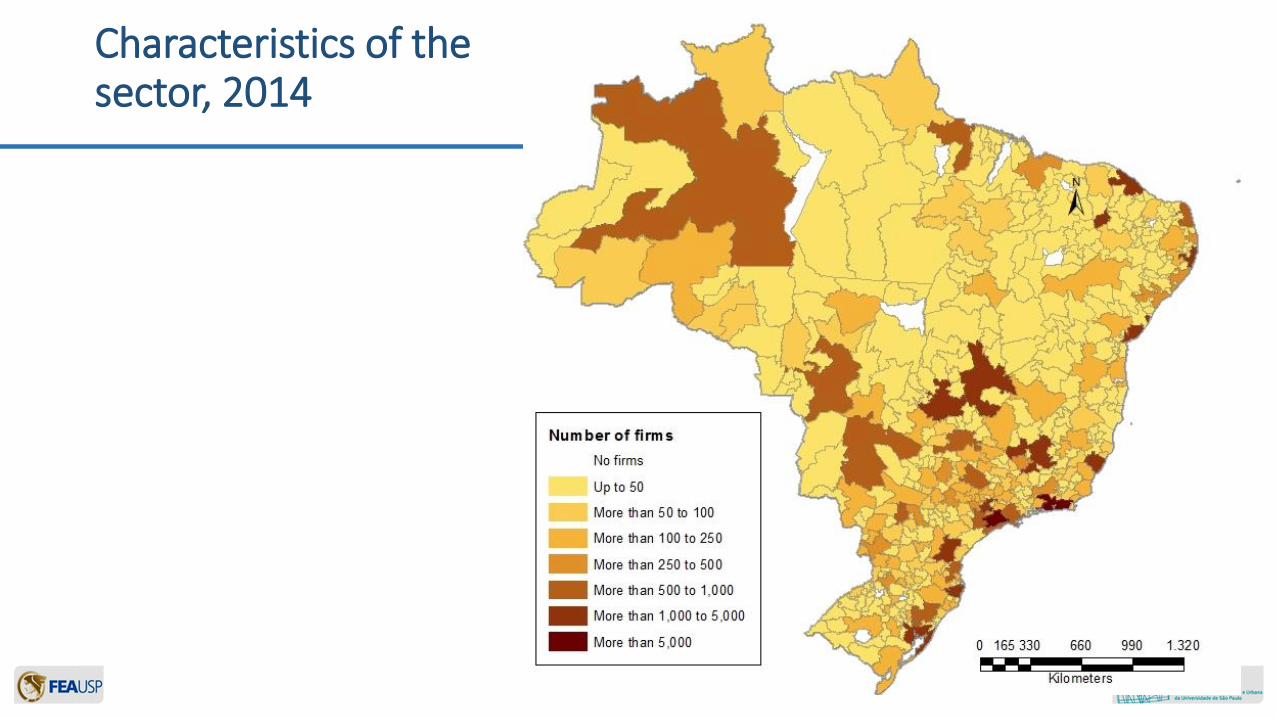
Characteristics of the sector, 2014
Firms in intermediate services that add value are concentrated in denser areas
Density groups
(workers per km2)REGIC areas Total firms Agriculture Construction Manufacture
Other
industrial
activities
Services -
cost - final
Services -
cost - firms
Services -
value -
firms
Less than 1 93 181,717 35,752 8,007 11,185 597 96,505 27,537 2,134
1 to less than 2 70 153,923 29,996 6,658 9,418 611 85,800 20,028 1,412
2 to less than 5 91 359,103 64,953 19,564 24,439 1,214 189,515 54,727 4,691
5 to less than 10 75 348,883 50,343 20,259 28,836 1,157 190,798 53,676 3,814
10 to less than 20 82 614,660 65,000 39,847 63,163 1,628 326,361 108,592 10,069
20 to less than 50 45 642,643 43,948 43,751 67,608 1,095 349,360 125,218 11,663
50 or more 26 1,545,350 27,352 92,667 138,529 2,203 825,698 411,482 47,419
Total 3,846,279 317,344 230,753 343,178 8,505 2,064,037 801,260 81,202
Less than 1 4.7% 11.3% 3.5% 3.3% 7.0% 4.7% 3.4% 2.6%
1 to less than 2 4.0% 9.5% 2.9% 2.7% 7.2% 4.2% 2.5% 1.7%
2 to less than 5 9.3% 20.5% 8.5% 7.1% 14.3% 9.2% 6.8% 5.8%
5 to less than 10 9.1% 15.9% 8.8% 8.4% 13.6% 9.2% 6.7% 4.7%
10 to less than 20 16.0% 20.5% 17.3% 18.4% 19.1% 15.8% 13.6% 12.4%
20 to less than 50 16.7% 13.8% 19.0% 19.7% 12.9% 16.9% 15.6% 14.4%
50 or more 40.2% 8.6% 40.2% 40.4% 25.9% 40.0% 51.4% 58.4%
Characteristics of the sector, 2014

Characteristics of the sector, 2014
Firms in intermediate services that add value are concentrated in denser areas

Constant 0.288*** 0.623 5.985*** 0.598 -2.966** 2.127
Unemployment rate 2000 0.352 4.035** 3.606** 1.905 -4.256 -4.613
% Bachelor (25 or more) 2000 2.048*** 18.155*** 15.868*** 5.298*** 30.979*** 24.488***
% Urban population 2000 -0.183 0.656 0.665 -1.152** 3.290** 4.120**
% Firms of interm. services value added 2006 21.018*** 101.270*** 62.787*** 28.483*** 113.083*** 77.206***
% Firms in manufacturing 2006 0.187 2.728** 1.945* 0.884 2.979 1.659
% Firms in other services 2006 -0.004 -0.400 -0.522 0.032 3.832** 3.137**
Density (formal employment 2005)
Less than 1 (reference)
1 to less than 2 0.069** 0.397** 0.234*
2 to less than 5 0.067** 0.496*** 0.363***
5 to less than 10 0.138*** 0.611*** 0.382**
10 to less than 20 0.165*** 0.739*** 0.473** 0.000 0.000 0.000
20 to less than 50 0.268*** 0.575* 0.246 0.054 -0.577** -0.608**
50 or more 0.409*** 1.286*** 0.944*** 0.110 -0.622* -0.629*
Macro-region dummies Yes Yes Yes Yes Yes Yes
N 482 471 471 101 101 101
Adj R-squared 0.641 0.662 0.586 0.651 0.768 0.690
Only REGIC with density >= 10
LQ
services
value
added
Firms
value
added
All firms
LQ
services
value
added
Firms
value
added
All firmsPreliminary results
Results
• Many firms locate in state capitals
• Firms locate in places with originally better conditions for productivity
• Denser places
• Education and pre-existing firms attract them more
Future steps
• Narrow down to the firm level – relocation, new firms, employment growth
• Within the city – what are the additional impacts of this sector? Are there effects in productivity at the neighbourhood?

Thank you ;)