high stocks of soil organic carbon in north american
TRANSCRIPT

High stocks of soil organic carbon in North American Arctic
region
Chien-Lu Ping*1, Gary J. Michaelson1, Mark T. Jorgenson2, John M. Kimble3, Howard
Epstein4, Vladimir E. Romanovsky5, & Donald A. Walker6
1Agriculture and Forestry Experiment Station, University of Alaska Fairbanks, 533 E.
Fireweed, Palmer Alaska 99645, USA, 2Alaska Biological Research, Box 80410
Fairbanks, Alaska 99708, USA, 3151 East Hill Church Road, Addison, NY 14801, USA,
4Department of Environmental Sciences, University of Virginia, P.O. Box 400123
Charlottesville, Virginia 22904, 5Goephysical Institute, University of Alaska Fairbanks,
P.O. Box 755780 Fairbanks, Alaska 99775, 6Institute of Arctic Biology, University of
Alaska Fairbanks, P.O. Box 757000 Fairbanks, Alaska 99775.
*Correspondence and requests for materials should be addressed to C.L. Ping
Agriculture and Forestry Experiment Station, University of Alaska Fairbanks, 533 E.
Fireweed, Palmer Alaska 99645, USA. Email: [email protected].
ABSTRACT
The Arctic soil organic carbon (SOC) pool is important but poorly defined. The
most cited pool size estimates are based on one study that uses 48 North American
soils of which only 5 are actually in the Arctic1. Three of these 5 are in the colder
high arctic not representative of soils across Arctic North America. Soil map-based
pool estimates2 rely on subarctic soils to project the Arctic. In all of these studies soil

sampling to depth and direct measurements are lacking. We studied 139 soils from
different landscape units of the North American Arctic to a 1 meter depth and
found SOC stores in mountains, glacier-scoured rubbleland, hilly upland, and
lowland to average 3.8, 3.4, 40.6, and 55.1kgSOCm-2 respectively. When projecting
our data to the North American Arctic based on the landscape units we found a pool
size of 98.2 Gt with a higher average SOC store of 34.8kgSOCm-2 compared to the
previous estimate of 21.8kgSOCm-2 from a life-zone based study1. We also detail
SOC spatial distribution with depth that has not previously been available but will
be important for climate warming studies.
The Arctic occupies about 13% of the land area and is estimated to hold about 14% of the
soil organic carbon pool (SOC)1. This widely cited estimate is from the 1982 study of
SOC in the world’s life zones1 and is for the entire tundra life zone but is commonly cited
for the estimation of Arctic SOC pools. In this study the tundra regions were represented
by an average value of 21.8 kg m-2 SOC for an area of 8.8x10¹²m2. A comparison of the 48
tundra data points used in the Post et al. study1 with the current Circumpolar Arctic
Vegetation Map (CAVM)2 reveals that only 5 of the 48 points for the North American
tundra are in the Arctic as defined by the CAVM (area: 5.05x10¹²m2, defined as treeless
arctic area). Three of those five points are in the High Arctic at one location. However the
CAVM study revealed strong a bioclimatic gradient in the Arctic with large increases in
biomass production (organic carbon) on soils from the High Arctic to the Low Arctic.
Other frequently cited studies of Arctic tundra soils find values ranging from 20 kg m-2 to

29 kg m-2 SOC3,4,5,6 and include either only the upper 20 to 40cm of soil or values
estimated to100 cm. All of these studies rely heavily on the use of data to less than 1
meter depth and estimated bulk density (BD) values. The Chapin et al.3 and Oechel
studies4 used only one Alaska site with limited depth and the Stolbovoi study5 of Russian
Arctic SOC used estimated BD, depth and SOC contents. Tarnocai et al 2 measured SOC
stored in soils of Arctic Canada mostly using points estimated to a meter depth and using
drill cores from one area for projecting bulk density and SOC measurements for other
areas. These studies having offered the only available data are of necessity cited
repeatedly in the literature even though soils of the Arctic were known to contain
considerable carbon at depths up to a meter or more due to cryoturbation6,7.
Patterned ground features, caused by frost cracking and heave, are prominent on the
circum-arctic landscape8,9. These features include sorted and nonsorted circles, stripes,
desiccation polygons and ice wedge polygons8. Associated with these features arctic
tundra soils show strong evidence of cryoturbation that is characterized by warped,
broken and distorted soil horizons and surface organic matter being churned down to the
lower active layers and upper permafrost7,10. Recently, there have been many studies
assessing SOC in relation to global change, studies such as SOC temperature sensitivity11,
global SOC distrubution12 and carbon emission stabilization assessments14. These regional
and global SOC assessments all must continue to use the average value of 21.8 kg m-2 for
Arctic SOC stores, an estimate that ignores a significant part of the cryoturbated SOC10.
However, current studies in the Arctic have pointed to the importance of this deeper soil

profile OC and its potential for effecting and being affected by climate change14,15. There
are several lines of evidence pointing to the importance of these SOC-stores as they are
affected by warming temperatures such as the wide-spread warming of the upper
permafrost in the Arctic16,17and efflux of up to 80% of the seasonal C-flux from tundra
soils during the cold-season when the OC rich subsoils are the warmest of the soil
profile14,15.
Our study takes a systematic approach to examine and assess the SOC pools of arctic
soils in order to minimize the uncertainties in both SOC profile depth and regional
distribution that is associated with previously data. First we selected North American
study sites from different landscape units of the Circumpolar Arctic Vegetation Map
(CAVM)18 (Figure 1). Secondly, we examined soils across the complete cycle of pattern
ground expression to a 1 meter or more depth at each site using the state of the art
techniques to describe and sample the cryoturbated soil profiles including direct
measurement of soil bulk density, moisture/ice content, and thicknesses of warped
(cryoturbated) horizon profiles19,20. Thirdly, we incorporated published Canadian data
that was obtained using comparable methods7. Our objective in the employment of these
three quality-control components in data collection is to give North American Arctic SOC
store estimates that are for the first time based on measured data points all from the
Arctic representing soils to depths that are likely to be affected by climate change. We do
this for a defined Arctic region (treeless Arctic)18 a region with the best current
information on vegetative cover communities.

RESULTS AND DISCUSSION
SOC depth distribution
The presence, form and abundance of patterned ground plays a key role in determining
tundra vegetation21,22, the morphology and properties of cryogenic soils10,23 and the
dynamics and sequestration of carbon9,24,25. In the Arctic much of the movement of SOC
from the surface to depth is accomplished through cryoturbation25. This movement is
caused by cracking due to soil freeze-thaw cycles and by soil hydrothermal gradients that
produce differential frost heave26. Nonsorted circles are a common form of patterned
ground in the hilly uplands and lowlands of the Middle and Low Arctic while polygonal
cracking and striping patterns are common in the hilly uplands of the High Arctic21,23.
Although based on surface observations, the influence of nonsorted circles appears to
decrease from the north to south we found nonsorted circles were also common in the
hilly uplands and lowlands of the Low Arctic, but with their surface appearance masked
by vegetation. The SOC in a typical soil profile under a nonsorted circle is unevenly
mixed and distributed in recognizable masses (cryotubated soil horizons, see
supplementary figure) within the active layer and upper permafrost7,10. Chunks of surface
organic matter, even whole-plant tussocks, were found subducted along the bowl-shaped
depressions of the permafrost table surface under nonsorted circles. Our research
indicates that most cryoturbated SOC occurs within the depths of 60–100 cm on hilly
upland and 80-120 cm in lowland tundra, 83% and 73% respectively of SOC in the

subsurface active layer and permafrost combined (Table 1 and supplementary data set).
The reason seems to be that the subduction of surface generated SOC goes to the top of
the contemporary permafrost table and over the century time-scale the top of the
permafrost can fluctuate on the order of tens of centimeters and sequester subducted
SOC.
We found average SOC stocks for landscape units varied widely across the Arctic (Table
1), Lowland and upland landscape soils contain higher SOC stores of on average over 10
times those of rubble and mountain soils. Although the range of SOC stores overlapped
for the lowland and upland sites, the lowlands tended to average the highest with a larger
percentage of their stores in the permafrost than the upland sites, 47% and 37%
respectively. However, the upland landscape had on average greater SOC stores in the
subsurface active layer, 45% of SOC compared to 26% in lowlands. These distribution
patterns are consistent with what could be expected with different landscape processes
affecting SOC accumulation. Lowlands tend to be wet and build up organic layers with
relatively limited mixing but permafrost table moving up over time to include layers of
organics. Uplands on the other hand must accumulate organics that are in turn subject to
erosion and slope processes each respectively removing and mixing organic layers from
and into the active layer. The climate gradient across the Arctic has a strong effect on the
biologically-dependant accumulation of SOC. This can be seen when the data are grouped
by bioclimatic subzones18 within landscape types (lowland and upland, Figure 2).
Lowland and upland units contained highest stores but the SOC stores for the High Arctic
subzones (A and B) sites were distinctly lower than for the Low Arctic (subzones D-E)

sites. However each landscape unit exhibited a different pattern in SOC moving from
north to south (subzones C to E). While upland SOC increased with warmer bioclimatic
subzone, lowland SOC was highest in subzone C and decreased in the south. This is due
to the combination of high accumulation on the wetter lowland surfaces and permafrost
preservation of cryoturbated SOC in lower layers (Table 1). The upland SOC pattern
follows that of increased surface biomass production that follows increases in annual
temperatures21 and increased cryoturbation preservation (permafrost stores) of SOC
moving southward through the Arctic. We found overall average Arctic SOC stores based
on soil area (Table 1) to be 34.8 kgSOC m-2 that is higher than reported by previous
investigations.1,2,3,4 that range from 20 to 29 kgSOC m-2. We attribute this largely to the
measurement method differences mentioned earlier including actual measurement of SOC
to 1 meter depth (into the permafrost) and use of only soils data points actually from the
arctic region. This is in contrast with previous methods that included the estimation of
deeper SOC and translation of soil data and soil classification units from the subarctic
over to the Arctic. Dependence on Subarctic SOC stores for estimating Arctic stores
could be expected to lower overall estimates due to the lower stocks in soils there relative
to the Arctic region1,27. Estimation of permafrost stores using subarctic profiles could
have the same effect as cryoturbation is less in the subarctic with more surface vegetation
for insulation causing reduced influence of cryoturbation21,27. The average SOC store
estimate for the active layer alone is 21.7 kgOC m-2 (Table 1) an amount closer to the
previous estimates for whole soil to 1 meter (21.8 and 28.5 kgOC m-2)1,2 . There is a
strong gradient effect of latitude on climate and hence biology and biotically-fixed carbon

(biomass production) across the Arctic21. That effect can be seen when SOC data is
averaged by bioclimatic subzones18 within landscape units (Figure 2). It is likely that this
effect environmental gradient is responsible for the wide range of SOC stock values
observed for landscape unit averages (Table 1). A similar or even greater gradient could be
expected for averages by soil classification units2 across the combined Arctic and
Subarctic.
SOC pools of the North American Arctic
We assigned measured Arctic SOC data to the CAVM landscape units18 they represent,
averaged them by unit (data in Table 1) and projected SOC pool size using the area of the
North American Arctic (Canada plus the U.S.) from CAVM18 (Table 2). We estimate the
North American Arctic SOC pool size to be 98.2 Gt, with 19.2, 42.1 and 36.9 Gt in the
surface organic enriched layer, the subsurface active-layer and the permafrost
respectively. The only other previous comparable published estimate that found in the
literature is considerably lower at 43 Gt SOC for the Canadian treeless Arctic2. Excluding
the U.S Arctic portion in our estimate, our Canadian Arctic pool estimate would be 76 Gt
SOC (of the 98 Gt total North American pool) a value over 75% higher. Again the higher
ground stock estimates in Table 1 are responsible for this increase, and we attribute that
largely to the use of measured soils to 1 meter and the use of only Arctic soils as opposed
to use of projected depth data and subarctic study sites in the previous estimate.
The distribution of the Arctic SOC pool with regard to the surface, active layer and
permafrost has not been evaluated before but is very relevant in assessing changes that

will occur across the Arctic system14. Were SOC is located in the soil profile is especially
relevant and useful to climate warming assessments that need to evaluate effects on
separate soil processes that vary with temperature and depth throughout the whole
annual cycle of seasons14. In lieu of any additional Arctic data, our estimates are based on
the best available to date. The range and standard deviation of SOC data for each subzone
given in Table 1 can provide an idea of the variability found for the landscapes and
deviations are similar to those found by others1,2. As presented in Figure 2 our data may
be reassessed in different ways to account for Arctic climate gradation and the similar
gradations in climate change that may occur. In light of recent studies emphasizing the
importance of deeper carbon and the whole season carbon dynamics, we provide the first
all-points-measured data based estimate for deeper profile SOC stocks across Arctic
North America. It seems that there is a similar lack of to-depth measured Arctic soil data
points for the Eurasian Arctic5 and estimates there are as could be expected, similar in
magnitude to the Canadian data2. Eurasian estimates are derived in a similar method to the
Canadian ones, from soil class unit averages of largely Subarctic with a few Arctic data
points. They also are mainly estimated to depth using Subarctic data to generalize for the
region. It has been shown that warming trends for the permafrost are similar in Eurasia
and North America but that there are differences in the magnitude of warming between the
Subarctic and Arctic regions16,17, yet the available pool estimates are averaging Arctic and
Subarctic with data largely projected and from the Subarctic. There are strong similarities
in circumarctic vegetation9,18, landscapes and landform28 and soil forming factors29. With
these known similarities it is reasonable to assume that in the future more systematic

investigation of circumarctic soils will also find SOC stores higher than current estimates
and similar to those we found for the North American Arctic. Such a wide difference in
range of estimates combined with the recently recognized importance of deeper SOC in C-
flux from tundra under changing climate should be incentive to better delineate the SOC
stocks of the entire circumarctic region.
METHODS
In this study a total of 117 soils pits were excavated from the Seward Penninsula, Alaska
in the west and foothills of the Brooks Range to the Archipelago of the Canadian Arctic
between 1993 and 2006. Soil organic carbon data were included from 22 Arctic Canada
sites7 across the eastern-central Arctic, data points obtained with similar data collection
methods for a total of 139 study soils. The carbon stocks were calculated based on soils
profile excavated across the whole cycle of predominate surface patterns where present
(such as from the center of a nonsorted circle to the area in between the circles, or inter-
circle). Excavations were to a meter depth and SOC expressed as kgOCm-2. For soils with
highly cryoturbated, broken and warped horizons, thicknesses were calculated by the
relative proportion of each horizon in an exposed meter square profile and for all soil
horizons soil bulk density (block, core or clods samples) and organic carbon content were
measured19. Sampling sites were selected to cover all the landscape units in the Arctic
North America; lowlands (plain), uplands (hilly), rubblelands (including glacial-scoured
bedrock), and mountains according to CAVM2. The OC stocks of 0 kgSOC m-2 were
assigned for areas covered by lakes, glaciers and ice fields. Soil ice and rock fragment

contents measured were used to correct volumetric measurements. The boundary of the
upper permafrost was identified by cryogenic and ice structures30. Soil organic carbon
was measured on samples treated with HCl to remove inorganic carbon then determined
on LECO CHN analyzer.
REFERENCES
1. Post, M.W. Emanuel, W.R. Zinke, P.J. & Stangenberger, G. Soil carbon pools and
world life zones. Nature 298, 156–159 (1982).
2. Tarnocai, C. Carbon pools in soils of the Arctic, Subarctic, and Boreal regions of
Canada. p91-103. In Global Climate Change and Cold Regions Ecosystems, Adv. In Soil
Sci. (Lal, R., Kimble, J.M., and Stewart, B.A. eds.) (Lewis Publishers, 2002)
3. Chapin III, F.S. Miller, P.C. Billings, W.D.& Coyne, P.I. Carbon and nutrient
budgets and their control in coastal tundra. p458-486. In Brown, J., Miller, P. C.,
Tieszen, L. L. and Bunnnell, F.L. (eds.), An Arctic ecosystem: The coastal Tundra at
Barrow, Alaska. (Stroudsburg, Penn.: Dowden, Hutchison and Ross, 1980).
4. Oechel, W.C. & Billings, W.D. Effects of global change on the carbon balance of
arctic plants and ecosystems. p.139-168. In Chapin F. S., III, Jefferies, R.L., Reynold, J.
F., Shaver, G. R. and Svoboda J. (eds.), Arctic Ecosystems in a Changing Climate.
(Academic Press, San Diego, 1992).
5. Stolbovoi, V. Carbon in Russian soils. Climatic Change, 55:131-156 (2002).
6. Douglas, L.A. & Tedrow, J.C.F. Tundra soils of arctic Alaska. Transactions of the
7th International Congress on Soil Science 4, 291-304 (1960).

7. Tarnocai, C. & Smith, C.A.S. The formation and properties of soils in the permafrost
regions of Canada. p. 21-42. In: Proc. Of the 1st International Conference on
Cryopedology ( Russian Academic of Sciences, Pushchino, Russia, 1992).
8. French, H.M. The periglacial environment 2nd ed., (Longman, White Plains, N. Y.,
1996).
9. Chernov, Y.I, & Matveyeva, N.V. Arctic ecosystems of Russia. p361-506. In:
Ecosystems of the World, Polar and Alpine Tundra (Wielgolaski, F.E. ed.)(Elsevier, 1997).
10. Ping, C.L. Bockheim, J.B. Kimble, J.M. Michaelson, G.J. & Walker, D.A.
Characteristics of cryogenic soils along a latitudinal transect in arctic Alaska, J. of
Geophysical Res. 103(D22), 28,917-28,928 (1998).
11. Davidson, E.A. & Janssens, I.A. Temperature sensitivity of soil carbon
decomposition and feedbacks to climate change, Nature. 440,165-173 /9 March (2006).
12. Jobbagy, E.G. & Jackson, R.B. the vertical distribution of soil organic carbon and its
relation to climate and vegetation. Ecol. Appl. 10, 423-436 (2000).
13. Jones, C. et al. Global climate change and soil carbon stocks; predictions from two
contrasting models for the turnover of organic carbon in soil. Glob. Change Biol. 11, 154-
166 (2005).
14. Sturm, M. Schimel, J. Michaelson, G. Welker, J. Oberbauer, S.F. Liston, G.
Fahnestock, J. & Romanovsky, V.E. The Role of Winter Biological Processes in
Converting Arctic Tundra to Shrubland, Bioscience 55(1), 17-26 (2005).
15. Hobbie, S.E. et al. Controls over carbon storage and turnover in high-latitude soils.
Global Change Biol. 6(1), 196-210 (2000).

16. Romanovsky, V. E., Shender, N. I., Sazonova, T. S., Balobaev, V. T., Tipenko, G. S.
& Rusakov, V. G., Permafrost Temperatures in Alaska and East Siberia: Past, Present and
Future, in: Proceedings of the Second Russian Conference on Geocryology (Permafrost
Science), Moscow, June 6-8, pp. 301-314, 2001.
17. Osterkamp, T.E. & Jorgenson, J.C., Warming of Permafrost in the Arctic National
Wildlife Refuge, Alaska. Permafrost and Periglacial Proc. 17:65-69, (2006).
18. Walker, D.A. Raynolds, M. Daniels, D.J.A. et al. The circumpolar vegetation map.
Journal of Vegetation Science 16,267-282 (2005).
19. Kimble, J.M., Tarnocai, C., Ping, C.L., Ahrens, R., Smith C.A.S., Moore, J. & Lynn,
W. Determination of the amount of carbon in highly cryoturbated soils. p277-291, In:
Proceedings of the Joint Russian-American Seminar on Cryopedology and Global
Change. (Gilichinsky, D.A. ed.) (Russian Acad. Of Sci., Inst. of Soil Sci. and
Photosynth., 1993).
20. Michaelson, G.J., Ping, C.L., Kimble, J.M. Effects of soil morphology and physical
properties on estimation of carbon storage in arctic soils. In: Assessment Methods For
Soil Carbon, Advances in Soil Science. (Lal, R., Kimble, J.M., Follet, R.F., Stewart, B.A.
eds.) (Lewis Publishers, 2001).
21. Walker, D.A. Epstein, H.E. Gould, W.A. Kelley, A.M. Kade, A.N. Knudson, J.A.
Krantz, W.B. Michaelson, G.J. Peterson, R.A. Ping, C.L. Raynolds, M.K. Romanovsky,
V.E. & Shur, Y. Frost-boil ecosystems: complex interactions between landforms, soils,
vegetation, and climate. Perma. Perigl. Proc. 15, 171-188 (2004).
22. Bliss, L.C. & Svoboda, J. Plant communities and plant production in the western

Queen Elizabeth Islands. Holarctic Ecology 7, 325-344 (1984).
23. Tedrow, J.C.F. Soil of the Polar Regions (Rutgers Univ. Press, New Brunswick, N.
J., (1974).
24. Michaelson, G.J. & Ping, C.L. Soil organic carbon and CO2 respiration at subzero
temperature in soils of arctic Alaska, J. of Geophy. Res. 108(D2), 8164,
doi:10.1029/2001JD000920 (2003).
25. Bockheim, J.G. Walker, D.A. Everett, L.R. Nelson, F.E. & Shikolmanov N.I. Soils
and cryoturbation in moist nonacidic and acidic tundra in the Kuparuk river basin arctic
Alaska, USA. Arct. Alp. Res. 30, 166-174 (1998).
26. Peterson, R.A. Walker, D.A. Romanovsky, V.E. Knudson, J.A. Raynolds, M.K. &
Krantz, W.B. A differential frost heave model: cryoturbation-vegetation interactions.
p885–890. In Permafrost: Proceedings of the Eighth International Conference on
Permafrost, Vol. 2, Phillips M, Springman SM, Arenson LU (eds). (A. A. Balkema
Publishers, Lisse, 2003).
27. Ping, C.L., G.J. Michaelson, & Kimble J.M., Carbon storage along a latitudinal
transect in Alaska, Nutrient Cycling Agroecosystems, 49, 235-242, 1997.
28. Washburn, A.L. Geocryology: A Survey of Periglacial Processes and Environments
(John Wiley and Sons, New York, 1980).
29. Goryachkin, S.V., Blume, H.P., Beyer, L., Campbell, I., Claridge, Bockheim, B.J.,
Karavaeva, N.A., Targulian, V., and Tarnocai, C. Chapter 1. Similarities and differences in
Arctic and Antarctic soil zones. p49-70. In Kimble, J. (ed.), Cryosols: Permafrost-
Affected Soils. (Springer, 2004).

30. Hoefle, C.M., C.L. Ping, and J.M. Kimble. Properties of permafrost soils on the
Northern Seward Peninsula, Northwest Alaska. Soil Sci. Soc. Am. J. 62,1629-1639
(1998).
AKNOWLEDGEMENTS
The following National Science Foundation projects contributed to this work: Arctic
Transitions in the Land-Atmosphere System, the Flux Study, Biocomplexity of the
Arctic System, and Arctic Coastal Transfer. Also significant contributions from the U.S
Dept. of Agric. Hatch Project and Global Change Initiative, and Hilmar Maier for help
with mapping data.

Figure 1 Study site locations. Colors are landscape units derived from CAVM18
some points represent several soil study sites.
Figure 2 The effect of Arctic latitudinal climate gradient on landscape stores of
SOC. The two higher SOC stores landscape units from table one are displayed,
with landscape units data averages by Bioclimatic subzone18 and display of one
standard deviation unit above and below the mean.

Lowlands
Uplands
Mountians
Rubblelands
Glaciers
Lakes
Lowlands
Uplands
Mountians
Rubblelands
Glaciers
Lakes

0
10
20
30
40
50
60
70
80
Lowland
s av
eAB C D E
Uplan
ds a
ve AB C D E
SO
C S
tore
s k
g m
-2Active Layer
Permafrost
Bioclimatic Subzones Bioclimatic Subzones
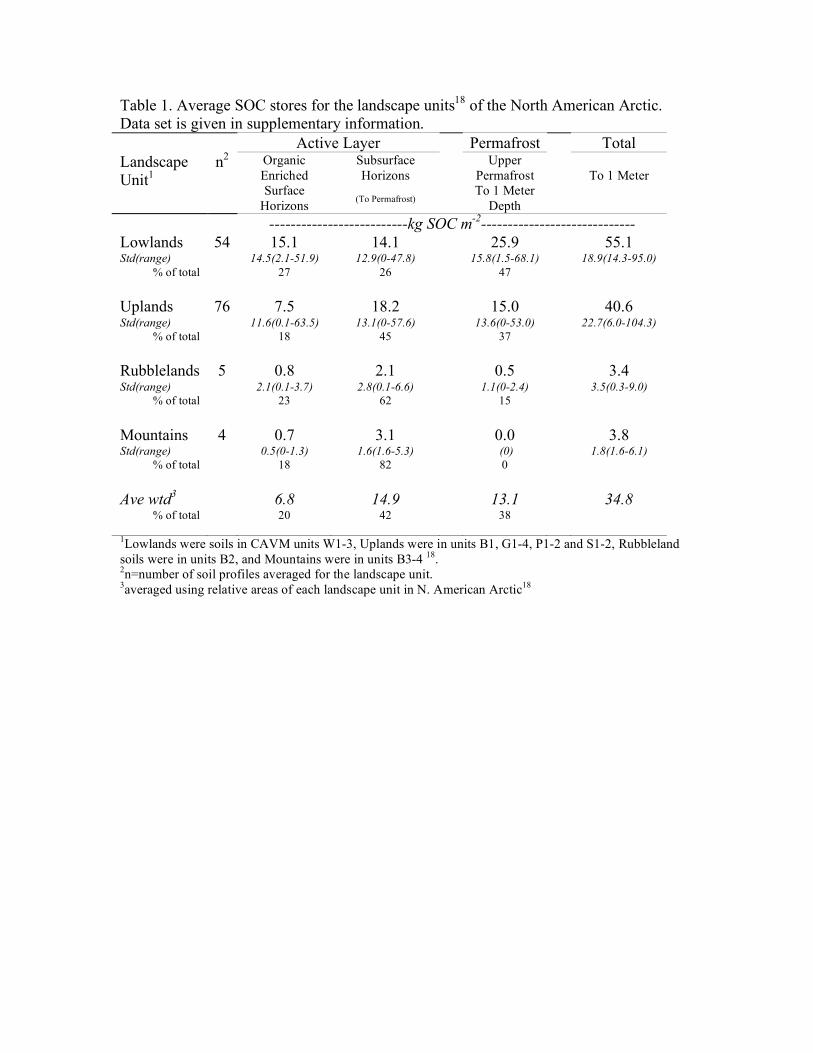
Table 1. Average SOC stores for the landscape units18 of the North American Arctic. Data set is given in supplementary information. Active Layer Permafrost Total Landscape Unit1
n2 Organic Enriched Surface
Horizons
Subsurface Horizons
(To Permafrost)
Upper Permafrost To 1 Meter
Depth
To 1 Meter
--------------------------kg SOC m-2----------------------------- Lowlands 54 15.1 14.1 25.9 55.1 Std(range) 14.5(2.1-51.9) 12.9(0-47.8) 15.8(1.5-68.1) 18.9(14.3-95.0)
% of total 27 26 47 Uplands 76 7.5 18.2 15.0 40.6 Std(range) 11.6(0.1-63.5) 13.1(0-57.6) 13.6(0-53.0) 22.7(6.0-104.3)
% of total 18 45 37 Rubblelands 5 0.8 2.1 0.5 3.4 Std(range) 2.1(0.1-3.7) 2.8(0.1-6.6) 1.1(0-2.4) 3.5(0.3-9.0)
% of total 23 62 15 Mountains 4 0.7 3.1 0.0 3.8 Std(range) 0.5(0-1.3) 1.6(1.6-5.3) (0) 1.8(1.6-6.1)
% of total 18 82 0 Ave wtd3 6.8 14.9 13.1 34.8
% of total 20 42 38 1Lowlands were soils in CAVM units W1-3, Uplands were in units B1, G1-4, P1-2 and S1-2, Rubbleland soils were in units B2, and Mountains were in units B3-4 18. 2n=number of soil profiles averaged for the landscape unit. 3averaged using relative areas of each landscape unit in N. American Arctic18

Table 2. Summary of SOC pool estimates to 1 meter depth for the North American Arctic (Canada and U.S.A.) by landscape units and respective map areas derived from CAVM18. Active Layer Permafrost Total Landscape Unit1
Map Area2 N.Amer.
(km2x103)
Organic Enriched Surface
Horizons
Subsurface Horizons
(To Permafrost)
Upper Permafrost To 1 Meter
Depth
To 1 Meter
--------------------------Gt SOC -------------------------------- Lowlands 220 3.3 3.1 5.7 12.1 Uplands 2067 15.5 37.7 31.0 84.2 Rubblelands 371 0.3 0.8 0.2 1.3 Mountains 161 0.1 0.5 0 0.6
(Sub Total) (2819) Glaciers 170 - - - - Lakes 51 - - - - TOTAL 3040 19.2 42.1 36.9 98.2 % of Total 19.6 42.9 37.5 1Lowlands were soils in CAVM18 units W1-3, Uplands were in units B1, G1-4, P1-2 and S1-2, Rubbleland soils were in units B2, and Mountains were in units B3-4. 2Taken from CAVM18.