high speed two (hs2) phase two planet framework model … · planet framework model: pfm v7.1...
TRANSCRIPT

High Speed Two (HS2) Phase Two PLANET Framework ModelPFM v7.1 Demand forecasting report
July 2017CS866_E

High Speed Two (HS2) Phase Two
PLANET Framework ModelPFM v7.1 Demand forecasting report
July 2017CS866_E

High Speed Two (HS2) Limited, Two Snowhill Snow Hill Queensway Birmingham B4 6GA
Telephone: 08081 434 434
General email enquiries: [email protected]
Website: www.gov.uk/hs2
High Speed Two (HS2) Limited has been tasked by the Department for Transport (DfT) with managing the delivery of a new national high speed rail network. It is a non-departmental public body wholly owned by the DfT.
High Speed Two (HS2) Limited has actively considered the needs of blind and partially sighted people in accessing this document. The text will be made available in full on the HS2 website. The text may be freely downloaded and translated by individuals or organisations for conversion into other accessible formats. If you have other needs in this regard, please contact High Speed Two (HS2) Limited.
© High Speed Two (HS2) Limited, 2017, except where otherwise stated.
Copyright in the typographical arrangement rests with High Speed Two (HS2) Limited.
This information is licensed under the Open Government Licence v2.0. To view this licence, visit www.nationalarchives.gov.uk/doc/open-government-licence/ version/2 or write to the Information Policy Team, The National Archives, Kew, London TW9 4DU, or e-mail: [email protected]. Where we have identified any third-party copyright information you will need to obtain permission from the copyright holders concerned.
Printed in Great Britain on paper containing at least 75% recycled fibre.

PLANET Framework model: PFM v7.1 Demand forecasting report
1
Contents
1 Introduction 2
1.1 Background 2
1.2 Note Structure 2
2 Summary of PFMv7.1 Demand Forecasts 3
3 Rail Demand Forecasting Methodology 4
3.1 Introduction 4
3.2 Updating the Second Forecast Year 4
3.3 Recorded Growth in Rail Demand Since 2014/15 7
3.4 December 2016 Demand Driver Forecasts 12
3.5 Future Year Demand Estimates 21
4 PFMv7.1 Forecast Rail Demand 22
4.1 Introduction 22
4.2 Impacts to PLANET Long Distance (PLD) Rail Demand 22
4.3 Impacts to PLANET South (PS) Forecasts 26
4.4 Impacts to PLANET Midland (PM) Forecasts 28
4.5 Impacts to PLANET North (PN) Forecasts 30
5 PFMv7.1 Forecast Highway Demand 32
5.1 Introduction 32
5.2 Future Year Highway Demand Forecasting 32
5.3 Future Year Highway Preload Flows 35
5.4 Future Year Highway Occupancy Factors 36
6 PFMv7.1 Forecast Air Demand 37
6.1 Introduction 37
6.2 Future Year Air Demand Forecasts 37
6.3 Air Supply Forecasts 39
7 Quality Assurance 41
Appendix A: Regional Variation in Impacts to PLD Rail Demand 42
Appendix B: Future Year Air Forecasts 47

PLANET Framework model: PFM v7.1 Demand forecasting report
2
1 Introduction 1.1 Background
1.1.1 The PLANET Framework Model (PFM) is the primary tool for forecasting HS2 demand and calculating the associated benefits and revenue to support the HS2 Economic Case. Since the last release of the HS2 Reference Case model (PFMv6.1c), the process of model development has continued as modelling assumptions are revised and updated.
1.1.2 One of the key inputs to the PFM are the future year demand forecasts. These are estimated for the rail mode for all sub-models, as well as the highway and air modes for the PLANET Long Distance (PLD) sub-model. Further information on the structure and modelling approach of the PFM can be found within the Model Description Report.
1.1.3 HS2 Ltd have commissioned their consultants to prepare a revised set of future year demand forecasts for use within the PFM. This report sets out the revised demand
forecasts that have been included within PFMv7.1, summarises the adopted forecasting approach, and analyses the change in demand forecasts from the previous model release.
1.2 Note Structure
1.2.1 The remainder of this note is structured as follows:
Chapter 2 - Summary of PFMv7.1 Demand Forecasts;
Chapter 4 - Rail Demand Forecasting Methodology;
Chapter 4 - PFMv7.1 Forecast Rail Demand;
Chapter 5 - PFMv7.1 Forecast Highway Demand;
Chapter 6 - PFMv7.1 Forecast Air Demand; and,
Chapter 7 - Quality Assurance.

PLANET Framework model: PFM v7.1 Demand forecasting report
3
2 Summary of PFMv7.1 Demand Forecasts Rail
2.1.1 The PFMv7.1 model release contains reforecast rail demand matrices following the release of new macro-economic and inter-modal competition demand drivers in December 2016. The revised rail demand matrices are forecast to be smaller than in the previous model release version, primarily reflecting the updates to macro-economic forecasts, though the updates to inter-modal competition factors have also been updated which also impact on rail demand.
2.1.2 In the first forecast year, total rail demand is forecast to be 2% lower than in the previous model release, whereas in the second forecast year, total rail demand is forecast to be 9% lower than the previous model release. The change in rail demand varies by journey purpose, car availability, long distance and short distance journey,
and at the disaggregate geographical level. Further detail and analysis is included in Chapter 3 and Chapter 4
Highway
2.1.3 The highway demand matrices in PFMv7.1 have been updated for the second forecast year from 2036/37 to 2037/38. The overall impact of this update is an increase in long distance highway demand of 0.6% relative to the previous model release.
2.1.4 The increase in demand reflects the additional year of forecast growth from the Base year to the second forecast year. The TEMPRO version from which highway demand growth is derived uses the same macro-economic forecasts as were used for PFMv6.1c. Further detail and analysis can be found in Chapter 5.
Air
2.1.5 In PFMv7.1, the only update to the air demand matrices has been to migrate them from a second forecast year of 2036/37 to 2037/38 in line with the change to the second forecast year for all modes. This has resulted in an increase in forecast air demand of ~2% relative to the previous model version.
2.1.6 The increase in demand reflects the additional year of forecast growth from the Base year to the second forecast year. The model from which air demand is derived uses the same macro-economic forecasts as were used for PFMv6.1c. Further detail and analysis can be found in Chapter 6.

PLANET Framework model: PFM v7.1 Demand forecasting report
4
3 Rail Demand Forecasting Methodology 3.1 Introduction
3.1.1 Rail demand forecasts are calculated using an established forecasting system which applies the mathematical framework set out in the Passenger Demand Forecasting Handbook (PDFH). This system utilises macro-economic forecasts (such as GDP and employment) and uses recent modal competition elements (such as car vehicle costs) to grow base year rail demand for the future years.
3.1.2 In this way future year rail demand depends upon both the level of base year demand and a series of demand driver generator (DDG) forecasts which are released by the Department for Transport (DfT) using the latest economic outlook and WebTAG recommendations. More information on the adopted forecasting approach can be found in the modelling suite documentation.
3.1.3 Since the release of PFMv6.1c, the previous model release, there have been several significant updates to the demand matrices which are discussed separately in this chapter:
Updated Second Forecast Year: In order to maintain the economic appraisal
approach, an appraisal window of 20 years from the point of appraisal needs to be maintained. With the point of appraisal now 2017/18, the second forecast year has also moved from 2036/37 to 2037/38;
Growth in Base Demand: The PFM currently has a Base Year of 2014/15
following the update which was incorporated into PFMv6.1c. Since 2014/15, the Office for Rail and Road (ORR) has published statistics of recorded growth
in rail demand since 2014/15. This has been incorporated into the forecasting to better represent the forecast demand; and,
Revised Demand Drivers: Revised forecasts of key demand drivers have been used to develop new demand forecasts. The revised demand drivers include macro-economic drivers (e.g. GDP and employment) as well as inter-modal factors such as vehicle operating costs.
3.1.4 These updates cumulatively have a significant impact on the forecast demand that is input to the PFM. The following sections will present the updates that have been incorporated for each of the listed updates.
3.2 Updating the Second Forecast Year
3.2.1 The economic appraisal of HS2 requires there to be a 20-year appraisal horizon over which to measure the benefits of the scheme. This is consistent with the economic appraisal approach for investments in rail infrastructure. The 20-year appraisal horizon begins at the point the economic appraisal is being conducted i.e. the present financial year. In order to maintain the 20-year economic appraisal horizon approach from the current financial year, the second forecast year required updating from 2036/37 in PFMv6.1c, to 2037/38 in PFMv7.1.
PLANET Framework model: PFM v7.1 Demand forecasting report
5
2037/38 Rail Demand
3.2.2 Forecasting rail demand for 2037/38 required the application of the same forecasting method that was used to forecast demand for PFMv6.1c. This involved using the DfT’s EDGE software and exactly the same demand drivers that were utilised for PFMv6.1c to forecast demand for 2037/38, rather than 2036/37. Further details of the methodology are contained within the PFMv6.1c Forecasting Report and the PFM Model Description Report.
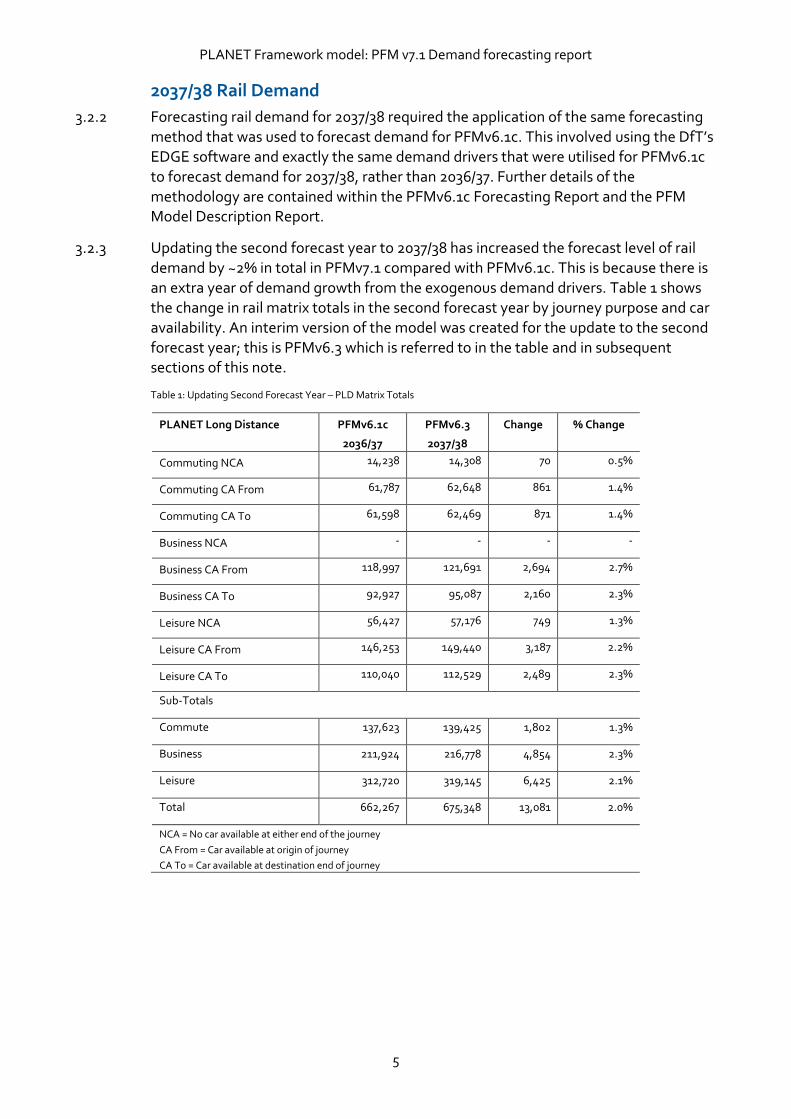
3.2.3 Updating the second forecast year to 2037/38 has increased the forecast level of rail demand by ~2% in total in PFMv7.1 compared with PFMv6.1c. This is because there is an extra year of demand growth from the exogenous demand drivers. Table 1 shows the change in rail matrix totals in the second forecast year by journey purpose and car availability. An interim version of the model was created for the update to the second forecast year; this is PFMv6.3 which is referred to in the table and in subsequent sections of this note.
Table 1: Updating Second Forecast Year – PLD Matrix Totals
PLANET Long Distance PFMv6.1c
2036/37
PFMv6.3
2037/38
Change % Change
Commuting NCA 14,238 14,308 70 0.5%
Commuting CA From 61,787 62,648 861 1.4%
Commuting CA To 61,598 62,469 871 1.4%
Business NCA - - - -
Business CA From 118,997 121,691 2,694 2.7%
Business CA To 92,927 95,087 2,160 2.3%
Leisure NCA 56,427 57,176 749 1.3%
Leisure CA From 146,253 149,440 3,187 2.2%
Leisure CA To 110,040 112,529 2,489 2.3%
Sub-Totals
Commute 137,623 139,425 1,802 1.3%
Business 211,924 216,778 4,854 2.3%
Leisure 312,720 319,145 6,425 2.1%
Total 662,267 675,348 13,081 2.0%
NCA = No car available at either end of the journey
CA From = Car available at origin of journey
CA To = Car available at destination end of journey

PLANET Framework model: PFM v7.1 Demand forecasting report
6
3.2.4 The following tables show the impact on the rail demand matrices for the regional models in the second forecast year following the updates. These tables show growth
in all regional demand matrices with varying growth across the different journey purposes.
Table 2: Updating Second Forecast Year – PS Matrix Totals
PLANET South PFMv6.1c
2036/37
PFMv6.3
2037/38
Change % Change
Business PA 262,720 269,091 6,371 2.4%
Business AP 15,967 16,274 307 1.9%
Leisure PA 273,443 279,180 5,737 2.1%
Leisure AP 29,984 30,439 455 1.5%
Commuting PA 1,907,700 1,921,560 13,860 0.7%
Commuting AP 40,983 41,237 254 0.6%
Sub-Totals
Commute 1,948,683 1,962,797 14,114 0.7%
Business 278,687 285,365 6,678 2.4%
Leisure 303,427 309,619 6,192 2.0%
Total 2,530,797 2,557,781 26,984 1.1%
PA = Production to Attraction
AP = Attraction to Production
Table 3: Updating Second Forecast Year – PM Matrix Totals
PLANET Midland PFMv6.1c
2036/37
PFMv6.3
2037/38
Change % Change
Business CA 7,006 7,155 149 2.1%
Business NCA 993 1,002 9 0.9%
Leisure CA 7,686 7,842 156 2.0%
Leisure NCA 1,111 1,120 9 0.8%
Commuting CA 75,693 76,782 1,089 1.4%
Commuting NCA 11,809 11,840 31 0.3%
Sub-Totals
Commute 87,502 88,622 1,102 1.3%
Business 7,999 8,157 158 1.9%
Leisure 8,797 8,962 165 1.9%
Total 104,298 105,741 1,443 1.4%
NCA = No car available at either end of the journey
CA From = Car available at origin of journey
CA To = Car available at destination end of journey

PLANET Framework model: PFM v7.1 Demand forecasting report
7
Table 4: Updating Second Forecast Year – PN Matrix Totals
PLANET North PFMv6.1c
2036/37
PFMv6.3
2037/38
Change % Change
Business CA 9,287 9,497 210 2.3%
Business NCA 1,588 1,610 22 1.4%
Leisure CA 15,820 16,161 341 2.2%
Leisure NCA 2,885 2,923 38 1.3%
Commuting CA 120,808 122,543 1,735 1.4%
Commuting NCA 22,778 22,900 122 0.5%
Sub-Totals
Commute 143,586 145,443 1,857 1.3%
Business 10,875 11,107 232 2.1%
Leisure 18,705 19,084 379 2.0%
Total 173,166 175,634 2,468 1.4%
NCA = No car available at either end of the journey
CA From = Car available at origin of journey
CA To = Car available at destination end of journey
3.3 Recorded Growth in Rail Demand Since 2014/15
3.3.1 PFMv6.1c released in 2016 represents a base year of 2014/15 with forecast years of 2026/27 and 2036/37. As discussed in the previous section, PFMv6.3 is an interim model version which forecasts the second future year to 2037/38.
3.3.2 In early 2016, the Base Year of PFM was updated to 2014/15 from 2010/11 and through this base year update, rail demand was increased significantly as observed demand for
rail services had been steadily rising even through the recession. To avoid such a large change in future, it was agreed to review base year demand yearly and compare against observed data to ensure that the level of demand within the PFM remained as up to date as possible.
3.3.3 The Office of Rail and Road (ORR) publishes summary rail demand statistics which is informed by the LENNON ticket sales database. The recent yearly growth in rail demand is presented in Table 5. The figures show that rail demand has grown steadily for the past two years, resulting in around a 6-7% increase in rail demand in 2016/17 from 2014/15.
Table 5: ORR Recent Rail Demand Growth
Year All Rail Demand Growth Long-Distance Rail Demand
Growth
2015/16 4% 3%
2016/17 2% 4%
2014/15 – 2016/17 6.1% 7.1%

PLANET Framework model: PFM v7.1 Demand forecasting report
8
3.3.4 In comparison, the PLD forecasts for PFMv6.3 implicitly assume the level of growth between 2014/15 and 2016/17 shown in Table 6, where the 2016/17 forecast has been calculated using the forecasting approach adopted for PFMv6.3. This shows that the PFMv6.3 is underestimating recent rail demand growth for the PLD sub-model by around a half.
Table 6: PLD Base Rail Demand Totals
2014/15 Base Year 2016/17 Forecast Change
Total PLD Demand 401,023 414,141 3%
3.3.5 In order to produce rail demand forecasts that take into account recent growth in rail
demand since the modelled Base Year, the 2014/15 Base Year demand was grown to 2016/17 levels using actual demand growth recorded by ORR prior to forecasting to the future years.
Accounting for change in car availability between 2014/15 and 2016/17
3.3.6 The rail demand for the PLD, PLANET Midlands (PM) and PLANET North (PN) sub-models are segmented by car availability, and therefore the rail demand for trips which have the use of car as an alternative mode is presented in a separate matrix from trips which do not have car as an available alternative.
3.3.7 Car availability is forecast within TEMPRO, which designates - out of the total number of households across Great Britain – the number of households which have access to a car, or number of cars; as well as those with no access to a car. This forecast over time
is used within the PDFH mathematical framework to forecast future year rail demand. Car availability generally increases over time, as more households have access to a car.
3.3.8 To reflect increased car availability over the period 2014/15 to 2016/17, demand has to be redistributed from the non-car available (NCA) matrices to the car available (CA) matrices within each sub-model. This process is used within the forecasting approach to take into account the change in car availability from the base year to the future year.
3.3.9 A matrix of factors is produced based on TEMPRO data to redistribute demand from the NCA matrices to the CA matrices. The redistribution factors calculate the proportion of households without access to a car in 2016/17 and compare this with the
same proportion in 2014/15 to derive a factor to apply to the NCA demand matrices. This factor is less than one for all segments of the PLD, PM and PN sub-models, and redistributes rail demand in the NCA matrices to the CA matrices using the following formulae:
For PM and PN, multiply the NCA matrix by the (origin) redistribution factor, and add to the CA matrix the NCA matrix multiplied by 1 minus the (origin) redistribution factor, i.e.
New CA matrix = CA matrix + NCA matrix*(1-factor)

PLANET Framework model: PFM v7.1 Demand forecasting report
9
New NCA matrix = NCA matrix*factor
For PLD, as “from home” and “to home” demand is separated, the demand matrices need to be multiplied by the average of the origin and destination redistribution factors, i.e.
New CA from = CA from + (NCA*(1-(origin factor + destination factor)/2)/2)
New CA to = CA to + (NCA*(1-(origin factor + destination factor)/2)/2)
New NCA = NCA* (origin factor + destination factor)/2
Impact on Rail Demand Matrices
3.3.10 The resulting 2016/17 rail demand used in PFMv7.1 is presented in the tables below and is compared to the 2014/15 base year rail demand.
Table 7: PLD Rail Demand 2016/17
2014/15
PFMv6 Base Demand
2016/17
PFMv7.1 Base
Demand
Change % Change
Commuting NCA 11,988 12,265 278 2%
Commuting CA From 42,438 45,205 2,767 7%
Commuting CA To 42,183 44,934 2,752 7%
Business NCA - - - 0%
Business CA From 66,805 70,814 4,008 6%
Business CA To 51,666 54,766 3,100 6%
Leisure NCA 39,229 40,195 966 2%
Leisure CA From 84,282 90,033 5,751 7%
Leisure CA To 62,432 66,872 4,440 7%
Sub-Totals
Commute 96,609 102,405 5,797 6%
Business 118,471 125,579 7,108 6%
Leisure 185,944 197,100 11,157 6%
Total 401,023 425,085 24,061 6%
NCA = No car available at either end of the journey
CA From = Car available at origin of journey
CA To = Car available at destination end of journey

PLANET Framework model: PFM v7.1 Demand forecasting report
10
Table 8: PM Rail Demand 2016/17
2014/15
PFMv6 Base Demand
2016/17
PFMv7.1 Base
Demand
Change % Change
Commuting CA 52,308 55,829 3,521 7%
Commuting NCA 9,900 10,112 212 2%
Business CA 4,305 4,592 287 7%
Business NCA 740 756 16 2%
Leisure CA 4,762 5,080 318 7%
Leisure NCA 835 853 18 2%
Sub-Totals
Commute 62,209 65,941 3,733 6%
Business 5,045 5,347 303 6%
Leisure 5,597 5,933 336 6%
Total 72,851 77,222 4,371 6%
NCA = No car available at either end of the journey
CA From = Car available at origin of journey
CA To = Car available at destination end of journey
Table 9: PN Rail Demand 2016/17
2014/15
PFMv6 Base Demand
2016/17
PFMv7.1 Base
Demand
Change % Change
Commuting CA 89,252 95,357 6,105 7%
Commuting NCA 20,530 21,012 482 2%
Business CA 5,843 6,238 395 7%
Business NCA 1,217 1,245 28 2%
Leisure CA 10,152 10,844 692 7%
Leisure NCA 2,261 2,313 53 2%
Sub-Totals
Commute 109,783 116,370 6,587 6%
Business 7,059 7,483 424 6%
Leisure 12,413 13,157 745 6%
Total 129,255 137,010 7,755 6%
NCA = No car available at either end of the journey
CA From = Car available at origin of journey
CA To = Car available at destination end of journey

PLANET Framework model: PFM v7.1 Demand forecasting report
11
Table 10: PS Rail Demand 2016/17
2014/15
PFMv6 Base Demand
2016/17
PFMv7.1 Base
Demand
Change % Change
Business PA 142,256 150,791 8,535 6%
Business AP 8,978 9,516 539 6%
Leisure PA 150,331 159,351 9,020 6%
Leisure AP 17,695 18,757 1,062 6%
Commuting PA 1,492,228 1,581,762 89,535 6%
Commuting AP 31,612 33,509 1,897 6%
Sub-Totals
Business 151,233 160,307 9,074 6%
Leisure 168,026 178,108 10,082 6%
Commute 1,523,840 1,615,271 91,431 6%
Total 1,843,099 1,953,686 110,587 6%
PA = Production to Attraction
AP = Attraction to Production
3.3.11 As can be seen in the matrix totals for PLD/PM/PN, the car availability readjustment only affects the level of rail demand within any one journey purpose, causing lower rail demand growth in the NCA matrices; and does not impact the overall level of rail demand. PS does not segment demand by car availability. At a total journey purpose
level, and hence overall, the rail demand in 2016/17 has been impacted by a uniform 6% for all PS demand segments.
3.3.12 The 2016/17 matrices have been used as a base from which to forecast future year rail demand for PFMv7.1 to 2026/27 and 2037/38.

PLANET Framework model: PFM v7.1 Demand forecasting report
12
3.4 December 2016 Demand Driver Forecasts
3.4.1 The DfT’s December 2016 DDG set includes the latest forecasts in terms of the economic outlook for the country in the short-term. This is informed by the November 2016 release of the Office for Budget Responsibility (OBR) Economic & Fiscal Outlook, which provides forecasts for GDP and employment.
3.4.2 PFMv6.3 used the July 2015 DDG set to forecast future year rail demand; and since July 2015 many of the other demand driver forecasts have also been updated to incorporate the latest assumptions. A comparison between the data used within the two sets of DDG is presented in Table 11.
Table 11: Changes to the DfT’s Demand Driver Generators (DDGs) between July 2015 and December 2016
Demand Driver July 2015 DDG Set December 2016 DDG Set Estimated Impact
Macro-Economic Demand Drivers
GDP CEBR June 2015 forecasts
constrained to:
OBR Economic & Fiscal Outlook
June 2015 up to 2018/19
OBR Fiscal Sustainability June 2015
forecast 2019/20 onwards
NOTE: this is input to the forecasting
process as GDP Per Capita using the
Population assumptions below.
CEBR October 2016 forecasts
constrained to:
OBR Economic & Fiscal Outlook
November 2016 to 2020/21.
Beyond 2020/21 short term
forecasts are extrapolated.
NOTE: this is input to the forecasting
process as GDP Per Capita using the
Population assumptions below.
Lower GDP/Capita
forecasts in December
2016 dataset.
Elasticity values up to
1.3.
Negative impact to rail
demand – largest effect
of all driver changes.
Employment NTEMv6.2 constrained to CEBR June
2015, constrained at a national level
by:
OBR Economic & Fiscal Outlook
July 2015 to 2018/19.
OBR Fiscal Sustainability July 2015
forecast 2019/20 onwards
NTEMv6.2 constrained to CEBR
October 2016 forecasts constrained
to:
OBR Economic & Fiscal Outlook
November 2016 to 2020/21.
Beyond 2020/21 short term
forecasts are extrapolated.
Growth in Employment
is forecast to be stronger
in December 2016
dataset.
Elasticity values up to
1.3. Values > 0 for
commuting trip purposes
only.
Generate more rail
demand.
Population NTEMv6.2 constrained to CEBR June
2015, constrained at a national level
by:
ONS Principle Population forecast
November 2013
NTEMv6.2 constrained to CEBR
October 2016, constrained at a
national level by:
ONS Principle Population forecast
2014 (Released November 2015) for
2015 – 2020.
After 2020 short term forecasts are
extrapolated
Small fluctuations in
population forecasts;
overall growth is slightly
stronger in December
2016.
Elasticity values of 1.
Small positive impact to
rail demand.

PLANET Framework model: PFM v7.1 Demand forecasting report
13
Modal Competition Demand Drivers
Car Cost TAG Databook November 2014 Data based on unpublished car cost
figures
Car costs will reduce
more quickly in
December 16 dataset.
Elasticity values ~0.25
Small – medium impact.
Bus Fare & Bus
Service
DfT Local Forecasts to 2039/40,
beyond 2039/40 assume no further
growth
DfT Local Forecasts to 2049/50 Bus fares will increase
more slowly in
December 2016 dataset.
Elasticity values ~ 0.2
Small – medium impact.
London
Underground Fares
RPI+1% for all years except 2014 –
2016
RPI+0% 2014 – 2016, RPI+1% all
other years. Nominal freeze applied
2017 – 2020
Lower LU fares growth in
December 2016 dataset.
Elasticity values >0 for
trips within London (PS).
Minimal impact.
Car Availability TEMPROv6.2 TEMPROv6.2 No change.
National Rail Fares RPI+0% 2014 – 2020; RPI+1% from
2021 onwards
RPI+0% 2014 – 2020; RPI+1% from
2021 onwards
No Change.
Car & Bus Journey
Times
TAG Databook November 2014 TAG Databook December 2015 No Change.
3.4.3 The December 2016 demand driver forecasts are presented in more detail in the remainder of this chapter and compared back to the July 2015 DDG set to highlight the changes that have occurred since the rail demand forecasts were last updated within the PFM.
Macro-Economic Forecasts
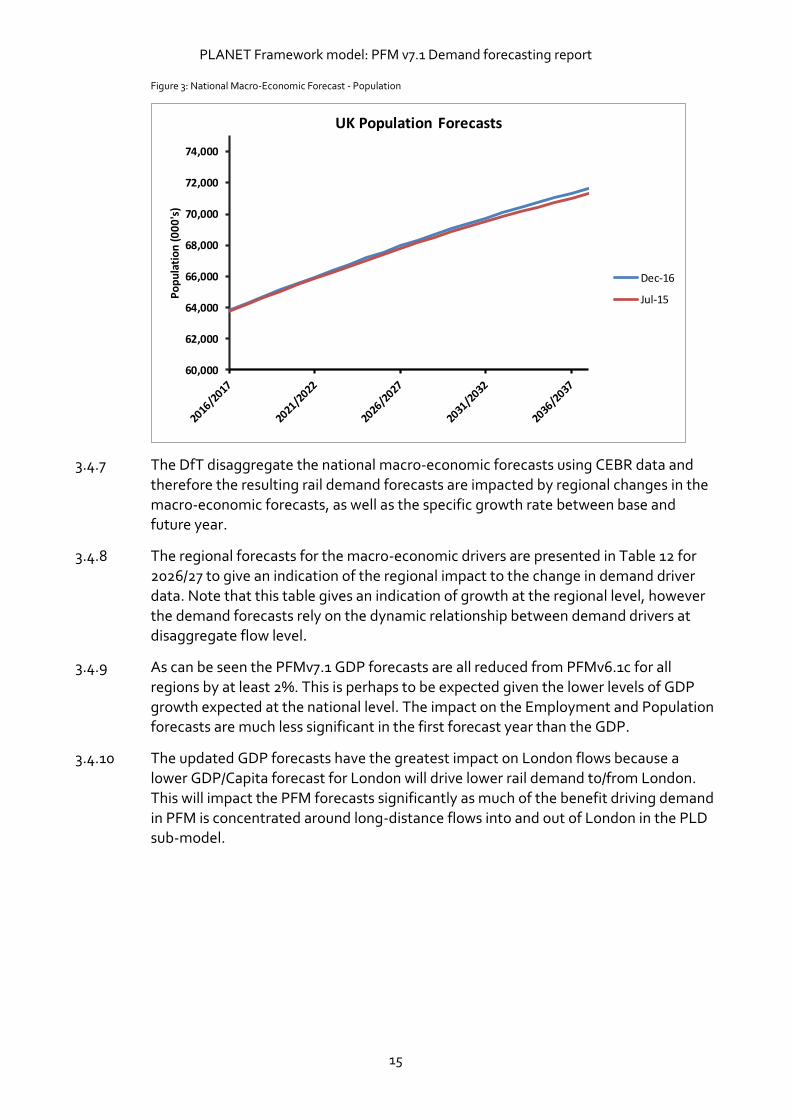
3.4.4 The macro-economic forecasts for Great Britain (GB) are presented in Figure 1, Figure 2, and Figure 3 for GDP, Employment, and Population respectively. The graphs show the comparison of the national forecasts between the December 2016 and July 2015 DDG sets. DDGs are indexed to 2010/11, but the figures show the change in DDGs between 2016/17 and 2037/38.
3.4.5 The GDP Per Capita forecast has been affected most significantly in the DDG update
with a lower growth rate over time. The employment forecast is lower in the short term in the December 2016 DDG set, however the forecast recovers and grows more strongly than in the July 2015 DDG set.
3.4.6 The population forecast is largely the same in the two DDG sets which is perhaps to be expected as both data sets assume the principle population forecast from the ONS, and there has been no change to the low migration assumption in the formulation of the dataset.

PLANET Framework model: PFM v7.1 Demand forecasting report
14
Figure 1: National Macro-Economic Forecast – GDP
Figure 2: National Macro-Economic Forecast - Employment
0.90
1.00
1.10
1.20
1.30
1.40
1.50
1.60
GD
P p
er c
apit
a (i
nd
exed
)
UK GDP per Capita Forecasts
Dec-16
Jul-15
28,000
29,000
30,000
31,000
32,000
33,000
Emp
loym
ent
('0
00s
)
UK Employment Forecasts
Dec-16
Jul-15
PLANET Framework model: PFM v7.1 Demand forecasting report
15
Figure 3: National Macro-Economic Forecast - Population
3.4.7 The DfT disaggregate the national macro-economic forecasts using CEBR data and therefore the resulting rail demand forecasts are impacted by regional changes in the macro-economic forecasts, as well as the specific growth rate between base and future year.
3.4.8 The regional forecasts for the macro-economic drivers are presented in Table 12 for 2026/27 to give an indication of the regional impact to the change in demand driver data. Note that this table gives an indication of growth at the regional level, however
the demand forecasts rely on the dynamic relationship between demand drivers at disaggregate flow level.
3.4.9 As can be seen the PFMv7.1 GDP forecasts are all reduced from PFMv6.1c for all regions by at least 2%. This is perhaps to be expected given the lower levels of GDP growth expected at the national level. The impact on the Employment and Population forecasts are much less significant in the first forecast year than the GDP.
3.4.10 The updated GDP forecasts have the greatest impact on London flows because a lower GDP/Capita forecast for London will drive lower rail demand to/from London. This will impact the PFM forecasts significantly as much of the benefit driving demand in PFM is concentrated around long-distance flows into and out of London in the PLD sub-model.
60,000
62,000
64,000
66,000
68,000
70,000
72,000
74,000
Po
pu
lati
on
(0
00
's)
UK Population Forecasts
Dec-16
Jul-15

PLANET Framework model: PFM v7.1 Demand forecasting report
16
Table 12: Regional changes in macro-economic demand driver forecasts from 2016/17 to 2026/27
Region GDP per Capita Employment Population
v6.1c v7.1 Diff. v6.1c v7.1 Diff. v6.1c v7.1 Diff.
East of England 17% 15% -2% 6% 5% -1% 8% 9% 1%
East Midlands 16% 12% -3% 5% 4% 0% 6% 7% 1%
London 19% 11% -7% 7% 7% 0% 11% 10% -1%
North East 16% 14% -2% 1% 2% 1% 3% 3% 0%
North West 15% 13% -2% 3% 2% -1% 4% 4% 1%
Scotland 17% 15% -2% 1% 2% 1% 4% 3% -1%
South East 19% 15% -4% 3% 3% 0% 7% 8% 1%
South West 14% 11% -3% 2% 2% 0% 7% 8% 1%
Wales 14% 11% -2% 1% 0% -1% 4% 3% -1%
West Midlands 15% 12% -3% 5% 4% -1% 5% 6% 1%
Yorkshire & Humber 14% 12% -2% 2% 2% 0% 5% 5% 0%
Great Britain 16% 13% -3% 4% 3% 0% 6% 6% 0%
3.4.11 A similar comparison for the demand driver forecasts for the 2037/38 future year is presented in Table 13. Table 13: Regional changes in macro-economic demand driver forecasts from 2016/17 to 2037/38
Region GDP per Capita Employment Population
v6.1c v7.1 Diff. v6.1c v7.1 Diff. v6.1c v7.1 Diff.
East of England 43% 41% -2% 9% 10% 1% 14% 17% 3%
East Midlands 41% 34% -7% 6% 10% 4% 12% 13% 1%
London 45% 33% -12% 10% 10% 0% 17% 18% 1%
North East 41% 36% -5% 3% 5% 2% 8% 7% -2%
North West 41% 35% -6% 4% 7% 3% 9% 8% -1%
Scotland 43% 38% -4% 6% 5% -1% 10% 6% -4%
South East 45% 40% -5% 5% 7% 2% 13% 16% 3%
South West 40% 30% -10% 4% 7% 3% 12% 15% 3%
Wales 39% 31% -7% 10% 3% -7% 9% 5% -4%
West Midlands 40% 32% -8% 9% 9% 0% 11% 11% 1%
Yorkshire & Humber 39% 32% -7% 7% 8% 0% 10% 9% -1%
Great Britain 43% 36% -7% 7% 8% 1% 12% 12% 0%

PLANET Framework model: PFM v7.1 Demand forecasting report
17
3.4.12 The GDP/Capita forecast reduces further in 2037/38 for all regions due to a reduced GDP/Capita forecast to 2037/38, with London once again being the worst hit region.
3.4.13 The change in population forecasts to 2037/38 are again mixed depending on region. The London population forecast has increased in 2037/38 compared to the slight reduction in 2026/27, reflecting some recovery in population growth in later years. However, Scotland, Wales and the North East have weaker population growth in the longer term with a greater reduction in forecast population in 2037/38 compared to 2026/27. Overall population growth has not changed, but the growth is distributed differently across geographical regions.

PLANET Framework model: PFM v7.1 Demand forecasting report
18
Modal Competition Forecasts
3.4.14 The change in modal competition drivers as a result of the demand driver update between July 2015 and December 2016 are presented in this section. The figures compare the forecasts for July 2015 and December 2016 for the set of flows between London and the Rest of the UK outside of the South East, as this flow category represents a significant driver of demand and benefits for the HS2 scheme within the PLD model.
3.4.15 Car cost is forecast to reduce more for long distance flows to and from London within the latest DDG set of forecasts. This pattern is also mirrored within the other flow categories. Lower car costs will result in lower demand for rail because the cost of the competing mode is lower. The car cost DDG update includes a change to the methodology for developing the car cost driver. This change in methodology relates to the application of the GDP deflator and explains the large difference between July
2015 and December 2016 DDGs in the graph. However, the demand forecasting uses rate of change in driver, and not absolute change, indicating that the difference between the drivers is less significant than would appear in the graph.
Figure 4: Inter-Modal Competition – Car Cost Forecasts
3.4.16 Figure 5 shows significantly lower growth in bus\coach fares in the December 2016 DDG set than in the July 2015 DDG set, which will drive lower future year rail demand growth given that the increase in cost of taking the bus will be lower than previously forecast.
3.4.17 The bus\coach headway and fare, and London Underground fares drivers in Figure 5 to
Figure 7 show some significant changes in forecasts between July 2015 and December 2016. However PDFH recommended elasticity values for these drivers are very small – and particularly for the London Underground fares driver are only non-zero for London based flows – therefore the changes in these drivers will have a negligible impact when applied within the forecasting system.
0.50
0.55
0.60
0.65
0.70
0.75
0.80
0.85
0.90
2016/2017 2021/2022 2026/2027 2031/2032 2036/2037
Car
co
st (g
row
th fr
om
20
10
/11
)
Car Costs Forecasts
Dec-16
Jul-15

PLANET Framework model: PFM v7.1 Demand forecasting report
19
Figure 5: Inter-Modal Competition – Bus\Coach Fare Forecasts
Figure 6: Inter-Modal Competition – Bus\Coach Headway Forecasts
Figure 7: Inter-Modal Competition – London Underground Fares
0.90
1.00
1.10
1.20
1.30
1.40
1.50
1.60
1.70
1.80
Bu
s fa
res
(gro
wth
fro
m 2
01
0/1
1)
Bus\Coach Fare Forecasts
Dec-16
Jul-15
0.90
0.95
1.00
1.05
1.10
1.15
Bu
s H
ead
way
(gro
wth
fro
m 2
01
0/1
1)
Bus\Coach Headway Forecasts
Dec-16
Jul-15
0.80
0.85
0.90
0.95
1.00
1.05
1.10
1.15
1.20
1.25
1.30
2016/2017 2021/2022 2026/2027 2031/2032 2036/2037
LUL
fare
s (g
row
th fr
om
20
10
/11)
London Underground Fares
Dec-16
Jul-15

PLANET Framework model: PFM v7.1 Demand forecasting report
20
3.4.18 As with the macro-economic drivers, the actual impact of the change in demand driver forecasts is driven by the growth in the driver between the base year and specified future year, as well as regional changes in the demand driver forecasts.
3.4.19 A summary of the change in forecasts for all inter-modal competition drivers is presented in Table 14 for both forecast years. This table compares the change in demand drivers between 2016/17 and the forecast years for PFMv6.1c and PFMv7.1. The table shows some significant changes in the forecast growth in several demand drivers.
Table 14: Change in Inter-Modal Competition Demand Driver forecasts
Inter-Modal Demand Driver 2016/17 to 2026/27 2016/17 to 2037/38
v6.1c v7.1 Diff. v6.1c v7.1 Diff.
Growth in Car Journey Time 4% 4% 0% 8% 8% 0%
Growth in Car Availability 10% 10% 0% 21% 21% 0%
Growth in Car Costs -10% -11% 0% -8% -15% -7%
Growth in Bus Costs \ Fares 24% 12% -12% 58% 28% -30%
Growth in Bus Journey Time 7% 7% 0% 12% 12% 0%
Growth in Bus Headway \ Frequency 3% 0% -3% 7% 0% -7%
Growth in London Underground Fares 10% -6% -16% 23% 5% -18%
3.4.20 Car costs are forecast to change at the same rate up to 2026/27, but to the second forecast year there is expected to be a greater reduction in car costs of ~7%. This is a
significant difference that will result in lower growth in rail demand in PFMv7.1 because if car is cheaper as a competing mode this will make rail a less appealing option for travel.
3.4.21 Similarly the PFMv7.1 demand drivers for bus show significant reductions in the growth rate of bus\coach fares and bus\coach headway, meaning bus will be a more attractive mode of transport than was previously estimated thus reducing the growth in rail demand.
3.4.22 The change in the growth rate of London Underground fares is significant, however the demand elasticities within the PDFH framework recommend non-zero elasticities for London-based flows only which will only impact significantly on movements within PLANET South.

PLANET Framework model: PFM v7.1 Demand forecasting report
21
3.5 Future Year Demand Estimates
3.5.1 The resulting level of rail demand in 2026/27 and 2037/38 for PFMv7.1 will be a combination of the 6% increase in base demand which has been applied to represent rail demand growth over 2014/15 – 2016/17, and the impact of the change in the demand driver forecasts.
3.5.2 As described in the previous sub-sections – this is a complex combination as the forecasting process calculates demand at a disaggregated level, and as such, the impacts will manifest differently in each different sub-model.
3.5.3 Both the macro-economic and modal competition drivers will drive lower rail demand growth in PFMv7.1 than for PFMv6.3, and this is a combination of including observed growth from 2014/15-2016/17 and the changing demand driver forecasts; particularly the reduction in the GDP/Capita forecast.
3.5.4 To some extent, the lower growth in rail demand from the demand drivers will be off-set by the 6% increase in demand in the base year. In 2026/27 this could cause more rail demand in some areas and some sub-models. By 2037/38 the size of the reduction in the GDP/Capita forecast will cause an overall reduction in rail demand in all areas, which is not mitigated by the impact of the base year demand increases or any of the impacts from the other demand drivers.

PLANET Framework model: PFM v7.1 Demand forecasting report
22
4 PFMv7.1 Forecast Rail Demand 4.1 Introduction
4.1.1 The December 2016 DDG set has been used within EDGE to forecast future year rail demand for 2026/27 and 2037/38 from the updated 2016/17 base year; these forecasts have been input into PFMv7.1.
4.1.2 This chapter presents the impacts to the future year rail demand for each of the sub-models contained within the PFM, by comparing the resulting future year demand forecasts with the forecasts from PFMv6.3 (see Section 3.3). The comparison is between PFMv6.3 and PFMv7.1 so that there is a comparable second forecast year against which to compare the demand matrices.
4.2 Impacts to PLANET Long Distance (PLD) Rail Demand
Impacts to PLD Future Year Matrix Totals
4.2.1 Table 15 presents the changes to the PLD future year matrix totals as a result of using the December 2016 DDG data set to forecast rail demand from the Base to 2026/27. Overall there is a 2% reduction in PLD future year rail demand. The business trip purpose has been affected most significantly with a reduction of 4%, with commuting reduced the least by only 1%.
Table 15: Change in future year total PLD rail demand for 2026/27
PFMv6.3 PFMv7.1 Change Change (%)
Commuting Non-Car Available 12,884 12,818 -66 -1%
Commuting Car Available from Home 51,297 50,916 -381 -1%
Commuting Car Available to Home 51,081 50,670 -411 -1%
Business Non-Car Available * - - - 0%
Business Car Available from Home 89,586 86,199 -3,387 -4%
Business Car Available to Home 69,585 66,865 -2,720 -4%
Leisure Non-Car Available 46,420 45,389 -1,031 -2%
Leisure Car Available from Home 111,084 108,650 -2,434 -2%
Leisure Car Available to Home 82,979 81,128 -1,851 -2%
Sub-Totals
Commute 115,262 114,404 -858 -1%
Business 159,171 153,064 -6,107 -4%
Leisure 240,482 235,167 -5,316 -2%
Total 514,915 502,635 -12,280 -2%
*The Business Non-Car Available trip purpose has zero demand; but the matrix total reporting is retained for
completeness.

PLANET Framework model: PFM v7.1 Demand forecasting report
23
4.2.2 Table 16 presents the resulting changes to the PLD future year matrix totals for 2037/38. Overall there is a 9% reduction in total PLD rail demand, with a 9-10%
reduction in business and leisure trip purposes and only a 6% reduction in commuting trips.
Table 16: Change in future year PLD rail demand for 2037/38
PFMv6.3 PFMv7.1 Change Change (%)
Commuting Non-Car Available 14,308 13,515 -792 -6%
Commuting Car Available from Home 62,648 59,099 -3,549 -6%
Commuting Car Available to Home 62,469 58,870 -3,599 -6%
Business Non-Car Available * - - - 0%
Business Car Available from Home 121,691 109,372 -12,318 -10%
Business Car Available to Home 95,087 85,201 -9,886 -10%
Leisure Non-Car Available 57,176 52,060 -5,116 -9%
Leisure Car Available from Home 149,440 136,089 -13,351 -9%
Leisure Car Available to Home 112,529 102,287 -10,242 -9%
Sub-Totals
Commute 139,425 131,484 -7,940 -6%
Business 216,778 194,573 -22,205 -10%
Leisure 319,145 290,435 -28,709 -9%
Total 675,347 616,493 -58,854 -9%
*The Business Non-Car Available trip purpose has zero demand; but the matrix total reporting is retained for
completeness.
4.2.3 The reductions in the future year PLD matrices are much smaller in 2026/27 than for
2037/38. The 6% increase in base year demand to represent the observed change in rail demand between 2014/15 and 2016/17 is greater than would have been forecast over the same period. The changes in demand driver forecasts between the two datasets – particularly the reduction in forecast GDP/Capita – causes less impact over the shorter forecasting period to 2026/27 and therefore the base year increase manages to off-set much of these changes. By 2037/38 the reduction in the GDP/Capita forecast is t0o large to be offset significantly by the base year increase in demand.
4.2.4 Around 15-20% of the base year trips within PLD are long distance trips to and from London. Therefore, the changes to the London demand driver forecasts are having a large impact on the resulting future year rail demand, and the London forecasts are the worst hit in terms of a reduced GDP forecast.
4.2.5 With the employment forecast driving most of the commuting trips, the journey to work trips are not impacted heavily by the changes to the GDP/Capita forecast and therefore reduce less significantly.
PLANET Framework model: PFM v7.1 Demand forecasting report
24
Impacts to Key Rail Movements
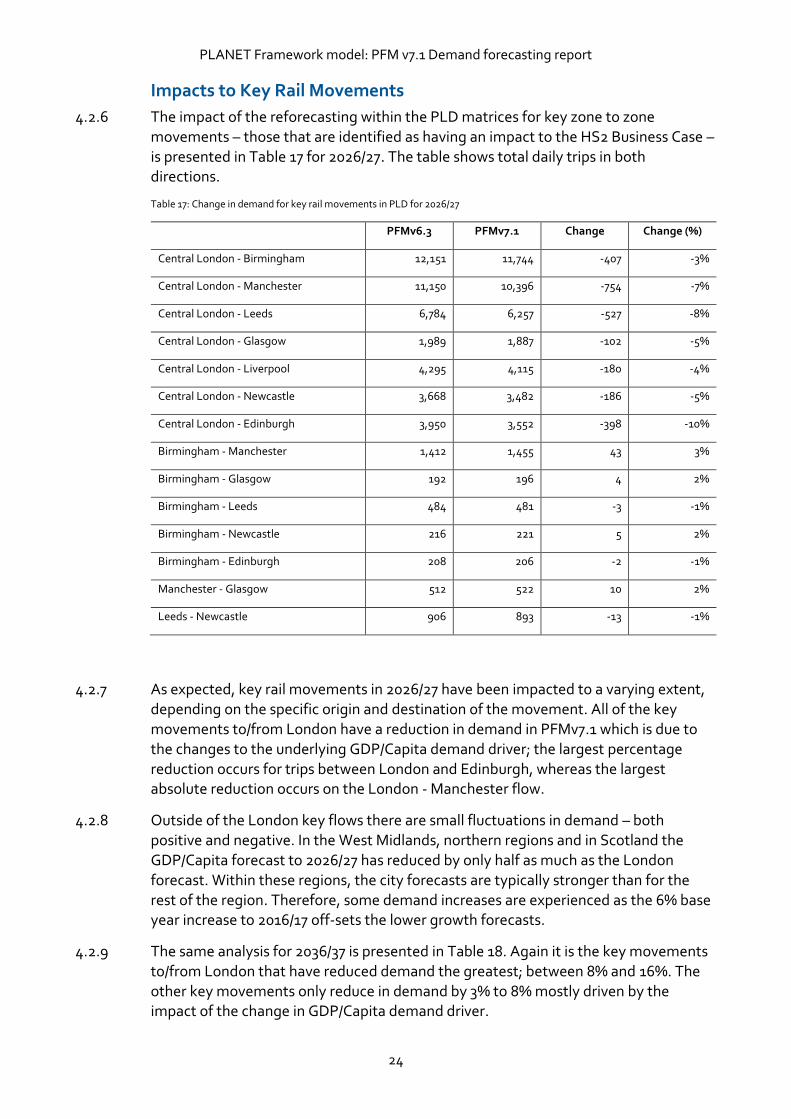
4.2.6 The impact of the reforecasting within the PLD matrices for key zone to zone movements – those that are identified as having an impact to the HS2 Business Case – is presented in Table 17 for 2026/27. The table shows total daily trips in both directions.
Table 17: Change in demand for key rail movements in PLD for 2026/27
PFMv6.3 PFMv7.1 Change Change (%)
Central London - Birmingham 12,151 11,744 -407 -3%
Central London - Manchester 11,150 10,396 -754 -7%
Central London - Leeds 6,784 6,257 -527 -8%
Central London - Glasgow 1,989 1,887 -102 -5%
Central London - Liverpool 4,295 4,115 -180 -4%
Central London - Newcastle 3,668 3,482 -186 -5%
Central London - Edinburgh 3,950 3,552 -398 -10%
Birmingham - Manchester 1,412 1,455 43 3%
Birmingham - Glasgow 192 196 4 2%
Birmingham - Leeds 484 481 -3 -1%
Birmingham - Newcastle 216 221 5 2%
Birmingham - Edinburgh 208 206 -2 -1%
Manchester - Glasgow 512 522 10 2%
Leeds - Newcastle 906 893 -13 -1%
4.2.7 As expected, key rail movements in 2026/27 have been impacted to a varying extent, depending on the specific origin and destination of the movement. All of the key movements to/from London have a reduction in demand in PFMv7.1 which is due to the changes to the underlying GDP/Capita demand driver; the largest percentage reduction occurs for trips between London and Edinburgh, whereas the largest absolute reduction occurs on the London - Manchester flow.
4.2.8 Outside of the London key flows there are small fluctuations in demand – both positive and negative. In the West Midlands, northern regions and in Scotland the
GDP/Capita forecast to 2026/27 has reduced by only half as much as the London forecast. Within these regions, the city forecasts are typically stronger than for the rest of the region. Therefore, some demand increases are experienced as the 6% base year increase to 2016/17 off-sets the lower growth forecasts.
4.2.9 The same analysis for 2036/37 is presented in Table 18. Again it is the key movements to/from London that have reduced demand the greatest; between 8% and 16%. The other key movements only reduce in demand by 3% to 8% mostly driven by the impact of the change in GDP/Capita demand driver.

PLANET Framework model: PFM v7.1 Demand forecasting report
25
Table 18: Change in demand for key rail movement in PLD for 2037/38
PFMv6.3 PFMv7.1 Change Change (%)
Central London - Birmingham 16,783 15,492 -1,291 -8%
Central London - Manchester 15,336 13,506 -1,830 -12%
Central London - Leeds 9,398 8,139 -1,260 -13%
Central London - Glasgow 2,719 2,483 -236 -9%
Central London - Liverpool 5,853 5,344 -509 -9%
Central London - Newcastle 4,989 4,443 -546 -11%
Central London - Edinburgh 5,442 4,556 -886 -16%
Birmingham - Manchester 1,842 1,782 -60 -3%
Birmingham - Glasgow 247 243 -4 -2%
Birmingham - Leeds 629 596 -33 -5%
Birmingham - Newcastle 279 271 -9 -3%
Birmingham - Edinburgh 270 255 -15 -6%
Manchester - Glasgow 674 642 -32 -5%
Leeds - Newcastle 1,168 1,075 -93 -8%
Regional Variation in PLD Impacts
4.2.10 The impacts of regional changes in the demand driver forecasts has been checked by
analysing the PLD matrices at Government Office Region (GOR) level. A comparison of the future year PLD rail demand by GOR is presented in Appendix A, where the tables show the change in future year rail demand in PFMv7.1 from PFMv6.3.
4.2.11 In 2026/27, the 2% decrease in overall rail demand in PFMv7.1 is driven by the reduction in demand for trips to and from London. This is due to the reductions in the GDP/Capita, population and employment forecasts which are driving much lower growth in rail demand for trips to/from London. This is outweighing the increase in the base year level of demand of 6%.
4.2.12 Trips within the North East sector have increased in PFMv7.1, particularly for commuting trip purposes. The North East population and employment forecasts are as strong in PFMv7.1 from a base of 2016/17 as they were in PFMv6.3 from a base of
2014/15, driving just as much rail demand growth for commuting trip purposes but from a higher base level.
4.2.13 Elsewhere there are small increases in demand for some sector to sector movements, particularly for trips to/from Wales, which has the lowest reduction in GDP/Capita forecast for all of the GORs. Therefore for some movements the 6% increase in the base level of demand outweighs the lower rail demand growth.

PLANET Framework model: PFM v7.1 Demand forecasting report
26
4.2.14 In 2037/38 there is a much greater reduction in future year demand, with all movements showing reductions in trips. This is most significant for movements to/from London with up to 15% lower forecast rail trips.
4.2.15 Rail trips within the North West sector have decreased by the greatest magnitude. However, this is due to this sector containing the most significant proportion of demand, rather than any significant change to the future year forecasts.
4.2.16 Trips between London and the Midlands, North West and Yorkshire and Humber also have large absolute decreases in demand in 2037/38. The GDP/Capita forecasts for these areas in 2037/38 have reduced by at least 10%, causing a much lower rail demand forecast than the GDP/Capita forecast used in PFMv6.3. This reduction in forecast rail demand cannot be outweighed by the increase in base year demand of 6%.
4.2.17 Trips to/from Wales, Scotland and the South West have also reduced by more than the average. The South West has the largest decrease in GDP/Capita forecast by 2037/38 after London; and Wales and Scotland have larger reductions in their population and employment forecasts. As a result, the sector to sector movements
most proportionately impacted by the reduction in demand driver forecasts are London to/from Wales, Scotland, and the South West.
4.2.18 Rail demand to and from the East of England has been impacted the least by the changes in the demand drivers, as the GDP, Employment and Population forecasts have reduced the least in the demand driver data.
4.2.19 Overall the patterns in the regional impacts to future year rail demand in the PLD sub-model matches the regional changes to GDP, Population and Employment that have occurred within the DfT forecasts.
4.3 Impacts to PLANET South (PS) Forecasts
4.3.1 Table 19 presents the changes to the PS future year matrix totals as a result of using the December 2016 DDG data set to forecast rail demand from the base of 2016/17 to 2026/27.
4.3.2 Overall there is a 3% reduction in the PS future year rail demand. The leisure trip purpose has been affected most significantly with a reduction of 10%, with commuting reduced the least by only 1%.
4.3.3 Business and leisure trips have reduced more significantly as they are driven by the GDP/Capita forecast, and the forecasts of GDP/Capita in the south and London have
reduced by 6% to 11%. In addition, the population forecast for London has reduced significantly in 2026/27, which is contributing to lower future year rail demand growth. This is outweighing the base year increase in rail demand of 6% to cause an overall decrease in rail demand in 2026/27.
4.3.4 Commuting trip purposes are typically driven by the employment demand driver instead of GDP/Capita. The employment forecast for London and the south has not reduced as significantly as GDP/Capita, and therefore the rail demand growth has not reduced as much as Business and Leisure. The change in the modal competition demand drivers also causes lower rail demand growth. However, the impact of the

PLANET Framework model: PFM v7.1 Demand forecasting report
27
change in demand drivers for commuting trip purposes is balanced by the 6% increase in rail demand growth, and therefore only a small decrease in 2026/27 commuting rail demand is observed.
Table 19: Change in future year PS rail demand for 2026/27
PFMv6.3 PFMv7.1 Change Change (%)
Commuting PA 1,746,715 1,720,903 -25,812 -1%
Commuting AP 37,398 36,990 -409 -1%
Business PA 201,778 187,234 -14,545 -7%
Business AP 12,540 11,734 -806 -6%
Leisure PA 214,631 191,778 -22,853 -11%
Leisure AP 24,093 22,350 -1,742 -7%
Sub-Totals
Commute 1,784,113 1,757,892 -26,221 -1%
Business 214,318 198,968 -15,351 -7%
Leisure 238,723 214,128 -24,595 -10%
Total 2,237,155 2,170,988 -66,166 -3%
PA = Production to Attraction
AP = Attraction to Production
4.3.5 Table 20 presents the resulting changes to the PS future year matrix totals for 2037/38. Overall there is a 6% reduction in total PS rail demand, with a 13% reduction
in leisure trips, a 9% reduction in business trips and only a 4% reduction in commuting trips.
Table 20: Change in future year PS rail demand for 2037/38
PFMv6.3 PFMv7.1 Change Change (%)
Commuting PA 1,921,560 1,844,291 -77,269 -4%
Commuting AP 41,237 40,049 -1,187 -3%
Business PA 269,091 244,816 -24,275 -9%
Business AP 16,274 14,974 -1,300 -8%
Leisure PA 279,180 242,099 -37,081 -13%
Leisure AP 30,439 27,553 -2,885 -9%
Sub-Totals
Commute 1,962,797 1,884,341 -78,456 -4%
Business 285,364 259,789 -25,575 -9%
Leisure 309,619 269,652 -39,966 -13%
Total 2,557,780 2,413,783 -143,997 -6%
PA = Production to Attraction
AP = Attraction to Production

PLANET Framework model: PFM v7.1 Demand forecasting report
28
4.3.6 In 2037/38 the population and employment forecasts for London and southern GOR sectors have recovered. South West and South East sectors have stronger forecasts in PFMv7.1 than for PFMv6.3. This is not the case for London, however the population and employment forecasts are less negative for 2037/38 than they were for 2026/27. Therefore, the further reduction in rail demand in 2037/38 is caused by the reduction in the GDP/Capita forecast which has become worse for London and south sectors by 2037/38. This will largely only impact business and leisure trips however, and therefore the change in the modal competition drivers are also causing a noticeable impact. In particular, there is a large decrease in forecast bus fares growth in the PFMv7.1 set of demand drivers by 2037/38.
4.3.7 The PS forecasts for 2026/27 at an overall level have been affected to a similar level as the PLD sub-model. However, business and leisure trips are more significantly
impacted and this is likely to be due to a higher proportion of these trips within PS that are impacted by the changes to the London macro-economic forecasts, due to there being a large number of local London trips in-scope for PS.
4.3.8 By 2037/38, the increases in the employment and population forecasts in the south and east of England - and the fact that over 80% of the mode share in PS is commuting contribute to a lower reduction in future year rail demand than is experienced in the PLD sub-model.
4.4 Impacts to PLANET Midland (PM) Forecasts
4.4.1 Table 21 presents the changes to the PM future year matrix totals as a result of using the December 2016 DDG data set to forecast rail demand from the base year of
2016/17 to 2026/27. Overall there is a 1% increase in PM future year rail demand, with this impact being consistent across the various journey purposes.
Table 21: Change in future year PM rail demand for 2026/27
PFMv6.3 PFMv7.1 Change Change (%)
Commuting Car Available 62,427 63,347 919 1%
Commuting Non-Car Available 10,499 10,649 150 1%
Business Car Available 5,392 5,429 36 1%
Business Non-Car Available 825 830 5 1%
Leisure Car Available 5,937 5,989 52 1%
Leisure Non-Car Available 926 933 7 1%
Sub-Totals
Commute 72,926 73,996 1,070 1%
Business 6,217 6,258 41 1%
Leisure 6,863 6,922 59 1%
Total 86,005 87,176 1,171 1%

PLANET Framework model: PFM v7.1 Demand forecasting report
29
4.4.2 Outside of London and the south, a much lower proportion of commuting trips are assumed to be on season tickets – only 43% for non-London short distance trips1
which is much lower than the 70-80% assumed closer to London. Therefore, a larger proportion of commuting trips outside of London and the south will be driven by the GDP/Capita demand driver rather than the employment demand driver. In the Midlands, the GDP/Capita forecast has reduced by 6% in 2026/27 and the employment driver by 3%. In addition, the employment demand driver has a high elasticity value of 1.7 in the short term for season ticket trips to/from core cities such as Birmingham and Nottingham; this is higher than the GDP/Capita elasticity value of 1.3. This means that demand growth for the separate journey purposes is more consistent in the Midlands due to the forecasting parameters used within the modelling framework.
4.4.3 Table 22 presents the resulting changes to the PM future year matrix totals for
2037/38. Overall there is a 3% reduction in total PM rail demand, with a 5% reduction in leisure and business trips, and a 2% reduction in commuting trips.
Table 22: Change in future year PM rail demand for 2037/38
PFMv6.3 PFMv7.1 Change Change (%)
Commuting PA 76,782 75,064 -1,718 -2%
Commuting AP 11,840 11,608 -232 -2%
Business PA 7,155 6,774 -381 -5%
Business AP 1,002 951 -51 -5%
Leisure PA 7,842 7,435 -407 -5%
Leisure AP 1,120 1,064 -55 -5%
Sub-Totals
Commute 88,622 86,672 -1,950 -2%
Business 8,157 7,725 -432 -5%
Leisure 8,962 8,499 -462 -5%
Total 105,741 102,897 -2,844 -3%
PA = Production to Attraction
AP = Attraction to Production
4.4.4 The worsening of the GDP/Capita forecast by 2037/38 causes the overall impact to be a negative change in rail demand in PFMv7.1 compared to PFMv6.3.
4.4.5 By 2037/38 the employment forecasts have recovered slightly, particularly in the East Midlands, whereas the GDP/Capita forecast for PFMv7.1 has continued to reduce when compared to PFMv6.3. The resulting demand forecasts therefore show a smaller reduction for commuting trip purposes than for other trip purposes.
1 PDFHv5.0 B0.3 Mapping Ticket Type to Journey Purpose
PLANET Framework model: PFM v7.1 Demand forecasting report
30
4.5 Impacts to PLANET North (PN) Forecasts
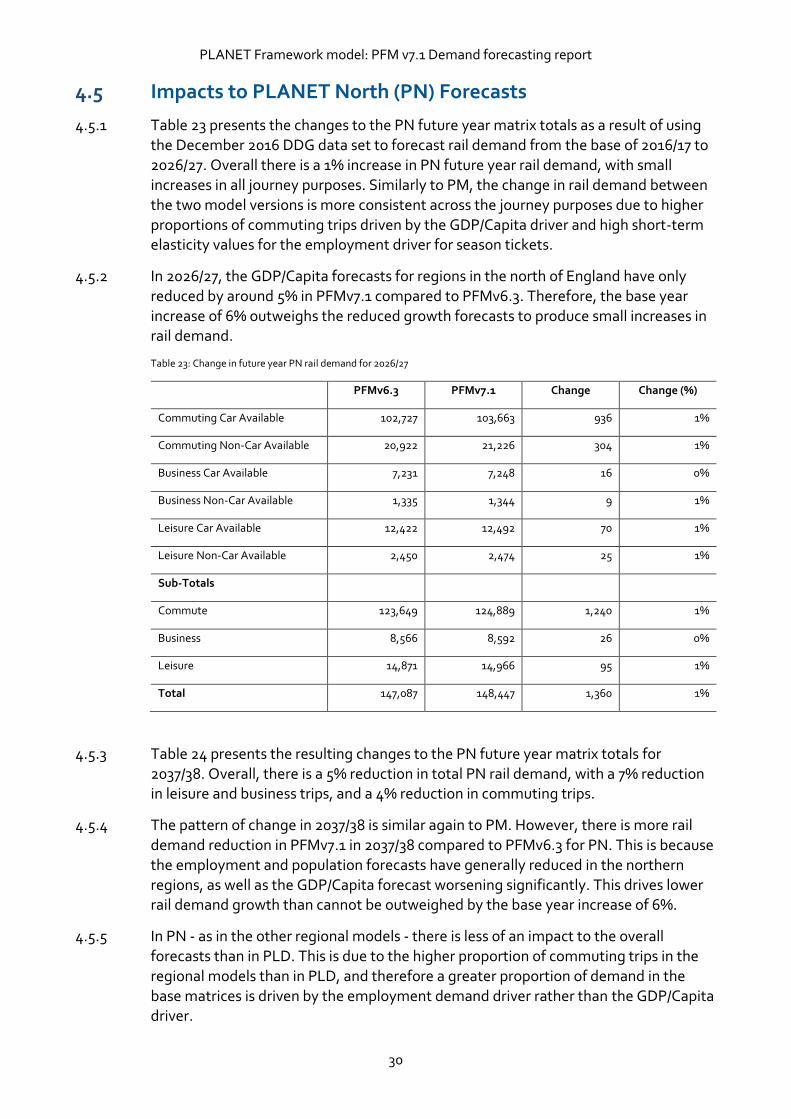
4.5.1 Table 23 presents the changes to the PN future year matrix totals as a result of using the December 2016 DDG data set to forecast rail demand from the base of 2016/17 to 2026/27. Overall there is a 1% increase in PN future year rail demand, with small increases in all journey purposes. Similarly to PM, the change in rail demand between the two model versions is more consistent across the journey purposes due to higher proportions of commuting trips driven by the GDP/Capita driver and high short-term elasticity values for the employment driver for season tickets.
4.5.2 In 2026/27, the GDP/Capita forecasts for regions in the north of England have only reduced by around 5% in PFMv7.1 compared to PFMv6.3. Therefore, the base year increase of 6% outweighs the reduced growth forecasts to produce small increases in rail demand.
Table 23: Change in future year PN rail demand for 2026/27
PFMv6.3 PFMv7.1 Change Change (%)
Commuting Car Available 102,727 103,663 936 1%
Commuting Non-Car Available 20,922 21,226 304 1%
Business Car Available 7,231 7,248 16 0%
Business Non-Car Available 1,335 1,344 9 1%
Leisure Car Available 12,422 12,492 70 1%
Leisure Non-Car Available 2,450 2,474 25 1%
Sub-Totals
Commute 123,649 124,889 1,240 1%
Business 8,566 8,592 26 0%
Leisure 14,871 14,966 95 1%
Total 147,087 148,447 1,360 1%
4.5.3 Table 24 presents the resulting changes to the PN future year matrix totals for 2037/38. Overall, there is a 5% reduction in total PN rail demand, with a 7% reduction in leisure and business trips, and a 4% reduction in commuting trips.
4.5.4 The pattern of change in 2037/38 is similar again to PM. However, there is more rail
demand reduction in PFMv7.1 in 2037/38 compared to PFMv6.3 for PN. This is because the employment and population forecasts have generally reduced in the northern regions, as well as the GDP/Capita forecast worsening significantly. This drives lower rail demand growth than cannot be outweighed by the base year increase of 6%.
4.5.5 In PN - as in the other regional models - there is less of an impact to the overall forecasts than in PLD. This is due to the higher proportion of commuting trips in the regional models than in PLD, and therefore a greater proportion of demand in the base matrices is driven by the employment demand driver rather than the GDP/Capita driver.

PLANET Framework model: PFM v7.1 Demand forecasting report
31
Table 24: Change in future year PN rail demand for 2037/38
PFMv6.3 PFMv7.1 Change Change (%)
Commuting Car Available 122,543 117,459 -5,083 -4%
Commuting Non-Car Available 22,900 21,962 -938 -4%
Business Car Available 9,497 8,798 -700 -7%
Business Non-Car Available 1,610 1,491 -119 -7%
Leisure Car Available 16,161 14,966 -1,196 -7%
Leisure Non-Car Available 2,923 2,708 -215 -7%
Sub-Totals
Commute 145,442 139,422 -6,021 -4%
Business 11,108 10,288 -819 -7%
Leisure 19,084 17,673 -1,411 -7%
Total 175,634 167,384 -8,251 -5%
4.5.6 The changes in the forecasts for the regional sub-models generally follow the same pattern of changes that can be seen in the demand driver datasets. The impacts to the future year rail demand overall as a result of the update to the December 2016 DDG dataset, can be explained by the balancing of the base year update and the changes to the rail demand forecasts underpinned by the DfT demand driver forecasts.

PLANET Framework model: PFM v7.1 Demand forecasting report
32
5 PFMv7.1 Forecast Highway Demand 5.1 Introduction
5.1.1 The highway mode within the PFM exists within the PLD sub-model, and represents long-distance travel by car, as well as some shorter distance trips that could potentially shift to high-speed rail with the introduction of the HS2 scheme.
5.1.2 Future year highway demand for PLD is derived by forecasting from a base year level of highway demand. The Base highway matrices have not been updated since the release of PFMv6.1c.
5.1.3 In addition to the highway demand contained within the PLD demand matrices, local highway demand is also represented on the highway network as preloads to give a more accurate representation of the level of highway demand on the network. This
preload demand is not able to mode shift. Highway preloads are also forecast from the base year to the designated future years.
5.1.4 This chapter details the methodology used to forecast both the highway demand matrices and the highway preloads from the base year level of demand in 2014/15 to the forecast years of 2026/27 and 2037/38 for the PLD model. This chapter also discusses the derivation of the future highway occupancy factors.
5.2 Future Year Highway Demand Forecasting
Methodology
5.2.1 The forecasting approach for the highway mode applies furness targets derived from the DfT’s Trip End Model Program TEMPro to the 2014/15 base highway matrices to obtain future year highway forecasts for the designated forecast years.
5.2.2 This approach is consistent with the forecasting approach used in previous versions of the PFM without making use of the same processing system. Instead a spreadsheet based approach has been utilised to calculate the highway demand forecasts.
5.2.3 The methodology for forecasting highway demand in PFMv7.1 has not changed from the methodology used in PFMv6.1c. Only the highway demand forecasts for the second forecast year have been updated for PFMv7.1, with the 2026/27 forecasts remaining the same.

PLANET Framework model: PFM v7.1 Demand forecasting report
33
TEMPRO data
5.2.4 Data from TEMPro was obtained using TEMPro version 6 with data set versions 6.2 across the entire country. Trip ends were obtained by time period for car driver and car passenger combined and were obtained for weekday AM Peak, Inter Peak, PM peak and Off Peak time periods.
5.2.5 The purposes within TEMPro were mapped to the PLD journey purposes as shown in Table 25.
Table 25: TEMPRO to PLD Journey Purpose Mappings
TEMPRO Journey Purpose PLD Journey Purpose
HB Work Commute
HB Employer’s Business Business
HB Education Education
HB Shopping Leisure
HB Personal Business Leisure
HB Recreation/Social Leisure
HB Visiting friends and Relatives Leisure
HB Holiday/Day Trip Leisure
NHB Work Commute
NHB Employers Business Business
NHB Education Education
NHB Shopping Leisure
NHB Personal Business Leisure
NHB Recreation/Social Leisure
NHB Holiday/Day Trip Leisure
5.2.6 It should be noted that Education is not a PLD purpose and was not included in the later calculations.
5.2.7 The PFM 20-year appraisal horizon designates that the PFM is used to forecast the impact of the HS2 scheme for the years 2026/27 and 2037/38. Trip ends were therefore
downloaded in the standard format from TEMPro for all combinations of the above purposes, time periods and car availability for 2014, 2015, 2037 and 2038.
5.2.8 The trip ends downloaded from TEMPRO were combined into 24hr financial year trip ends (by PLD purpose) using the following formulation:
(AM + IP + PM + OP)YEAR1 * 275/365 + (AM + IP + PM + OP)YEAR2 * 90/365
5.2.9 Once aggregated by financial year, the trip ends were mapped from TEMPro zones to PLD zones. Finally, the aggregated totals for 2026/27 and 2037/38 were divided by the totals for 2014/15 to calculate a set of growth factors by purpose at PLD zone level.

PLANET Framework model: PFM v7.1 Demand forecasting report
34
Highway Matrix Forecasting
5.2.10 Once the financial year trip end growth factors were developed, they were passed to a furnessing process which was built using spreadsheet techniques. This process undertakes the following steps for each purpose:
(1) Firstly a single step is undertaken where the derived pattern from the base year matrix is multiplied by both the production and attraction trip ends to get the 0th iteration matrix for the forecast year. Each zone is then scaled to get the correct production trip end;
(2) Attraction trip end ratios are then produced and applied to the matrix, this is then averaged with the matrix produced in the step above;
(3) Next production trip end ratios are produced and applied to the matrix, this is then averaged with the matrix produced in the previous step; and
Steps (2) and (3) are then repeated for 100 iterations.
5.2.11 This process produces a forecast matrix for each modelled purpose – commute, business and leisure - within PLD. This process was carried out for both the full and masked matrices to produce a full set of future year highway demand forecasts. For each modelled purpose a high level of convergence was achieved by 100 iterations.
Resulting Highway Demand Forecasts
5.2.12 The resulting future year highway demand forecasts for PFMv7.1 following the methodology described in the previous sections are presented in Table 26 and compared to PFMv6.1c forecasts. The growth in highway demand from the base year is also presented in Table 27.
5.2.13 The future year demand forecasts have grown by around 0.6% in the second forecast year of PFMv7.1. All journey purposes have grown by 0.5%-0.6% with the extra year of growth from 2036/37 to 2037/38. The matrices for 2026/27 are the same as in the previous model release and so have not changed.
5.2.14 In terms of growth from the base year, there is 9% growth in highway demand by 2026/27 and 16% growth by 2037/38. Leisure trips grow more significantly than for the other journey purposes.
Table 26: Future year highway forecasts for PFMv7.1
Matrix
Description
2026/27 2nd Forecast Year
PFMv6.1c PFMv7.1 Change Change
(%)
PFMv6.1c
(2036/37)
PFMv7.1
(2037/38)
Change Change
(%)
Commute 157,415 157,415 0 0.0% 163,791 164,634 843 0.5%
Business 321,049 321,049 0 0.0% 336,191 338,244 2,053 0.6%
Leisure 894,997 894,997 0 0.0% 952,827 958,903 6,076 0.6%
Total 1,373,461 1,373,461 0 0.0% 1,452,809 1,461,781 8,972 0.6%

PLANET Framework model: PFM v7.1 Demand forecasting report
35
Table 27: Growth in highway demand forecasts from the Base Year in PFMv7.1.
Matrix
Description
2014/15 2026/27 2037/38 Growth from Base
2014/15 -2026/27 2014/15 – 2037/38
Commute 148,215 157,415 164,634 6% 11%
Business 300,091 321,049 338,244 7% 13%
Leisure 813,608 894,997 958,903 10% 18%
Total 1,261,914 1,373,461 1,461,781 9% 16%
5.3 Future Year Highway Preload Flows
5.3.1 In PFM, short-distance trips and goods vehicles are represented as pre-loaded flows on the PLD highway network as it is assumed that these trips will not transfer onto the
strategic rail network. This ensures that the total modelled link flows in the PLD highway model lead to realistic travel costs for use in the demand model. Future year preloads are calculated by forecasting the base year preloads.
5.3.2 Base year preloads are calculated by subtracting the total assigned volumes for the highway network link in the base year model from the observed count value for that link. This process is documented in full in the PFM model description report.
Factoring Base Preloads for Future Years
5.3.3 The methodology used to calculate the future year preloads is consistent with that followed for previous versions of the model and utilises the DfT’s National Transport Model (NTM) traffic forecast component of the Road Transport Forecasts 2015 (RTF15). Previous versions of the PFM used RTF11 forecasts to calculate the future year preloads.
5.3.4 RTF15 is a new forecasting approach for the NTM compared to previous versions of the RTF in which different forecast scenarios are developed motivated by uncertainty around how some trends will carry on into the future as well as uncertainty around the key economic and demographic inputs. Scenario 1 within RTF15 has been utilised in order to perform the preload factoring. A description of scenario 1 as provided by the DfT is as follows:
In scenario 1 we have used the same assumptions as we did in Road Traffic Forecasts 2013 (RTF13), with some slight improvements. In this scenario we assume that the number of trips people make remains constant at the historic average, that incomes and costs affect travel choices in the same way as previously modelled, and use Office for
Budget Responsibility (OBR) and Department of Energy and Climate Change (DECC) central forecasts for future changes in incomes and fuel prices.
5.3.5 The forecasts for car and other vehicle travel by road type in England and Wales as provided by RTF15 scenario 1 are presented in Table 28. It should be noted that the DfT provide forecasts for 2010 – 2040 in five-yearly intervals. The forecasts for other years have been derived by interpolation of these values. Motorway, trunk and principal road forecasts are used. A total is calculated from these road types and a growth factor calculated from 2014/15 t0 2026/27 and 2037/38.

PLANET Framework model: PFM v7.1 Demand forecasting report
36
5.3.6 The growth in total traffic from 2014/15 for car and other vehicles is applied to the corresponding base year preload value to obtain future year highway preloads. These
values are assigned to the future year highway networks and input to the forecast PFM.
Table 28: RTF15 traffic forecasts in billion vehicle miles by road and vehicle type
Year Motorway Trunk Principal Total Growth in
Total Traffic
from 2014/15
Cars 2014/15 42.7 29.7 74.3 146.8 -
2026/27 49.8 34.4 84.5 168.7 15%
2037/38 56.3 38.6 93.8 188.8 29%
Other
Vehicles
2014/15 14.3 8.6 17.0 39.9 -
2026/27 17.1 10.4 20.6 48.1 20%
2037/38 19.7 12.0 23.9 55.6 39%
5.4 Future Year Highway Occupancy Factors
5.4.1 The future year highway occupancy factors are unchanged from the base year highway occupancy factors. The base year factors have been applied in the future year following advice from the DfT contained within the report2 ‘Understanding and Valuing Impacts of Transport Investment; October 2015’.
2https://www.gov.uk/government/uploads/system/uploads/attachment_data/file/470998/Understanding_and_Valuing_Impacts_of_Transport_Investment.pdf
PLANET Framework model: PFM v7.1 Demand forecasting report
37
6 PFMv7.1 Forecast Air Demand 6.1 Introduction
6.1.1 The air mode within the PFM exists within the PLD sub-model, and represents domestic travel by air within Great Britain for Business and Leisure journey purposes. For PFMv7.1, only the forecast air demand for the second forecast year has been updated following the migration from 2036/37 to 2037/38, therefore the air demand for the first forecast year remains unchanged in 2026/27.
6.1.2 Future year air demand for PLD is informed by the DfT’s Aviation Model. The DfT provide air demand and supply-side forecasts for the designated future years required by the PFM. The methodology used to create the demand forecasts for the PFM within the DfT Aviation Model is described in Appendix B.
6.1.3 The remainder of this chapter presents the methodology to process the output data from the DfT’s Aviation Model into inputs for the PFM, along with the resulting air demand and supply side forecasts. In particular:
This methodology is the same as that which has been applied in previous versions of the PFM;
The DfT have supplied data for 2037/38 – the demand for 2026/27 is the same
as the demand that was incorporated into PFMv6.1c, as a result, the future year air demand forecasts for 2026/27 are the same; and,
Using the data supplied by the DfT for 2037/38, there is a small increase in the future year air forecasts in line with the one-year of additional growth from
migrating the second forecast year to 2037/38. There are some small changes to available flight routes in the second forecast year.
6.2 Future Year Air Demand Forecasts
6.2.1 Following the methodology described in Appendix B, the DfT supplied the following data for the aviation demand forecasts:
Latest annual aviation demand forecasts for 2037/38. The data in the DfT Aviation Model is in calendar years rather than financial years. The aviation demand matrices were grouped by journey purpose (business and leisure) and distributed to National Air Passenger Allocation Model (NAAM) zone pairs; and,
The correspondences between NAAM zones and Long Distance Model (LDM) zones in an excel spreadsheet.
6.2.2 To derive the air demand matrices for business and leisure purposes the aviation demand forecasts at NAAM level are first mapped to LDM zones and then to PLD zones. The resulting demand matrices were divided by an annualisation factor of 313 – which was provided by the DfT – to obtain 16-hour daily demand matrices at PLD zone level. The following assumptions were applied during this process:

PLANET Framework model: PFM v7.1 Demand forecasting report
38
As the DfT Aviation Model matrices represent average annual demand it was
assumed that over the course of a year demand will have balanced levels of
origin and destination trip totals. Any asymmetry found between origins and destinations was removed by averaging the number of trips in each direction; and,
In the correspondences between LDM and PLD zones, there are several instances where multiple PLD zones correspond within a single LDM zone. In this case, only the PLD zone with the majority weighting was regarded as the corresponding PLD zone for this LDM zone. This assumption has been made as in most situations the majority zone had a weighting greater than 95%.
6.2.3 The resulting air demand forecasts for 2026/27 and 2037/38 are presented in Table 29 and compared back to those used within PFMv6.1c.
Table 29: Future Year Air Demand Forecasts
Matrix
Description
2026/27 2nd Forecast Year
PFMv6.1c PFMv7.1 Change Change
(%)
PFMv6.1c
(2036/37)
PFMv7.1
(2037/38)
Change Change
(%)
Business 19,769 19,769 0 0.0% 24,684 25,167 483 2.0%
Leisure 15,082 15,082 0 0.0% 18,718 19,069 351 1.9%
Total 34,851 34,851 0 0.0% 43,402 44,236 834 1.9%
6.2.4 The revised air demand forecasts for 2026/27 show no change from the PFMv6.1c forecasts at matrix total level. There is a small increase of around 2% in the air
demand forecasts for the second modelled year which is explained by an additional year of growth in the second forecast year in PFMv7.1.
6.2.5 The growth in air demand from the base year 2014/15 is presented in Table 30. Overall there is almost 20% growth in the air demand by 2026/27 and over 50% growth in air demand forecasts by 2037/38. There is slightly faster growth in business trips than leisure trips. The forecasts suggest that there is on average around 2% growth per annum in air demand and therefore the change in air demand in the second forecast year is consistent with the second forecast year changing by one year.
Table 30: Growth in Air Demand forecasts from Base Year
Matrix Description 2014/15 2026/27 2037/38 Growth from Base
2014/15 -2026/27 2014/15 – 2037/38
Business 16,333 19,729 25,167 21% 54%
Leisure 12,898 15,082 19,069 17% 48%
Total 29,231 34,851 44,236 19% 51%
6.2.6 A comparison between the air demand forecasts for PFMv6.1c and PFMv7.1 has been carried out at GOR sector level for the second forecast year in order to understand if

PLANET Framework model: PFM v7.1 Demand forecasting report
39
there are greater changes in the distribution of future year air demand. This analysis is presented in Appendix B. This shows that the most significant increases in demand
are for trips to and from Scotland, especially between Scotland and London, the South East and the South West. These changes are the largest in magnitude terms and are key flows for HS2.
6.3 Air Supply Forecasts
6.3.1 The PLD model requires the following data in order to be able to derive air transit lines that model air trips on domestic flights within mainland UK:
Headway: air headways were calculated from the aviation supply data which the DfT supplied. The aviation supply matrices included the number of flights per year between each modelled airport in PLD model for each forecast year;
Business fares, updated fares data for business trips has not been provided by the DfT;
Leisure fares, updated fares data for leisure trips has not been provided by the DfT; and
Journey time data, this data has also not been provided by the DfT.
6.3.2 The flights per year data is converted to flights per day using the same annualisation factor that is used in the air demand derivation, and the airports are mapped to nodes within the PLD network to identify the route within the model that each transit line will take. Table 31 shows the airports that are modelled within the PFM. The following assumptions are applied in the processing of the aviation supply data:
The annualisation factor was assumed to be 313;
The number of minutes per day was assumed to be 960 (i.e. flights only take place during the 16hour day modelled in PLD); and,
Any airport-airport flows with a headway larger than 1200 minutes, i.e. less than one flight a day, were not included in PLD.
6.3.3 The following assumptions were applied in deriving the associated journey time and fare for any new transit lines that had not previously been modelled:
Every flight has the same journey time as its reverse flight; if a journey time
was missing for one forecast year but available in the other, the journey time was approximated using this value;
Each airport in London has the same journey time to/from other airports outside of London;
The journey time for Inverness to Cardiff was approximated using the Aberdeen to Cardiff journey time and applying an additional 5 minutes’ journey time consistent with the difference in journey time between Birmingham – Aberdeen and Birmingham – Inverness flights. A flight time could not be taken form the online flight timetable as direct flights are not currently in operation; and,

PLANET Framework model: PFM v7.1 Demand forecasting report
40
The fares data previously provided by the DfT was derived using a distance
function therefore where fares were missing for new transit line, the fare was approximated using the fare corresponding to a flight of similar length.
Table 31: Mainland UK Airports Modelled within PLD
Airport IATA Airport IATA
Aberdeen Airport ABZ Liverpool Airport LPL
Birmingham Airport BHX London City Airport LCY
Bristol Airport BRS Luton Airport LTN
Cardiff Airport CWL Manchester Airport MAN
East Midlands Airport EMA Newcastle Airport NCL
Edinburgh Airport EDI Newquay Airport NQY
Exeter Airport EXT Norwich Airport NWI
Gatwick Airport LGW Plymouth Airport PLH
Glasgow Airport GLA Southampton Airport SOU
Heathrow Airport LHR Stansted Airport STN
Humberside Airport HUY Blackpool Airport BLK
Inverness Airport INV Prestwick Airport PIK
Leeds/Bradford Airport LBA
6.3.4 There has been no change to the set of air transit lines modelled between PFMv6.1c and PFMv7.1. This is consistent with the air demand data being very similar between these two model versions. Further to this there have been small fluctuations in the flights per year between the airports but these changes do not have a significant impact to the number of flights per day and hence the headway modelled in the PFM.

PLANET Framework model: PFM v7.1 Demand forecasting report
41
7 Quality Assurance 7.1.1 This section details the Quality Assurance undertaken on the model development
documented within this note. It provides details on the checks that have been undertaken in relation to the theory, the implementation and the results of the changes. These are standard levels of checking used on model versions:
Yellow Check – This includes checks of the setup of model runs, checks that model run outputs have been produced correctly and checks that results from the model are sensible through the key indicators form;
Orange Check – This is a more detailed check of the model inputs and outputs, and changes to model code (macros and batch files, etc.);
Red Check – This involves a more wide-ranging QA of all aspects of the model
with associated check logs. This also details checks of the key files within the modelling framework; and,
Further to these types of check, additional checks can be performed by HS2
Ltd themselves, HS2 Ltd’s auditor or via an independent peer review. These are documented separately.
7.1.2 The base and future year matrices that have been created within this round of model development have been subjected to an orange level of checking, as the resulting future year matrices will be used as inputs to PFMv7.1.
7.1.3 A member of the model development team, not originally involved in the base and future year matrix build processes, has independently checked and verified the
procedure used, and the resulting matrices, to ensure that they have been built using the prescribed methodology contained within this note.
7.1.4 In addition, HS2 Ltd’s independent auditors have performed further checks on the base and future year matrices to ensure the validity of the resulting forecast matrices which will be used within the PFM.
7.1.5 Following the Quality Assurance procedures described above we recommend that the future year matrices are fit for the purpose of forecasting future year rail demand impacts for the HS2 scheme.

PLANET Framework model: PFM v7.1 Demand forecasting report
42
Appendix A: Regional Variation in Impacts to PLD Rail Demand

PLANET Framework model: PFM v7.1 Demand forecasting report
43
Table A1. - Regional Change in PLD Rail Demand Forecasts in 2026/27
Commuting
Sco
tlan
d
No
rth
Eas
t
No
rth
We
st
Yo
rksh
ire
&
Hu
mb
er
Wal
es
We
st M
idla
nd
s
East
Mid
lan
ds
Sou
th W
est
Sou
th E
ast
Lon
do
n
East
ern
Tota
l
Scotland 0 -2 -2 -2 0 -0 0 -0 0 -8 -0 -13
North East -2 237 1 13 0 0 0 0 0 -10 0 240
North West -2 1 -58 -43 7 -8 -5 -0 -1 -57 -0 -166
Yorkshire & Humber -2 13 -42 48 -0 2 3 -1 -1 -35 -0 -16
Wales 0 0 7 -0 12 1 0 10 1 -12 0 17
West Midlands -0 0 -6 2 1 -31 12 7 -5 -112 2 -131
East Midlands 0 0 -5 3 0 10 19 -0 -3 -292 -6 -272
South West -0 0 -0 -1 9 5 -0 8 1 -11 0 12
South East 0 0 -1 -1 0 -7 -3 1 0 0 0 -11
London -9 -7 -52 -34 -12 -118 -270 -11 0 0 0 -513
Eastern -0 0 -0 -0 0 1 -6 0 0 0 0 -5
Total -14 243 -158 -15 17 -145 -249 14 -8 -538 -5 -858
Business
Sco
tlan
d
No
rth
Eas
t
No
rth
We
st
Yo
rksh
ire
&
Hu
mb
er
Wal
es
We
st
Mid
lan
ds
East
Mid
lan
ds
Sou
th W
est
Sou
th E
ast
Lon
do
n
East
ern
Tota
l
Scotland 0 -19 -11 -13 -0 -2 -4 -0 -3 -138 -2 -193
North East -14 17 -2 -6 0 1 -1 -0 -2 -137 -1 -145
North West -9 -3 -23 -55 -1 -14 -2 -4 -21 -658 -4 -795
Yorkshire & Humber -11 -9 -55 -8 -0 1 -9 -3 -12 -454 -10 -570
Wales -0 0 -1 -0 1 -1 -0 -2 -4 -135 -0 -142
West Midlands -1 2 -9 2 -0 -9 2 2 -22 -601 1 -634
East Midlands -3 -1 -2 -11 -0 -6 -6 -2 -9 -522 -8 -570
South West -0 -0 -4 -3 -1 -2 -2 -1 -1 -39 -0 -54
South East -4 -3 -27 -15 -6 -38 -10 -1 0 0 0 -103
London -141 -144 -702 -491 -143 -667 -544 -42 0 0 0 -2,874
Eastern -2 -1 -4 -10 -0 -1 -7 -0 0 0 0 -26
Total -186 -161 -840 -610 -152 -738 -584 -54 -74 -2,685 -25 -6,107
Leisure
Sco
tlan
d
No
rth
Eas
t
No
rth
We
st
Yo
rksh
ire
& H
um
be
r
Wal
es
We
st
Mid
lan
ds
East
Mid
lan
ds
Sou
th
We
st
Sou
th E
ast
Lon
do
n
East
ern
Tota
l
Scotland 0 -37 -57 -32 -1 -5 -7 -3 -11 -238 -11 -403
North East -24 74 -1 -12 0 2 -1 -1 -4 -106 -1 -73
North West -46 -2 -86 -64 1 -36 -12 -6 -42 -400 -7 -701
Yorkshire & Humber -26 -15 -56 -18 -1 -2 -12 -5 -18 -333 -14 -501
Wales -1 0 -1 -1 6 -3 -1 -1 -10 -117 -1 -128
West Midlands -2 2 -36 -1 -1 -48 -13 -4 -44 -436 -3 -587
East Midlands -7 -1 -13 -14 -1 -20 -34 -5 -25 -386 -25 -530
South West -3 -1 -6 -5 0 -6 -5 -6 -2 -31 -0 -65
South East -13 -5 -50 -21 -13 -57 -30 -3 0 0 0 -190
London -231 -106 -407 -337 -120 -454 -393 -33 0 0 0 -2,080
Eastern -8 -1 -7 -13 -0 -3 -24 -0 0 0 0 -57
Total -361 -92 -719 -519 -130 -632 -531 -67 -157 -2,047 -61 -5,316
TOTAL
Sco
tlan
d
No
rth
Eas
t
No
rth
We
st
Yo
rksh
ire
& H
um
be
r
Wal
es
We
st
Mid
lan
ds
East
Mid
lan
ds
Sou
th
We
st
Sou
th E
ast
Lon
do
n
East
ern
Tota
l
Scotland 0 -58 -69 -46 -1 -8 -11 -4 -15 -384 -13 -609
North East -41 329 -2 -5 0 3 -1 -1 -6 -252 -2 23
North West -57 -3 -167 -162 6 -57 -20 -11 -65 -1,116 -11 -1,662
Yorkshire & Humber -39 -11 -153 22 -1 0 -18 -8 -31 -823 -24 -1,088
Wales -1 0 5 -1 19 -3 -1 6 -13 -264 -1 -253
West Midlands -3 4 -51 3 -1 -88 0 4 -71 -1,149 -0 -1,352
East Midlands -10 -1 -20 -23 -1 -16 -20 -7 -36 -1,200 -38 -1,371
South West -3 -1 -11 -9 8 -3 -7 1 -2 -81 -0 -107
South East -16 -8 -78 -38 -18 -101 -42 -2 0 0 0 -304
London -381 -257 -1,161 -862 -275 -1,238 -1,208 -86 0 0 0 -5,468
Eastern -11 -3 -11 -23 -1 -3 -37 -0 0 0 0 -89
Total -561 -10 -1,717 -1,144 -265 -1,514 -1,364 -107 -239 -5,270 -90 -12,280

PLANET Framework model: PFM v7.1 Demand forecasting report
44
Table A2. - Regional Change (%) in PLD Rail Demand Forecasts in 2026/27
Commuting
Sco
tlan
d
No
rth
Eas
t
No
rth
We
st
Yo
rksh
ire
&
Hu
mb
er
Wal
es
We
st M
idla
nd
s
East
Mid
lan
ds
Sou
th W
est
Sou
th E
ast
Lon
do
n
East
ern
Tota
l
Scotland - -1% -1% -1% 0% -2% 1% 0% 0% -4% -1% -1%
North East -1% 3% 1% 1% 1% 1% 1% 1% 1% -4% 1% 2%
North West -1% 1% 0% -1% 1% 0% -1% -1% -1% -4% 0% -1%
Yorkshire & Humber -1% 1% -1% 1% 0% 1% 0% -3% -1% -4% -1% 0%
Wales 0% 1% 1% 0% 1% 0% 1% 0% 1% -4% 1% 0%
West Midlands -2% 1% 0% 1% 1% -1% 0% 1% -1% -3% 0% -1%
East Midlands 1% 1% -1% 0% 1% 0% 1% 0% -1% -4% -1% -2%
South West 0% 1% -1% -3% 0% 1% 0% 1% 1% -4% 1% 0%
South East 0% 1% -1% -2% 1% -1% -1% 1% - - - -1%
London -4% -3% -4% -4% -4% -3% -4% -4% - - - -4%
Eastern -1% 1% 0% 0% 1% 0% -1% 1% - - - 0%
Total -2% 2% -1% 0% 0% -1% -1% 0% 0% -4% 0% -1%
Business
Sco
tlan
d
No
rth
Eas
t
No
rth
We
st
Yo
rksh
ire
&
Hu
mb
er
Wal
es
We
st
Mid
lan
ds
East
Mid
lan
ds
Sou
th W
est
Sou
th E
ast
Lon
do
n
East
ern
Tota
l
Scotland - -2% -1% -3% -1% -2% -3% -2% -4% -8% -3% -4%
North East -1% 1% 0% 0% 0% 1% 0% 0% -1% -5% 0% -2%
North West -1% 0% 0% -1% 0% -1% -1% -1% -2% -6% -1% -3%
Yorkshire & Humber -2% -1% -1% 0% 0% 0% -1% -1% -2% -6% -1% -3%
Wales -1% 0% 0% 0% 0% 0% 0% 0% -1% -6% 0% -3%
West Midlands -1% 1% 0% 0% 0% -1% 0% 0% -1% -5% 0% -3%
East Midlands -2% 0% -1% -1% 0% 0% -1% -1% -1% -6% -1% -4%
South West -2% -1% -1% -1% 0% 0% -1% 0% -1% -6% -1% -1%
South East -4% -2% -3% -3% -2% -2% -2% -1% - - - -2%
London -8% -5% -6% -6% -6% -5% -6% -6% - - - -6%
Eastern -2% 0% -1% -1% 0% 0% -1% -1% - - - -1%
Total -4% -2% -3% -3% -3% -3% -4% -1% -2% -6% -1% -4%
Leisure
Sco
tlan
d
No
rth
Eas
t
No
rth
We
st
Yo
rksh
ire
& H
um
be
r
Wal
es
We
st
Mid
lan
ds
East
Mid
lan
ds
Sou
th
We
st
Sou
th E
ast
Lon
do
n
East
ern
Tota
l
Scotland - -2% -2% -2% -1% -1% -2% -2% -3% -8% -2% -4%
North East -1% 1% 0% 0% 0% 1% 0% 0% -1% -5% 0% 0%
North West -2% 0% 0% -1% 0% -1% -1% -1% -2% -6% -1% -1%
Yorkshire & Humber -2% -1% -1% 0% 0% 0% 0% -1% -2% -6% -1% -1%
Wales -1% 0% 0% 0% 0% 0% 0% 0% -1% -5% 0% -1%
West Midlands 0% 1% -1% 0% 0% -1% 0% 0% -1% -5% -1% -2%
East Midlands -2% 0% -1% -1% 0% -1% -1% -1% -2% -6% -1% -2%
South West -2% 0% -1% -1% 0% 0% -1% 0% -1% -6% -1% -1%
South East -3% -2% -3% -3% -1% -2% -2% -1% - - - -2%
London -8% -5% -6% -6% -6% -5% -7% -7% - - - -6%
Eastern -2% -1% -1% -1% 0% 0% -1% -1% - - - -1%
Total -3% -1% -1% -2% -1% -2% -2% -1% -2% -6% -1% -2%
TOTAL
Sco
tlan
d
No
rth
Eas
t
No
rth
We
st
Yo
rksh
ire
& H
um
be
r
Wal
es
We
st
Mid
lan
ds
East
Mid
lan
ds
Sou
th
We
st
Sou
th E
ast
Lon
do
n
East
ern
Tota
l
Scotland - -2% -2% -2% -1% -1% -2% -2% -3% -8% -2% -4%
North East -1% 2% 0% 0% 0% 1% 0% 0% -1% -5% 0% 0%
North West -1% 0% 0% -1% 0% -1% -1% -1% -2% -6% -1% -1%
Yorkshire & Humber -2% 0% -1% 0% 0% 0% 0% -1% -2% -6% -1% -2%
Wales -1% 0% 0% 0% 0% 0% 0% 0% -1% -5% 0% -1%
West Midlands -1% 1% -1% 0% 0% -1% 0% 0% -1% -5% 0% -2%
East Midlands -2% 0% -1% 0% 0% 0% 0% -1% -1% -5% -1% -3%
South West -2% 0% -1% -1% 0% 0% -1% 0% 0% -6% -1% -1%
South East -3% -2% -3% -2% -1% -2% -2% -1% - - - -2%
London -8% -5% -6% -6% -6% -5% -6% -6% - - - -6%
Eastern -2% 0% -1% -1% 0% 0% -1% -1% - - - -1%
Total -3% 0% -2% -2% -1% -2% -3% -1% -2% -5% -1% -2%

PLANET Framework model: PFM v7.1 Demand forecasting report
45
Table A3. - Regional Change in PLD Rail Demand Forecasts in 2037/38
Commuting
Sco
tlan
d
No
rth
Eas
t
No
rth
We
st
Yo
rksh
ire
&
Hu
mb
er
Wal
es
We
st M
idla
nd
s
East
Mid
lan
ds
Sou
th W
est
Sou
th E
ast
Lon
do
n
East
ern
Tota
l
Scotland 0 -19 -14 -12 -1 -1 -0 -0 -1 -24 -1 -73
North East -19 -305 -5 -55 -0 -1 -1 -0 -0 -28 -0 -415
North West -15 -5 -974 -261 -72 -88 -27 -1 -4 -171 -2 -1,621
Yorkshire & Humber -12 -55 -259 -485 -1 -5 -64 -3 -5 -122 -5 -1,016
Wales -1 -0 -70 -1 -158 -16 -1 -135 -3 -46 -1 -431
West Midlands -2 -1 -83 -4 -16 -274 -80 -26 -37 -433 -10 -965
East Midlands -0 -1 -27 -63 -1 -82 -60 -2 -11 -911 -30 -1,187
South West -0 -0 -1 -3 -139 -28 -2 -117 -6 -43 -0 -340
South East -1 -0 -4 -5 -3 -38 -11 -6 0 0 0 -69
London -25 -26 -168 -123 -45 -436 -908 -44 0 0 0 -1,776
Eastern -1 -0 -2 -4 -1 -10 -30 -0 0 0 0 -49
Total -76 -413 -1,608 -1,016 -436 -980 -1,183 -334 -67 -1,778 -49 -7,940
Business
Sco
tlan
d
No
rth
Eas
t
No
rth
We
st
Yo
rksh
ire
&
Hu
mb
er
Wal
es
We
st
Mid
lan
ds
East
Mid
lan
ds
Sou
th W
est
Sou
th E
ast
Lon
do
n
East
ern
Tota
l
Scotland 0 -117 -99 -58 -3 -11 -14 -2 -9 -343 -7 -663
North East -112 -153 -59 -131 -1 -13 -17 -4 -14 -418 -15 -939
North West -101 -59 -480 -380 -59 -180 -34 -42 -71 -1,931 -27 -3,364
Yorkshire & Humber -60 -134 -385 -234 -6 -50 -94 -30 -53 -1,480 -55 -2,582
Wales -4 -1 -64 -7 -48 -33 -8 -80 -32 -509 -9 -794
West Midlands -10 -12 -170 -47 -30 -86 -76 -67 -116 -2,100 -25 -2,739
East Midlands -14 -17 -33 -95 -7 -89 -51 -20 -39 -1,514 -35 -1,916
South West -2 -4 -42 -30 -75 -78 -21 -41 -8 -143 -1 -445
South East -9 -14 -72 -52 -29 -126 -39 -7 0 0 0 -349
London -325 -433 -1,943 -1,459 -458 -2,028 -1,481 -136 0 0 0 -8,262
Eastern -5 -15 -23 -46 -7 -25 -31 -1 0 0 0 -152
Total -640 -960 -3,370 -2,541 -724 -2,719 -1,865 -432 -343 -8,439 -174 -22,205
Leisure
Sco
tlan
d
No
rth
Eas
t
No
rth
We
st
Yo
rksh
ire
& H
um
be
r
Wal
es
We
st
Mid
lan
ds
East
Mid
lan
ds
Sou
th
We
st
Sou
th E
ast
Lon
do
n
East
ern
Tota
l
Scotland 0 -208 -330 -157 -10 -45 -34 -17 -37 -588 -35 -1,460
North East -194 -809 -107 -282 -5 -18 -24 -13 -26 -321 -17 -1,815
North West -320 -109 -2,305 -829 -312 -454 -129 -72 -161 -1,197 -55 -5,942
Yorkshire & Humber -155 -289 -833 -1,030 -28 -102 -256 -50 -81 -1,065 -90 -3,979
Wales -10 -6 -329 -30 -365 -219 -20 -294 -84 -446 -16 -1,819
West Midlands -41 -18 -454 -96 -205 -476 -269 -154 -228 -1,443 -39 -3,422
East Midlands -33 -24 -128 -254 -18 -279 -294 -45 -117 -1,087 -119 -2,397
South West -16 -13 -72 -49 -278 -159 -45 -191 -25 -111 -2 -961
South East -35 -25 -157 -76 -75 -226 -116 -23 0 0 0 -732
London -543 -317 -1,128 -979 -398 -1,356 -1,043 -107 0 0 0 -5,870
Eastern -25 -13 -47 -73 -12 -34 -105 -2 0 0 0 -311
Total -1,373 -1,829 -5,889 -3,854 -1,706 -3,367 -2,336 -969 -758 -6,257 -372 -28,709
TOTAL
Sco
tlan
d
No
rth
Eas
t
No
rth
We
st
Yo
rksh
ire
& H
um
be
r
Wal
es
We
st
Mid
lan
ds
East
Mid
lan
ds
Sou
th
We
st
Sou
th E
ast
Lon
do
n
East
ern
Tota
l
Scotland 0 -343 -443 -226 -14 -57 -49 -19 -48 -954 -42 -2,195
North East -326 -1,267 -171 -469 -6 -31 -41 -18 -40 -767 -32 -3,169
North West -437 -172 -3,759 -1,470 -443 -721 -190 -115 -236 -3,299 -84 -10,928
Yorkshire & Humber -227 -479 -1,476 -1,750 -36 -156 -414 -82 -140 -2,668 -150 -7,576
Wales -15 -7 -463 -38 -571 -269 -28 -509 -118 -1,001 -25 -3,045
West Midlands -53 -30 -707 -147 -252 -836 -424 -248 -381 -3,975 -74 -7,126
East Midlands -47 -42 -188 -412 -27 -451 -405 -67 -167 -3,511 -184 -5,500
South West -18 -18 -116 -81 -491 -265 -68 -350 -38 -296 -4 -1,746
South East -44 -40 -233 -134 -107 -390 -166 -36 0 0 0 -1,150
London -893 -776 -3,239 -2,561 -901 -3,820 -3,432 -287 0 0 0 -15,908
Eastern -30 -28 -72 -123 -19 -69 -166 -3 0 0 0 -512
Total -2,089 -3,202 -10,867 -7,411 -2,867 -7,065 -5,384 -1,735 -1,167 -16,473 -594 -58,854

PLANET Framework model: PFM v7.1 Demand forecasting report
46
Table A4. - Regional Change (%) in PLD Rail Demand Forecasts in 2037/38
Commuting
Sco
tlan
d
No
rth
Eas
t
No
rth
We
st
Yo
rksh
ire
&
Hu
mb
er
Wal
es
We
st M
idla
nd
s
East
Mid
lan
ds
Sou
th W
est
Sou
th E
ast
Lon
do
n
East
ern
Tota
l
Scotland - -6% -6% -7% -8% -6% -3% -6% -3% -9% -4% -7%
North East -6% -3% -3% -5% -7% -4% -3% -4% -3% -9% -2% -4%
North West -6% -3% -4% -5% -7% -4% -3% -5% -4% -9% -3% -4%
Yorkshire & Humber -7% -5% -5% -6% -8% -3% -4% -8% -6% -10% -5% -6%
Wales -9% -7% -7% -8% -11% -7% -5% -6% -4% -11% -5% -7%
West Midlands -7% -4% -4% -3% -6% -6% -2% -3% -3% -9% -2% -5%
East Midlands -4% -3% -3% -4% -5% -2% -1% -4% -2% -9% -3% -6%
South West -6% -4% -5% -9% -6% -4% -4% -6% -5% -12% -5% -6%
South East -3% -3% -4% -6% -5% -3% -2% -5% - - - -4%
London -9% -9% -9% -10% -11% -9% -9% -12% - - - -9%
Eastern -4% -2% -3% -4% -5% -2% -3% -4% - - - -3%
Total -7% -4% -4% -6% -8% -6% -6% -6% -3% -9% -3% -6%
Business
Sco
tlan
d
No
rth
Eas
t
No
rth
We
st
Yo
rksh
ire
&
Hu
mb
er
Wal
es
We
st
Mid
lan
ds
East
Mid
lan
ds
Sou
th W
est
Sou
th E
ast
Lon
do
n
East
ern
Tota
l
Scotland - -8% -7% -9% -9% -7% -8% -9% -8% -14% -6% -10%
North East -8% -7% -7% -8% -8% -5% -7% -7% -6% -11% -4% -9%
North West -7% -7% -7% -8% -9% -7% -6% -7% -6% -12% -5% -9%
Yorkshire & Humber -9% -8% -8% -8% -8% -6% -8% -8% -7% -13% -6% -10%
Wales -10% -8% -9% -9% -11% -8% -7% -8% -7% -15% -6% -12%
West Midlands -7% -5% -6% -6% -8% -8% -5% -6% -5% -11% -3% -9%
East Midlands -8% -7% -6% -8% -7% -6% -6% -7% -5% -13% -5% -10%
South West -9% -8% -7% -8% -7% -7% -7% -9% -8% -16% -7% -9%
South East -7% -6% -6% -7% -6% -5% -5% -7% - - - -6%
London -13% -11% -12% -13% -14% -11% -12% -15% - - - -12%
Eastern -4% -4% -4% -5% -5% -3% -4% -6% - - - -4%
Total -10% -9% -9% -10% -11% -9% -10% -9% -6% -12% -5% -10%
Leisure
Sco
tlan
d
No
rth
Eas
t
No
rth
We
st
Yo
rksh
ire
& H
um
be
r
Wal
es
We
st
Mid
lan
ds
East
Mid
lan
ds
Sou
th
We
st
Sou
th E
ast
Lon
do
n
East
ern
Tota
l
Scotland - -8% -9% -9% -10% -7% -8% -9% -7% -14% -6% -10%
North East -8% -7% -7% -8% -8% -5% -7% -8% -6% -12% -4% -8%
North West -9% -7% -8% -8% -9% -8% -7% -8% -7% -12% -5% -8%
Yorkshire & Humber -9% -9% -8% -8% -9% -7% -7% -8% -7% -14% -6% -9%
Wales -10% -9% -9% -9% -11% -8% -8% -8% -7% -14% -6% -10%
West Midlands -6% -5% -8% -6% -8% -8% -6% -7% -6% -12% -5% -8%
East Midlands -8% -7% -7% -7% -7% -6% -6% -8% -6% -13% -5% -8%
South West -9% -8% -8% -8% -7% -7% -8% -9% -8% -16% -7% -8%
South East -7% -6% -6% -7% -6% -5% -6% -8% - - - -6%
London -14% -12% -12% -13% -14% -12% -12% -15% - - - -12%
Eastern -4% -4% -5% -5% -5% -4% -4% -6% - - - -5%
Total -10% -8% -8% -9% -9% -8% -8% -8% -6% -13% -5% -9%
TOTAL
Sco
tlan
d
No
rth
Eas
t
No
rth
We
st
Yo
rksh
ire
& H
um
be
r
Wal
es
We
st
Mid
lan
ds
East
Mid
lan
ds
Sou
th
We
st
Sou
th E
ast
Lon
do
n
East
ern
Tota
l
Scotland - -8% -8% -9% -9% -7% -8% -9% -7% -14% -6% -10%
North East -8% -6% -7% -8% -8% -5% -7% -8% -6% -11% -4% -7%
North West -8% -7% -6% -7% -8% -7% -6% -7% -6% -12% -5% -8%
Yorkshire & Humber -9% -8% -7% -8% -9% -6% -7% -8% -7% -13% -6% -9%
Wales -10% -8% -9% -9% -11% -8% -8% -7% -7% -15% -6% -10%
West Midlands -6% -5% -7% -6% -8% -7% -4% -6% -5% -11% -4% -8%
East Midlands -8% -7% -6% -7% -7% -5% -4% -7% -5% -12% -5% -8%
South West -9% -8% -7% -8% -7% -6% -7% -8% -8% -15% -7% -8%
South East -7% -6% -6% -7% -6% -5% -5% -7% - - - -6%
London -13% -11% -12% -13% -14% -11% -11% -15% - - - -12%
Eastern -4% -4% -4% -5% -5% -3% -4% -6% - - - -4%
Total -10% -7% -8% -9% -9% -8% -8% -8% -6% -12% -5% -9%

PLANET Framework model: PFM v7.1 Demand forecasting report
47
Appendix B: Future Year Air Forecasts DfT Aviation Model
The DfT Aviation Model forecasts the number of passengers passing through UK airports ('terminal passengers') each year and includes UK and foreign residents travelling to, from or within the UK.
Within PFM, air is only represented in the PLD model and only includes those trips made exclusively within Great Britain and therefore excludes movements to/from Northern Ireland, Isle of Man etc. It also excludes interlining trips (international movements where, for outbound journeys, the first leg of the trip is within Great Britain but the second and any subsequent legs
are international). The internal domestic market sector required for PLD accounts for approximately 15% of the passengers in the DfT Aviation Model.
The DfT’s aviation forecasts are primarily prepared to inform long-term strategic aviation policy rather than provide detailed forecasts at every individual airport. The airport and specific market sector level forecasts, such as those used in PLD, are therefore only generated as an intermediate output of the forecasting approach.
Passenger forecasts are generated for each forecast year in two steps:
The first step is the unconstrained national air passenger demand forecasts
which are generated using the National Air Passenger Demand Model (NAPDM). This combines time-series econometric models with projections of
key driving variables, to forecast national air travel demand assuming no UK airport capacity constraints; and
The second step includes the likely impact of future UK airport capacity constraints, allocation of passengers to airports, and translation of passengers into air transport movements. This is modelled using the National Air Passenger Allocation Model. Within this step the unconstrained growth rates from NAPDM are applied to the base air matrices to provide forecast matrices for assignment.
To ensure consistency with the other modal forecasts in the PLD model, unconstrained air demand matrices were required. This is achieved by switching off the airport capacity constraints used in the National Air Passenger Allocation Model (NAPAM) and are, in contrast, an alternative
output to constrained passenger forecasts, showing how UK air passenger numbers would grow if there were no UK airport capacity constraints. It is these unconstrained forecasts that have been used in the PLD model.
The figure below provides an overview of the framework used by the DfT Aviation Model to produce forecasts of UK air passengers.
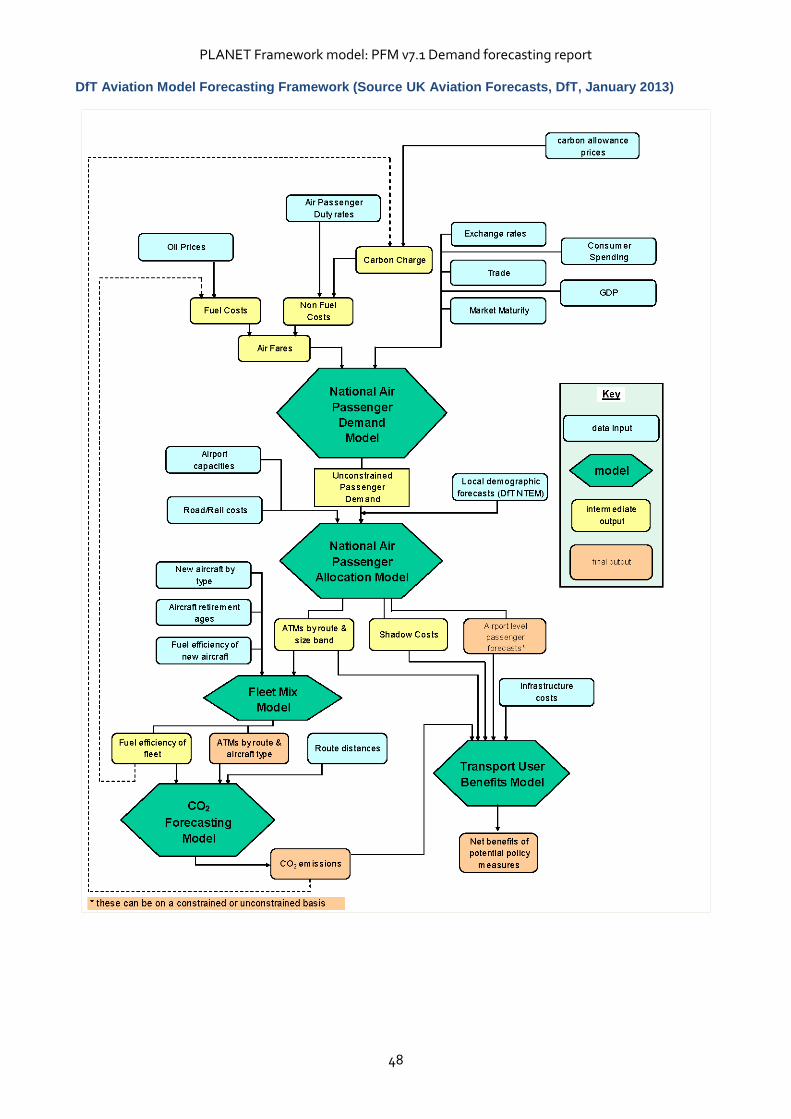
PLANET Framework model: PFM v7.1 Demand forecasting report
48
DfT Aviation Model Forecasting Framework (Source UK Aviation Forecasts, DfT, January 2013)

PLANET Framework model: PFM v7.1 Demand forecasting report
49
National Air Passenger Demand Model
The National Air Passenger Demand Model is used to forecast the number of UK air passengers assuming no UK airport capacity constraints. It does this by combining a set of time-series econometric models of past UK air travel demand with projections of key driving variables and assumptions about how the relationship between UK air travel and its key drivers change into the future.
The key drivers vary by market sector. In the leisure sector, consumer spending and air fares have been identified as the key drivers, whilst in the business sectors, GDP and international trade were shown to be the main drivers, with price having a much more limited impact.
The unconstrained demand forecasts from the National Air Passenger Demand Model provide an input to the National Air Passenger Allocation Model.
National Air Passenger Allocation Model
The National Air Passenger Allocation Model comprises several sub-models and routines which are used in combination and iteratively:
The Passenger Airport Choice Model forecasts how passenger demand will split between UK airports;
The Air Transport Movement (ATM) Demand Model translates the passenger demand forecasts for each airport into air traffic movements; and
The Demand Allocation Routine accounts for the likely impact of future UK airport capacity constraints on air transport movements (and thus passengers) at UK airports.
The forecasts provided for PLD were derived from the National Air Passenger Allocation Model but were unconstrained forecasts in that they represent the underlying estimates of demand in the absence of airport capacity constraints.
One of the key features of the National Air Passenger Allocation Model is the ability of the ATM Demand Model to project the availability of routes from each modelled airport. The model assumes that, in line with mainstream economic theory, supply will respond to demand as long as the market is commercially viable.
The ATM Demand Model simulates the introduction of new routes by testing in each forecast year whether sufficient demand exists to make new routes viable from each airport. The test is two-way, so routes can be both opened and withdrawn. Also, airports are tested jointly for new
routes, allowing them to compete with each other. To ensure consistency between the supply and demand in the PLD model, the air supply was updated at the same time as the demand using the aviation model forecasts.
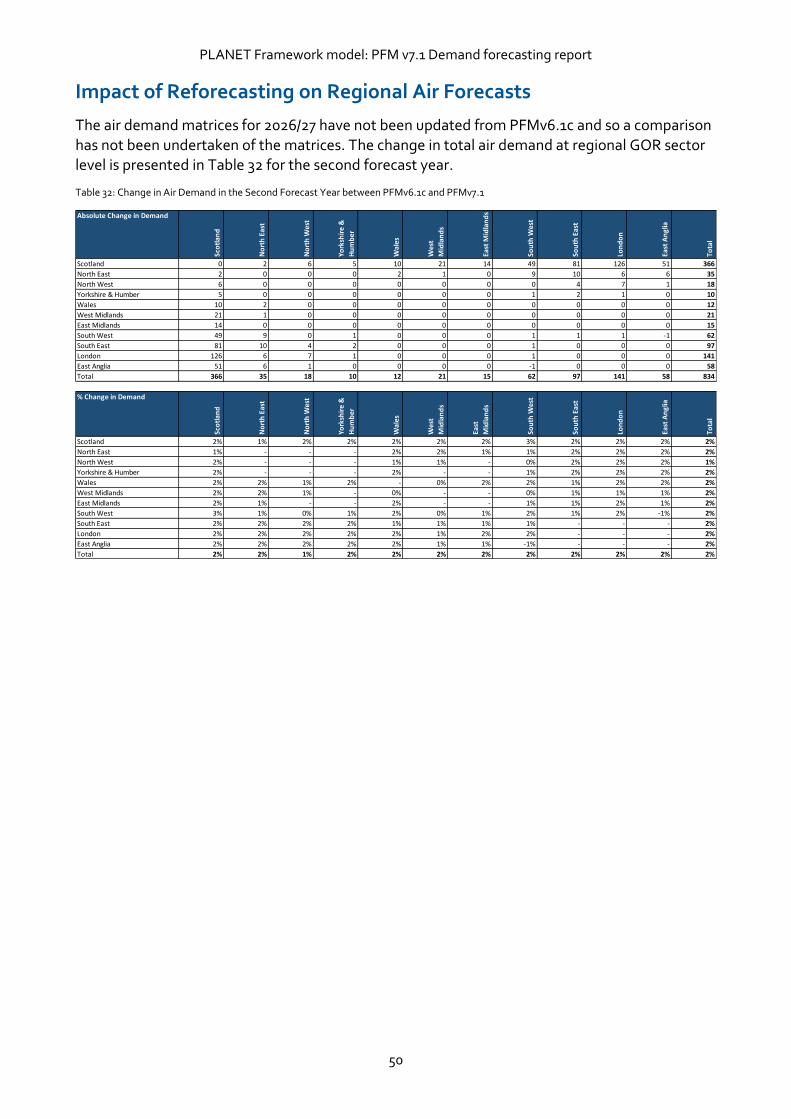
PLANET Framework model: PFM v7.1 Demand forecasting report
50
Impact of Reforecasting on Regional Air Forecasts
The air demand matrices for 2026/27 have not been updated from PFMv6.1c and so a comparison has not been undertaken of the matrices. The change in total air demand at regional GOR sector level is presented in Table 32 for the second forecast year.
Table 32: Change in Air Demand in the Second Forecast Year between PFMv6.1c and PFMv7.1
Absolute Change in DemandSc
otl
and
No
rth
Eas
t
No
rth
Wes
t
York
shir
e &
Hu
mb
er
Wal
es
Wes
t
Mid
lan
ds
East
Mid
lan
ds
Sou
th W
est
Sou
th E
ast
Lon
do
n
East
An
glia
Tota
l
Scotland 0 2 6 5 10 21 14 49 81 126 51 366
North East 2 0 0 0 2 1 0 9 10 6 6 35
North West 6 0 0 0 0 0 0 0 4 7 1 18
Yorkshire & Humber 5 0 0 0 0 0 0 1 2 1 0 10
Wales 10 2 0 0 0 0 0 0 0 0 0 12
West Midlands 21 1 0 0 0 0 0 0 0 0 0 21
East Midlands 14 0 0 0 0 0 0 0 0 0 0 15
South West 49 9 0 1 0 0 0 1 1 1 -1 62
South East 81 10 4 2 0 0 0 1 0 0 0 97
London 126 6 7 1 0 0 0 1 0 0 0 141
East Anglia 51 6 1 0 0 0 0 -1 0 0 0 58
Total 366 35 18 10 12 21 15 62 97 141 58 834
% Change in Demand
Sco
tlan
d
No
rth
Eas
t
No
rth
Wes
t
York
shir
e &
Hu
mb
er
Wal
es
Wes
t
Mid
lan
ds
East
Mid
lan
ds
Sou
th W
est
Sou
th E
ast
Lon
do
n
East
An
glia
Tota
l
Scotland 2% 1% 2% 2% 2% 2% 2% 3% 2% 2% 2% 2%
North East 1% - - - 2% 2% 1% 1% 2% 2% 2% 2%
North West 2% - - - 1% 1% - 0% 2% 2% 2% 1%
Yorkshire & Humber 2% - - - 2% - - 1% 2% 2% 2% 2%
Wales 2% 2% 1% 2% - 0% 2% 2% 1% 2% 2% 2%
West Midlands 2% 2% 1% - 0% - - 0% 1% 1% 1% 2%
East Midlands 2% 1% - - 2% - - 1% 1% 2% 1% 2%
South West 3% 1% 0% 1% 2% 0% 1% 2% 1% 2% -1% 2%
South East 2% 2% 2% 2% 1% 1% 1% 1% - - - 2%
London 2% 2% 2% 2% 2% 1% 2% 2% - - - 2%
East Anglia 2% 2% 2% 2% 2% 1% 1% -1% - - - 2%
Total 2% 2% 1% 2% 2% 2% 2% 2% 2% 2% 2% 2%

High Speed Two (HS2) Limited, Two Snowhill Snow Hill QueenswayBirmingham B4 6GA www.gov.uk/hs2