high-speed microscale optical tracking using digital frequency-domain multiplexing
TRANSCRIPT

IEEE TRANSACTIONS ON INSTRUMENTATION AND MEASUREMENT, VOL. 58, NO. 6, JUNE 2009 1991
High-Speed Microscale Optical Tracking UsingDigital Frequency-Domain Multiplexing
Robert A. MacLachlan, Member, IEEE, and Cameron N. Riviere, Member, IEEE
Abstract—Position-sensitive detectors (PSDs), or lateral-effectphotodiodes, are commonly used for high-speed, high-resolutionoptical position measurement. This paper describes the instru-ment design for multidimensional position and orientation mea-surement based on the simultaneous position measurement ofmultiple modulated sources using frequency-domain-multiplexed(FDM) PSDs. The important advantages of this optical config-uration in comparison with laser/mirror combinations are thatit has a large angular measurement range and allows the useof a probe that is small in comparison with the measurementvolume. We review PSD characteristics and quantitative reso-lution limits, consider the lock-in amplifier measurement sys-tem as a communication link, discuss the application of FDMto PSDs, and make comparisons with time-domain techniques.We consider the phase-sensitive detector as a multirate DSPproblem, explore parallels with Fourier spectral estimation andfilter banks, discuss how to choose the modulation frequenciesand sample rates that maximize channel isolation under designconstraints, and describe efficient digital implementation. Wealso discuss hardware design considerations, sensor calibration,probe construction and calibration, and 3-D measurement bytriangulation using two sensors. As an example, we character-ize the resolution, speed, and accuracy of an instrument thatmeasures the position and orientation of a 10 mm × 5 mmprobe in 5 degrees of freedom (DOF) over a 30-mm cube with4-μm peak-to-peak resolution at 1-kHz sampling.
Index Terms—Computer-aided surgery, lock-in amplification,medical robotics, optical position measurement, phase-sensitivedetector, position-sensitive detectors (PSDs).
I. INTRODUCTION
POSITION-SENSITIVE detectors (PSDs), or lateral-effectphotodiodes, are commonly used for high-speed high-
resolution optical position measurement. PSDs that measurein 2-D are particularly attractive for multidimensional positionmeasurement [1]. When more than 2 degrees of freedom (DOF)are to be measured, instruments generally have multiple PSDsand laser/mirror combinations with distinct optical paths sothat each PSD still measures one spot with 2 DOF [2]. Thisis difficult to arrange when the measurement probe must bemuch smaller than the measurement volume and the angular
Manuscript received October 16, 2007; revised January 22, 2008. Firstpublished October 24, 2008; current version published May 13, 2009. Thiswork was supported in part by the U.S. National Institutes of Health un-der Grant R21 EY016359, by the U.S. National Science Foundation underGrant EEC-9731748, and by the American Society for Laser Medicine andSurgery. The Associate Editor coordinating the review process for this paperwas Dr. Juha Kostamovaara.
The authors are with the Robotics Institute, Carnegie Mellon University,Pittsburgh, PA 15213 USA (e-mail: [email protected]).
Color versions of one or more of the figures in this paper are available onlineat http://ieeexplore.ieee.org.
Digital Object Identifier 10.1109/TIM.2008.2006132
range is large. We address this problem by using a probe withmultiple modulated sources, where each PSD simultaneouslytracks multiple sources, enabled by frequency-domain multi-plexing (FDM).
Analog lock-in amplifiers have often been used with PSDsto measure the position of a modulated source in the presenceof ambient light [3]. Multiple lock-in amplifiers can be usedto implement FDM, but the large amount of hardware requiredhas deterred the use of this technique with PSDs. The lock-inconcept is widely used with other sensors, and many designershave found that when the modulation frequencies are lowenough, it is more economical and more flexible to implementthe phase-sensitive detector in software [4], [5]. However, dueto the assumption of static signals, the frequency responseof the phase-sensitive detector is often neglected. This paperdemonstrates how to efficiently implement a digital phase-sensitive detector with any desired frequency response andevaluate the response tradeoffs in the context of dynamic signalmeasurement.
In Section II, we review the PSD characteristics and quantita-tive resolution limits, consider the lock-in measurement systemas a communication link, discuss the application of FDM toPSDs, and compare this approach with alternative time-domaintechniques in widespread use. As a reference design, Section IIIdescribes an instrument that performs 5-DOF tracking of mi-crosurgical tools. We discuss in detail several difficulties thatare widely encountered in applications of PSDs. Section IVconsiders the lock-in phase-sensitive detector as a multiratedigital signal processing problem, explores the connectionswith Fourier spectral estimation and filter banks, describesthe optimal choice of sampling rate and modulation frequen-cies under design constraints, and discusses the tradeoffs inwindow design as relevant to PSD demodulation. Section Vexperimentally characterizes the performance of the referencedesign (Section III) in terms of the noise spectrum, resolution,bandwidth, drift, effects of multiplexing, workspace size, rel-ative error, probe error, and rotation/translation coupling. TheAppendix describes calibration procedures for the PSD cameraand probe.
II. BACKGROUND
A. PSDs
A PSD is a nonimaging analog optical position sensor. It isa large-area planar photodiode with high-resistivity contacts. Aspot of light creates a photocurrent, and the contact resistanceforms a current divider that splits the current between two
0018-9456/$25.00 © 2008 IEEE
1992 IEEE TRANSACTIONS ON INSTRUMENTATION AND MEASUREMENT, VOL. 58, NO. 6, JUNE 2009
terminals, allowing the position of the spot to be determinedfrom the ratio of the currents. If the currents along an axis arex0 and x1, then the position normalized to the range [−1, 1] is
x =x1 − x0
x1 + x0. (1)
In a 2-D duo-lateral PSD, the front and back contacts arehigh-resistivity sheets, and the front and rear contact pairs areoriented at right angles to each other. This allows the positionof the spot to independently be measured in 2-D.
Because of the analog spatial averaging performed by theresistive contact, the PSD responds to the mean center ofillumination (or centroid). The size and shape of the spot havelittle effect on position measurement, so precise focusing is notrequired. The disadvantage is that, having no spatial selectivity,the PSD is easily disturbed by ambient lighting and unintendedreflections.
PSD resolution is limited by noise. The noise analysis iscomplex because some noise components are correlated be-tween x0 and x1, and so are either cancelled or doubled by (1).If Is is the detected RMS signal current, Rie is the PSDinterelectrode resistance, and Ib is the mean dc sum of the darkcurrent and uniform background illumination, then the standarddeviation of the normalized x position is
σn ≈√
B
Is
√16 kT
Rie+
2qIb
3
and the signal-to-noise ratio (SNR) is 20 log10(2/σn) dB [3].If l is the PSD size, then the standard deviation of the spotposition on the PSD is
σ ≈ lσn
2.
We have neglected the contribution of transimpedance am-plifier noise, which can be made small in comparison to theRie thermal noise (see Section III-D). The shot noise in Is doesnot affect the measurement because fluctuations in the signalamplitude are normalized out. The Ib shot noise does degradethe resolution because it is distributed across the PSD and thusis not perfectly correlated at the two terminals.
Using typical values Is = 1.4 μA RMS, Rie = 10 kΩ, Ib =1 μA, and B = 1 kHz, then σn ≈ 29 × 10−6, and SNR =97 dB. If l = 10 mm, then σ ≈ 290 nm RMS, giving a 1.9-μm99.9% confidence interval (equivalent resolution peak-to-peak).
The PSD bandwidth is established by Rie and the junctioncapacitance Cj . These are both distributed, so precise analy-sis requires a position-dependent transmission line model [6];however, a lower bound on the bandwidth is
f3dB ≥ 1/πRieCj .
For a typical 1-cm 2-D PSD with Rie = 10 kΩ and Cj =175 pF, f3dB ≥ 180 kHz. To use more than a fraction of thisbandwidth, it is necessary to consider or even exploit the effectsof position-dependent phase shifts [7].
The effect of PSD size on system performance is worthconsidering. If the system incorporates optical magnification,we can measure any size displacement with any size PSD, so the
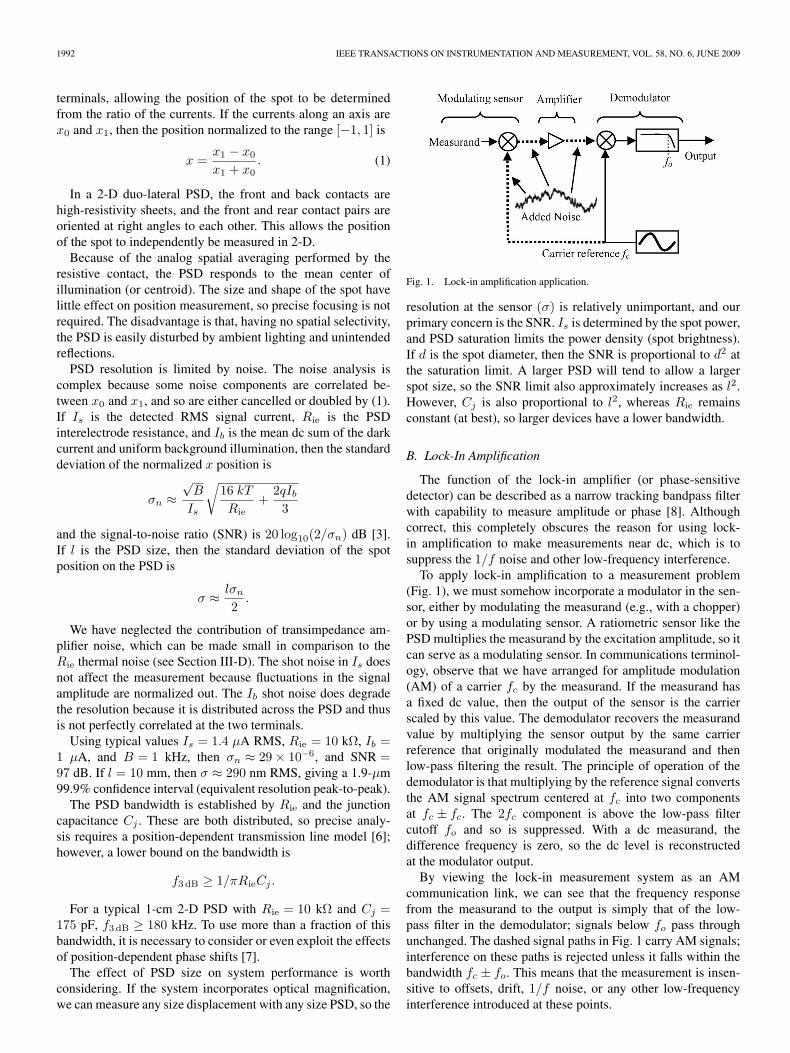
Fig. 1. Lock-in amplification application.
resolution at the sensor (σ) is relatively unimportant, and ourprimary concern is the SNR. Is is determined by the spot power,and PSD saturation limits the power density (spot brightness).If d is the spot diameter, then the SNR is proportional to d2 atthe saturation limit. A larger PSD will tend to allow a largerspot size, so the SNR limit also approximately increases as l2.However, Cj is also proportional to l2, whereas Rie remainsconstant (at best), so larger devices have a lower bandwidth.
B. Lock-In Amplification
The function of the lock-in amplifier (or phase-sensitivedetector) can be described as a narrow tracking bandpass filterwith capability to measure amplitude or phase [8]. Althoughcorrect, this completely obscures the reason for using lock-in amplification to make measurements near dc, which is tosuppress the 1/f noise and other low-frequency interference.
To apply lock-in amplification to a measurement problem(Fig. 1), we must somehow incorporate a modulator in the sen-sor, either by modulating the measurand (e.g., with a chopper)or by using a modulating sensor. A ratiometric sensor like thePSD multiplies the measurand by the excitation amplitude, so itcan serve as a modulating sensor. In communications terminol-ogy, observe that we have arranged for amplitude modulation(AM) of a carrier fc by the measurand. If the measurand hasa fixed dc value, then the output of the sensor is the carrierscaled by this value. The demodulator recovers the measurandvalue by multiplying the sensor output by the same carrierreference that originally modulated the measurand and thenlow-pass filtering the result. The principle of operation of thedemodulator is that multiplying by the reference signal convertsthe AM signal spectrum centered at fc into two componentsat fc ± fc. The 2fc component is above the low-pass filtercutoff fo and so is suppressed. With a dc measurand, thedifference frequency is zero, so the dc level is reconstructedat the modulator output.
By viewing the lock-in measurement system as an AMcommunication link, we can see that the frequency responsefrom the measurand to the output is simply that of the low-pass filter in the demodulator; signals below fo pass throughunchanged. The dashed signal paths in Fig. 1 carry AM signals;interference on these paths is rejected unless it falls within thebandwidth fc ± fo. This means that the measurement is insen-sitive to offsets, drift, 1/f noise, or any other low-frequencyinterference introduced at these points.

MACLACHLAN AND RIVIERE: HIGH-SPEED MICROSCALE OPTICAL TRACKING USING DIGITAL FDM 1993
Fig. 2. FDM sensor.
Because these low-frequency disturbances almost invariablydo exist in dc measurements, it is somewhat surprising to realizethat if the noise were either white or increased at high frequency(> fo), then the signal-to-noise improvement would be at leastas good if we discarded the rest of the lock-in system andused the low-pass filter alone. So the removal of low-frequency(< fo) noise is the only reason to use lock-in amplificationfor dc measurements. Phase-sensitive detectors also see use ininherently ac applications (such as impedance measurement),where 1/f noise is generally not a problem, and the phasemeasurement capability is often valuable.
C. FDM PSDs
The communications concept of frequency domain multi-plexing (FDM) can be implemented by a bank of lock-in am-plifiers. We can then simultaneously transmit multiple signalsover the same medium as long as they are sufficiently separatedin frequency to avoid any significant interference. Fig. 2 showsthe concept of FDM as applied to PSD measurement, whichhas been done in practice [9], [10] and has theoretically beenanalyzed and experimentally validated [7], [11], but remainsa little-used technique—perhaps undeservedly so. There isnegligible loss of accuracy or resolution, and the hardwarecomplexity is minimal when software demodulation is used.
Note that FDM assumes that the sensor output is the sumof the two modulated measurands. If there were nonlinearinteraction between the two carriers, then the two measure-ments would become coupled, degrading the accuracy of both.However, the PSD centroid measurement property implicitlyrequires a sum response, so we can expect the nonlinear interac-tions to be small. To characterize this problem in the frequencydomain, observe that any nonlinear interaction between carriersat frequencies fc1, fc2 will cause intermodulation distortion(IMD), creating output components at fc1 ± fc2. We haveexperimentally measured these IMD products and found thatthey are at least 80 dB below the carrier.
In any multiplexing scheme, if the SNR (or resolution) is tobe held constant, then the power per channel must also remainconstant as the multiplexing is increased (total power increasesproportional to multiplexing). As for the feasibility of doing sowith FDM PSDs, Qian et al. [11] are overly pessimistic. SincePSD saturation is a localized phenomenon, it is possible to add
nonoverlapping spots of the same brightness without causingsaturation. In addition, the power may be limited by the sourcebrightness rather than PSD saturation, in which case addingmore sources proportionally does add more power. In theory,there is also some resolution degradation due to the shot noiseof the other spots, but this is position dependent and likely tobe submerged in the Rie noise as long as all the spots are closetogether. The degree of multiplexing is ultimately limited bythe PSD bandwidth, but in the applications we are currentlyconsidering, the total bandwidth is less than 10 kHz, so thePSD bandwidth is not a limiting factor.
D. Time-Domain Techniques
An alternative way to achieve the interference–rejectionfunction of lock-in amplification, which has also been used withPSDs, is to modulate the signal on/off, and then, in the receiver,sample the signal during on and off periods, subtracting thetwo values
y(n) = x(2n + 1) − x(2n). (2)
Variously known as dc restoration, correlated double sampling,or background subtraction, this approach has the advantageof conceptual and implementation simplicity and can be im-plemented using either analog hardware or a data acquisitionsystem and software.
Note that if we define a reference signal
r = {−1,+1,−1, . . .},
then (2) becomes
y(n) = r(2n + 1)x(2n + 1) + r(2n)x(2n).
This allows us to reinterpret background subtraction as adiscrete-time implementation of lock-in amplification withdecimation ratio 2 and a rectangular window (Section IV).We will see that this results in a frequency response thatdroops considerably, making the usefully flat signal bandwidthnarrower than the noise bandwidth. The actual noise bandwidthdepends on the details of the sampler and any antialias filter. Inthe (likely) case that the sampler is not an integrator, the noisebandwidth will be wider, perhaps considerably so if antialiasfiltering is neglected.
Background subtraction has been generalized into time-domain-multiplexed systems, where each LED is flashed inturn [12]. Since only one LED is lit at a time, it is not possibleto proportionally increase the average power as multiplexing isincreased because of both LED characteristics and PSD satura-tion [13], so the SNR (resolution) is worse than with FDM.
III. REFERENCE DESIGN
To provide a concrete context for design discussion, wewill describe an instrument we have developed to supportresearch in the quantification of hand tremor during micro-surgery and development of devices for active tremor compen-sation [14], [15]. This instrument measures the 5 DOF position
1994 IEEE TRANSACTIONS ON INSTRUMENTATION AND MEASUREMENT, VOL. 58, NO. 6, JUNE 2009
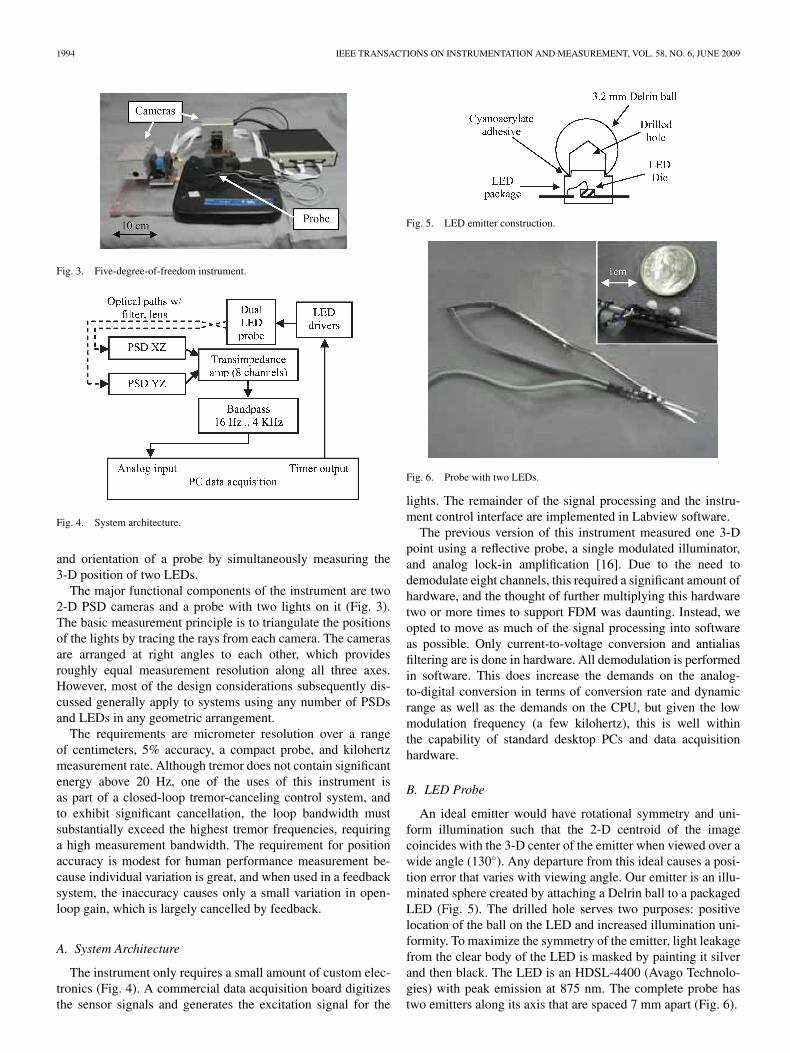
Fig. 3. Five-degree-of-freedom instrument.
Fig. 4. System architecture.
and orientation of a probe by simultaneously measuring the3-D position of two LEDs.
The major functional components of the instrument are two2-D PSD cameras and a probe with two lights on it (Fig. 3).The basic measurement principle is to triangulate the positionsof the lights by tracing the rays from each camera. The camerasare arranged at right angles to each other, which providesroughly equal measurement resolution along all three axes.However, most of the design considerations subsequently dis-cussed generally apply to systems using any number of PSDsand LEDs in any geometric arrangement.
The requirements are micrometer resolution over a rangeof centimeters, 5% accuracy, a compact probe, and kilohertzmeasurement rate. Although tremor does not contain significantenergy above 20 Hz, one of the uses of this instrument isas part of a closed-loop tremor-canceling control system, andto exhibit significant cancellation, the loop bandwidth mustsubstantially exceed the highest tremor frequencies, requiringa high measurement bandwidth. The requirement for positionaccuracy is modest for human performance measurement be-cause individual variation is great, and when used in a feedbacksystem, the inaccuracy causes only a small variation in open-loop gain, which is largely cancelled by feedback.
A. System Architecture
The instrument only requires a small amount of custom elec-tronics (Fig. 4). A commercial data acquisition board digitizesthe sensor signals and generates the excitation signal for the
Fig. 5. LED emitter construction.
Fig. 6. Probe with two LEDs.
lights. The remainder of the signal processing and the instru-ment control interface are implemented in Labview software.
The previous version of this instrument measured one 3-Dpoint using a reflective probe, a single modulated illuminator,and analog lock-in amplification [16]. Due to the need todemodulate eight channels, this required a significant amount ofhardware, and the thought of further multiplying this hardwaretwo or more times to support FDM was daunting. Instead, weopted to move as much of the signal processing into softwareas possible. Only current-to-voltage conversion and antialiasfiltering are is done in hardware. All demodulation is performedin software. This does increase the demands on the analog-to-digital conversion in terms of conversion rate and dynamicrange as well as the demands on the CPU, but given the lowmodulation frequency (a few kilohertz), this is well withinthe capability of standard desktop PCs and data acquisitionhardware.
B. LED Probe
An ideal emitter would have rotational symmetry and uni-form illumination such that the 2-D centroid of the imagecoincides with the 3-D center of the emitter when viewed over awide angle (130◦). Any departure from this ideal causes a posi-tion error that varies with viewing angle. Our emitter is an illu-minated sphere created by attaching a Delrin ball to a packagedLED (Fig. 5). The drilled hole serves two purposes: positivelocation of the ball on the LED and increased illumination uni-formity. To maximize the symmetry of the emitter, light leakagefrom the clear body of the LED is masked by painting it silverand then black. The LED is an HDSL-4400 (Avago Technolo-gies) with peak emission at 875 nm. The complete probe hastwo emitters along its axis that are spaced 7 mm apart (Fig. 6).

MACLACHLAN AND RIVIERE: HIGH-SPEED MICROSCALE OPTICAL TRACKING USING DIGITAL FDM 1995
Fig. 7. PSD camera detail.
C. LED Drivers
The LEDs are pulsed using a 150-mA on/off square wave,which is the maximum drive specified for this LED. Asquare-wave drive was primarily chosen so that the excitationcould be generated using a timer output [as opposed to a digital-to-analog converter (DAC)]. A square-wave drive also allowsthe driver to be a simple switch with a current-limiting resistor.It should be noted, however, that the switch can create RFharmonics that may be coupled into sensor circuits by electro-magnetic radiation from the probe cable or through the powersupply. These signals are phase coherent with the excitation, sothey will not be rejected by the demodulator. It is best to avoidoverly fast switching, use a separate power supply, and wrap theprobe leads several turns around a ferrite toroid.
D. PSD Camera
Light is focused on the PSD by a single-element double-convex lens (Fig. 7). We have found that for use with PSDs,simple single-element lenses outperform much larger and moreexpensive camera lenses. This is because camera lenses aredesigned to minimize spherical and chromatic aberrations,which are irrelevant for our purposes, and in doing so in-troduce geometric distortion. In fact, spherical aberration isbeneficial because it creates a soft-focus effect that increasesthe spot size, reducing the brightness and, therefore, avoidingPSD saturation. Some camera lenses are also unsuited fornear-infrared use because they absorb 75% or more of theillumination.
In our PSD camera, the lens is 12.5 mm in diameter with30-mm focal length and has a near-infrared anti-reflective coat-ing (Melles Griot). Before reaching the PSD, the light passesthrough an infrared-pass filter that blocks much of the ambientlight. This is important not only because ambient light mightoverload the sensor and may be modulated (causing hum) butalso because even a steady illumination degrades resolution byincreasing the shot noise.
Using a thin-lens model, the front-to-back focus ratio of120–35 mm would be expected to give an optical demagni-fication of 1 : 3.4. In fact, the calibrated demagnification (seeAppendix A) is 1 : 4. The difference may be due to the filtershortening the effective back focus and due to coma resultingfrom the lens’s spherical aberration.
Focusing the PSD camera is more difficult than with animaging camera, but fortunately, the focus is far less critical(defocusing may even be desirable). We removed the infraredfilter, substituted a screen for the sensor, and focused usingvisible light. Note that in the presence of spherical aberration,the minimum spot size is achieved at a shorter back focusdistance than in the thin lens model.
The PSD is a 1-cm2 OSI Optoelectronics DL-10 duo-lateraldevice with nonlinearity of < 1% and drift of < 0.6 μm/◦C.The PSD is reverse biased by 5 V to inhibit saturation andincrease bandwidth.
Each of the four PSD terminals requires a transimpedanceamplifier to convert the photocurrent to a voltage that can bedigitized. These amplifiers are located in the camera to mini-mize noise pickup and gain peaking due to wiring capacitance.The PSD resolution is determined by the SNR and ultimatelyis limited by PSD intrinsic noise (Section II-A), but attainingthis limit requires a low-noise transimpedance amplifier [3].Typically, 2-D PSDs have an interelectrode resistance (Rie) of10 kΩ. Two key principles are that the op-amp must be selectedfor this source resistance [17] and that the gain-setting feedbackresistance should be much larger than Rie (we use 200 kΩ).In [13], amplifier noise was dominant because a noisy op-amp(TL071) and a small feedback resistor were used. Good op-amp choices are the Texas Instruments OPA2228, the industrystandard OP37, or a decompensated low-voltage-noise FETinput op-amp (en < 6 nV/
√Hz).
E. Channel Matching
Because the analog signals are all ac, the only way that thesignal conditioning can contribute to drift is by changes infrequency response. Furthermore, because of the normalizationdone by position computation, gain changes have little effect aslong as the pairs of channels for each axis remain well matched.If the gains of the two axis channels differ, then the positionsensitivity differs from one side of the PSD to the other, creatingnonlinearity.
F. Antialias Filtering
The voltage signal from each transimpedance amplifier is accoupled through a single-pole 16-Hz high-pass filter, primarilyto remove the dc bias. Then, the signal is low-pass filteredthrough a two-pole Butterworth antialias filter. The low filterorder was chosen both for simplicity and to promote chan-nel matching. To ensure matching, the antialias filters wereconstructed with 1% capacitors and 0.1% resistors, and thecapacitors for the axis channel pairs were matched to 0.1%. Itwould also be possible to use a gain calibration procedure tomatch the channels in software. Channel matching the high-pass filters helps the rejection of low-frequency interferencesuch as hum.
G. Analog-to-Digital Conversion
The sensor signal has a dynamic range extending from thepeak illumination when all lights are on (∼10 μA p–p) downto the noise floor (∼100 pA RMS). It is important that the

1996 IEEE TRANSACTIONS ON INSTRUMENTATION AND MEASUREMENT, VOL. 58, NO. 6, JUNE 2009
least significant bit is well dithered because the modulationscheme causes the quantization noise to be concentrated at thevery same frequencies to which the demodulator responds. Thisdefeats the purpose of modulation by allowing low-frequencynoise to pass through the demodulator.
A high performing but quite inexpensive solution to dig-itization would be to use one sigma–delta audio analog-to-digital converter (ADC) per channel either in a custom designor in a high-end PC audio card. This approach provides bothdithering and antialias filtering. In our instrument, we choseto ease interfacing to Labview by selecting an 18-bit dataacquisition card (National Instruments PCI-6289), which hasenough resolution for the signal to be self-dithering.
H. Ray Intersection
Once the four signals from each PSD are demodulated asdescribed in Section IV, they are converted into two axispositions using (1) and then into rays in instrument coordinatesusing the sensor calibration information (Appendix A).
We find the 3-D light position by intersecting the rays fromthe two PSD cameras. Since there are four measurements andthree unknowns, the problem is overconstrained. The intersec-tion is approximated by the midpoint between the two raysat their point of closest approach. The distance of closestapproach (ideally 0) is an indicator of measurement quality.Although it is possible to compute the 3-D position in realtime using the geometric intersection formulas, the runtimehas been considerably reduced by precomputing a 4-D lookuptable that maps sensor axis positions to the corresponding3-D position and matching error. Multilinear interpolation isthen used to compute the output position.
IV. DIGITAL LOCK-IN AMPLIFICATION
We can straightforwardly implement a digital lock-in am-plifier by taking Fig. 1, adding an antialias filter chosen topass the carrier frequency, digitizing the signal at a samplingfrequency fs chosen to minimize noise aliasing, and replacingthe reference generator, multiplier, and low-pass filter withdigital implementations [4]. Note, however, that we can discardmost of the output samples without loss of information becausethe measurement bandwidth is much less than fs/2.
Efficiency can be improved by defining the demodulatoras a multirate function that has an output sampling rate fd
chosen according to the bandwidth requirements and an integerdecimation ratio M = fs/fd chosen according to the needs ofthe demodulation process. Let the frequency of each carrier cbe kcfd a harmonic of the output sample rate chosen such thatthe channel index kc satisfies kc ≤ M/2. Since the multiplexedsuperposition of all the carriers repeats every M samples, itmakes sense to process the signals in M sample blocks. Thereis a fixed phase relationship between the carriers and blockboundaries, so the demodulator for channel index kc multiplieseach block by the same fixed reference signal
rc(n) = cos(
2π
Mkcn
)= Real
(e−
2πiM kcn
). (3)
Fig. 8. Rectangular and Hann window functions.
Let x(n) be the nth input sample (0 ≤ n < M). The demod-ulating multiplier output is then x(n)rc(n). If (as in [5]) wedecimate by summing each block, then
Xkc=
M−1∑n=0
x(n)rc(n). (4)
Then, from (3)
Xkc=
M−1∑n=0
x(n)Real{
e−2πiM kcn
}.
This is precisely the real part of the discrete Fourier transform(DFT). The result of demodulation of the carrier kc is Xkc
,which is the kcth component of the M -point DFT of x(n).Although this suggests the possibility of efficient implementa-tions using fast Fourier transform (FFT), the immediate value ofthis DFT interpretation is to make the connection with a body oftheory that is likely to be familiar to instrumentation designers,namely, spectral estimation via FFT, windowing, and short-timeFourier transform (STFT).
A. Windowed DFT
Generally, spectral estimation first requires multiplying thedata by a window function w(n), such as the Hann window(Fig. 8). This reduces the spectral leakage, i.e., a spuriousbroadening of spectral peaks that degrades the frequency reso-lution. Using no window is equivalent to a rectangular window,so we can call (4) the rectangular window demodulator. Byadding a window to the DFT demodulator, we can reduce theamount of nonharmonic noise and interference that leak into theoutput
Xkc=
M−1∑n=0
w(n)x(n)rc(n). (5)
With the windowed DFT, the response of each DFT compo-nent to nonharmonic signals is a frequency-shifted version ofthe response that the window function would have if used as anfinite-impulse-response (FIR) filter. Fig. 9 shows the frequencyresponse of the rectangular window. Since it is a low-pass filter,the response peaks at 0 (dc). The response at negative frequen-cies represents the response near fs (which aliases to dc).
For our purposes, a desirable property of the rectangularwindow of length M is that it notches out all the harmonics

MACLACHLAN AND RIVIERE: HIGH-SPEED MICROSCALE OPTICAL TRACKING USING DIGITAL FDM 1997
Fig. 9. Rectangular and Hann window frequency responses.
of fd. We have ensured coherent sampling by the choice ofharmonic carrier frequencies kcfd and sampling rate Mfd; sowhen using a rectangular window, there is no leakage at anyharmonic of fd. This means that the carrier isolation is perfect(in the absence of distortion). Many other windows do not havethis property. However, the Hann window of length OM doeshave it for O ≥ 2. Furthermore, as Fig. 9 shows, the responseof the Hann window decays much faster as the frequencymoves away from dc, which greatly helps the rejection ofnonharmonic noise and interference.
B. Demodulation of Time-Varying Measurands
We have shown that given M samples, we can use the DFTto measure the static carrier amplitude Xkc
, and that by usinga window function, we can minimize the leakage of interferingnonharmonic signals into the amplitude measurement. Recallthat we demodulate each M -sample block of x in turn to gener-ate a discrete-time signal Xkc
(t),Xkc(t + 1), . . .. Equation (5)
becomes
Xkc(t) =
M−1∑n=0
w(n)x(tM + n)rc(n). (6)
This is the windowed STFT.In Section II-B, we observed that the frequency response
of the analog lock-in measurement system from measurand tooutput is simply that of the low-pass filter in the demodulator.However, what is the frequency response using the windowedDFT demodulator? We will see that except for the aliasingintroduced during the original digitization or the decimation,the windowed DFT demodulator gives the same overall low-pass characteristic, with the window taking the role of theresponse-defining low-pass filter.
The windowed DFT demodulator was constructed to be amultirate operation with decimation factor M . For decimationto not cause aliasing, the demodulator bandwidth must belimited to fd/2 before it is downsampled. Remove the productwith the reference signal rc(n) from (5), and consider the effectof the window alone as
y(t) =M−1∑n=0
w(n)x(tM + n).
This is a polyphase FIR decimation filter with impulse re-sponse w(n), whose low-pass response is the needed antialiasfilter [18]. The same w(n) can be interpreted either as aDFT window or a decimation filter—spectral leakage causesaliasing—and the criteria for a leakage minimizing window arethe same as for an antialias filter at sampling rate fd.
To do better than the rectangular window, we must use awindow longer than M . If we choose an overlap factor O, thenthe demodulator becomes the windowed overlapped STFT
Xkc(t) =
OM−1∑n=0
w(n)x(tM + n)rc(n).
We can halve the number of multiplications by precomputing
dc(n) = w(n)rc(n).
This converts the entire demodulator into a single modulatedpolyphase FIR decimation filter
Xkc(t) =
OM−1∑n=0
dc(n)x(tM + n). (7)
In practice, the filters are not symmetrical because each rc
must be phase adjusted to compensate for phase lag in theantialias filter, nonsimultaneous sampling due to ADC multi-plexing, etc.
If we were to demodulate all of the M/2 channels, we wouldhave a filter bank. There are FFT-based algorithms, such asthe polyphase DFT filter bank [18], that are likely to be moreefficient than direct implementation by (7) when more than twocarriers are demodulated, and are also more efficient than thewindowed overlapped STFT. However, FFT requires M to be apower of 2, which is incompatible with the (frequently prime)M selected by the procedure described next.
C. Parameter Optimization
For the determination of fd, M , and the assignments of car-riers to channels, the design constraints include the number ofcarriers, the maximum fs, the minimum fd, and the minimumand maximum kcfd. Generally, kc ≥ 2 is needed to increasethe low-frequency interference rejection, and kcfd must be lessthan the analog antialias filter cutoff.
An implementation constraint is that fs and all the car-rier half-periods 2 kcfd must be integer divisors of a singletimebase. In addition, we chose to use a square-wave drivefor the LEDs (high distortion of odd harmonics) and a low-order analog antialias filter that allows some aliasing of theseharmonics. These aliases may land on the channel of anothercarrier so the isolation between carriers depends on both thechannel assignments and M .
As observed in [11], with a different implementation ofFDM, for two square-wave carriers, a high isolation can beachieved by choosing a 1 : 2 frequency ratio. We have foundsimilar solutions for larger numbers of carriers.
We wrote a program that exhaustively compares the carrierisolation of all possible channel assignments over all feasible

1998 IEEE TRANSACTIONS ON INSTRUMENTATION AND MEASUREMENT, VOL. 58, NO. 6, JUNE 2009
values of fd and M . This takes only seconds, even with sixcarriers. Using a 10-MHz timebase, the result for four carrierswith fd ≥ 1 kHz, 2 kHz ≤ kcfd ≤ 8 kHz, and fs ≤ 62.5 kHz isfd = 1082.2511, M = 55, and kc = {2, 3, 4, 7}. The isolationmodel considers carrier harmonic distortion, first-order IMD,and aliasing. Analysis is simplified by the observation that, dueto the coherent sampling, the aliases and IMD products arealso harmonics of fd, and at these frequencies, the responseis always either unity or zero when using rectangular or Hannwindows. The actual amount of intermodulation is quite low(−80 dB), so aliasing of carrier harmonic distortion is thedominant cause of interference between the channels.
D. Summary of Digital Lock-In Amplification
First, we proposed digitally implementing the analog lock-in amplifier as a multirate decimation operation. Then, weinterpreted the multiplexed demodulator as the DFT, investi-gated interference rejection using the windowed DFT, and thenobserved that the windowed STFT is a bank of modulatedpolyphase decimation filters, thus establishing that the windowfrequency response is the demodulator frequency response, andthat spectral leakage causes aliasing. None of these connectionsis novel. The purpose has been to explain the operation of anefficient digital phase-sensitive detector and to emphasize theimportance of the window function.
As the connection with FIR filter design and DFT win-dow selection should make clear, the window for the lock-indemodulation of time-varying signals must be chosen basedon application-specific requirements for passband flatness andinterference rejection on one hand, and the conflicting require-ments for efficient implementation and minimal group delay onthe other. By not using a window, Smith et al. [5] implicitlyclaim optimality for the rectangular window, but this is onlytrue for static signals with white noise. If a short windowis required (O ≤ 5), then standard DFT window functionswill probably give better results than an equiripple low-passFIR filter, but do not expect passband flatness or any greatattenuation at fd/2. If group delay and efficiency are not aproblem, then large FIR filters can be designed with any desiredresponse. For use inside a feedback loop, group delay is crucial,but passband flatness is relatively unimportant. The rectangularwindow works well, except for interference rejection. If fd =1 kHz and kc = 2, then interference rejection at 120 Hz is30 dB better for the Hann window of length 2M than for therectangular window at the cost of an additional 1/2 samplegroup delay.
V. PERFORMANCE OF THE REFERENCE DESIGN
A. Noise Spectrum
Resolution is limited by the 3-D measurement noise, whichis substantially white (Fig. 10). The peak at 120 Hz is due tointerference from ambient lighting.
At low frequencies, the noise density is higher (Fig. 11). The1/f noise corner is about 2 Hz when the instrument is exposedto the lab environment and about 0.1 Hz when enclosed in a
Fig. 10. High-frequency 3-D noise spectrum.
Fig. 11. Low-frequency 3-D noise spectra.
Fig. 12. Three-dimensional position resolution versus bandwidth.
box to shield the optical paths from air currents. When operatedin the normal (open) environment, the low-frequency noise isclearly dominated by the effects of air turbulence inherent tothe optical measurement principle and is not due to the PSD orsignal conditioning.
B. Resolution Versus Bandwidth
To find the resolution, we measured the 3-D RMS amplitudeof 1000 s of data that was bandpass filtered between 0.01 Hzand the desired measurement bandwidth. This RMS amplitudewas then multiplied by 6.6 to convert it to a 99.9% confi-dence interval. Fig. 12 shows the resolution versus bandwidth,with the instrument in both open and enclosed environments.

MACLACHLAN AND RIVIERE: HIGH-SPEED MICROSCALE OPTICAL TRACKING USING DIGITAL FDM 1999
Fig. 13. Three-dimensional position drift.
For reference, we also plot a 3-D resolution limit derived fromthe ideal 1-D PSD resolution (Section II-A) using the actualPSD current Is = 4.5 μA RMS.
The resolution when enclosed is close to the theoreticallimit, and at typical measurement bandwidths of > 50 Hz,the broadband white noise dominates the low-frequency noisedue to air turbulence, so in practice, enclosure gains little.To convert 3-D position resolution to the equivalent angularresolution, multiply by 0.01◦/μm. To convert to 1-D resolutionat the PSD, multiply by 0.16.
C. Drift
In practice, drift is dominated by the thermal expansion of theprobe test fixture in response to the 300 mW dissipated by theprobe. We ran the instrument overnight to thermally stabilizeit and then measured the nominally fixed probe position for anhour. Fig. 13 shows the magnitude of the 3-D position drift. The300-nm drift is 10 ppm of the full scale, showing the excellentdrift performance resulting from lock-in amplification.
D. Effects of Multiplexing
In Section II-C, it was claimed that frequency-division multi-plexing a PSD would not significantly degrade accuracy orresolution. This was experimentally verified by shutting offone light and observing the effect on the measurement of theother light. The isolation model (Section IV-C) predicts 73-dBchannel isolation, whereas we observed approximately −80-dBchange in the PSD signal amplitude. The corresponding 3-Dposition change was 0.7 μm, which is 24 ppm of the fullscale, well below the measurement resolution at full bandwidth.There was no detectable change in the measurement resolution(noise).
E. Workspace
The workspace is approximately a 3-cm cube, but both lightsmust remain inside the workspace, so the probe motion islimited to about ±1 cm. Typically, rotations of ±20◦ can bemeasured. Rotation is limited by the constraint that both LEDsmust be visible to both sensors, with neither being occluded bythe other or by the LED body or probe tip.
Fig. 14. Probe position error versus rotation.
Fig. 15. Translation error (30× exaggeration).
F. Probe Error
As discussed in Section III-B, accuracy depends on thedegree to which the 2-D centroid of the light coincides withthe 3-D center when light is viewed from different angles.Imperfections in the probe cause the light centroid (and themeasured position) to change depending on the angle fromwhich the probe is viewed. Probe error is a cross coupling fromangular to translational motion, but it significantly affects themeasurement even of pure translational motion, as the sensorviewing angles still slightly change.
We used the probe calibration procedure (Appendix B) tomeasure probe error by repeatedly calibrating the probe over±20◦ rotation. Fig. 14 shows the probe position error versusrotation angle for each axis.
G. Relative Error
Fig. 15 shows the position error when the probe undergoes±1-cm translation. These data were collected during a PSDcamera calibration procedure (Appendix A) but are from theother light, which was not used to generate the calibration. Theerror is 1.6% of translation and is exaggerated 30× for clarity.When ±20◦ rotation is introduced, the worst-case relative errormeasured throughout the workspace is 6.5% of angle and 2.7%of translation.
The UDT DL-10 PSD nonlinearity is specified at < 1%(Section III-D), so there are other significant error sources. Webelieve that the reduction in accuracy when probe rotation isintroduced is due to probe error. Probe error somewhat degradesthe translation accuracy but has an even more dramatic effect onthe angular error due to larger change in probe orientation.

2000 IEEE TRANSACTIONS ON INSTRUMENTATION AND MEASUREMENT, VOL. 58, NO. 6, JUNE 2009
Fig. 16. Angular error during translation (30× angular exaggeration).
H. Coupling Between Rotation and Translation
There is a cross coupling between rotation and translation:pure rotation causes apparent translation, and vice versa. Probeerror is by definition the cause of rotation-to-translation cou-pling. Since angle is derived from light positions, translation-to-rotation coupling is a consequence of overall positionnonlinearity, which is determined by PSD camera nonlinearityas well as probe error. We measured the apparent translationdue to a ±1◦ rotation and the apparent rotation due to a ±3-mmtranslation. The worst-case values across the workspace are21 μm/◦ and 0.36 ◦/mm. Fig. 16 shows the angular error asthe probe undergoes ±1-cm pure translation. At each point, theangular error is represented by the difference in direction oftwo vectors: one unchanging (circles), representing the actuallight positions, and the other rotated in the direction of theangular error but exaggerated 30×. The peak error is 1.2◦.
VI. DISCUSSION
We have described an approach to multidimensional positionmeasurement based on PSD cameras and FDM LEDs thatis well suited to applications where a compact probe withhigh angular range is needed and where bandwidth is moreimportant than linearity. We have shown that instruments usingFDM and software demodulation can approach the theoreticalPSD performance limit for a nonmultiplexed PSD. We havedescribed a software implementation of lock-in amplificationthat requires only the bare minimum of hardware to acquire thePSD data.
We have characterized a 5 DOF instrument with 4-μmresolution and 3% nonlinearity over a 3-cm 40◦ workspaceat 1-kHz sample rate and are currently developing a four-LED probe pair for 9 DOF tracking of a handheld surgicalinstrument with 3 DOF articulation. Our experience with thissystem confirms the advantages of PSDs for high-bandwidthposition tracking, since a high-performance system can beimplemented using a quite simple hardware. The only addi-tional cost of measuring more points is adding more LEDsand drivers. This simple implementation is well suited to usein embedded feedback systems or in cost-critical applications,even when there is no multiplexing. By optimizing the choiceof modulation frequencies and sampling rate, we have shownhow to minimize interference while also enabling a particularlyefficient implementation of the demodulation signal processingand have shown how to choose the demodulator frequencyresponse based on application considerations.
Fig. 17. Light motion due to rotation about O.
APPENDIX
CALIBRATION PROCEDURES
Since this instrument is used for relative measurement, itspurpose is to basically establish an arbitrary fixed coordinatesystem where the change in probe position over time can bemeasured. Because the coordinate system is arbitrary, when cal-ibrating or testing performance, we first align the measurementswith the apparent calibration fixture coordinates by applyinga 6 DOF motion that minimizes the matching error. Thisprocedure implicitly discards any long-term drift. Our primaryreference for testing and calibration is a 6 DOF positioningsystem with resolution of 0.1 μm (Hexapod, Model F-206,Physik Instrumente, Karlsruhe Germany) that has the capabilityto perform rotations about a software-configured center ofrotation. We also used a manual 3-D linear stage with rangeof 25 mm (Model H-RH, Line Tool Co, Allentown, PA) to testthe accuracy under pure translation over the entire workspace.
A. PSD Camera Calibration
Although it does not record an image, the PSD camera canbe calibrated using standard camera calibration techniques. Tomeasure a position, we must convert the two normalized axispositions (1) into a ray in the instrument coordinates. Thisrequires precise knowledge of the position and orientation ofthe camera (external calibration) and camera characteristicssuch as focal length (internal calibration). We move the probeto known positions across the workspace, recording the axispositions at each point. This is used as an input to a versionof [19] that we have adapted to PSD camera calibration.
B. Probe Calibration
We have developed a procedure to determine the light posi-tions relative to the coordinate system of the probe, allowingthe motion of a reference point on the probe (such as theprobe tip) to be computed from the light position data. Bymaking ±1◦ rotations about each axis, we can determine theapparent center of rotation from the resulting motion of thelights. First, consider the 2-D problem (Fig. 17). Let A and Bbe the positions of one light, measured at the ends of the±1◦ sweep. Then, given C = (A + B)/2, we can solve for thecenter of rotation O knowing that
|OC| = |AC|/ tan(θ/2).
The 3-D problem is solved by decomposing the localizationof the 3-D center of rotation O into three 2-D problems. Afterrotating the light position data into alignment with the Hexapodcoordinate system, as described in Appendix A, the motion dueto the rotation about each axis should lie in the plane defined

MACLACHLAN AND RIVIERE: HIGH-SPEED MICROSCALE OPTICAL TRACKING USING DIGITAL FDM 2001
by the other two axes. The three 2-D results give two inde-pendent estimates of each coordinate. The mean is used as the3-D result.
To make this measurement insensitive to any other sourcesof nonlinearity, we use the instrument only as a null detector.We adjust the Hexapod center of rotation (in software) to theapparent light center and then repeat the measurement. Ideally,when the probe is rotated at the light center, there will be nomotion detected. This calibration procedure is repeated until thelight position converges.
REFERENCES
[1] W. Ma, A. Rizzi, and R. Hollis, “Optical coordination sensor for preci-sion cooperating robots,” in Proc. IEEE Int. Conf. Robot. Autom., 2000,pp. 1621–1626.
[2] K. Kwon, J. Park, and N. Cho, “A highly sensitive multi-dimensionalmotion measurement system using a spherical reflector,” Meas. Sci. Tech-nol., vol. 17, no. 9, pp. 2421–2429, Sep. 2006.
[3] A. Mäkynen, “Position-sensitive devices and sensor systems for opticaltracking and displacement sensing applications,” Ph.D. dissertation, Univ.Oulu, Oulu, Finland, Sep. 2000.
[4] L. A. Barragan, J. I. Artigas, R. Alonso, and F. Villuendas, “A modular,low-cost, digital signal processor-based lock-in card for measuring opticalattenuation,” Rev. Sci. Instrum., vol. 72, no. 1, pp. 247–251, Jan. 2001.
[5] R. W. M. Smith, I. L. Freeston, B. H. Brown, and A. M. Sinton, “Designof a phase-sensitive detector to maximize signal-to-noise ratio in thepresence of Gaussian wideband noise,” Meas. Sci. Technol., vol. 3, no. 11,pp. 1054–1062, Nov. 1992.
[6] C. Narayanan, A. B. Buckman, I. J. Busch-Vishniac, and W. Wang, “Posi-tion dependence of the transient response of a position-sensitive detectorunder periodic pulsed light modulation,” IEEE Trans. Electron Devices,vol. 40, no. 9, pp. 1688–1694, Sep. 1993.
[7] C. Narayanan, A. B. Buckman, and I. Busch-Vishniac, “Position detectionof multiple light beams using phase detection,” IEEE Trans. Instrum.Meas., vol. 43, no. 6, pp. 830–836, Dec. 1994.
[8] D. P. Blair and P. H. Sydenham, “Phase sensitive detection as a means torecover signals buried in noise,” J. Phys. E, Sci. Instrum., vol. 8, no. 8,pp. 621–627, Aug. 1975.
[9] K. Gunnam, D. C. Hughes, J. L. Junkins, and N. Kehtornavaz, “A DSP em-bedded optical navigation system,” in Proc. 6th Int. Conf. Signal Process.,2002, pp. 1735–1739.
[10] R. Lutz, “Measuring device for location and attitude determination of anobject,” U.S. Patent 4 923 303, May 8, 1990.
[11] D. Qian, W. Wang, and I. J. Busch-Vishniac, “A method for measurementof multiple light spot positions on one position-sensitive detector (PSD),”IEEE Trans. Instrum. Meas., vol. 42, no. 1, pp. 14–18, Feb. 1993.
[12] G. Welch, G. Bishop, L. Vicci et al., “The HiBall tracker: High-performance wide-area tracking for virtual and augmented environments,”in Proc. ACM Symp. Virtual Reality Softw. Technol., London, U.K., 1999,pp. 1–11.
[13] C. Narayanan, A. B. Buckman, and I. J. Busch-Vishniac, “Noise analysisfor position-sensitive detectors,” IEEE Trans. Instrum. Meas., vol. 46,no. 5, pp. 1137–1144, Oct. 1997.
[14] C. N. Riviere, J. Gangloff, and M. de Mathelin, “Robotic compensationof biological motion to enhance surgical accuracy,” Proc. IEEE, vol. 94,no. 9, pp. 1705–1716, Sep. 2006.
[15] C. N. Riviere, W. T. Ang, and P. K. Khosla, “Toward active tremor cancel-ing in handheld microsurgical instruments,” IEEE Trans. Robot. Autom.,vol. 19, no. 5, pp. 793–800, Oct. 2003.
[16] L. Hotraphinyo and C. N. Riviere, “Precision measurement for micro-surgical instrument evaluation,” in Proc. 23rd Annu. Int. Conf. IEEE Eng.Med. Biol. Soc., Istanbul, Turkey, 2001, pp. 3454–3457.
[17] P. Horowitz and W. Hill, The Art of Electronics. New York: CambridgeUniv. Press, 1989.
[18] P. P. Vaidyanathan, “Multirate digital filters, filter banks, polyphase net-works, and applications: A tutorial,” Proc. IEEE, vol. 78, no. 1, pp. 56–93,Jan. 1990.
[19] R. Willson, Tsai Camera Calibration C Code. [Online]. Available: http://www.cs.cmu.edu/~rgw/TsaiCode.html
Robert A. MacLachlan (A’01–M’02) received theB.S. degree in applied mathematics from CarnegieMellon University, Pittsburgh, PA, in 1987.
Since 1983, he has been a Research Software De-veloper and Engineer with Carnegie Mellon Univer-sity, where he has been involved in electronic designsince 1993. In 1999, he joined the Robotics Institute,Carnegie Mellon University, where he designed anddeveloped sensor and control hardware and softwarefor mobile robots and currently develops intelligentmedical instruments at the Medical Instrumentation
Laboratory. His research interests include medical robotics, sensor design,signal processing, and control systems, with particular emphasis on exploitingthe combination of sensitive measurements and effective data-interpretationalgorithms to enable the construction of novel mechatronic systems that solvereal-world problems.
Cameron N. Riviere (S’94–M’96) received the B.S.degree in aerospace engineering and ocean engineer-ing from the Virginia Polytechnic Institute and StateUniversity, Blacksburg, in 1989 and the Ph.D. degreein mechanical engineering from The Johns HopkinsUniversity, Baltimore, MD, in 1995.
Since 1995, he has been with the RoboticsInstitute, Carnegie Mellon University, Pittsburgh,PA, where he is currently an Associate ResearchProfessor and the Director of the Medical Instru-mentation Laboratory. He is also an adjunct faculty
member with the Department of Rehabilitation Science and Technology,University of Pittsburgh. His research interests include medical robotics,control systems, signal processing, learning algorithms, and biomedical appli-cations of human–machine interfaces.
Dr. Riviere served as one of the guest editors of the Special Issue on MedicalRobotics of the PROCEEDINGS OF THE IEEE in September 2006.