high spatial resolution satellite observations for ... · mo1) 44 vegetation ... case study 1:...
TRANSCRIPT
ELSEVIER
Available online at www.sciencedirect.com
SCIENCE ~ D I R E C T •
Remote Sensing of Environment 88 (2003) 100-- 110
Remote Sensing of
Environment
www.clsevier.conl/locatc/r~,e
High spatial resolution satellite observations for validation of MODIS land products: IKONOS observations acquired under the NASA Scientific
Data Purchase
Jeffrey T. Morisette a'*, Jaime E. Nickeson b, Paul Davis c, Yujie Wang d, Yuhong Tian d, Curtis E. Woodcock d, Nikolay Shabanov d. Matthew Hansen e, Warren B. Cohen e,
Doug R. Oetter r, Robert E. Kennedy f ~NAS'A Goddatff .S~oace Fl(ght Center, Code 923, Greenbelt, MI) 20771. USA
)'Science 5)wtems and Applications, lncorpolvted. USA " DtT~artment qt" Geograph); Unh'ersity q[" Mao'land, College Park, MI), USA
d Deparmwnt q[ Geogruph); Boston Unive;wity. Boston, M=t, L'SA USDA Forest Service, USA
r Forest Science Departrnent, Oregon State" UniversiO; (.~)rvdllis, OR. L,¢~A
Received 10 May 2002; received in revised form 26 February 2003; accepted 25 April 2003
Abstract
Phase 1I of the Scientific Data Purchase (SDP) has provided NASA investigators access to data from four different satellite and airborne data sources. The Moderate Resolution Imaging Spectrometer (MODIS) land discipline team (MODLAND) sought to utilize these data in support of land product validation activities with a lbcus on tile EOS Land Validation Core Sites. These sites provide a globally distributed network of sites where field, aircraft, and satellite data are being collected. As much as possible, uniform data sets useful for validation are being made available for the core sites. The globally consistent, high-resolution imagery available from 1KONOS are being used for their gcolocation accuracy and ability to characterize the landscape at the 1- to 4-m spatial resolution. This paper provides an overview of the MODIS Land Team's validation strategy to incorporate high-resolution imagery and presents three case studies as examples of the use of IKONOS data lbr MODIS land validation activities. We conclude that the globally consistent data from IKONOS, available through NASA's SDE have supplied critical validation data sets at a reasonable cost. ,c 2003 Published by Elsevier Inc.
Kevwords: MODIS; IKONOS; NASA
1. Introduction
The Moderate Resolution Imaging Spectrometer (MODIS) is a key instrument onboard the EOS Terra (fbrmerly EOS-AM) satellite, successfully launched in De- cember 1999. An additional MODIS sensor aboard the EOS Aqua (formerly EOS-PM) platform, launched in May 2002, now complements the first MODIS sensor. MODIS instru- ment data are converted on a systematic basis into derived atmospheric, terrestrial, and oceanic products. Scientists
* Con'esponding author. Tel.: ~1-301-614-6676; tax: ~1-301-614- 6695.
E-mail address: jeff.Morisetle@gsfe,nasa.gov (J.T. Morisette).
0034-4257,;$ - see fi'ont rnatter ('~; 2003 Published by Elsevier Inc. dol:l 0. 1016/j.rse.2003.04.003
responsible for the creation of MODIS land (MODLAND) products have generated a suite of moderate (250 m- 1 km) spatial resolution land products designed to support global change research and natural resource applications (Table I; Justice el al., 2002). The overall goal of NASA's Earth Science Enterprise is to determine how the Earth is chang- ing and what the consequences are for life on Earth (NASA, 2001). Years of research using the Advanced Very-High- Resolution Radiometer (AVHRR) sensor have provided much of the methodological experience for MODLAND product development. However, spectral and geometric constraints of tile AVHRR sensor limit the development of the range of products necessary to assess global change (Cihlar, 19971. The MODLAND products will provide products and infbrmation thai address the broader range of

,L 7~ Morisette et al. /Remote Sensing q/Envitrmment 88 (2003) I00 I10 101
lable 1 MODLAND products I,lustlcc ct a]., 20021
Product bultc Product DAAC
MOD09 Smthce reflectance EDC M( )1)11 Surface temperature and emissivity EIX; M()l)43 BRDF'albedo EDC M()I)IO Snow cover NSI[)C M()l)2O Sea ice extent NSIDC MODI3 Vegetation indices EDC MOi) 15 LAI/FPAR EDC MODi 7 Net primary vegetation production EDC MODI2 Land cover and change EDC MOI) 14 Themml anomalies and fire [:.I)(" MO1)44 Vegetation cover conversion/continuous fields EI)C
Products related to the case studies presented in this paper arc shown in bold tbnt. The Distributed Active Archive Center (DAAC) column represents the distribution point, either Land Processes (LP) or National Snow and Ice Data Center (NSIDC). Additional details available for LP DAA(' (http://cdcdaac.u~gs.gov,modis/ damprod hlml) and for NSIDC I)AAC thttp..V'nsidc.org/).
global change research questions associated with biogeo- chemical cycling, energy balance, land cover change, and ecosystem health (Ihble I).
Lessons learned ti'om the previous generation of global land imaging systems indicate that product validation is critical fbr accurate and credible product usage (Cihlar, ('hcn~ & Li, 1997: Justice & Townshend, 1994). The Committee on Earth Observing Satellites (CEOS) Working Group on Calibration and Validation (WGCV) defines validation as "'the process of assessing, by independent means, the quality of the data products derived fi'om the system outputs" (Justice et al., 200(t). In this context, the MODLAND validation activities are a means by which independent field, airborne, and other satellite data are collected and used to assess the accuracy of MODLAND products. These validation activities will provide the user community with quantitative estimates of uncertainty for MODLAND products.
The objective of this paper is to demonstrate how NASA's Scientific Data Purchase (SDP) has been used to support MODIS land product validation. We start with a description of the EOS Core Sites and the information gathered to characterize these sites. The NASA SDP program was utilized to acquire at least one fine-resolution (I- 4 m) IKONOS image per core site. These fine spatial resolution images complement the high-resolution (15-30 m) Landsat 7 and ASTER data available for the EOS Core Sites (Morisette, Privctte, & Justice, 2002). To provide specific examples of the use of IKONOS data, we present three case studies. The case studies demon- strate the utility of fine-resolution data tbr validation of moderate spatial resolution products. The MODLAND products related to these case studies are listed in bold fi)nt in ['able 1. Lastly, we discuss the experience of coordinating commercial data for the needs of a large science team.
2. Central coordination of commercial data acquisition with the needs of the science team
The case studies presented below represent only a small portion of the IKONOS data that have been collected under the NASA SDP in support of EOS validation activities. NASA's Goddard Space Flight Center (GSFC) coordinated the acquisition of these data from an allocation set up by NASA-HQ within the SDP for IKONOS data. Prelaunch validation planning required that the MOD- LAND team identify supporting data available and estab- lish the infrastructure to acquire, archive, and distribute these data. The SDP provided IKONOS data for all 26 EOS Core Sites as well as many additional validation sites. Currently, at least one 1KONOS scene has been acqnired tbr all core sites. Browse imagery, metadata, and ordering instructions [br core site IKONOS data are posted on lhe EOS Core Sites web pages (http://landvoLgsli:.nasa.gov/ MOD1S,"coresite gen,asp).
While centralized coordination of the IKONOS tasking was designed to provide efficicncies in data use, it did require an extensive amount of effort to submit and track the 150 IKONOS acquisitions tasked under the SDR To help manage the status, issues, and action items ffw these tasks, periodic teleconferencing with the SDP personnel was essential. Tasks were submitted via the SDP web site interface, a process that became smoother and more efficient over time, with added flexibility and features that were lacking early on. Occasional communication directly with Space Imaging, the IKONOS data provider, was very helpful although we could not request Space Imaging to modify a task directly, as this could only come from the NASA SDR Our centralized coordination of resources helped to organize and optimize the collection of IKONOS data for the MODLAND team: however, it created another administrative layer between the end user and the data provider, which was at times inefficient. The benefit of centralized coordination was the prevention of duplication of effort and the creation of the potential fbr data sharing and multiple usage of a given acquisition. An example of this was the use of a scene from Harvard Forest site by the MODIS Vegetation Index team (Univel~ity of Arizona) to validate the vegetation index product, while the BigFoot m~d Boston University teams used the same data to validate the leaf area index (LAI) product.
3. EOS Land Validation Core Sites
The EOS Land "Validation Core Sites fhcilitate land product validation by tbcusing infomlation and measure- ment resources at a limited number of established sites l-br the validation of land products derived from moderate- resolution remotely sensed imagery. Morisctte ct al. (2002) provide details on goals, rational, and geographic and biophysical intbrnlation lbr the EOS Core Sites.

102 .L 1~ Morisette et al, /Remote Sensing (~/ Environment ,~8 (2003) 100-110
Under research activities being carried out at the Uni- versity of Maryland with the support of the NASA Stennis Space Center, comparative analysis of observations from the EOS Landsat 7's Enhanced Thematic Mapper plus (ETM+) and IKONOS has been conducted (Goward et al., 2004). To support this Commercial Remote Sensing for Earth Science (CRESS) activity, the principal investigators contributed to the development of the EOS Land Validation Core Site intbmlation database to assist with comparative analyses. This resulted in CRESS staff developing site characteriza- tion layers tbr each of the EOS Core Sites. The layers include maps and tables of land cover, soils, elevation, climate, and population, as well as a list of contacts and in situ measurements taken at each site. Since the core sites are located globally in a variety of biomes (Morisette et al., 2002t, it was imperative to utilize standardized data sets with global coverage to generate consistent characterization layers. Thus, data sources were acquired from scientifically acceptable data sets subject to: (1) availability in digital Ibrm, and (2) consistent global coverage. The characteriza- tion output GIS layers, integrated reports, and JPEG maps for each core site are available on-line or on CD-ROM through the Global Land Cover Facility at the University of Maryland (http://glcfunfiacs.umd.edtt/; search under "da- ta"). A summary of characterization layers is given in Table 2 with values for each layer given for the three sites presented in the tbllowing three case studies.
The fi~t case study, over Senanga, Zambia, demonstrates the use of paired IKONOS and ETM+ to classify the landscape into either "crown cover" or "no crown cover."
The second case study is over a fairly homogenous landscape of Sevilleta, NM. Here the paired IKONOS and ETM+ data are used to assess the relationship between image spatial resolution, spectral transformation, and spatial structure. Spectral transformations include principal components, tas- seled cap, and NDVI (Normalized Difference Vegetation Index). The spatial structure is analyzed through empirical semivariograms. The analysis of the scales of spatial varia- tion guided the field sampling design. In the third case study, both field sampling and IKONOS imagery show the high spatial variability at the Maun. Botswana, site within a 30-m ETM+ pixel. The objective of this study is to produce an LAI surface at the ETM+ spatial resolution. Spectral "patches," as detemained by ETM+ spectral values, are classified based on interpretation of the 1KONOS data. This classification determines the proper algorithm to apply to each patch to produce an LAI suN,ace from the ETM-~ data. Together. the three case studies represent the general approach of collect- ing independent field and/or imagery to validate MOD- LAND products.
4. Case study 1: using IKONOS data to validate the MODIS Vegetation Continuous Fields product
The MODIS Land Team's Vegetation Continuous Fields are produced to meet the needs of global biogeochemical and climate modelers. The layers included in this product are percent bare ground, herbaceous, and tree cover. The tree cover layer is liarthe'r broken down by percent ever-
Table 2 Characterization layel~ available for each site
Global data layer Source Resolution Measurement at Measurement at Measurement at Maun Senanga Sevilleta
Reference Various Scale varies - 19.92 latitude, - 15.86 latitude, 34.32 latitude. It~TM* path/row 23.59 longitude 23.34 longitude - 106.8 longitude footprint, m~jor roads and water bodic.,, "
Elevation US(IS, 1996, "GTOPO30" 1 km 929 m 1019 m 1925 m UMI) land cover ttansen, l)cFfics. "lownshcnd, & 1 km Wooded grassland Cropland Open shrubland
Sohlberg. 2000; University of MalTlmad
I'1)C land cover koveland et al., 200{}; EROS Data 1 km Center
BU biome,,, Knyazikhin, Martonchik. Myneni 1 km et al.. I99g; Boston University
UMD percent tree DcFrlcs, Hansen, & Townshend, 1 km cover 2000: University of Maryland
Softs LSRI. 1998: ArcAtlas Scale= 1:3 million
l'opulation density "l'oble~; t)eichman. (Jottsegen, & Original, varies by Malny, 1995, Global l)emography count~, and unit Project
Clmmtc; monthly NASA CIDC, 1999 NA ln~.'anb
Savanna Cropland/natural Open shmbland mosaic
Savanna Broadleaf crops Shrubs
9% 14 ° o 0.00%
Alluvial subtropicals Subtropical tropical Calcichromic podzols cambisols
I person per square 4 persons per square I person per mile mile square mile
Jan pr: NA Jan pr: NA Jan pr: 0,61 mm Jul pr: NA Ju] pr, NA Jul pr: 2.17 mm Jan temp: 25.2'~C Jan romp: 25':C Jan temp: 0.6°C Jul temp: 19.48°C Jul tcmp: 20.14"C Jul temp: 25.31°C

J.T. Morisette et aL / Remote Sensing of Environment 88 (2003) 100-I10 103
green, deciduous, needleleaf, and broadleaf. The product is currently being derived on an annual basis from MODIS surface reflectance values for a given year. The spatial resolution is 500 m (Hansen et al., 2002). Considering that the area covered by in situ measurements is extremely small relative to the size of satellite pixels and the large spatial variation in the landscape, it is unrealistic to expect to collect sufficient field data to support a direct comparison of field measurements with a large number o f coarse- resolution pixels. An alternative is to employ both field measurements and high-resolution satellite data to derive an accurate fine-resolution map over a sufficiently extensive area, degrade it to the coarse resolution, and compare this map with that derived from the coarse-resolution imagery.
The first and third case studies take place within the context of the Southern Africa Fire and Atmosphere Re- gional Initiative 2000 (SAFARI 2000). This is an interna- tional research initiative, within which a major component is remote sensing research and validation o f NASA EOS data products associated with EOS Terra and Landsat 7 (Privette et al., 2002). As part of the SAFARI 2000 science initiative, a validation exercise for the MODIS continuous field of tree cover product was undertaken. Using field measurements, IKONOS and ETM+ imagery, and ancillary map sources, a tree cover map was produced and validated for two ETM+ scenes in Western Province, Zambia. The validation method
used was designed to be easily replicated, with the goal of performing similar validation exercises in other biomes across the globe.
Five IKONOS images were classified into crown cover/ no crown cover maps at 4-m resolution. These maps were aggregated by counting the number of 1KONOS crown pixels within 30 m of ETM+ cells in order to create a continuous training data set of percent crown cover. IKO- NOS data allow for the direct delineation of the variable of interest, tree crown cover, and its subsequent scaling to ETM+ and MODIS resolutions. The validation map was created at the 30-m ETM+ resolution and then averaged to 250- and 500-m resolutions. Three dates of ETM+ data were acquired to predict percent crown cover using a regression tree algorithm. Single-date IKONOS was coupled with GPS field observations to produce tree crown classifications at the 4-m spatial resolution. For single-date ETM+, it can be difficult, if not impossible, to separate some tree covers from grasslands in this area of Zambia. Multitemporal ETM+ imagery, however, does improve the ability to discriminate categories that are inseparable in a single ETM+ image. Fig. 1 shows the process by which IKONOS data were charac- terized to create a MODIS scale map to be used in validation exercises. The final validation map covers the entire area of Landsat WRS path/rows 175/070 and 175/071, an area covering almost 75,000 km 2.
a) b) ] 5.81 S.23.8E
c)
15.91S,23.9E
d) c) f) 3 km
Tree cover
100%
Fig. 1. Example of progression from IKONOS to MODIS for the Senanga IKONOS acquisition. (a) False-color infrared composite of IKONOS bands 4, 3, and 2. (b) Crowrt/no crown classified map. (c) Percent crown cover training from IKONOS aggregated to 30-m cells. (d) Result of ETM+ characterization of percent crown cover. (¢) ETM+ result aggregated to 250-m MODIS resolution cells. (f) Crown cover map from MODIS data using data from ETM+-aggregated 250-m map. Includes material from Space Imaging ~.
104 .]. T Molqsette et al, / Remote Sensing q f Environment 88 (£00.) 100-110
100
~" 90 O ¢9
80 e-,
~ ,'-- 70
b , ×
¢'~ 2O +
Z 0 10 20 30 40 50 60 70 80 90 100
Field measured % crown cover
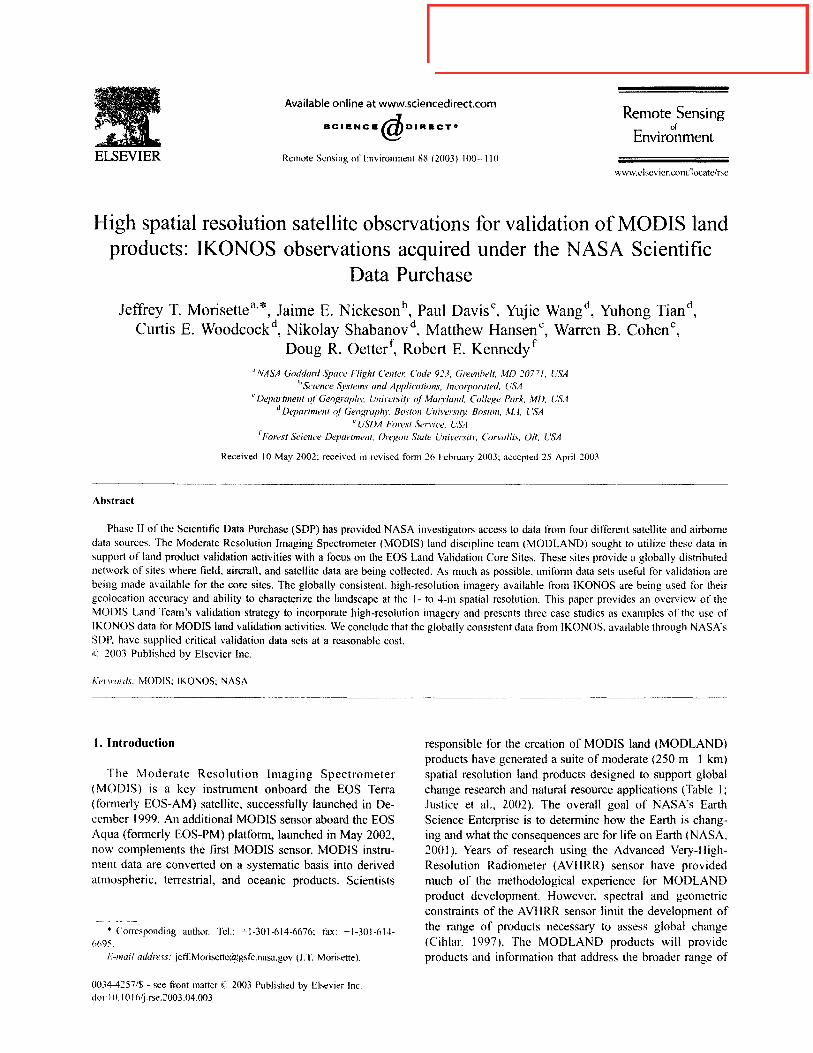
Fig. 2. Plot o f field-measured crown cover vel~us ETM+-predicted crown cover lbr pixel where the center o f site was located. For this plot. the ~olid line is the 1:1 line. The dotted line is the derived relationship, describing the reduced major axis. y=O.95x+0 .38 . R2=0.74. RMSE=9.76%. Grey
~,quares represent the class boundaries o f GOFC tree cover strata,
Comparisons of IKONOS-derived tree cover and field data to ETM+ tree estimates yielded root mean square er,'ors (RMSEs) of - _+ 10% crown cover. Fig. 2 shows field data plotted against ETM+ tree cover estimates. In this plot, the utility of the simple RMSE measure in deriving meaningful accuracy estimates is contrasted with a land cover classifi- cation approach. The RMSE measure allows the user to determine the acceptability of the magnitude of errors present more easily than with classification accuracy. For example, if the measurements from the field data are converted to the five-class Global Observations of Forest Cover (GOFC, 1990) scheme (shown as gray boxes in Fig. 2), an accuracy of only 65% results. However, the RMSE of 9.76% reveals, as does Fig. 2, that the errors are most likely in adjacent cover classes.
The ability to identify crown cover from IKONOS data. its global availability, and the methods developed to relate them to ETM+ and MODIS data indicates that I 4 m of spatial resolution satellite imagery can be a valuable tool fur validation of a Vegetation Continuous Fields product.
5. Case study 2: uses of Scientific Data Purchase imagery in lhe BigFoot project
The overall goal of the BigFoot project is to provide quality assessment of MODIS science products related to the global carbon cycle, including land cover, LAI/fraction of photosynthetically active radiation (FPAR), and net primary vegetation production. To do so, BigFoot uses grotmd measurements, remote sensing data, and ecosystem
process models at nine of the EOS Land Validation Core Sites representing different biomes of the western hemi- sphere from Alaska to Brazil (http://www.l~l.orst,edu/larse/ bigfbot). Each BigFoot site is 5 x 5 km in size, surrounding the relatively small footprint (approximately 1 km 2) of a CO2 flux tower. Multiyear in situ measurements of ecosys- tem structure and functional characteristics are collected at each site. The sampling design and scaling logic allow explicit examination of fine-grained spatial structure of these measured properties and provide for both field- and image-based ecological characterizations of the greater flux tower fuotprint. Multiyear measurements ensure that inter- annual consistency of MODIS products can be assessed. To help associate field and point measurements to the larger MODIS pixel, the BigFoot team uses higher-resolution imagery to explore the variation within the MODIS pixet. Specifically, IKONOS imagery is used for the georeferenc- ing of Landsat data, field reconnaissance, and interpretation of Landsat spectral patterns: it has also been used to examine spatial patterns in the landscape. This provides insight into the design of a field sampling strategy.
Field sampling for remote sensing studies is a complex endeavor, with multiple competing objectives and con- straints. The initial BigFoot sampling design (Campbell, Burrows, Gower, & Cohen. 1999) was based almost exclu- sively on logistical considerations (given the high cost of field sampling) and a desire to saturate the flux tower footprint with plot-based measurements. Due to reliance on Landsat ETM+ for mapping, each plot was 25 × 25 m to match the 25-m pixel size of the resampled ETM+ imagery. The design was a nested spatial series (Burrows et al.. in press) to determine scales of spatial variation among the measured variables. Only minimal attention was given to sampling the spectral characteristics of a site, as provided by Landsat imagery. Consequently, the full range of spectral variability at a site was often undersampled, and occasion- ally minority land cover types were not included. Moreover, the goal of using field data to determine spatial autocorre- lation structure required that some field plots be autocorre- lated. From the perspective of developing remote sensing models from field data, however, such autocorrelation is an inefficient use of resources (Curran, 1988). Additionally, if there were important scales of variation below that of the 25 m captured within an individual plot, that variation would be ignored. By incorporating remotely sensed imagery into our sampling design, a first critical question can be addressed: To what extent can imagery be used as a surrogate for field nleasurements to detemline the scale of biophysical variation on a landscape.'? This question was answered in another study using semivariograms, a geo- statistical tool for determining scales of variation in spatial data (Cohen, Spies, & Bradshaw. 1990; Woodcock, Strahler. & Jupp, 1988). Initial results show that field measurements of LAI and a filet principal component of Landsat spectral data had semivariogram ranges that were nearly identical (US Forest Service, Warren Cohen, unpublished data). This

,I. T. Morisette et al. / Remote Sensing of Environment 88 (2003) / 00-1 / 0 105
was true for sites in four separate biomes, where the ranges (or scales of variation) were between 125 and 500 m.
Assuming that image data can adequately track general spatial patterns of a biophysical variable, image data can be used to ask whether there are scales of variation finer than 25 m. This can be determined using IKONOS data. Fig. 3 shows IKONOS imagery degraded from 4 to 512 m and corresponding semivariograms calculated from that imagery at a desert core site, the Seviileta National Wildlife Refuge in New Mexico. These semivariograms are derived from the first principal component of the four IKONOS multispectral bands. As theory suggests (Milne & Cohen, 1999), the shape of the semivariogram changes with the support (or pixel size) of the imagery used. In particular, the sill is reduced as image grain size increases, due to the reduction of image variance with each successive coarsening of the imagery. Determination of the range of a semivariogram is generally considered to be the lag at which 95% of the sill is reached (Deutsch & Joumel, 1998). Using this rule, the
ranges of these semivariograms decrease from about 800 to 500 na as the image is degraded from,4 to 512 m ('lhble 3). Although this shows that spatial support of imagery, indeed, has some effect on the observed scale of spatial variation, the most important point is that even at 4 m of support, the scale of variation is significantly greater than the spatial resolution of Landsat. These results suggest that Landsat ETM+ data can be used to determine the scale of variation in the biophysical properties of this landscape.
If the scale of variation at other sites is smaller than the grain of Landsat ETM+ imagery, then IKONOS imagery would be an excellent alternative for use in determining the scale of variation. However, IKONOS data contain only two major axes of variation (visible and near-infrared), much like the Landsat Multi-Spectral Scanner (MSS), while Land- sat ETM+ data contain three basic spectral dimensions (Crist & Cicone, 1984) due to its inclusion of shortwave infrared reflectance. Before using IKONOS imagery as a surrogate for Landsat ETM+ to determine the scale of
4m
i 64m
8m 16m 32m
128m 256m 512m
3500.
3000,
2500,
-~ 2000,
1500, O3
1000,
500,
a m !
16m
32 m
64 m
128 m
256 m
512 m
0 . . . . , . . . . , . . . . , . . . . , . . . . , . . . . , . . . . • . . . .
0 250 500 750 1000 1250 1500 1750 2000
Lag (m)
Fig. 3. First principal component of a four-band IKONOS image over a 3 x 3-km area of the Sevilleta National Wildlife Refuge in New Mexico spatially aggregated from 4 to 512 m (top). Semivariograms calculated from the imagel7 at each spatial resolution or grain size (bottom). Includes material from Space Imaging ~.

10(, .l. 7~ Morisette et al. /Remote Sensing o fEnviJvmment 88 (2003) I00-110
lahle 3 Scml,,ariogram ranges tbr the IKONOS image of Fig. aggregated from a support of 4 m to a support of 512 m
3 spatially
Support (m) Range (m)
4 504 S 527 16 559 25 580 32 600 64 638 128 690 25(~ 756 512 800
Thc range of 25-m support was calculated from Landsat ETM ~- data.
spatial variation, the spectral dimensionality of image data also needs to be considered. Additionally, the impact of a specific spectral transtbrmation on the observed scale of variation needs to be considered.
First, a semivariogram based on the first principal com- ponent of the first four reflectance bands (roughly matching the four multispectral IKONOS bands) from a 25-m ETM+ image of Sevilleta was examined. Here, the range fell directly between those of the resampled IKONOS tbur-band principal component imagery at 16 and 32 m (Table 3). This s u g g e s t s t ha t , at this site, the difference between ETM+ and IKONOS is not significant in determining the spatial struc- ture of the landscape. As another check for the influence of sensor characteristics and spectral transformation on the observed scale of variation, NDVI was calculated from the two sensors (Fig. 4). The ranges of the two NDVI semi- variograms were essentially equal, further supporting the notion that basic sensor characteristics are similar. However, the range of the NDVI image is significantly different from the range of the principal component image (1500 versus 580 m). This suggests that the scale of variation depends on the parameter derived from the imagery. With that in mind,
the Tasseled Cap Wetness (Crist & Cicone, 1984) layer (a transtbnnation requiring a shortwave infrared band not available from IKONOS) was examined to see if it exhibited a different scale of variation than the first principal compo- nent or the NDVI. At this site, the range of the Wetness semivariogram was nearly identical to the range of the principal component semivariogram (Fig. 4). As such, across the Sevilleta desert landscape, IKONOS was equiv- alent to Landsat ETM+ for characterizing the spatial struc- ture of biophysical properties at the 30-m and larger spatial resolution (to the extent that these are adequately repre- sented by spectral data). In this case, Landsat ETM+ imagery was appropriate for determining the scale of spatial variation. However, this was only confirmed by using finer- resolution IKONOS data. Whether this is true at other sites would need to be determined in a similar manner (i.e., analyzing both ETM+ and IKONOS data).
Similar exercises at other BigFoot sites indicate that the scale of variation in imagery differs significantly with the spectral transfomlation used. As such, it is prudent (when designing a sampling scheme for field measurements to support remote sensing analyses) to examine the relation- ships between the biophysical variables of interest and different spectral transtbrmations. If more than one bio- physical variable is of interest, or if one seeks a more general application of those relationships, it may be prudent to include several different types of spectral transformations in determining scales of spatial variation for application in designing a field sampling scheme.
6. Case study 3: using IKONOS to assist in producing a high-resolution LAi surface
Similar to case study 1, case study 3 combines field measurements and high-resolution satellite data to derive an
1.4
] . 2 ¸
0 ¢J
" 1 CO " E
E 0,8 03
"~ 0.6 N
~ 0.4 O
z
0.2
o
IKONOS NDVI
ETM+Wetness _ . . ~ - ~ _
- " . . . . . . . ~ - ~ K ~ . o s c
0 250 500 750 1000 1250 1500 ~ 750 2000
Lag (m)
Fig, 4. Nonnalized semivariograms for the first principal component and the NDVI of4-m IKONOS imagery and the NDVI and Wetness of Landsat ETM+ imagery from a 3 × 3-km area of the Sevilleta National Wildlife R¢fiJge in New Mexico.
,L 12 Moriset te et al. ,' Remote Sensing ¢?f Em' ironment 88 (2003) I00 -110 107
accurate fine-resolution sudhce that can be degraded to coarse resolution and compared to the MODIS product. In case study 1, the surlhce was percent tree cover. Here the surlhce is LA1. Due to complexities in the LAI algorithm (Myneni, Nemani, & Running. 1997), it is important to consider the spatial structure and spectral values of the high- resolution satellite data. Unlike case study 2, the landscape studied here shows high spatial variation at much smaller distances, even less than the ETM+ pixel resolution.
As part of SAFARI 2000. an international group of researchers completed an intensive field campaign in Bot- swana and Zambia between February 28 and March 18, 2000, These dates coincided with the fil,'st week of MODIS Earth view. The field sites are located along the International Geosphere Biosphere Program (IGBP) Kalahari Transect (KT). The KT extends over a large rainfidl gradient (200 1000 mm/year mean annual rainfall) in an area of unifbnn soils, the Kalahari sands. The vegetation extends from equatorial tbrest to subtropical, arid shrubland of the Kala- hari desert (Dowty et al., 2000). In order to validate the MODIS LAI/FPAR products, a team from Boston Univer- sity participated in the SAFARI 2000 wet season campaign; intensive measurements of LAI, FPAR, canopy reflectance, and transmittance were made in fbur field sites (Pandama- tenga. Maun, Okwa River Crossing, and Tshane, Botswana) along the Kalahari Transect.
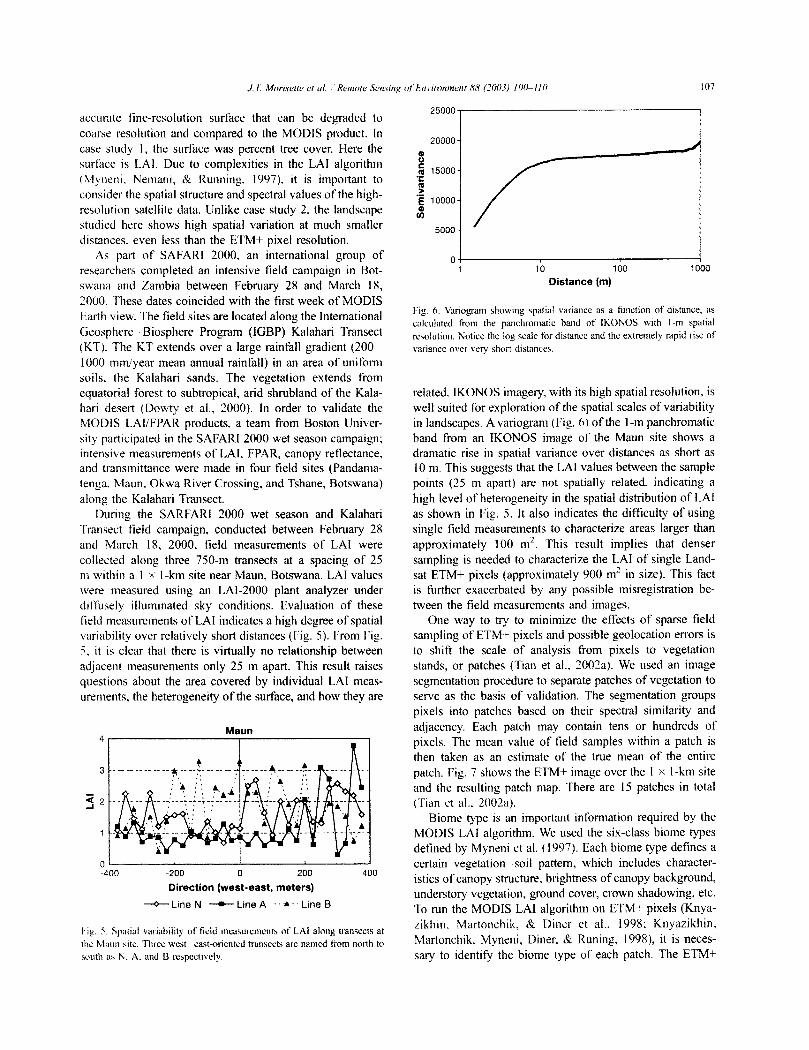
During the SARFARI 2000 wet season and Kalahari Transect field campaign, conducted between February 28 and March 18, 2000, field measurements of LAI were collected along three 750-m transects at a spacing of 25 m within a I × I-km site near Maun, Botswana. LAI values were measured using an I,A1-2000 plant analyzer under diffusely illuminated sky conditions. Evaluation of these field measurements of LAl indicates a high degree of spatial variability over relatively short distances (Fig. 5). l'rom Fig. 5, it is clear that there is virtually no relationship between adjacent measurements only 25 m apart. This result raises questions about the area covered by individual LAI meas- urements, the heterogeneity of the surface, and how they are
Maun
3
~ 2
1
0 -400
.,, :,
J
-200
. . . . . . ~ . . . . . . ~ . . . . . . . .
i
200
Direction (west-east, meters)
--<>-- Line N + Line A "" ~,-- Line B
400
Fig, 5. Spatial variability of field measurements of LAI along transects at the Maun site. Three west east-oriented transects are named from north to south as N. A, and B respectively.
25000-
20000-
15000-
10000-
5000-
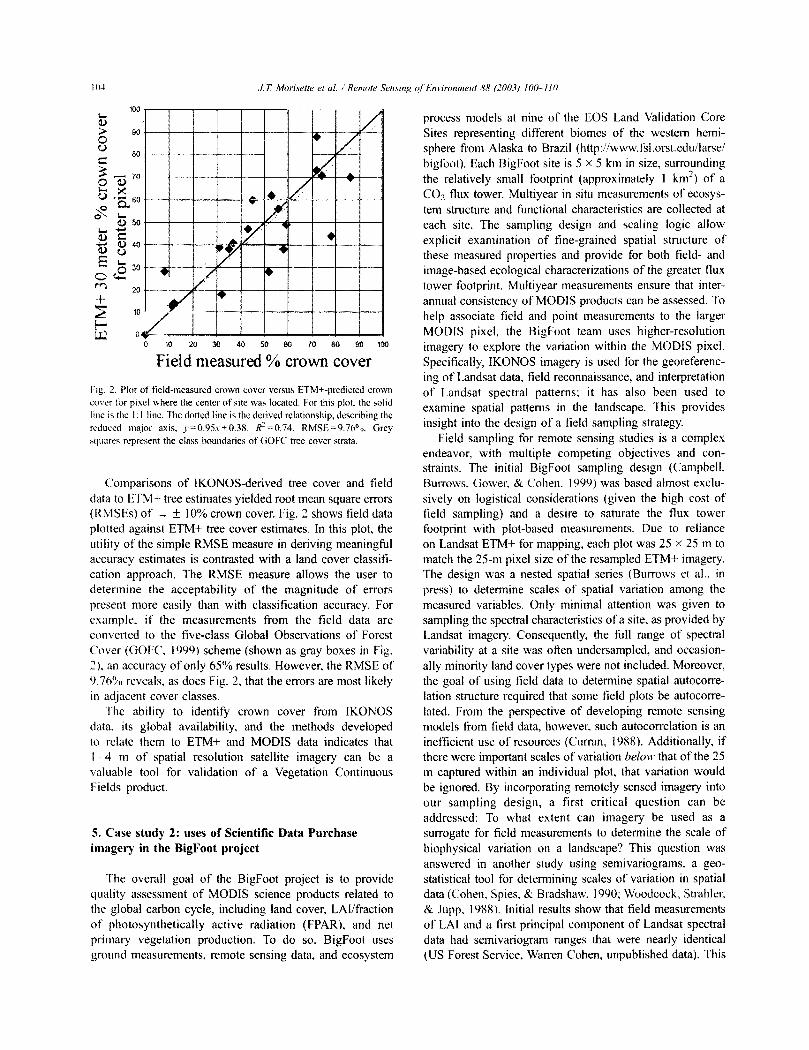
Ib 160 Iooo Distance (m)
Fig. 6. Variogranl showing spatial variance as a function of distance, as calculated from the panchromatic band of IKONOS with 1-m spatial resolution. Notice the log scale tbr distance and the extremely rapid rise of variance over very short distances,
related. IKONOS imagery, with its high spatial resolution, is well suited for exploration of the spatial scales of variability in landscapes. A variogram (Fig. 61 of the l-m panchromatic band ti'om an IKONOS image of the Maun site shows a dramatic rise in spatial variance over distances as short as 10 m. This suggesLs that the LAI values between the sample points (25 m apart) are not spatially related, indicating a high level of heterogeneity in the spatial distribution of LAI as shown in Fig. 5. It also indicates the difficult)" of using single field measurements to characterize areas larger than approximately 100 m 2, This result implies that denser sampling is needed to characterize the LAI of single Land- sat ETM+ pixels (approximately 900 m 2 in size). This fact is further exacerbated by any possible misregistration be- taveen the field measurements and images.
One way to try to minimize the effects of sparse field sampling of ETM+ pixels and possible geolocation errors is to shift the scale of analysis from pixels to vegetation stands, or patches (Tian et al., 2002a). We used an image segmentation procedure to separate patches of vegetation to serve as the basis of validation. The segmentation groups pixels into patches based on their spectral similarity and adjacency. Each patch may contain tens or hundreds of pixels. The mean value of field samples within a patch is then taken as an estimate of the true mean of the entire patch. Fig. 7 shows the ETM+ image over the 1 x l-km site and the resulting patch map. There are 15 patches in total (Tian et al., 2002a).
Biome type is m] important in/brmation required by the MOD1S LAI algorithm. We used the six-class biome types defined by Myneni et al. (1997). Each biome type defines a certain vegetation soil pattern, which includes character- istics ofcmmpy structure, brightness of canopy background, understory vegetation, ground cover, crown shadowing, etc. To run the MODIS LAI algorithm on ETM+ pixels (Knya- zikhin. Martonchik, & Diner et al., 1998: Knyazikhin, Martonchik, Myneni, Diner, & Runing, 1998), it is neces- sary to identify the biome type of each patch, The ETM+

(a)
108 J.T. Morisette et al. /Remote Sensing qf Emqronment 88 (2003) I00-110
(b)
Fig. 7. (a) Color ETM+ RGB image from bands 4, 3, and 2 of a 1 x 1 -Ion region of the Maun site. (b) The patch map after image segmentation. Patches I, 2 .4 , 7, 8, 9, 12. 13, and 15 are savannas. Patches 3, 5, 6, 10, I 1, and 14 are shrubs.
image was atmospherically corrected using the simplified method for atmospheric correction (SMAC) algorithm (tl~ime et al.. 2001; Rahman & Dedieu, 1994). From the ETM+ image alone, it is difficult to identify the biome type within each patch. However, accurate subpixel information can be obtained through the IKONOS image (Fig. 8). One can see that patches 3, 5, 6, and 10 are mostly small bushes/ trees without understory vegetation and hence are identified as shrubs; patches 7, 8, 9, and 12 are mostly small bushes/ trees with understory vegetation and hence are identified as savannas. Using this IKONOS-derived biome classification for each patch, the MODIS LAI algorithm was applied to produce a high-resolution LAI map from the ETM+ surface reflectances (Fig. 7a). Comparison of the mean LAI over patches derived from field measurements and ETM+ data is shown in Fig. 9. This result then formed the basis for
Fig. 8. Color IKONOS RGB image from bands 4, 3, and 2 of a 1 x l-kin region of the Mann site. Yellow " + " signs represent sampling points. Includes material from Space Imaging ~'.
applying the MODIS LAI algorithm over a 10 x 10-km area of Landsat ETM+ images for comparison with a I0 x 10 window of MODIS pixels.
Similar techniques have been applied to validation data collected in conifer forests near Ruokolahti, Finland, during June 14-21, 2000 (Wang et al., in review) and Harvard Forest, between July 21 and 25, 2000 (Shabanov et ai., in press). The value of IKONOS images for these efforts lies in its fine spatial resolution, which supports exploration of the spatial scale of variability in landscapes and classification of biome type for ETM+-derived spectral patches.
301 .... ....... i .... .... l -~ 2.5
"~o 2.0
1.5
<, 1.0
~< 0.5
0 0 . . . . . . .
0.0 0.5 1.0 1.5 2.0 2.5 3.0 LAI-Field Measurement
Fig. 9. Mean LAI over patches derived from field measurements and ETM+ data.

,L E Morisette et aL / Remote Sensing qf Em:ironment ,~8 (2003) I0('~110 109
7. Conclusion
The validation of global products requires consistent data with which to compare the global products. A main concern for validating the relatively coarse-resolution prod- ucts from the MODLAND team is that of relating field or ground-based "'point" measurements with the large area represented by a MOD1S pixel. The approach used by the MODLAND team was to use imagery at intennediate scales to bridge between the two. The 1-m panchromatic and 4-m multispectral data from IKONOS, available in a consistent tbrnaat and quality throughout the globe, have provided a complement to the 30-m Landsat 7 ETM+ data. Without the high-resolution imagery available through the SDP, the only other option for such data would have been airborne imagery. Flight planning, digital image acquisi- tion, and post-processing are extremely time-consuming and expensive. Furthermore, companies or agencies sup- plying such imagery typically work within a finite range, thus making it difficult (o." impossible) to acquire consis- tent data over the globally distributed EOS Land Validation Core Sites. Lastly, there are some regions of the world where airborne image acquisition is either impossible or unsa~. In light of these considerations, NASA's investment in high-resolution imagery available through the SDP has supplied the EOS Land Validation Core Sites with unique, globally consistent, critical validation data sets at a rea- sonable cost.
One of the biggest concerns in the use of IKONOS li'om the SDP was the uncertainty in the timing of acquisitions. The SDP contract with Space Imaging required that we accept data acquired within + 2 weeks of the requested acquisition date. Attempting to acquire a scene for a narrow date window to coincide with fieldwork was nearly impos- sible. In many instances, tasks required a formal extension of the original date window specification in order to accept data acquired outside of that original window. Tasking priorities and overpass timing were largely unknown to us. There is no doubt there are competing requests lbr IKONOS acquisitions, and cloud cover also has to be taken into account; however, explicit knowledge of how NASA's SDP requests fit within Space lmaging's tasking priority system was never known. The uncertainty of acquisition timing was difficult tbr those trying to couple IKONOS data acquisitions with field activities. When relating satellite spectral data and field measurements, it is desired that ground data collection be nearly simultaneous with the satellite overpass. Currently, for EOS platforms and several other satellites, the EOS program provides a web-based tool to obtain overpass infbnnation (hnp://earthobser~,atory.nasa. gov/MissionControl/overpass.hm~l). Such intbrmation tbr IKONOS would be helpful to ascertain at least the potential dates and times for IKONOS acquisitions. Knowledge of the priority of SDP requests, and the likelihood of actual collection from a list of possible acquisitions would be very useful information to have.
Heretofore, ~ 1-m spatial resolution data available to the research conununity were limited to those collected from aircraft plattbrms. In light of this, we should consider the cost and coordination effort required in the collection of an equivalent amount of airborne data. We tbund that to cover a 5.5-m 2 area, an area not quite as large as the 11 u 1 l-kin 2 area of our IKONOS acquisitions, with color IR orthorectified airborne digital imagery would cost any- where between US$50,000 and US$75,000. This is assum- ing that the study area is within the range covered by an aerial survey company, some of which only operate regionally. Some of the core sites are international and somewhat remote, which means that some sites might be impossible or prohibitively expensive to survey by aircraft. In contrast, the IKONOS data were available globally and ranged in price from - US$6000 lbr imagery over North America to - US$15,000 tbr international acquisitions.
MODLAND's coordination of IKONOS data through NASA's SDP has required considerable time and effbrt. However, the coordinated approach and core site infi'astruc- ture have resulted in efficiencies by allowing the same data to be used to validate more than one product by more than one team. The case studies presented here demonstrate the use of IKONOS data in support of validation efforts for some of the MODLAND products and provide examples of how the spatial resolution of IKONOS data can lend insight into the analysis of more coarse-resolution imagery.
Acknowledgements
MODIS land validation activities are primarily supported through the MODIS land discipline team and EOS validation, with special thanks to C. Justice, J. Privette, and D. Start'. The MODLAND allocation of SDP resources was made possible through NASA Headquarters and NASA Stennis Space Center, with special thanks to Diane Wickland and Fritz Policelli. Thanks also to NASA Code YS, through Martha Maiden, tbr providing the ETM+ data used to scale between IKONOS and MODIS. Case study 2 and three were part of the Southern African Regional Science Initiative- SAFARI 2000. Thanks to three anonymous reviewers who provided helpful suggestions that improved the paper.
References
Burrows, S., Gowcr, S., Clayton, M.. Mackay, D,, Ahl, D., Norman, J,, & Diak, G. (2002), Applicalion of geostatistics to characterize LAI from flux tower to landscape scales using a cyclic sampling design. Ecos)w- tems 5. 667 -679.
Campbell, J. C., Burrows, S., Gower, S. T.. & Cohen, W. B, (1999). Big- Foot: Characterizing hind covet: LAL and NPP at the Landscape Scale .[or EOS/MODIS Validation. FieM manual 2. I. Environmental Science Division, voL 4937. Oak Ridge, TN: Oak Ridge National Laboratory, 103 pp.
Cihlar, J. (1997). GCON'GTOS phm Jbr terrestrial climate rehTted obser-

110 J. E Morisette et al, /Remote Sensing o,1" Environment 88 (2003) 100-. I I 0
vath,ns, lb~wion 2. GCOS Report 32 (130 pp.). Geneva: World Mete- orological Organisation.
Cihlar, J.. Chen, J., & Li, Z. (1997). On the validation of satclhte-derived products fbr land applications. ('anadian Journal of Remote 52,nsing. 23(4~, 381 389.
Cohen, W., Spies. T.. & Bradshaw, (;. (1990). Semivariograms of digital imagery tbr analysis of conifer canopy structure. Remate Sensing q[' Environment, 34. 167 178.
('nst, k. I'~, & Ciconc. R. C, (1984). A physically-based transformation of thematic mapper data the TM tasseled cap. IEEE Transactions on Geoseience and Remote Sensing, GE-22, 256 263.
Carran. R J. ~1988). The semivariogram in remote sensing: An introduc- tion. Remote Sensing o/'Environment. 24, 493-507.
l)eFries, R, S,. Hansen, M. C,, & Townshend. J. R. G. (2000). Global continuous fields of vegetation characteristics: A linear mixture model applied to nmlti-year 8 km AVHRR data. htternationat Journal of Remote Sensing, 21(6 7k 1389 1414,
Dcutsch, C. V., & Joumel, A. G. (1998). GSLIB geostutistical soltware hhrat 3" and user;~" guide. New York: Oxford University Press. 369 pp.
l)owty. D.. Frost, P.. Lesolle. P.. Midglcy. G., Mukelabai, M., Otter, L.. Privctte, J., Ringrose. S., Scholes, B,. & Wang, Y. (2000/. Summary of the SAFARI 2000 wet season field canrpaign along the Kalahari '['rans- ext. I{arth Obso'ver 12, 29-34.
ESRI { 19c)8). ,4rcAtlas. 380 New York Street, Redlands, CA 92373-8100, LISA: ESRI.
(lOFt2 Design Team (1099). A strategy tbr global observation of tbrest cover: Version 1.2, http://www.tho.orfc'gtos/goli:-guld/docs; ¢\ec'~nrn.pd(.
(;oward, S. N., David, P. E., Fleming, D., Miller, L., & "lbwnshend. J. R. 12004), t;mpirical comparison of kandsat 7 and IKONOS multispectral measurements tbr selected earth observation system OiOS) validation sites. Remote Sensing of Environment, 88. 79-98 (this issue'r
Htimc, T., Stcnberg, R, Anderson. K., Rauste, Y., Kennedy, P., Folving, S., & Sarkeala, J, ~2001 ). AVHRR-based tbrest proportion map of the Pan- Kuropean area. Remote Sensing o! Environment, 77, 76 91.
Han>cn, M. C., DeFries, R. S., Townshend, J. R, G.. & Sohlberg, R, (20001. Global land cover classification at 1 km spatial resolution using a clas- sification tree approach. International ,Iournal t~/" Remote Sensing, 2116:7), 1331 1364.
Hansen, M. (',. I)eFlies, R. S,, "l'o~lshend, J. R, G., Sohlberg, R,, l)imi- ccli, C., & Carroll, M. [2002). Toward an operational MODIS contin- uous field of percent tree cover algorithm: Examples using AVHRR and MODIS data. Remote Sensing of Envh'onment, 83(1- 2), 303 319.
Justice, C.. IBclward. A., Morisette, J., Lewis, P., Privettc, J., & Barct, F. (2000). Developments in the 'validation' of satellite sensor products tbr the study of land surface. International Journal of Remote Sensing, 21(I 71, 3383-3390.
Justice, C. O., & "lownshend. J. R. G. 11994). Data sets tbr global remote '~cnsing. Lessons learnt, lntetvtational Journal (!]' Remote Sensing, 15117~,3621 3639.
Justice, C_ Townshend. J., Vemlote. E., Masuoka. E.. Woffe, R.. Saleous. N.. Roy, D., & Morisette, J. 12002). An overview of MOD1S, its data processing and products tbr ten'estrial science applications. Remote Sensing o[ Em'h~)nment, 83( l - 2), 3-15.
Knyazikhin, Y., Manonchik, J. V., Diner, D. J., Myneni, R. B., Verstraete, M. Pinty, B., & Gorbon, N, (1998). Estimation of vegetation canopy leaf area index and fraction of absorbed photosynthetically active radi- ation ti'om atmospbere-con'ected MISR data. JomTtal o[ Geoph)wh'al Research, 103, 32239 32256.
Knyazikhin, Y.. Martonchik, .I.V., Myneni. R. B,, Diner, D. J.. & Runing, S. ~1998). Synergistic algorithm for estimating vegetation canopy leaf area index and fi'action of absorbed photosynthetically active radiation from MODIS and MISR data. Journal o! Geophys'ical Research, I03. 32257 32275.
Loveland, T. R., Reed. 13. C., Brown, J. F,. Ohlen, D. 0., Zhu, Z., Yang, L., & Merchant, J. W. (2000). Developnlent of a global land cover charac- teristics database and IGBP 1)lSCover from 1 km AVHRR data. Inter- national Journal qf Remote Sensing, 2116/7), 1303- 1330.
Milnc, B. T., & Cohen. W. B. (1990). Multiscale Assessment of Binary and Continuous [.and cover Variables for MODIS Validation Map- ping, and Modeling Applications. Remote Sensing ~ L~vitvnment, 70, 82-98,
Morisette, J. T.. Privette, J. L., & Justice, C. O, (2002). A framework for the validation of MODIS land products. Remote Sensing afEnvh'onment, 83{1 2k 77-06.
Myneni, R. B., Ncmani, R. R., & Running, S. W. t1997). Estimation of global leaf area index and absorbed par using radiative transfer mod- els. IEEE Yransaetions on Geo.science and Remote Sensing, 35, 1380 1393.
NASA (2001). Exploring oar home planet: Earth Seience Enterprise strategic plan, http:i/www,earth,nasa.goWvisions/~,tratplan: ese strategic pkm,pdf
NASA CIDC (1999). Climatology interdisciplina O' data center: NASA. Atmospherie soundings Ji'om TOIS, http://daac,gsfc.nasa. gow'CAMPA1GN_DOCS/FTP_SITE/INT_DIS/rcadmcs/tovs,html,
Priw:tte, J. L., Myneni, R. B., Knyazikhin, Y., Mukufute, M., Robert, G., Tian, Y.. Wang, Y., & Leblanc, S. G. (2002). Early spatial and temporal validation of MODIS LAI product in Africa. Remote Senshtg of Envi- ronment, 83, 232-243.
Rahman, H,, & Didieu, G. (1904). SMAC: A simplified method for the atmospheric con'ection of ~tellite measurements in the solar spectrum. International Journal q/'Remote Sensing, 15, 123 143.
Shabanov, N. V., Wang, Y., Buemaann, W.. Dong, J., Hoflinan, S., Smith. G. R., Tian, Y., Knyazikhin, Y., Gower. S. T., & Myneni. R, B. (2003). Effect of Ibliage spatial hcterogcncity in the MODIS LAI and FPAR algorithm over broadleaf tbrests. Remote Sensing c~'Environment g5(4), 410-423.
Tian, Y., Woodcock, C. E.. Wang, 5',, Privette, J. L,, Shabanov, N. V., Zhou, k., Zhang, Y., Buennann, W.. Dong, J.. Veikkanen, B,, Hame, '1"., An- dersson, K., Ozdogan, M., Knyazikhin, Y,, & Myneni, R. B. {2002a). Multiscale analysis and validation of the MODIS LAI product over Maun, Botswana: 11. Sampling strategy. Remote Sensing o/" Envh'on- ment. 83, 431 441.
q\~bler. W., I)eichman, U,, Gottsegen, J., & Maloy, K. (1995). 7~e global demogral:h 3, pro/ect. UC Santa Barbara: NCGIA.
USGS, United States Geological Survey (1996). GTOP030: Global 30 Are second elevation data set. Sioux Fallo. South Dakota, USA: Land Prt~esses Distributcd Active Archive Centrc, http://cdcdaac,usgs.gov/ gtopo30/gtopo30.html.
Wang, Y., Woodcock, C. E., Buermann. W., Stenbelg, R, Voipio, R, Smo- lander, H., Htime, T., Tian. ~2, Hu, J., Knyazikhin, Y., & Myneni, R. B. (in review). "validation of the MODIS LAI product in coniferous forest of Ruokolahti, Finland. Remote Sensing o.[ Environment.
W~wJdcock, C. E., Strahler, A. H., & Jupp, D. L. (1988). The use of vario- grams in remote sensing: I. Scene models and simulated images. Re- mote Sensing q/'Enviranment, 25, 323 343.