high school role models and minority college achievement
TRANSCRIPT

High School Role Models and Minority College
Achievement∗
Scott Delhommer†
December 19, 2019
Most Recent Draft Here
Abstract
Large racial differences persist in college enrollment and major choice, which may be
exacerbated by the racial distribution of high school teachers. In this paper, I present
the first evidence that matching high school students with same-race teachers improves
the students’ college outcomes. To address endogenous sorting of students and teachers,
I use detailed Texas administrative data on classroom assignment, exploiting variation
in student and teacher race within the same course, year, and school, eliminating 99%
of observed same-race sorting. Race-matching raises minority students’ course per-
formance as well as improves longer-term outcomes like high school graduation and
college enrollment. Black and Hispanic students matching with a same-race teacher in
a given subject also become more likely to major in that subject in college. Finally, I do
not find any robust, significant effects of race-matching for White students, suggesting
policies to make the teaching population more representative would benefit minority
students with minimal negative spillovers to the White student population.
JEL Codes: I21, I23, I24
∗I would like to thank Dr. Sandra Black, Dr. Rich Murphy, Dr. Steve Trejo, Dr. Tom Vogl, and theseminar participants at the University of Texas at Austin for helpful comments and feedback.†University of Texas at Austin; [email protected]

1 Introduction
Educational outcomes have unequal distributions across race and income. Over 20 years,
the test score gap between White and Black students decreased slightly but remains large
with White students scoring 0.7 standard deviations higher on 4th grade standardized tests
with similar findings for the White-Hispanic achievement gap (Reardon et al., 2013). While
education may be described as a “great equalizer”, it can also contribute to and widen racial
inequalities. Fryer Jr and Levitt (2004) show that Black and White students enter school
with similar test scores in reading and math, but each year in school widens the gap by 0.1
standard deviations.
A number of potential explanations and mechanisms could be behind these differences
including differing resources, differing qualities of schools, and others. Among these possible
mechanisms is the racial distribution of teachers and how teachers improve outcomes for
same-race students. Past literature shows that same-race teachers can also increase students’
short-term, course-level outcomes like test scores, grades, and behavior1. Teachers may be
more effective at communicating and teaching same-race students or may work effectively
as role models, updating students’ beliefs about the returns to education or increasing their
motivation2. In support of the role model hypothesis, past literature shows that having
a same-race teacher increases teachers’ and students’ expectations of student educational
attainment3. Because race matching has been shown to significantly impact short-term
outcomes like test scores and expectations, it is plausible that it can also impact longer-
term outcomes. I explore the short-term and long-term effects from race matching using a
fixed effect strategy paired with institutional knowledge to mitigate endogenous sorting of
students and teachers.
An inherent issue in the student-teacher demographic matching literature is that students
1(Dee (2004); Dee (2005); Fairlie, Hoffmann and Oreopoulos (2014); Egalite, Kisida and Winters (2015);Holt and Gershenson (2017); Lusher, Campbell and Carrell (2018))
2(Ladson-Billings (1995); Walker (2001); Marx and Roman (2002); Dee (2005); Gershenson et al. (2018))3Ferguson (2003); Fox (2015); Papageorge, Gershenson and Kang (2018)
1

and teachers are not randomly assigned to each other4. Much of the literature focuses on
elementary and middle school students because as students get older, they have a greater
choice in their courses, increasing the risk of endogenous teacher selection (Paufler and
Amrein-Beardsley, 2014). High school race matching has been largely unexamined because
of the concerns of endogenous sorting despite high school’s importance in college attendance
and college major choice.
To address this endogeneity concern, I use newly collected Texas administrative data
on classroom assignment and exploit institutional details of the assignment of students to
teachers in Texas high schools. Texas is an extremely diverse state with large minority pop-
ulations, making it an excellent setting to analyze racial matching of students and teachers.
High school students in Texas have choices over courses, but they lack the choice of teacher
conditional on courses. In order to minimize non-random sorting of students and teachers,
I compare the outcomes of similar students in the same high school that selected the same
courses but were assigned teachers of different races. My strategy reduces observable same-
race sorting by about 99% for each race. To address concerns of remaining observable and
unobservable endogenous sorting, I implement the bounding methodology proposed by Oster
(2019) and show that the results for minority students are largely robust to the potential
issue of selection on unobservable characteristics and omitted variable bias.
First, I examine the effect of matching with a same-race teacher in a course on course-
level outcomes. Conditional on student and teacher fixed effects, I show that Black and
Asian students perform significantly better on standardized test scores and have higher pass
rates in the class that they match with a same-race teacher. These students score better
along both objective and subjective measurements of course performance with a same-race
teacher, suggesting an increase in learning. I find no significant effect for short-term race
matching effects for White or Hispanic students.
Next, I examine the longer-term effects of matching with a same-race teacher. I aggre-
4Clotfelter, Ladd and Vigdor (2006); Rivkin, Hanushek and Kain (2005); Paufler and Amrein-Beardsley(2014);Rothstein (2009); Koedel and Betts (2011)
2

gate a student’s 9th grade teachers and examine the effect of having an additional same-race
teacher on the likelihood of graduating from high school and enrolling in college. To min-
imize non-random sorting, I compare students that selected the exact same set of courses
but received teachers of different races. I find large effects from race matching for minority
students in high school graduation and college enrollment. Hispanic and Asian students be-
come significantly more likely to graduate high school with an additional same-race teacher.
One additional race match for Black and Hispanic students significantly increases their like-
lihood of enrolling in college by 1 p.p. (2%) and 1.5 p.p. (3.4%), respectively. The effect
for race matching for minority students is large in magnitude, but smaller than the only
other estimate in literature. Gershenson et al. (2018) finds a 4 p.p. increase in college en-
rollment for Black students with one additional Black teacher in elementary school using
random assignment, which is four times my estimate, suggesting my estimates are plausible.
I find small, significantly positive effects for race matching for White students on two-year
college enrollment, but I show that these results are not robust to the bounding methodology
described in Oster (2019).
I also show that race matching in a subject in high school has strong effects for college
major choice, especially for Science, Technology, Engineering, and Math (STEM) fields. One
additional same-race STEM teacher in high school for Black and Hispanic students increases
a student’s likelihood of majoring in STEM as a college freshman by 0.7 p.p. (8.6%) and 0.6
p.p. (6.6%), respectively. An additional Hispanic teacher in social sciences for a Hispanic
student increases their likelihood of majoring in social sciences by 0.3 p.p. When examining
major choice one concerning pattern is that Black and Hispanic students in college are less
likely to major in STEM fields, which have larger wage premiums (Altonji, Blom and Meghir,
2012). These differences in major choice could contribute to racial income gaps. My findings
paired with the dearth of Black and Hispanic students in STEM fields suggest a need to
train and hire more STEM minority teachers.
I find large effects for race-matching on longer-term outcomes like college enrollment, but
3

that specification imposes linearity, which could be a strong assumption. How the marginal
effect of race-matching varies with the number of matches is an important policy relevant
question as well. I relax this linearity assumption and explore potential non-linear effects of
race matching on these longer-term, individual level outcomes. The effect of race matching
for Black and Hispanic students plateaus after two race matches for certain outcomes like
two-year college enrollment, suggesting that the effect of race matching could be non-linear.
In the non-linear model, White students do not significantly benefit from any race matches
in any outcomes, giving further evidence that these race-match effects are strongest for
minority students. (Gershenson et al., 2018) developed a model using marginal returns to
race matching to explore mechanisms where constant marginal returns imply that teachers
are more effective at teaching same-race students while diminishing marginal returns imply
that teachers act as role models, updating students’ beliefs about the returns to education.
My evidence provides further evidence that role model effects may be the mechanism that
same-race teachers improve student outcomes.
While I find large effects for minority students, I do not find robust, significant evidence
for White students benefiting from having same-race teachers on short-term, course-level out-
comes like test scores nor on longer-term, individual-level outcomes like college enrollment.
White teachers make up over 70% of high school teachers in Texas while White students
only make up about 35% of the student population. My research suggests that policies to
make the teaching population more representative would likely benefit minority students
with minimal negative spillovers impacting the White student population from having fewer
same-race teachers.
To test how educational attainment would change with more minority teachers, I con-
duct the following thought experiment using Monte Carlo simulations: suppose that the
racial distribution of the teachers matches the racial distribution of the students. In 5,000
simulations, I randomize teacher race with weights such that each high school has a racial
distribution of teachers that is representative of the racial distribution of students. This
4

thought experiment is likely an infeasible policy, but it still may be instructive to exam-
ine how a more representative teacher population would affect students. Next, I see how
many additional or fewer race matches each race of students receives and then multiply by
my point estimates to get back-of-the-envelope calculations. I find large increases in His-
panic high school graduation and college enrollment and relatively small decreases for White
students. Specifically, my back-of-the-envelope calculations suggest that a representative
teaching population would increase the aggregate high school graduation rate by 0.5 p.p.
or about 2,500 additional students graduating high school and would increase the aggregate
college enrollment rate by 0.8 p.p. or about 4,000 additional students enrolling in college.
I contribute to the previous literature in three main ways. First, I present the first research
examining the effect of race matches in high school on college outcomes such as enrollment
and major choice. High school race matching has gone largely unexamined despite the
importance of high school in college enrollment and major choice5. These long-term effects
of race matching on high school graduation and college enrollment have also gone unexamined
with the exception of Gershenson et al. (2018), which examines the effect of race matching
for Black and White elementary students. They omit Hispanic and Asian students from
their analysis for sample sizes issues. However, Hispanic and Asian students grow every year
as a percentage of the population, and together make up over 50% of the student population
in Texas. My second contribution is that I include Hispanic and Asian students in my
analysis, presenting the first evidence on the effect of race matching at any school level for
Hispanic and Asian students on longer-term outcomes such as high school graduation and
college enrollment. Finally, I add to the literature by providing additional estimates of the
short-term effect of matching with a same-race teacher on test scores and pass rates using a
large, detailed administrative dataset.
5(Maltese and Tai (2011); Rask (2010)
5

2 Literature Review
Examining the effect of student-teacher demographic matching is not new. However, there
is a dearth of literature examining high school race matching. An inherent issue in the
student teacher matching literature is that students and teachers are not randomly assigned
to each other, except in special cases like the STAR classroom experiment in Tennessee or
in the military6. Typically, researchers believe that this non-random sorting of students and
teachers increases with student age from elementary school to middle school to high school
as students have greater choices in courses (Paufler and Amrein-Beardsley, 2014). Hence,
researchers focus their attention on elementary and middle school where endogenous sorting
is less likely to occur, leaving high school race matching woefully underexamined despite
being an important time in a student’s educational career.
I contribute to the literature by presenting the first evidence examining the effect of high
school race matching on college outcomes. Sass (2015) is the only other paper to examine the
interaction of high school teacher race with student race. However, he only examines indirect
matching, using high school faculty composition and cannot directly observe matching within
a classroom. While this method is instructive, teacher composition may impact students
through non-classroom interactions such as extracurricular activities like sports and clubs as
well as having potential spillovers to affecting other teachers through peer effects. Estimating
the effect of race matching using the faculty composition will provide a muddied estimate
of the true effect of matching in a classroom. By observing the direct match of students
and teachers within a section in a course will allow me to better estimate the effect of race
matching.
This research also fits in with a few different literatures in the education field. It most
closely relates to the student-teacher demographic matching literature. I will draw a distinc-
tion in the types of outcomes examined in the literature between short-term and longer-term
outcomes. Short-term outcomes are outcomes that change in the classroom when a student
6(Dee (2005); Carrell, Page and West (2010); Gershenson et al. (2018))
6

and teacher match with each other like grades, behavior, expectations, and test scores. Long-
term outcomes are outcomes that are realized years after a race match like college enrollment
or graduation.
Much of the early research shows there are short-term benefits to race matching7. Much
of the literature on sex matching complements this work and suggests similar effects for
sex matching8. The literature suggests positive effects overall from demographic matching,
but there is a notable hole in the literature on short-term benefits. These studies typically
focus exclusively on White and Black students with only one other study examining course
outcomes from race matching for Hispanic and Asian students (Egalite, Kisida and Winters,
2015). I contribute to the literature by providing the only other estimates of short-term
benefits from race matching for Hispanic and Asian students as well as providing additional
estimates for White and Black students using a large administrative dataset.
Most of the student-teacher race matching literature focuses on short-term outcomes,
missing the longer-term effect of race matching. I present the first paper to examine long-
term effects of race matching for Hispanic and Asian students. Only one paper tackles the
question of long-term effects by looking at the Tennessee STAR randomization experiment
(Gershenson et al., 2018). They show that Black students that were randomly assigned a
Black teacher in Kindergarten to third grade are 5 p.p. more likely to graduate high school
and 4 p.p. more likely to enroll in college. However, they fail to address how race matching
affects Hispanic and Asian students, which I examine. Many of the race matching studies
focus exclusively on Black and White students for sample size purposes 9. However, Hispanic
students are nearly 50% of public high school students in Texas. The Hispanic and Asian
population are large and growing groups in the United States, underlying the importance of
their inclusion.
Gershenson et al. (2018) examines the long-term effects of race-matching for Black and
7(Dee (2004); Dee (2005); Fairlie, Hoffmann and Oreopoulos (2014); Egalite, Kisida and Winters (2015);Holt and Gershenson (2017); Lusher, Campbell and Carrell (2018))
8(Nixon and Robinson (1999); Dee (2006), Dee (2007); Cho (2012); Winters et al. (2013); Sansone (2017))9(Dee (2004); Dee (2004); Gershenson et al. (2018))
7

White students in elementary school on high school graduation and college enrollment. My
paper furthers the literature by analyzing the timing of race-matching and its importance.
Heckman emphasizes the need for interventions to occur as early in a childhood as possible,
showing that effects impacting skills and learning grow and build over time in a synergistic
fashion (Heckman (2000); Cunha and Heckman (2007)). Race-matching in elementary school
has large effects on high school graduation and college enrollment (Gershenson et al., 2018).
Whether or not this effect is still present from race-matching in high school is an open
question and informs this broader literature on the timing of educational interventions.
Students exposed to same-race teachers in high school may not have sufficient time to change
their skills and human capital from the treatment relative to students in elementary school.
Students in high school may also have stickier beliefs about returns to education, suggesting
an attenuated effect relative to an elementary school match. I confirm this hypothesis in the
results section, showing that the effect of Black students matching in high school on college
enrollment is about 25% smaller than what Gershenson et al. (2018) finds for matching in
elementary school.
There are several potential reasons why demographic matching of students and teachers
may improve student outcomes. One theory of race matching impacting student outcomes
is that same race teachers have a culturally relevant pedagogy (Ladson-Billings, 1995). Stu-
dents benefit from same-race teachers because those teachers can effectively communicate in
a cultural context by helping students affirm their cultural identity and challenge inequities
that schools can instill and perpetuate (Ladson-Billings, 1995). Related to culturally rel-
evant pedagogy, cultural synchronization describes the interpersonal cultural context that
exist between Black students and teachers (Irvine, 1990). This cultural relevancy of same-
race teachers has also been documented qualitatively in Native Hawaiian children and native
American students in observing student-teacher interactions (Au and Jordan (1981); Mohatt,
Erickson et al. (1981)).
Another potential reason is that underrepresented students interacting with a same-race
8

teacher may benefit from a role model effect, updating their beliefs about returns to education
and increasing their learning (Walker (2001); Marx and Roman (2002); Dee (2005)). A grow-
ing literature on students’ and teachers’ beliefs and expectations suggest that race-matching
can greatly improve a student’s expectations about their own abilities, an important input
to education (Dee (2005), Fox (2015); Papageorge, Gershenson and Kang (2018)).
This research also informs the college major choice literature. Much of the major choice
literature focuses on college interventions like faculty composition or peer groups 10. Some
of this literature focuses on the persistence of students in a STEM major, but it misses
a crucial determinant of major preference – high school. Most of the work on high school
factors impacting major choice in college are descriptive but suggest that high school is where
many students form their preferences for subjects and subsequently their future major in
college 11. The best paper on high school determinants of college major choice instrumented
for additional math and science course taken with state law changes and show a significant
increase in STEM majors (Federman, 2007).
In conclusion, I contribute to the literature in three main ways. First, I am the first to
examine direct high school race matches on college outcomes such as enrollment and college
major choice. Second, I am also the first to examine long-term effects for race matching
for Hispanic and Asian students. Finally, I add to the literature by providing additional
estimates of the short-term effect of matching with a same-race teacher on test scores and
pass rates using a large, detailed administrative dataset. Texas, the setting of my research, is
an incredibly large and diverse state with many Hispanic, Black, Asian, and White students
allowing me to take a robust snapshot of race matching in high school.
10(Canes and Rosen (1995); Bettinger and Long (2004); Ost (2010); Price (2010); Fischer (2017))11(Maltese and Tai (2011); Rask (2010); Morgan, Gelbgiser and Weeden (2013); Bottia et al. (2015);
Bottia et al. (2018))
9

3 Data
Texas is an excellent state to examine the effects of race matching because it is a large
and diverse state. My data come from the Texas Education Research Center, combining
data from the Texas Education Agency (TEA), the Texas Higher Education Coordinating
Board (THECB), and National Student Clearinghouse (NSC). The TEA, the regulatory body
that oversees K-12 education in Texas, collects data on student enrollment, demographics,
and outcomes on the universe of students in public K-12 education. The THECB is the
higher education counterpart to TEA. The THECB only collects information on students
in higher education in Texas, so I supplement that data with NSC data, which contains
enrollment and major choice for all colleges in the United States. The datasets are linked
using de-identified Social Security numbers, ensuring high-quality links between high school
and college outcomes.
I observe every section that a student is assigned to in every course that student takes.
I also observe every student and every teacher in every public high school from 2012 to
2016. The data differentiate between Advanced Placement and International Baccalaureate
courses and regular courses as well as advanced and remedial courses, allowing me to control
for different tracking of students. I follow the 2012 and 2013 freshmen cohorts for four years in
high school and one year afterwards to examine college enrollment and major choice. I limit
my course sample to sections without co-teachers that have section sizes larger than or equal
to five and less than or equal to 40. Sections smaller than 5 are typically special classes with
selected students. Most sections larger than 40 are mainly large physical education courses.
Finally, I eliminate all music, art, physical education, and foreign language courses to focus
on academic courses.
Starting in 2012, TEA began collecting class-level data on which teachers were assigned
to which student in a given course and whether a student passed that course or not. I link
the course level information to student test scores, which TEA administers in five courses:
Algebra I, Biology, English I, English II, and US History. I normalize the test scores to a
10

Z-score with a mean of zero and standard deviation of one. The TEA administers these
standardized tests to all students that take these courses in the state, and the students must
pass these tests to receive credit for the courses. These standardized tests are high-stakes,
multiple choice tests with little to no room for subjective grading. These are the only five
standardized tests that are administered to students in high school in Texas, so I can only
examine the effect of race matching on a student’s test scores in these five courses. Another
outcome I examine is whether the student passed their course, which I observe in every
course. These two related yet distinct measures of course performance allows for testing
of different mechanisms. The state of Texas grades test scores objectively through multiple
choice grading, while teachers determine if a student passes a class through some combination
of grading of assignments and interactions in the class.
My outcomes separate into two different categories: short-term, course-level outcomes,
and long-term, individual-level outcomes. The short-term, course-level outcomes such as
test Z-scores and an indicator for passing a course vary at the course level where I can see
a student have multiple outcomes. I examine the effect of race matching in a course on
these outcomes which are vary at the course-level. The long-term outcomes such as high
school graduation, college enrollment, and major choice are individual-level outcomes that
are constant for a given individual. I estimate the effect of race matching at the individual-
level after a student matches with a 9th grade teacher of the same race. I define high school
graduation as graduating four years from 9th grade and enrollment in college as enrolling
five years from 9th grade. I observe what major students choose as a freshman in college
and if they attend a two- or four-year college. I examine all academic courses that every
student in public high school takes and the teacher that they are assigned, resulting in about
9 million student-course observations for 649,320 students and 78,453 teachers.
Another benefit to using the Texas administrative data is the inclusion of detailed de-
mographic information. TEA data also contain information on students including race, age,
sex, free or reduced-price lunch status and indicators for if a student is considered gifted or
11

at-risk of dropping out. I also include 8th grade test scores taken by students to control for
pre-high school ability in school. The data contains detailed demographic information on
teachers as well as students, including race, sex, education level, pay, tenure, experience, and
age. I use the detailed demographics of students and teachers to determine race matches
and control for potentially confounding factors.
I present some descriptive statistics on differences in academic outcomes and character-
istics by race in Table 1 where the unit of analysis is the student in Panel A. Unsurprisingly,
large gaps exist in academic achievement along racial lines. Black and Hispanic students are
far less likely to graduate high school, enroll in college, and major in STEM compared to
their Asian and White counterparts. They are also less likely to pass their courses and on av-
erage have lower standardized test scores. Asian students have the highest rates of academic
achievement with respect to high school graduation, college enrollment, test scores, and pass
rates. Students also show extreme disparities in student characteristics along race lines that
may be a function of a lack of representation in teachers at a younger age in elementary
school. For instance, Black and Hispanic students are far less likely to be considered “gifted
and talented” than White or Asian students.
These racial gaps in academic achievement shown in Panel A could be attributable in
part to the racial distribution of teachers. In Panel B of Table 1 I show the statewide
racial composition of students and teachers. The teacher composition in high school is
overwhelmingly White relative to the student population. White students make up 33%
of the student population but over 70% of the teachers in the sample are White. Black
and Hispanic teachers comprise only about 9% and 18% of the sample, respectively. Black,
Hispanic, and Asian students are underrepresented in the teacher composition relative to
White teachers who comprise the vast majority of teachers.
12

4 Methodology and Empirical Strategy: Short-term
4.1 Sorting
An inherent issue in the student-teacher matching literature is that schools do not randomly
assign students to teachers. Unfortunately for the econometrician, students have choices
over what courses to take and subsequently what teachers they are assigned. Researchers
commonly believe that the non-random sorting of students and teachers increases as students’
age increases from elementary to middle school and middle school to high school as students
get older and are given greater freedom in which courses they can take (Paufler and Amrein-
Beardsley, 2014). This belief about sorting helps explain why much of the student-teacher
matching literature focuses on elementary and middle school students with a dearth of studies
on high school matching.
Sorting, especially along race lines, is most prominent across high schools with large
amounts of racial segregation across schools. However, sorting also occurs within schools
as well (Clotfelter, Ladd and Vigdor (2006); Rivkin, Hanushek and Kain (2005); Paufler
and Amrein-Beardsley (2014);Rothstein (2009); Koedel and Betts (2011)). The pre-college
literature on matching in observational studies focuses on using student fixed effects (Dee
(2007); Winters et al. (2013); Sansone (2017)), but researchers admit that student fixed
effects are likely not sufficient to solve sorting as an issue (Dee, 2005).
Another attempt to get around non-random sorting is to use variation in teacher compo-
sition in college faculty to instrument for a match by sex (Bettinger and Long, 2004). The
technique has been applied in matching papers for race in elementary school (Gershenson
et al., 2018). One potential issue is that these papers do not identify the effect of a match but
instead are identifying off of a general composition change, and the effect could be working
through other mechanisms such as extracurricular activities with student clubs and athletics
(Gershenson et al., 2018).
Conversations with Texas high school administrators suggest that students have choices
13

over the courses they take, but they have no choice in which teacher they are assigned
conditional on course selection. The precise mechanism for assigning students and teachers
to classroom likely varies across school districts and schools and is unobservable. The natural
experiment that I will exploit is by comparing two students in a given high school that both
take the same course in same academic year, but one student is assigned teacher A and the
other is assigned teacher B. For example, two Black students in the same high school choose
to both take Algebra 1 in 2013, but one student is assigned to Black teacher and the other
is assigned to a White teacher. To implement this, I employ a high school-by-year-by-course
fixed effect.
My identifying variation in this case will be courses in a given high school and year
that have multiple teachers with different races such that one teacher would produce a race
match for a student and the other teacher would not. I present the high school campuses with
courses that have multiple teachers with different races in Figure 1, showing the relationship
between students and teachers of the same race. The gray points in the scatter plot show
which schools lack multiple different race teachers for any courses. The identifying variation
comes from the courses at the high schools with color. The figure shows a strong clear
correlation between the student and teacher composition at the school level, stressing the
need to examine within a high school. It also shows that the campuses that are heavily
composed of one race for teachers do not contribute to the identifying variation since they
lack multiple race teachers at the course level. The figure shows that there are several points
close to each other but some campuses have courses contributing to the identifying variation
and others do not. Campuses with similar student and faculty composition can also vary in
whether they have courses with multiple teachers of different races.
One way to test my fixed effect strategy is to examine how likely a student of a given
race/ethnicity is to be assigned a teacher of the same race/ethnicity and how that likelihood
changes as I introduce additional information. In an ideal scenario, one would randomize
students to teachers, and students would be no more likely to receive a same-race teacher
14

than a student of a different race. For example, a Black student would ideally be no more
likely than a White student to have a Black teacher. To test how similar the student to
teach assignment is to the ideal experiment, I run the following regressions with varying
fixed effects to see how sorting changes where the unit of analysis at the student by course
level.
BlackTeachjc = α1BlackStuic + α2Xit + φhct + εijhct (1)
HispTeachjc = β1HispStuic + β2Xit + φhct + εijhct (2)
AsianTeachjc = γ1AsianStuic + γ2Xit + φhct + εijhct (3)
WhiteTeachjc = δ1WhiteStuic + δ2Xit + φhct + εijhct (4)
In these equations, I regress an indicator for student i’s race in course c on an indicator
for teacher j’s race. I include a vector of student characteristics including demographic and
socio-economic factors such as free and reduced priced lunch status, gifted and talented
status, and 8th grade test scores to control for pre-high school ability in school. Finally, I
include ψhct giving high school by year by course fixed effects. The coefficients of interest
are α1, β1, γ1, and δ1. In equation (1), α1 represents the likelihood that a Black student
will have a Black teacher relative to a White student as White students are used as the
reference group. β1 and γ1 represent the likelihood a Hispanic or Asian student will have a
same-race teacher relative to a White student. Finally, δ1 represents the likelihood that a
White student will have a White teacher relative to a Hispanic student.
In Figure 2, I show how α1, β1, γ1, and δ1 vary, becoming closer to zero when changing
from no fixed effect to high school fixed effect to high school-by-year-by-course fixed effects.
15

I cluster my standard errors at the school level. I present the full output in regression tables
in the Appendix Tables A1-A4. We can see that in the regression without fixed effects,
Hispanic students are about 22 p.p. more likely to have a Hispanic teacher relative to a
White student. However, when using the high school by year by course fixed effects, this
non-random sorting is greatly reduced to Hispanic students being 0.12 p.p. more likely
to have a Hispanic teacher, a more than 99% reduction in the likelihood. While Hispanic
students are statistically significantly more likely to have a Hispanic teacher, the increased
likelihood is economically small. The increased likelihood suggests that for every 820 courses
that Hispanic students take, there is one additional Hispanic teacher than there would be
under true random assignment.
Another way to empirically test how sorting changes is to examine which covariates of
students predict having a same race teacher and how those covariates change with additional
fixed effects. In an ideal experiment with randomization, Hispanic students receiving free or
reduced priced lunch would be no more likely to receive a Hispanic teacher than Hispanic
students paying full price for lunch. I limit each regression to one race of students and see
which covariates predict same race teachers. Specifically, I run the below regressions, limiting
each regression to only one race to examine what covariates of Black students predict having
a Black teacher or what covariates of Hispanic students predict having a Hispanic teacher.
BlackTeachjc = α3Xit + φhct + εijhct (5)
if StuBlackic = 1
HispTeachjc = β3Xit + φhct + εijhct (6)
if StuHispic = 1
16

AsianTeachjc = γ3Xit + φhct + εijhct (7)
if StuAsianic = 1
WhiteTeachjc = δ3Xit + φhct + εijhct (8)
if StuWhiteic = 1
The coefficient α3, represents the likelihood that a Black student with a given charac-
teristic will have a black teacher, and β3 represents the likelihood that a Hispanic student
with a given characteristic will have a Hispanic teacher. I cluster my standard errors at the
school level. I present these coefficients and how they change in response to different levels
of fixed effects in Figure 3. The corresponding regression tables are displayed in Appendix
Tables A5-A8.
A consistent pattern of convergence to zero seen in the two sorting methodologies suggests
that including high school fixed effects better controls for non-random sorting than the
regressions without fixed effects, as seen in Sass (2015). Including the course information by
including the high school by year by course fixed effects also reduces the non-random sorting
further than the high school fixed effects as well.
4.2 Estimation
I examine two different types of outcomes: course-level outcomes and individual-level out-
comes. The course-level outcomes such as test Z-score and pass rates vary at the course for
each individual. This variation allows me to estimate the effect of race matching with the
inclusion of student-level fixed effects to control for time-invariant student characteristics.
Including student fixed effects is another strategy that previous researchers have used to
17

control for non-random, endogenous sorting of students and teachers.12 I also include the
high school by year by course fixed effect to minimize sorting. For the course-level outcomes,
I estimate the effect of race matches using this strategy below where the unit analysis at the
student by course level:
(9)Zijct = β1BlackMatchijc + β2HispMatchijc + β3AsianMatchijc + β4WhiteMatchijc+ γ1Xit + γ2πjt + ψi + δj + φhct + εijhct
Here Zijct gives the Z-score for a standardized test for student i with teacher j in course
c in year t. Another outcome examined is an indicator for if the student passes her course.
Each match variable is an indicator for if the student matches along race lines with her
teacher in course c. There is a vector for time-varying student characteristics in Xit and for
time-varying teacher characteristics in πjt. Finally, I include three fixed effects: student fixed
effects, ψi, which controls time-invariant unobservable student characteristics; teacher fixed
effects, δj, to control for time-invariant teacher characteristics like quality; and high school
by year by course fixed effects, to control for non-random sorting of students and teachers
across courses. I cluster my standard errors at the school level.
The coefficients of interests are β1, β2, β3, and β4 and the interpretation on the coeffi-
cients is the effect of having a race match for Black, Hispanic, Asian, and White students,
respectively. These coefficients estimate the effect of a race match relative to another student
of that same race who received a different race-teacher. For instance, β1 gives the effect for a
Black student having a Black teacher relative to a Black student having a non-Black teacher
conditional on student and teacher fixed effects.
This estimation strategy is akin to a difference-in-difference with the high school by year
by course and student fixed effects. The student fixed effects make the regression estimates
the change in a student’s test scores with a same-race teacher relative to that student’s
test scores with a different-race teacher. The high school by year by course fixed effect
will compare students with a race match to students without a race match taking the same
12Dee (2007); Winters et al. (2013); Sansone (2017)
18

course. The result of having both in the equation is that β1, β2, β3, and β4 are estimating
the change in a student’s test scores with a race match to the change in a student’s test score
without a race match.
For example, without the student fixed effect, β1 would compare the test score of a Black
student with a Black teacher to the test score of a Black student with a non-Black teacher,
which is one difference. Adding in the student fixed effect will make the comparison within
the student as well, adding another difference. Using both student and high school by year
by course fixed effect creates two differences that contribute to the coefficients of interest.
This estimation strategy is not a traditional difference-in-difference estimation, but it is a
similar strategy by comparing the difference between the change in test scores for students
with and without a same-race teacher.
5 Short-term Results
5.1 Course-level Outcomes
In Table 2, I present the course-level outcomes and the effect of a race match. When
examining the short-term outcomes from the course that a student matches with same-race
teacher, Black and Asian students perform significantly better. Black students matched with
Black teachers perform 0.013 standard deviations better on standardized tests and are 0.9
p.p. more likely to pass their courses than they would have if they had a non-Black teacher.
Asian students have a larger premium from race matching with an increase of 0.07 standard
deviations on standardized tests and become 1.4 p.p. more likely to pass their courses. Test
scores are limited to only five courses: Algebra I, Biology, English I, English II, and U.S.
History, so the sample size is smaller than that of the regression looking at the course pass
rate.
Ultimately, test scores and pass rates are two different measures of a student’s perfor-
mance in a course. However, they vary in how they are graded. Texas administers the tests
19

to all students in the state that take Algebra I, Biology, English I, English II, or U.S. History.
The tests are graded externally and are multiple choice, eliminating subjective grading. The
English exams have essays, which are also graded by the state with a systematic rubric.
Students must pass these high-stakes tests to earn credit for the courses, each of which is a
mandated class to graduate high school. On the other hand, passing a class is dependent on
the student-teacher interactions with a teacher’s discretion playing a role at multiple points.
Whether or not a student passes a class is more a subjective measure than the student’s
performance on a standardized, state-wide exam. One concern would be if students became
more likely to pass their classes but did not improve their test scores, which could indicate
that teachers are more favorable with their grading to same-race students. However, given
that there are significant improvements in test scores and pass rates, the findings suggest that
Black and Asian students perform better with same-race teachers in objective and subjective
measures of performance.
Interestingly, only Black and Asian benefit from race matching in the short-term. His-
panic and White students do not significantly improve their test scores or pass rates. To
assess reasons for why there may be an effect for Black and Asian students, we should as-
sess the mechanisms for an improved performance with a same-race teacher. There are two
main theories behind why students perform better with same race teacher. The first is that
teachers more effectively communicate ideas and teach same-race students because there
is some shared cultural connection (Irvine (1990); Ladson-Billings (1995)). The second is
that teachers act as role models to students, updating their beliefs about own abilities or
returns to education, and these role models may be more effective for students who are more
underrepresented (Marx and Roman (2002); Dee (2005)).
One potential explanation for this split in race-match results is that Black and Asian
teachers and students are relatively rare compared to White and Hispanic teachers and
students in Texas. As I show in Table 1, Black and Asian teachers make up 9% and 2% of
the teacher population, and Black and Asian students make up a small fraction of the student
20

body in Texas high schools at 14% and 4%, respectively. Making up a smaller proportion
of the student body may make race-matching more salient for Black and Asian students.
In particular, it may mean that the culturally relevant interactions for Black and Asian
students that are matched with a same-race teacher are more poignant and more effective,
whereas Hispanic and White students are effectively a majority already at 50% and 33%
of the student population, respectively. However, these culturally relevant interactions for
Black and Asian students do not necessarily preclude role model effects from occurring either
as both of these mechanisms could be working together. Later on, I will test whether or not
role model effects are a potential mechanism for long-run outcomes using a model developed
by Gershenson et al. (2018).
5.2 Heterogeneity
One potential source of heterogeneity is in student ability. It is possible that the gains from
student-teacher race matching are stronger for students at the bottom of the distribution.
Given that Black and Asian students are more likely to pass their classes when they have a
same-race teacher would suggest that students at the bottom of the distribution are affected
because a student going from a “C” to an “A” would not be captured by the passing measure,
but a student going from a “F” to a “C” would be captured in this measure.
To explore how matching affects students of different ability, I break down the sample
into quartiles by 8th grade standardized test scores in reading and re-run the analysis. Given
the tests were taken in 8th grade, they will be unaffected by any intervention at the high
school level and should work as an approximation for a student’s underlying ability in school.
I present the course-level outcomes in Table 3:
The pattern seen in the average effects is mostly the same with Black and Asian students
benefiting from matching via race lines with one exception. Hispanic students at the bottom
of the test score distribution become 0.3 p.p. more likely to pass their classes with a Hispanic
teacher. For Black students, the effect of race matching on test scores and pass rates is
21

negatively correlated with 8th grade reading scores. There is also a negative correlation in
the effect size of race matching on tests score, but no correlation for the effect on passing a
course.
The correlations between 8th grade reading scores and the effect of race-matching on
improving test scores suggest that Black and Asian students at the lower-end of the ability
distribution are most impacted by having a same-race teacher. It is possible that the lower-
ability students can make up more ground from a race-match relative to their higher-ability
peers. There’s a different interpretation for the effect on pass rates though. The declining
effect may not be a function of decreased effectiveness of a match. A student at the higher
end of the ability distribution may also benefit from matching but the passing rate may not
be the margin that is impacted. A high-ability student may go from earning a “B” in a class
to earning an “A” from race matching with a teacher, but that would not impact their pass
rate. However, high-ability Black and Asian students still have their pass rate significantly
improved from race matching, even though these students were already more likely to pass
their classes than their lower-ability peers.
6 Methodology and Empirical Strategy: Long-term
6.1 Sorting
In the short-term empirical strategy, my previous unit of analysis is at the student by course
level, which naturally fit with course-level outcomes like test scores and pass rates. However,
for longer-term, individual-level outcomes like high school graduation, college enrollment,
and major choice that vary at the individual level the unit of analysis should be at the
student level. My identification strategy for course-level outcomes comes from variation at
the course-level with respect to which teachers are assigned to which students and uses a
high school by year by course fixed effect. Aggregating the data to the student-level will lose
this granular course information. I implement a course-set fixed effect to circumvent this
22

aggregation problem. The course-set fixed effect will group together and compare student
who took the exact same set of academic courses in the 9th grade in a given high school,
allowing the aggregated student-level outcomes to retain course information.
This course-set fixed effect effectively exploits the same variation as the high school-by-
year-by-course fixed effect while also controlling for the other courses that a student also
took. I compare students in the same high school with identical course selections, but one
student idiosyncratically receives more same-race teachers than a different student. For
example, two Black freshmen students at the same high school both selected to take Algebra
1, English 1, Chemistry, and Geography, but one of these students received a Black Algebra
1 teacher and the other received a White Algebra 1 teacher. My strategy will compare these
two students because they have the same course-set but different teachers conditional on
their course selection.
My sample selection changes slightly as there are some students without a comparable
student with an identical course-set in a given high school, but my sample is still left with over
500,000 students over two cohorts. I present summary statistics in Table 4, which suggest
that the new sample is slightly negatively selected with respect to high school graduation as
compared to the previous sample with all students in it. However, the racial composition
of students and teachers looks nearly identical to the sample in the first section examining
short-term outcomes. The new sample is similar in enrollment to the old sample as well.
I create the course-set using the 9th grade courses that a student selects and the teachers
they are as. I focus on 9th grade courses because down-stream race matches in later grades
are potentially endogenous. Race matching in the 9th grade potentially affects a student’s
propensity to remain in high school. Later race matches in the 10th, 11th, and 12th grade are
a function of race matching in the 9th grade and are endogenous if 9th grade race matches
increase a student’s likelihood to persist in school. However, I do show in the robustness
check section that including 10th grade courses does not meaningfully change the estimates.
I run similar sorting estimation strategies as the previous section to see how well this
23

specification controls for endogenous sorting. Similar to the previous sorting strategies, I
present the regression output with varying levels of fixed effects to examine how non-random
sorting changes and gets closer to zero using the full course-set fixed effects. Specifically, I
estimate the below equations:
NumBlackTeachi = α1BlackStui + α2Xi + κs + εis (10)
NumHispTeachi = β1HispStui + β2Xi + κs + εis (11)
NumAsianTeachi = γ1AsianStui + γ2Xi + κs + εis (12)
NumWhiteTeachi = δ1WhiteStui + δ2Xi + κs + εis (13)
In these equations, I regress the number of same-race teachers that a student has in 9th
grade on an indicator for a student’s race on. Xi is a vector of student characteristics includ-
ing gifted/talented status, free/reduced price lunch status, and 8th grade test scores. κs is
the course-set fixed effect. I also include a specification with a cohort course-set fixed effect
to limit the course-set comparisons to within a cohort. The standard errors are clustered at
the school level. Similar to the previous sorting equations, I present these coefficients graph-
ically in Figure 4. The corresponding regression tables are displayed in Appendix Tables
A9-A12.
I run the covariate sorting equations from the previous section as well to examine which
covariates predict having more same-race teachers and how those covariates change with the
course-set fixed effect. I run the regressions below, limiting each regression to only one race
of students to examine which covariates of students predict having more same-race teachers.
The standard errors are clustered at the school level.
24

NumBlackTeachi = α3Xi + κs + εis (14)
if StuBlacki = 1
NumHispTeachi = β3Xi + κs + εis (15)
if StuHispi = 1
NumAsianTeachi = γ3Xi + κs + εis (16)
if StuAsiani = 1
NumWhiteTeachi = δ3Xi + κs + εis (17)
if StuWhitei = 1
I present coefficients α3, β3, γ3, and δ3 in Figure 5. The corresponding regression tables are
displayed in Appendix Tables A13-A16. In an ideal randomized experiment, these covariates
would be balanced. For example, a gifted Black student would ideally be no more or no less
likely to have more Black teachers than a non-gifted Black student. These regressions allow
one to examine how the balance of covariates changes with different fixed effect strategies.
Overall, in both Figures 4 and 5 that there is a general convergence of the coefficients that
indicate non-random sorting toward zero, suggesting that there is a reduction in the non-
random sorting of students to same-race teachers. In particular, nearly all of the covariates
that predict having a same-race teacher converge to zero and are no longer statistically
significant, bringing this natural experiment closer to a plausibly random distribution. The
figures suggest course-set fixed effects strongly reduce the amount of endogenous sorting that
occurs over no fixed effects or high school fixed effects.
25

6.2 Estimation
I use the course-set fixed effects to estimate the effect of matching with a same race teacher
in high school in a linear dosage model. I estimate the following regression:
(18)Yi = β1BlackMatchi + β2HispMatchi + β3AsianMatchi + β4WhiteMatchi+ γ1Xi + κs + εis
In this regression, Yi is an indicator for if student i graduated from high school within
four years of 9th grade or enrolled within five years of 9th grade. Xi is a vector of student
level characteristics, and κs is the course-set fixed effect, grouping students in the same high
school who took identical courses. Each of the match coefficients are identified from students
of the same-race having different teacher compositions conditional on their selected courses.
The reference group for these match terms is in relation to a non-match, allowing for an easy
to interpret coefficient. The match variables are in counts for the linear dosage model, so
β1, β2, β3, and β4 represent one additional race match in the 9th grade for Black, Hispanic,
Asian, and White students, respectively. I do not include a high school fixed effect as it is
implicitly nested within the course-set fixed effect. I include an additional specification with
cohort-course-set fixed effects, limiting the comparison to students with identical course sets
in the same 9th grade cohort.
The dosage model allows one to test marginal impact of same-race teachers. Whether or
not there are increasing, constant, or diminishing marginal returns is of first order importance
as it allows for researchers to develop concrete policy recommendations. For example, if there
are increasing marginal returns to having same-race teachers, it could suggest evidence in
favor of having as many same-race teachers as possible.
Another benefit to determining the marginal effects is that it gives testable implications
for the mechanisms behind positive race match effects. Gershenson et al. (2018) develop a
dosage model with testable implications for how race matching can impact students. One
theory of race matching suggest that same-race teachers are more effective at communi-
cating with students and expanding their worldview through culturally relevant pedagogy
26

and cultural synchronization (Irvine (1990); Ladson-Billings (1995)). Another theory of race
matching suggests that there is a role-model effect where teachers serve as role models to
students, which could impact students by updating their inaccurate beliefs about returns to
human capital. Minority students may have an inaccurate belief about being able to attend
college despite having sufficient ability to do so and having a same-race teacher could update
that belief.
The model developed by Gershenson et al. (2018) gives implications on how the marginal
same-race teacher will impact educational outcomes with constant marginal returns to same-
race teachers suggesting an increased effectiveness mechanism and diminishing marginal
returns suggesting a role model effect. The intuition behind this implication is that increased
effectiveness would be present no matter how many previous same-race teachers one had. On
the other hand, role model effects work through changing a student’s beliefs about themselves
or the returns to education and that the 6th same-race teacher that a student had would
presumably update their belief less than the 1st same-race teacher.
To test the non-linear effects of race-matching, I estimate a flexible dosage model, allowing
for varying marginal effects. I create indicators for the number of same race teachers that
a student could have. For Black, Hispanic, and White students the number of same-race
teachers varies from zero to six, and for Asian students, it varies from zero to three. The
reduction in potential matches for Asian students is lower simply because there are so few
Asian students and teachers that there are no Asian students in the sample with more than
three Asian teachers. Specifically, I estimate the below equation:
(19)
Yi =k=6∑k=1
θk1(BlackMatchi=k) +k=6∑k=1
λk1(HispMatchi=k)
+k=3∑k=1
νk1(AsianMatchi=k) +k=6∑k=1
ηk1(WhiteMatchi=k)
+ β1Xi + κs + εis
The notation is the same as the previous regressions. However, the interpretation on
27

coefficients on the match terms changed. The omitted category for these match terms is
students with no race matches, so the interpretation on θ2 is the effect of 2 race matches for
a Black student relative to a Black student with 0 race matches.
7 Long-term Results
7.1 Individual Results
I present the linear results in Table 5 which shows the specifications with the course-set
fixed effects and the cohort course-set fixed effects. The results for the course-set fixed
effects and cohort course-set fixed effects are nearly identical. I present the coefficient for
each race-match next to the race-specific mean for context to the size of the effect.
Black students become significantly more likely to enroll in college, driven by four-year
college enrollment, after race matching in the 9th grade. One additional Black teacher for
a Black student increases the likelihood of enrolling in a four-year college by 1 percentage
point. Hispanic students benefit across all outcomes when race matching. Hispanic students
matched with one additional Hispanic teacher increase their likelihood to graduate from high
school by 0.7 p.p., likelihood to enroll in any college by 1.5 p.p., likelihood to enroll in a
two-year college by 0.7 p.p., and likelihood to enroll in a four-year college by 0.9 p.p.
However, underrepresented minority students are not the only group to benefit from race
matching in this linear model. Asian students become 1.8 p.p. more likely to graduate
from high school following an additional race match in 9th grade. Although, the confidence
interval is so much wider on the estimate for an Asian match than the other races. Finally,
White students become 0.7 p.p. more likely to enroll in college, and 0.4 p.p. to enroll in a
two-year college after one additional race match in 9th grade. However, I will show in the
Robustness Check section that the results for White students in the linear dosage model are
not robust to Oster (2019) and her bounding methodology. The results for White students
are the only long-term results that are not robust, suggesting that White students may not
28

benefit from race-matching.
One potential downside to this linear model is that it imposes an assumption of constant
marginal effects for the effect of race matching. This is particularly troublesome as the
racial distribution of teachers is so skewed toward White teachers. This skewed distribution
is evident in the summary statistics with White students having 3.7 race matches on average,
compared to the 0.9 race matches Black students have on average. Given how skewed these
distributions are, it is plausible that the effect varies accordingly with the amount of matches
a student receives, which could also vary by race.
The functional form of the effect over a different amount of race matches is also of first
order importance for determining policy implications. Another benefit to determining the
functional form is that it would allow one to test different mechanisms of how race-matching
impacts educational outcomes using the model developed by (Gershenson et al., 2018). In
their model, constant marginal returns suggest that students improve with same-race teach-
ers because teachers are more effective at teaching same-race students, while diminishing
marginal returns would suggest that role model effects are present.
To test how marginal effectiveness of same-race teachers varies, I do not impose any
functional form on the effect of additional race-matches, allowing the marginal effect of race-
matching to vary. I run regression (19) specified in the previous section creating indicators
for each amount of race match for each race. I present the coefficients for the effect of
race matching on high school graduation and college enrollment in Table 6, and I plot the
coefficients in Figure 6. I present the coefficients for the effect of race matching on two- vs
four-year enrollment Table 7 and in Figure 7. To show the context of the distribution of race
matches by race, I plot a histogram overlaid on Figure 6 and Figure 7 to show the support
for each coefficient estimated.
In Figure 6 and Figure 7, the confidence intervals can be fairly large since the sample used
to estimate each coefficient is smaller than in the linear or quadratic models, and many of the
estimates are statistically indistinguishable from each other. However, looking at the point
29

estimates can still be instructive in terms of the estimated effect. For all of the enrollment
outcomes, there does appear to be diminishing marginal returns when examining the point
estimates. For Black students enrolling in any college or a four-year college, there is a linear
increase in the effectiveness until about the third race match when there is a plateauing of
an effect. For Hispanic students enrolling in any college or a two-year college, there is a
diminishing increase with a small negative marginal effect from the sixth match. Four-year
enrollment for Hispanic students looks to be monotonically increasing with Hispanic matches
but still with diminishing marginal effects. The effect on high school graduation for Black
and Hispanic students is seemingly different from the enrollment outcomes. For both of
Black and Hispanic students, the effect of race matches on high school graduation appears
to small or zero until getting five or six race matches, at which point the point estimates
shoot up.
For Asian students, it can be difficult to assess the shape of the curve as the sample
size gets increasing small when breaking the groups up further. Finally, for White students,
there are clear diminishing marginal returns with no coefficient on the match terms being
significantly different from zero for all outcomes. The non-linear results for White students
seem to contradict the linear results where there were significant effects for White students in
any college enrollment and two-year college enrollment. One potential way of reconciling this
is by examining the distribution of matches for White students. About 75% of race matches
for White students are between one and four where there is a clear positive relationship for
these outcomes and race matches. However, for the fifth and 6th matches, the marginal effect
becomes negative. This non-linear relationship between race matches and marginal effects
underlies the importance of allowing the model to be flexible without imposing linearity.
In particular, the diminishing marginal returns in race matches and Gershenson et al.
(2018) suggest that role model effects are present and are potentially acting as a mechanism
for same-race teachers increasing student achievement. These results give a policy recom-
mendation of increased hiring of Black and Hispanic teachers to help Black and Hispanic
30

students while minimally impacting White students.
7.2 Heterogeneity
Next, I explore if race matching in a subject in high school makes a student more likely to
major in the subject in college. The distribution of college degrees is not equitable with
Black and Hispanic students systematically less likely to major in STEM than their White
and Asian counterparts. STEM degrees earn a larger wage premium, so this inequality in
STEM degrees further exacerbates wage disparities (Altonji, Blom and Meghir, 2012). I also
examine two other majors Social Sciences and English/Writing. I define a STEM degree as a
degree with a six-digit Classification of Instructional Programs (CIP) code matching the list
of STEM majors designated by the Department of Homeland Security13. For English/Writing
and Social Sciences, I use two-digit CIP codes to define the major choice14.
I examine how race matching within certain subjects affects a student’s likelihood of
majoring in STEM in college as a freshman, conditional on their 9th grade course-set. One
may expect there to be an effect for Black and Hispanic students for race matching in STEM
courses because of the role model effect, which may be more salient for certain demographics
in areas that they are underrepresented like Black and Hispanic students in STEM. I present
the results from matching in a given subject in Table 8.
Black and Hispanic students increase their likelihood of majoring STEM by 0.7 and
0.6 p.p., respectively, with one additional 9th grade same-race STEM teacher. One addi-
tional White English teacher increases the likelihood of a White student majoring in En-
glish/Writing by 0.3 p.p.. Finally, an additional same-race Social Science teacher for a
Hispanic student increases their likelihood of majoring in Social Sciences by 0.3 p.p.. These
heterogeneity results suggest an increased need to hire Black and Hispanic STEM teachers
in high school.
13https://www.ice.gov/sites/default/files/documents/Document/2016/stem-list.pdf14For English/Writing courses, I focus on CIP codes involving written or oral communication. Specifically,
I use codes 09 and 23. For Social Sciences, I use codes 42, 45, and 59.
31

Another potential source of heterogeneity is student ability. I examined heterogeneity
using 8th grade reading test quartiles at the course-level to tease out the differences in
effects for students with different underlying ability. I conduct a similar analysis, splitting
the sample into four quartiles of 8th grade reading test scores. I present the analysis in Table
9.
In Panel A, I show the heterogeneity analysis for high school graduation and college
enrollment in any college, and in Panel B, I present the results for college enrollment sepa-
rately for two- and four-year colleges. For Black students, there is a significant increase in
the likelihood to graduate high school with an additional race match when they are in the
top half of the 8th grade reading test score distribution. For college enrollment, the effect is
spread out evenly across the distribution with the top three quartiles becoming more likely
to enroll in a four-year college and the bottom quartile becoming more likely to enroll in a
two-year college.
For Hispanic students, the same general pattern can be seen with the top section of the
distribution becoming more likely to graduate high school and enroll in a four-year college
from an additional race match and the bottom two quartiles becoming more likely to enroll
in a two-year college. Finally, the race math effect is positively correlated with 8th grade
reading test scores for college enrollment for Hispanic students. White students also have a
positive correlation in race match effect with the test score distribution for college enrollment.
Asian students see a different pattern for their outcomes. The significant and positive
effects come from the bottom of the test score distribution. Asian students in the bottom
quartile of 8th grade reading scores become much more likely to graduate from high school or
enroll in a two-year college with an additional Asian teacher, but none of the other students
are significantly affected. For college enrollment, there is actually a negative effect for a race
match for an Asian student at the top quartile of the distribution, driven by a decrease in two-
year enrollment. This significant decrease in two-year enrollment is potentially concerning
because it is not offset by an increase in four-year college enrollment.
32

Overall, this heterogeneity analysis sheds further light on the potential mechanism behind
role model effects. Given the results of the non-linear dosage model and Gershenson et al.
(2018) model, role model effects are present due to the diminishing marginal returns of race
matching. One potential way the role model effect could work is through updating students’
beliefs about returns to education or their belief in their own abilities. Students may not
have attended college despite having sufficient ability to do so because of an incorrect belief
about their own ability. Given the race match effects for Black and Hispanic students is
concentrated at the top half of the distribution, it gives further credence and evidence to a
role model effect dominating.
7.3 Thought Experiment and Simulation
Finally, I take my estimates from the previous section and do a back of the envelope cal-
culation based on the following thought experiment. Suppose that the racial distribution
of teachers at each school matched the racial distribution of students. For example, if a
school has 10% Black students, 50% Hispanic students, 35% White students, and 5% Asian
students, then suppose that the campus also had 10% Black teachers, 50% Hispanic teachers,
35% White teachers, and 5% Asian teachers.
To achieve this, I randomly assign races to teachers with weights such that each school
should achieve a representative teaching population. This change would be an extremely
large and politically infeasible policy, and that many assumptions underlie this analysis. In
particular, the estimates for race-matching would likely change, and students would likely
endogenously move schools as a function of this policy as well. While the simulation may not
be implementable in real life, it can still be instructive to think about how a representative
teaching population could affect students and educational outcomes.
In Figure 8, I show how the racial distribution for students at a the high school level
compares to that of the racial distribution for teachers with a dashed line showing what a
representative school would look like. If a high school is above the line, then their students
33

are underrepresented by the teaching population. Black students and Hispanic students are
underrepresented at 70% and 96% of high schools, respectively. However, White students are
over represented by the teaching population at 97% of high schools. This thought experiment
would in effect reduce the number of White teachers at 97% of schools and increase them
in the other 3% of schools. Black students will see more Black teachers at 70% of schools
and fewer in the other 30% of schools, which could hurt some of the Black students at those
schools.
I run 5,000 Monte Carlo simulations randomizing teacher races such that teachers are
representative at the school level. On average, these simulations result in having 1,601 more
Black teachers, 10,705 more Hispanic teachers, 673 more Asian teachers, and 12,979 fewer
White teachers. I recover how many race matches each race had in the average simulation and
multiply the change from the simulation by my point estimates shown in Table 5.I present
the change in the average number of race matches in Figure 9, which shows that in the
average simulation that Black, Hispanic, and Asian students have more race matches while
White students have fewer. For example, in the observed data Hispanic students have 1.36
race matches on average, and in the simulation, they have 2.88 race matches on average.
I take the difference between them and multiply by the point estimates in my results to
recover a back of the envelope calculation. I calculate how many additional students would
graduate high school and enroll in college for each race group and how the race-specific rates
change. I present those results in Table 10.
There are large gains for Hispanic students in this back of the envelope calculation. In
Panel A, I present how many additional or fewer students achieve each educational outcome
and in Panel B, I present how those changes would move each race-specific rate. For instance,
I find that the average simulation would increase Hispanic college attendance by about 5,600
students shown in Panel A, and this change represents a 2.3 p.p. (5.6%) increase in the rate
of college enrollment for Hispanic students. There are smaller changes for Black and Asian
students for two reasons. The first is that there the effects of race matching are smaller
34

for these groups and the change in the number of teachers is relatively small compared
to Hispanic students. The effects for White students are also much smaller than Hispanic
students, but they are negative. The average simulation would suggest that about 1,500
fewer White students would enroll in college, driven mostly by reduced attendance in two-
year institutions. This change represents a 0.9 p.p. (1.7%) reduction in college attendance.
The average number of race matches changes, but the distribution of race matches also
changes dramatically, which I show in Figures 6 and 7 matters for understanding the effect
of race matches. I present the simulations and back of the envelope calculations using the
estimates from the non-linear results. I show how the distribution of race matches changes
with the simulation in Figure 10. Minority students have their distribution of matches shifted
toward the right with the opposite being true for White students. I plot the effects for the
non-linear effects with how the distribution of race matches changes in Figures 11 and 12.
I multiply the change in the distribution by the coefficient for the effect of each race match
to get at the aggregate change. For example, there are more Hispanic students receiving
4 race matches, so I multiply the increase in number of Hispanic students receiving four
race matches by the effect of having four race-matches. I present the back of the envelope
calculations in Table 11. The results are largely the same as the back of the envelope
calculations in Table 10 from the linear results, but they are slightly smaller, consistent with
diminishing marginal returns from race matching.
In aggregate, these results show large, positive changes in high school graduation and
college enrollment driven mostly by Hispanic students. In total, I find that a representative
teaching population would increase high school graduation for about 2,500 students and col-
lege enrollment for about 4,000 students. This change would represent a 0.5 p.p. increase
in the high school graduation rate and a 0.8 p.p. increase in the college enrollment rate.
Overall, these results suggest that a policy to make the teaching population more represen-
tative would be a net-positive intervention, improving minority student outcomes more than
it would hurt White student outcomes.
35

8 Robustness Checks
8.1 Oster (2019) Bounding
My estimation and identification strategy use institutional knowledge paired with fixed effects
to minimize endogenous sorting of students and teachers. However, I am unable to entirely
eliminate non-random sorting. There is a non-trivial concern that I am failing to account
for some unobservable characteristics that students are sorting along that could result in an
omitted variable bias that is biasing my estimate of the true effect of race matching in high
school. One potential way to address this concern is to implement the bounding methodology
described in Oster (2019), which will allow me to determine how serious this selection could
be.
Oster (2019) demonstrates that one is able to evaluate a finding’s robustness to omitted
variable bias by examining the coefficient and R-squared stability and proves that a consistent
bias-adjusted treatment estimation is possible under two assumptions. The first assumption
one makes is the relative selection of unobservable and observable characteristics, denoted by
δ. Given one cannot examine unobservable selection, one must make an assumption about
how much selection occurs on unobservable characteristics. The second assumption is the
maximum value of R-squared. She argues for the first assumption that it is reasonable to
assume that there is equal selection of observable and unobservable characteristics, i.e. δ = 1.
For the maximum value of R-squared, she suggests R2max = min{ΠR2, 1} is reasonable, with
Π being a scalar. She shows that randomized results indicate that Π = 1.3 is appropriate
(Oster, 2019). These two assumptions give a bounding set that for a given treatment effect
defined as ∆ = [β̃, β∗(R2max, δ = 1)], such that β̃ gives the effect with full controls and β∗
gives the bias-adjusted treatment effect.
Ultimately, my fixed effect strategy is leveraging variation at the course level and using
fixed effects is akin to selection on observables, making the use of Oster Bounds appropriate.
To evaluate how robust the findings are when selecting on student covariates and the high
36

school by year by course or course set fixed effects, I calculate the bounding set ∆ for each
significant finding. Oster (2019) gives two potential ways of evaluating robustness: 1. if 0 is
excluded from bounding set ∆, and 2. if β∗ is within the 99.5% confidence interval of β̃. I
present the bounding sets for each significant result and whether they are robust to either
measurement in Table 12 and Table 13.
Out of the 13 significant results examined in the Oster (2019) Bounding analysis, 12 of
the results are robust to the bounding set excluding zero, suggesting that the vast majority of
the significant results are still different from zero when adjusting for selection on observable
and unobservable characteristics. Out of the 13 results, 9 are also robust to being within the
99.5% confidence interval of the original estimate, suggesting that they are sufficiently close
to the original estimate. I present the bounding estimates graphically showing the original
estimate and the bias-adjusted estimate and how they compare to the two robustness criteria.
I present the short-term course-level results on test scores and pass rates in Figure 13, and
the long-term results on high school graduation and college enrollment in Figure 14.
It is important to account for the potential omitted variable bias of some unobservable
variable driving my results. Given that I cannot fully eliminate sorting along race or other
observable characteristics using my fixed effects strategy, it is likely there is also selection
on unobservable characteristics. The bounding sets allow me to quantify how important
the selection of characteristics is given certain assumptions like equal selection of observable
and unobservable characteristics. The table and figures show that my results are largely
the same when trying to account for unobservable selection using Oster (2019) with some
exception. In particular, the results for test scores and the long-term results for White
students are not robust. This lack of robustness for the signficiant linear effects for White
students gives further credence to the non-linear results for White students suggesting there
is no no significant benefit to White students matching with White teachers.
37

8.2 Expanding Course-Set to 10th grade
In the main analysis, I use the 9th grade courses that students take to create a course-set
to compare students that took identical courses. I focus on 9th grade courses because race
matches in 10th, 11th, and 12th grade could be endogenous to the matches in 9th grade
if they are a function of the race matches in 9th grade. However, it is possible to still
examine the matches in later matches as well. I create 10th grade course-sets to examine if
the effect of race matching could vary with a student’s age or grade level. I can extend this
analysis to 11th and 12th grade as well, but as the grade level becomes higher, the sample
size becomes smaller as some students drop out and course offerings become larger, leading
to more students without another student with an identical course-set and therefore lacking
a comparison.
In Table 14, I present the results using the 10th grade course-set fixed effects in the first
panel and the results using a 9th and 10th grade course-set fixed effect in the second panel.
The first set of results compares students with identical 10th grade course selections but
have different race matches. The second set of results compares students with identical 9th
and 10th grade course selections but have different race matches.
The results from using the 10th grade course sets fixed effects are extremely similar to
the results using the 9th grade course sets. Black and Hispanic students have significantly
better long-term outcomes from race-matches in the 10th grade. The magnitude of the
results is slightly higher than the effect of 9th grade race-matches, but they are statistically
indistinguishable from each other. Asian students appear to not benefit from 10th grade race-
matches, while significantly becoming more likely to graduate high school from 9th grade
race-matches. Finally, White students become more likely to enroll in college following 10th
grade race matches in a slightly smaller magnitude compared to 9th grade race matches.
38
9 Discussion
One noticeable difference between the short-term course-level outcomes and the longer-term
individual-level outcomes is the difference in who is affected. Black students benefit from
matching in both long- and short-term outcomes, but this is not true for all of the students.
Asian students benefit in the short-term from a race match but are not as affected in the
long-term, which is the reverse for Hispanic students receiving a race match, who benefit in
the long-term from a race match but do not benefit in the short-term.
There exists a disconnect between the short-term course results and long-term individual
results. Black and Asian students benefit modestly in the short-term by having slightly
higher test scores and pass rates. However, Black students see much larger gains in the
long-term from race matches with large increases in their likelihood to enroll in college that
seem disproportionately large to their short-term benefits. Black students become 0.9 p.p.
more likely to pass their classes with Black teachers and 1 percentage point more likely to
enroll in a four-year college after one additional 9th grade Black teacher. These outcomes
are different educational achievement measures and are not directly comparable, but it still
seems unlikely that improving the pass rate by a small amount would result in a large effect
size for college enrollment. It could mean that same-race teachers also increase non-cognitive
measures of students that impact expectations and beliefs that are not directly picked up in
measurement like test scores or pass rates. This implication is consistent with past research
into expectations, behavior, and beliefs15.
This disconnect between long- and short-term effects seems counterintuitive as one may
expect a student to benefit the most the closer they are to the treatment than further away.
However, this finding is consistent with the only other paper in the literature examining long
term effects of race matching. Gershenson et al. (2018) find a 4 percentage point increase
in college enrollment with an additional Black K-3 teacher for Black students, while I find
a 1 percentage point increase from an additional 9th grade Black teacher. My results taken
15(Fox (2015); Papageorge, Gershenson and Kang (2018))
39

with Gershenson et al. (2018) suggest that the effect of race matching may be stronger in
the long-term. This difference between short-term and long-term effects suggest different
mechanisms affecting short- and long-term outcomes.
One potential reason for the differences in results is that in the short-term outcomes, the
relative frequency of teachers is important for having an effect. Black and Asian students are
the smallest minority groups with Hispanic and White students comprising the two largest
ethnic groups in Texas. There are also many more Hispanic and White teachers than there
are Asian and Black teachers. However, there are no significant effects for Asian students in
the long-term outcomes for college enrollment. The long-term linear effects of race matching
for college enrollment had effects for each race except that with the highest achievement -
Asian students.
It may be that in the short-term there are strong effects from “culturally relevant peda-
gogies” such as having different interactions that are culturally relevant to Black and Asian
students that only same-race teachers would understand. There has been research into how
culturally relevant pedagogies affect Black students (Irvine (1990); Ladson-Billings (1995)).
Another potential effect from race matching is a role model effect wherein role models may
get students to update their beliefs about human capital accumulation (Marx and Roman
(2002); Dee (2005)). Research shows that having a same-race teacher can raise a student’s
expectations on achieving higher education (Fox (2015); Papageorge, Gershenson and Kang
(2018)). Importantly, these theories about how race matching could improve students out-
comes are not mutually exclusive but likely work in conjunction with one another, with a
culturally relevant pedagogy feeding into role model effects and vice-versa.
Overall, the results are consistent with a story of culturally relevant pedagogies more
strongly affecting short-term outcomes and role model effects impacting longer-term out-
comes. The culturally relevant pedagogies would likely be strongest with students that have
the least representation for teachers as is the case for Black and Asian students, while the
role model effects would impact the lower achieving groups more such as Black, Hispanic,
40

and White students. Specifically, the impact of race matching for long-term outcomes like
college enrollment are largest for Black and Hispanic students who would have the biggest
impact on their educational expectations. My results further validate this hypothesis when
looking at the non-linear effects of dosage for race matching in long-term outcomes. Fol-
lowing the model developed in Gershenson et al. (2018), diminishing marginal returns of
same-race teachers would imply that role-model effects dominate over increased effectiveness
of same-race instruction.
Racial gaps in educational attainment have been documented in many different settings,
and Texas is no exception. Black and Hispanic students lag behind their White peers who also
lag behind their Asian peers in educational outcomes. Race-matching appears to significantly
decrease the race gap between underrepresented minorities and White students. For instance,
an additional Black teacher match reduces the Black-White college enrollment gap by 11%,
and an additional Hispanic teacher match reduces the Hispanic-White high school graduation
and college enrollment gap by 14% and 11%, respectively.
Race-matching for White students on the other hand appears to have no robust effect
on White student outcomes. While there is a positive effect for White students in the linear
dosage model, I show in the Robustness Check section that those results are not robust to
Oster (2019) and her bounding methodology. Specifically, the outcomes for White students
are the only results that are not robust to the bounding strategy. When relaxing the linearity
assumption and allowing the effect to be more flexible, White students no longer benefit
from race-matching. Overall, the evidence in this paper suggests that White students do
not benefit significantly from race-matching and that one could replace White teachers with
more Black and Hispanic teachers to the benefit of Black and Hispanic students without
making White students any worse off.
The effect sizes of the race matches for Black and Hispanic students seem fairly large.
The results indicate that one additional Black match increases college enrollment for Black
students by 1 percentage point, and one additional Hispanic match increases college enroll-
41

ment for Hispanic students by 1.5 p.p.. It’s difficult to compare these results to the literature
as there is only one other paper that directly observes long-term outcomes from matches.
Gershenson et al. (2018) uses the Tennessee STAR randomized teacher-student assignment
in elementary school to examine race matches of Black students and teachers. The ran-
domization element should create unbiased estimates of these long-term effects of matches,
providing an excellent comparison. They find that Black students randomly assigned to one
Black teacher in grades K-3 are 4 p.p. more likely to enroll in college, an effect size about
four times my effect size. It’s not an exact comparison though as Gershenson et al. (2018)
look at elementary school matching, and I examine high school race matching. This distinct
difference in timing of the race-matches informs the broader education literature as well.
Heckman argues that treatment effects can have larger impacts when children are younger
as these skills can build on top of each other (Heckman 1999). One may be concerned that
in high school it is too late to change the trajectory of a student’s educational career from
additional same-race teachers. I confirm Heckman’s hypothesis in this setting showing the
effect sizes are smaller but are still significant in high school. Using Gershenson et al. (2018)
and their randomization as a reference point for an earlier intervention suggest that I find a
plausible effect size.
10 Conclusion
I present evidence showing that race matching in high school can significantly impact racial
gaps that exist in high school and college achievement. I control for non-random sorting
better than past studies by exploiting institutional details and using course-level fixed effects.
I reduce non-random sorting of students to same-race teachers by about 99% for Black,
Hispanic, and White students. Only one Gershenson et al. (2018) has examined the effects
of race matching on high school graduation and college enrollment but does not examine
Hispanic or Asian students, which my paper sheds new light on. I present the first evidence
42

of high school student-teacher race matching effects. Race matching for Black and Hispanic
students significantly decreases race gaps. An additional same-race 9th grade teacher for
Black and Hispanic students increases their likelihood to enroll in college by 1 and 1.5 p.p.,
respectively. In my heterogeneity analysis, I also show that Black and Hispanic students
become significantly more likely to major in a STEM field as freshmen in college after
having a Black or Hispanic STEM teacher.
While I find significant effects for White students in the linear dosage model, these results
are not robust to the bounding methodology outlined in Oster (2019). Furthermore, the non-
linear dosage model shows that White students do not benefit from race-matching across all
outcomes. These results taken with the results for Black and Hispanic students suggest that
hiring more Black and Hispanic teachers could greatly improve academic achievement for
Black and Hispanic students while having minimal negative tradeoffs for White students. A
policy aimed at decreasing racial gaps in education should target training and hiring Black
and Hispanic teachers with a focus on STEM teachers.
References
Altonji, Joseph G, Erica Blom, and Costas Meghir. 2012. “Heterogeneity in humancapital investments: High school curriculum, college major, and careers.” Annu. Rev.Econ., 4(1): 185–223.
Au, K, and C Jordan. 1981. “Teaching reading to Hawaiian children: Analysis of aculturally appropriate instructional event.” Anthropology and Education Quarterly, 11: 91–115.
Bailey, Martha J, and Susan M Dynarski. 2011. “Gains and gaps: Changing inequalityin US college entry and completion.” National Bureau of Economic Research.
Bettinger, Eric, and Bridget Terry Long. 2004. “Do college instructors matter? Theeffects of adjuncts and graduate assistants on students’ interests and success.” NationalBureau of Economic Research.
Bottia, Martha Cecilia, Elizabeth Stearns, Roslyn Arlin Mickelson, andStephanie Moller. 2018. “Boosting the numbers of STEM majors? The role of highschools with a STEM program.” Science Education, 102(1): 85–107.
Bottia, Martha Cecilia, Elizabeth Stearns, Roslyn Arlin Mickelson, StephanieMoller, and Lauren Valentino. 2015. “Growing the roots of STEM majors: Femalemath and science high school faculty and the participation of students in STEM.” Eco-nomics of Education Review, 45: 14–27.
43

Canes, Brandice J, and Harvey S Rosen. 1995. “Following in her footsteps? Facultygender composition and women’s choices of college majors.” ILR Review, 48(3): 486–504.
Carrell, Scott E, Marianne E Page, and James E West. 2010. “Sex and science:How professor gender perpetuates the gender gap.” The Quarterly Journal of Economics,125(3): 1101–1144.
Cho, Insook. 2012. “The effect of teacher–student gender matching: Evidence from OECDcountries.” Economics of Education Review, 31(3): 54–67.
Clotfelter, Charles T, Helen F Ladd, and Jacob L Vigdor. 2006. “Teacher-studentmatching and the assessment of teacher effectiveness.” Journal of human Resources,41(4): 778–820.
Cunha, Flavio, and James Heckman. 2007. “The technology of skill formation.” Amer-ican Economic Review, 97(2): 31–47.
Dale, Stacy Berg, and Alan B Krueger. 2002. “Estimating the payoff to attending amore selective college: An application of selection on observables and unobservables.” TheQuarterly Journal of Economics, 117(4): 1491–1527.
Dee, Thomas S. 2004. “Teachers, race, and student achievement in a randomized experi-ment.” Review of Economics and Statistics, 86(1): 195–210.
Dee, Thomas S. 2005. “A teacher like me: Does race, ethnicity, or gender matter?” Amer-ican Economic Review, 95(2): 158–165.
Dee, Thomas S. 2006. “The why chromosome: How a teacher’s gender affects boys andgirls.” Education Next, 6(4): 68–76.
Dee, Thomas S. 2007. “Teachers and the gender gaps in student achievement.” Journal ofHuman resources, 42(3): 528–554.
Egalite, Anna J, Brian Kisida, and Marcus A Winters. 2015. “Representation inthe classroom: The effect of own-race teachers on student achievement.” Economics ofEducation Review, 45: 44–52.
Fairlie, Robert W, Florian Hoffmann, and Philip Oreopoulos. 2014. “A communitycollege instructor like me: Race and ethnicity interactions in the classroom.” AmericanEconomic Review, 104(8): 2567–91.
Federman, Maya. 2007. “State graduation requirements, high school course taking, andchoosing a technical college major.” The BE Journal of Economic Analysis & Policy, 7(1).
Ferguson, Ronald F. 2003. “Teachers’ perceptions and expectations and the Black-Whitetest score gap.” Urban education, 38(4): 460–507.
Fischer, Stefanie. 2017. “The downside of good peers: How classroom composition differ-entially affects men’s and women’s STEM persistence.” Labour Economics, 46: 211–226.
Fox, Lindsay. 2015. “Seeing potential: The effects of student–teacher demo-graphic congruence on teacher expectations and recommendations.” AERA open,2(1): 2332858415623758.
Fryer Jr, Roland G, and Steven D Levitt. 2004. “Understanding the black-white testscore gap in the first two years of school.” Review of Economics and Statistics, 86(2): 447–464.
Gershenson, Seth, Cassandra Hart, Joshua Hyman, Constance Lindsay, andNicholas W Papageorge. 2018. “The long-run impacts of same-race teachers.” NationalBureau of Economic Research.
Heckman, James J. 2000. “Policies to foster human capital.” Research in economics,
44

54(1): 3–56.Holt, Stephen B, and Seth Gershenson. 2017. “The impact of demographic represen-
tation on absences and suspensions.” Policy Studies Journal.Irvine, Jacqueline Jordan. 1990. Black students and school failure. Policies, practices,
and prescriptions. ERIC.Koedel, Cory, and Julian R Betts. 2011. “Does student sorting invalidate value-added
models of teacher effectiveness? An extended analysis of the Rothstein critique.” EducationFinance and policy, 6(1): 18–42.
Ladson-Billings, Gloria. 1995. “Toward a theory of culturally relevant pedagogy.” Amer-ican educational research journal, 32(3): 465–491.
Lusher, Lester, Doug Campbell, and Scott Carrell. 2018. “TAs like me: Racial in-teractions between graduate teaching assistants and undergraduates.” Journal of PublicEconomics, 159: 203–224.
Maltese, Adam V, and Robert H Tai. 2011. “Pipeline persistence: Examining theassociation of educational experiences with earned degrees in STEM among US students.”Science education, 95(5): 877–907.
Marx, David M, and Jasmin S Roman. 2002. “Female role models: Protecting women’smath test performance.” Personality and Social Psychology Bulletin, 28(9): 1183–1193.
Mohatt, Gerald, Frederick Erickson, et al. 1981. “Cultural differences in teaching stylesin an Odawa school: A sociolinguistic approach.” Culture and the bilingual classroom:Studies in classroom ethnography, 105.
Morgan, Stephen L, Dafna Gelbgiser, and Kim A Weeden. 2013. “Feeding thepipeline: Gender, occupational plans, and college major selection.” Social Science Re-search, 42(4): 989–1005.
Nixon, Lucia A, and Michael D Robinson. 1999. “The educational attainment of youngwomen: Role model effects of female high school faculty.” Demography, 36(2): 185–194.
Ost, Ben. 2010. “The role of peers and grades in determining major persistence in thesciences.” Economics of Education Review, 29(6): 923–934.
Oster, Emily. 2019. “Unobservable selection and coefficient stability: Theory and evi-dence.” Journal of Business & Economic Statistics, 37(2): 187–204.
Papageorge, Nicholas W, Seth Gershenson, and Kyung Min Kang. 2018. “Teacherexpectations matter.” National Bureau of Economic Research.
Paufler, Noelle A, and Audrey Amrein-Beardsley. 2014. “The random assignment ofstudents into elementary classrooms: Implications for value-added analyses and interpre-tations.” American Educational Research Journal, 51(2): 328–362.
Price, Joshua. 2010. “The effect of instructor race and gender on student persistence inSTEM fields.” Economics of Education Review, 29(6): 901–910.
Rask, Kevin. 2010. “Attrition in STEM fields at a liberal arts college: The importance ofgrades and pre-collegiate preferences.” Economics of Education Review, 29(6): 892–900.
Reardon, Sean F, Rachel A Valentino, Demetra Kalogrides, Kenneth A Shores,and Erica H Greenberg. 2013. “Patterns and trends in racial academic achievementgaps among states, 1999-2011.” Unpublished Working Paper. Center for Education PolicyAnalysis, Stanford University.
Rivkin, Steven G, Eric A Hanushek, and John F Kain. 2005. “Teachers, schools, andacademic achievement.” Econometrica, 73(2): 417–458.
45

Rothstein, Jesse. 2009. “Student sorting and bias in value-added estimation: Selection onobservables and unobservables.” Education finance and policy, 4(4): 537–571.
Sansone, Dario. 2017. “Why does teacher gender matter?” Economics of Education Re-view, 61: 9–18.
Sass, Tim R. 2015. “Understanding the STEM pipeline.” Calder American Institutes forResearch, Georgia State University.
Walker, Vanessa Siddle. 2001. “African American teaching in the South: 1940–1960.”American Educational Research Journal, 38(4): 751–779.
Winters, Marcus A, Robert C Haight, Thomas T Swaim, and Katarzyna APickering. 2013. “The effect of same-gender teacher assignment on student achievement inthe elementary and secondary grades: Evidence from panel data.” Economics of EducationReview, 34: 69–75.
46

Table 1: Descriptive Statistics
Panel A: Student Characteristics
Variable Black Mean Hispanic Mean Asian Mean White Mean
HS Grad 0.777 0.787 0.898 0.830Enroll Any 0.455 0.409 0.662 0.532Enroll two-year 0.277 0.280 0.353 0.318Enroll four-year 0.188 0.142 0.423 0.234STEM Major 0.073 0.083 0.260 0.114Test Z-Score -0.107 -0.049 0.834 0.401Pass Rate 0.872 0.858 0.970 0.939
Female 0.499 0.494 0.489 0.488At Risk 0.696 0.702 0.301 0.425Gifted 0.059 0.085 0.250 0.114Free/Reduced Price Lunch 0.738 0.800 0.368 0.425n 88,668 323,067 26,438 215,661
Panel B: Student and Teacher Composition
Variable Black Mean Hispanic Mean Asian Mean White Mean
Student Composition 0.137 0.498 0.041 0.332Teacher Composition 0.091 0.183 0.023 0.702
Descriptive statistics showing student achievement, characteristics, and composition forTexas high school students in 2012 and 2013 9th grade cohort. Panel A shows studentcharacteristics and outcomes at the student level. Panel B shows student and teacher racialcomposition at the state level. Data comes from the Texas Education Research Centerlinking Texas public high school data to Texas and national college data.
47

Table 2: Race-Matching Effects on Course-level Outcomes
(1) (2)VARIABLES Test Z-Score Pass
Estimate Mean Estimate Mean
Black Match 0.013*** -0.107 0.009*** 0.872(0.004) (0.001)
Hispanic Match 0.003 -0.049 0.001 0.858(0.004) (0.001)
Asian Match 0.070*** 0.834 0.014*** 0.970(0.021) (0.002)
White Match 0.001 0.401 -0.0003 0.939(0.004) (0.0007)
Observations 2,268,544 8,955,014R-squared 0.786 0.443
This table shows the effect of race matching at the course level on course-level outcomesusing student, teacher, and high school by year by course fixed effects. There are fewerobservations for the test scores as standardized tests are only administered in five courseswhile every course designates whether a student passes. “Test Z-Score” measure is in terms ofstandard deviations, and the Match terms are interpreted as changes in a standard deviation.Pass is an indicator for if a student passes the course, and the Match terms are interpreted asa percentage point change. Race specific means are next to the estimated effect for context.Standard errors are clustered at the school level.
48

Table 3: Heterogeneity Effects of Race-Matching by 8th Grade Reading Test Scores
(1) (2)VARIABLES Test Z-Score Pass
Black Match Hispanic Match Asian Match White Match Black Match Hispanic Match Asian Match White Match
8th Grade Reading Test ScoresTop Quartile 0.003 -0.004 0.052** 0.006 0.005** -0.001 0.015*** -0.001
(0.009) (0.007) (0.022) (0.006) (0.002) (0.001) (0.003) (0.001)2nd Quartile 0.012* -0.001 0.054* -0.004 0.008*** -0.0003 0.011*** 0.0001
(0.007) (0.005) (0.032) (0.006) (0.002) (0.001) (0.003) (0.001)3rd Quartile 0.014** 0.004 0.098*** 0.003 0.009*** 0.0016 0.015*** -0.001
(0.006) (0.005) (0.035) (0.006) (0.002) (0.001) (0.004) (0.001)Bottom Quartile 0.016** 0.010* 0.095* -0.0004 0.013*** 0.003** 0.017*** 0.001
(0.007) (0.006) (0.057) (0.006) (0.002) (0.001) (0.003) (0.002)
Observations 2,268,544 8,955,014R-squared 0.786 0.443
This table shows the effect of race matching at the course level on course-level outcomes using student, teacher, and highschool by year by course fixed effects. The regressions are broken into quartiles of 8th grade math test scores. There are fewerobservations for the test scores as standardized tests are only administered in five courses while every course designates whethera student passes. “Test Z-Score” measure is in terms of standard deviations, and the Match terms are interpreted as changes ina standard deviation. Pass is an indicator for if a student passes the course, and the Match terms are interpreted as a percentagepoint change. Standard errors are clustered at the school level.
49

Table 4: Descriptive Statistics: Dosage Model
Panel A: Student Characteristics
Variable Mean Black Hispanic Asian White
HS Grad 0.597 0.668 0.718 0.711Enroll Any 0.488 0.438 0.678 0.562Two-Year Enroll 0.291 0.298 0.357 0.33Four-Year Enroll 0.21 0.157 0.443 0.255STEM Major 0.081 0.091 0.27 0.122
Total Teachers 4.2 4.3 4.2 4.3Number of Race Matches 0.902 1.37 0.155 3.74Obs 66,826 246,450 22,302 175,912
Panel B: Student and Teacher Composition
Variable Mean Black Hispanic Asian White
Student Composition 0.125 0.460 0.042 0.329Teacher Composition 0.089 0.182 0.021 0.703
Descriptive statistics showing student achievement, characteristics, and composition forTexas high school students in 2012 and 2013 9th grade cohort in the dosage model. PanelA shows student characteristics and outcomes at the student level. Panel B shows studentand teacher racial composition at the state level. Data comes from the Texas EducationResearch Center linking Texas public high school data to Texas and national college data.
50

Table 5: Linear Dosage Effects of Race Matching of 9th Grade Teachers
Panel A: Course-Set Fixed Effects
(1) (2) (3) (4)VARIABLES HS Grad Enroll Any Enroll Two-Year Enroll Four-Year
Estimate Mean Estimate Mean Estimate Mean Estimate Mean
Black Match 0.003 0.597 0.010*** 0.488 0.003 0.291 0.010*** 0.210(0.003) (0.003) (0.002) (0.002)
Hispanic Match 0.007*** 0.668 0.015*** 0.438 0.007** 0.298 0.009*** 0.157(0.002) (0.003) (0.003) (0.002)
Asian Match 0.018** 0.718 -0.015 0.678 -0.002 0.357 -0.011 0.443(0.008) (0.015) (0.012) (0.010)
White Match 0.001 0.711 0.007*** 0.562 0.004** 0.330 0.002 0.255(0.002) (0.002) (0.002) (0.001)
Observations 514,501 514,501 514,501 514,501R-squared 0.36 0.232 0.122 0.257
Panel B: Cohort Course-Set Fixed Effects
(1) (2) (3) (4)VARIABLES HS Grad Enroll Any Enroll Two-Year Enroll Four-Year
Estimate Mean Estimate Mean Estimate Mean Estimate Mean
Black Match 0.003 0.597 0.010*** 0.488 0.003 0.291 0.009*** 0.210(0.003) (0.003) (0.003) (0.002)
Hispanic Match 0.007*** 0.668 0.016*** 0.438 0.008*** 0.298 0.010*** 0.157(0.002) (0.003) (0.003) (0.002)
Asian Match 0.017** 0.718 -0.012 0.678 -0.003 0.357 -0.01 0.443(0.008) (0.015) (0.011) (0.010)
White Match 0.002 0.711 0.007*** 0.562 0.003* 0.330 0.002 0.255(0.002) (0.002) (0.002) (0.002)
Observations 506,034 506,034 506,034 506,034R-squared 0.376 0.248 0.141 0.274
This table provides the results from the linear dosage model for 9th grade race matches con-ditional on course-set or cohort course-set fixed effects. The fixed effects make comparisonsbetween students that took identical courses in the same high school but have different raceteachers. The interpretation on the Match coefficient is the effect of one additional same-race teacher. Race specific means are next to the estimate for context. Panel A displays theeffect using course-set fixed effects while Panel B shows the cohort course-set fixed effects.Standard errors are clustered at the high school level.
51

Table 6: Non-linear Match Effects for HS Graduation and College Enrollment
(1) (2)VARIABLES HS Grad Enroll Any
Black Match Hispanic Match Asian Match White Match Black Match Hispanic Match Asian Match White Match
Match == 1 0.003 0.006* 0.019** -0.02 0.007 0.014*** -0.003 -0.027(0.005) (0.003) (0.009) (0.015) (0.006) (0.004) (0.012) (0.021)
Match == 2 -0.001 0.011** 0.023 0.008 0.024*** 0.034*** -0.076 -0.003(0.007) (0.006) (0.028) (0.015) (0.008) (0.008) (0.060) (0.020)
Match == 3 0.004 0.014* 0.075 0.015 0.036*** 0.046*** -0.190* 0.011(0.008) (0.009) (0.076) (0.015) (0.010) (0.011) (0.110) (0.019)
Match == 4 0.009 0.016 - 0.017 0.025* 0.056*** - 0.022(0.014) (0.010) - (0.015) (0.014) (0.015) - (0.019)
Match == 5 0.057** 0.023* - 0.005 0.047* 0.062*** - 0.015(0.029) (0.013) - (0.015) (0.028) (0.019) - (0.020)
Match == 6 0.087** 0.045** - -0.005 0.012 0.056** - -0.002(0.035) (0.018) - (0.018) (0.047) (0.024) - (0.023)
Observations 514,501 514,501R-squared 0.360 0.232
This table shows the results of the non-linear dosage model for 9th grade race matches conditional on course-set on high schoolgraduation and any college enrollment. I regress indicators for each number of race match on outcomes allowing the functionalform to be flexible to test for non-linearity. The omitted group for each race is the no matches group, putting the coefficientsin reference to no matches. No Asian students have more than 3 race matches. The fixed effects make comparisons betweenstudents that took identical courses in the same high school but have different race teachers. The coefficients are plotted inFigure 6. Standard errors are clustered at the high school level.
52

Table 7: Non-linear Match Effects for Two- and Four-Year College Enrollment
(3) (4)VARIABLES Enroll Two-Year Enroll Four-Year
Black Match Hispanic Match Asian Match White Match Black Match Hispanic Match Asian Match White Match
Match == 1 -0.002 0.006* -0.003 -0.012 0.017*** 0.008*** 0.008 -0.025(0.005) (0.004) (0.011) (0.019) (0.005) (0.003) (0.010) (0.016)
Match == 2 0.002 0.020*** -0.003 0.003 0.035*** 0.017*** -0.121*** -0.014(0.007) (0.006) (0.049) (0.018) (0.006) (0.006) (0.022) (0.014)
Match == 3 0.012 0.021** -0.035 0.011 0.027*** 0.028*** -0.08 -0.003(0.011) (0.009) (0.064) (0.018) (0.008) (0.007) (0.097) (0.014)
Match == 4 0.013 0.022* - 0.017 0.013 0.038*** - -0.002(0.013) (0.011) - (0.018) (0.010) (0.010) - (0.014)
Match == 5 0.039** 0.02 - 0.013 0.022 0.047*** - -0.007(0.019) (0.016) - (0.018) (0.018) (0.014) - (0.015)
Match == 6 0.001 0.007 - 0.001 0.004 0.052*** - -0.016(0.054) (0.019) - (0.021) (0.018) (0.018) - (0.017)
Observations 514,501 514,501R-squared 0.122 0.258
This table shows the non-linear dosage model for 9th grade race matches conditional on course-set on two- versus four-yearcollege enrollment. I regress indicators for each number of race match on outcomes allowing the functional form to be flexibleto test for non-linearity. The omitted group for each race is the no matches group, putting the coefficients in reference to nomatches. Asian students do not have more than 3 race matches. The fixed effects make comparisons between students that tookidentical courses in the same high school but have different race teachers. The coefficients are plotted in Figure 7. Standarderrors are clustered at the high school level.
53

Table 8: Dosage Effects of Race Matching in STEM Courses
(1) (2) (3)VARIABLES STEM Major Writing Major Social Science Major
Black Subject Match 0.007*** 0.001 0.001(0.003) (0.001) (0.002)
Hispanic Subject Match 0.006*** -0.001* 0.003**(0.002) (0.001) (0.001)
Asian Subject Match -0.006 0.005 -0.007(0.010) (0.007) (0.008)
White Subject Match 0.0004 0.003*** 0.00001(0.002) (0.001) (0.001)
Observations 514,501 514,501 514,501R-squared 0.174 0.091 0.096
This table show the results from the dosage model for 9th grade race matches examiningheterogeneity in subject conditional on course-set fixed effects. The fixed effects make com-parisons between students that took identical courses in the same high school but havedifferent race teachers. The interpretation on the Match coefficients is the effect of oneadditional same-race teacher in a given subject such as STEM, English, or Social Science.Standard errors are clustered at the high school level.
54

Table 9: Heterogeneity of 8th Reading Scores in Dosage Model
Panel A: HS Grad and Enrollment
(1) (2)VARIABLES Effect of Race Match on HS Grad Effect of Race Match on Enroll Any
Black Hispanic Asian White Black Hispanic Asian White
8th Grade Reading Test ScoresTop Quartile 0.008** 0.009*** 0.002 0.003* 0.012** 0.023*** -0.054*** 0.010***
(0.004) (0.002) (0.012) (0.002) (0.005) (0.004) (0.016) (0.002)2nd Quartile 0.011*** 0.008*** 0.014 0.002 0.009*** 0.016*** 0.004 0.009***
(0.004) (0.002) (0.012) (0.002) (0.003) (0.004) (0.020) (0.002)3rd Quartile -0.001 0.008*** 0.015 -0.001 0.011*** 0.014*** 0.037* 0.004**
(0.003) (0.002) (0.014) (0.002) (0.003) (0.003) (0.020) (0.002)Bottom Quartile 0.0004 0.002 0.076*** -0.001 0.010*** 0.010*** 0.008 0.001
(0.004) (0.003) (0.019) (0.002) (0.004) (0.004) (0.022) (0.002)
Observations 514,501 514,501R-squared 0.361 0.232
Panel B: Two- vs Four- Year Enrollment
(3) (4)VARIABLES Effect of Race Match on Enroll Two-Year Effect of Race Match on Enroll Four-Year
Black Hispanic Asian White Black Hispanic Asian White
8th Grade Reading Test ScoresTop Quartile 0.005 0.006** -0.036*** 0.005*** 0.012*** 0.018*** -0.011 0.003*
(0.004) (0.003) (0.014) (0.002) (0.004) (0.003) (0.016) (0.002)2nd Quartile -0.006* 0.005 -0.008 0.004* 0.023*** 0.013*** 0.02 0.004***
(0.003) (0.003) (0.016) (0.002) (0.003) (0.002) (0.016) (0.002)3rd Quartile 0.0003 0.008*** 0.047** 0.003 0.011*** 0.007*** -0.007 0.001
(0.003) (0.003) (0.020) (0.002) (0.002) (0.002) (0.022) (0.002)Bottom Quartile 0.011*** 0.008*** 0.053** 0.003 -0.0004 0.003 -0.076*** -0.003
(0.003) (0.003) (0.024) (0.002) (0.002) (0.002) (0.013) (0.002)
Observations 514,501 514,501R-squared 0.123 0.259
This table presents the linear dosage model for 9th grade race matches conditional on course-set effects examining heterogeneityin ability. The regressions are broken into quartiles of 8th grade math test scores. The fixed effect makes comparisons betweenstudents that took identical courses in the same high school but have different race teachers. The interpretation on the Matchcoefficient is the effect of one additional same-race teacher for a given student in a 8th grade math score quartile. Standarderrors are clustered at the high school level.
55

Table 10: Back of Envelope Calculations from Simulations
Panel A: Change in Number of Students
HS Grad Enroll Any Enroll Two Enroll Four
Black 68.6 228.5 68.6 228.5Hispanic 2629.1 5633.8 2629.1 3380.3Asian 188.3 -156.9 -20.9 -115.1White -238.4 -1668.5 -953.4 -476.7
Total Minority Change 2886.0 5705.5 2676.8 3493.8Total Change 2579.0 3808.4 1654.8 2788.5
Panel B: Change in Rate
HS Grad Enroll Any Enroll Two Enroll Four
Black 0.001 0.003 0.001 0.003Hispanic 0.011 0.023 0.011 0.014Asian 0.008 -0.007 -0.001 -0.005White -0.001 -0.009 -0.005 -0.003
Total Minority Change 0.009 0.017 0.008 0.010Total Change 0.005 0.008 0.003 0.006
This table presents the back of the envelope calculations for a simulation of a thought exper-iment where the racial distribution of teachers matched the racial distribution of students ateach school. I calculated the difference in average simulated matches and average observedmatches and multiplied those by the point estimate in Table 5. Panel A shows how manyadditional or fewer students change their educational attainment from the average simula-tion. Panel B shows how the race-specific rates change from the average simulation, andshould be interpreted as a percentage point change in the rate of each race graduating highschool or enrolling in college.
56

Table 11: Non-Linear Back of Envelope Calculations from Simulations
Panel A: Change from Number of Students
HS Grad Enroll Any Enroll Two Enroll Four
Black 27.1 237.6 47.7 278.8Hispanic 1779.5 5107.1 1958.6 3503.5Asian 102.3 -161.5 -16.6 -218.5White -1215.3 -2170.1 -1343.7 -787.1
Total Minority Change 1908.9 5183.2 1989.7 3563.7Total Change 693.6 3013.1 646.0 2776.6
Panel B: Change from Rate
HS Grad Enroll Any Enroll Two Enroll Four
Black 0.000 0.004 0.001 0.004Hispanic 0.007 0.021 0.008 0.014Asian 0.005 -0.007 -0.001 -0.010White -0.007 -0.012 -0.008 -0.004
Total Minority Change 0.006 0.015 0.006 0.011Total Change 0.001 0.006 0.001 0.005
This table presents the back of the envelope calculations for a simulation of a thought exper-iment where the racial distribution of teachers matched the racial distribution of students ateach school. I calculated the difference in the distribution of simulated matches and averageobserved distribution of matches and multiplied those by the estimates in Tables 6 and 7.Panel A shows how many additional or fewer students change their educational attainmentfrom the average simulation. Panel B shows how the race-specific rates change from theaverage simulation, and should be interpreted as a percentage point change in the rate ofeach race graduating high school or enrolling in college.
57
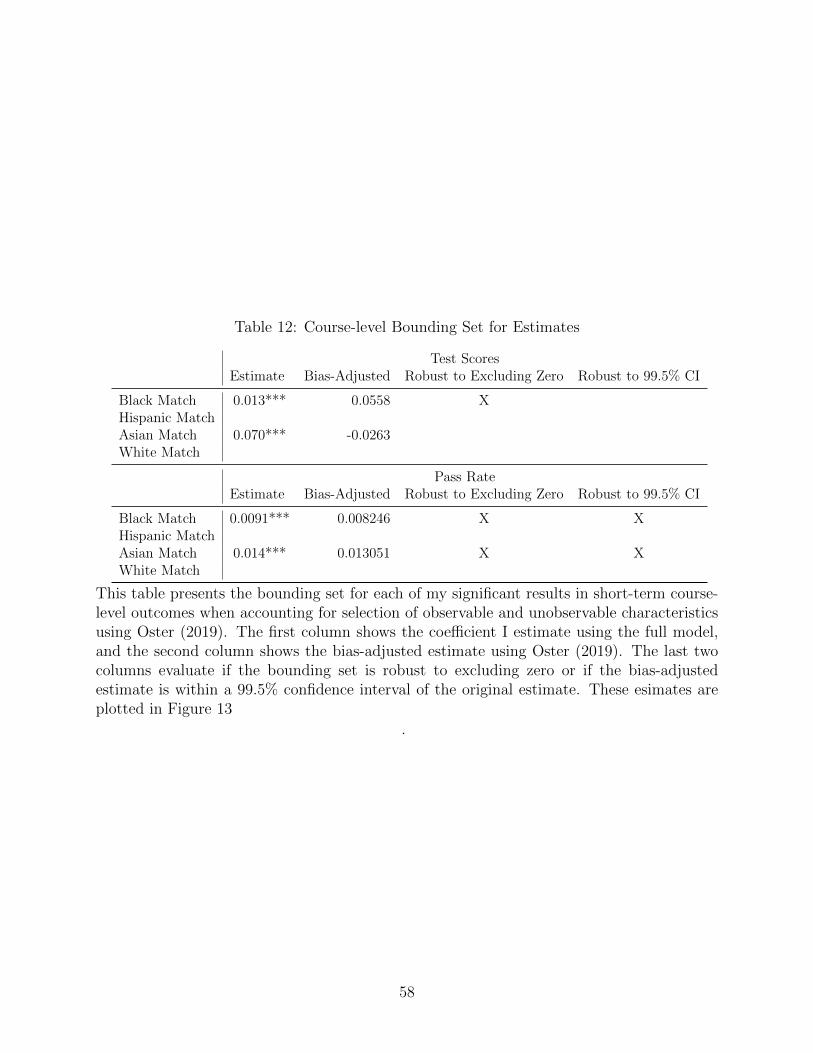
Table 12: Course-level Bounding Set for Estimates
Test ScoresEstimate Bias-Adjusted Robust to Excluding Zero Robust to 99.5% CI
Black Match 0.013*** 0.0558 XHispanic MatchAsian Match 0.070*** -0.0263White Match
Pass RateEstimate Bias-Adjusted Robust to Excluding Zero Robust to 99.5% CI
Black Match 0.0091*** 0.008246 X XHispanic MatchAsian Match 0.014*** 0.013051 X XWhite Match
This table presents the bounding set for each of my significant results in short-term course-level outcomes when accounting for selection of observable and unobservable characteristicsusing Oster (2019). The first column shows the coefficient I estimate using the full model,and the second column shows the bias-adjusted estimate using Oster (2019). The last twocolumns evaluate if the bounding set is robust to excluding zero or if the bias-adjustedestimate is within a 99.5% confidence interval of the original estimate. These esimates areplotted in Figure 13
.
58

Table 13: Individual-level Bounding Set for Estimates
HS GraduationEstimate Bias-Adjusted Robust to Excluding Zero Robust to 99.5% CI
Black MatchHispanic Match 0.007*** 0.008 X XAsian Match 0.018** 0.009 X XWhite Match
Enroll AnyEstimate Bias-Adjusted Robust to Excluding Zero Robust to 99.5% CI
Black Match 0.010*** 0.009 X XHispanic Match 0.015*** 0.006 X XAsian MatchWhite Match 0.007*** 0.017 X
Enroll Two-YearEstimate Bias-Adjusted Robust to Excluding Zero Robust to 99.5% CI
Black MatchHispanic Match 0.007** 0.001 X XAsian MatchWhite Match 0.004** 0.011 X
Enroll Four-YearEstimate Bias-Adjusted Robust to Excluding Zero Robust to 99.5% CI
Black Match 0.010*** 0.005 X XHispanic Match 0.009*** 0.005 X XAsian MatchWhite Match
This table presents the bounding set for each of my significant results in the linear dosagemodel when accounting for selection of observable and unobservable characteristics usingOster (2019). The first column shows the coefficient I estimate using the full model, and thesecond column shows the bias-adjusted estimate using Oster (2019). The last two columnsevaluate if the bounding set is robust to excluding zero or if the bias-adjusted estimate iswithin a 99.5% confidence interval of the original estimate. These esimates are plotted inFigure 14
.
59

Table 14: Expanded Course Sets
Panel A: 10th Grade Course Set
(1) (2) (3) (4)VARIABLES HS Grad Enroll Any Two-Year Enroll Four-Year Enroll
Black Match 0.003 0.013*** 0.005* 0.011***(0.003) (0.003) (0.003) (0.003)
Hispanic Match 0.004* 0.018*** 0.011*** 0.008***(0.002) (0.003) (0.003) (0.002)
Asian Match 0.007 0.011 0.01 0.008(0.006) (0.011) (0.008) (0.010)
White Match 0.002 0.005** 0.005*** 0.001(0.002) (0.002) (0.002) (0.002)
Observations 407,727 407,727 407,727 407,727R-squared 0.321 0.286 0.195 0.323
Panel B: 9th and 10th Grade Course Set
(1) (2) (3) (4)VARIABLES HS Grad Enroll Any Two-Year Enroll Four-Year Enroll
Black Match 0.001 0.008*** 0.0005 0.009***(0.002) (0.002) (0.002) (0.002)
Hispanic Match 0.002* 0.010*** 0.007*** 0.005***(0.001) (0.002) (0.002) (0.002)
Asian Match 0.0002 0.003 0.006 0.003(0.001) (0.010) (0.009) (0.008)
White Match 0.003*** 0.004*** 0.001 0.003***(0.001) (0.001) (0.001) (0.001)
Observations 317,979 317,979 317,979 317,979R-squared 0.564 0.393 0.28 0.392
This table shows the dosage model for 10th grade race matches or 9th and 10th grade racematches conditional on course-set fixed effects. The fixed effects make comparisons betweenstudents that took identical courses in the same high school but have different race teachers.The interpretation on the Match coefficient is the effect of one additional same-race teacher.Standard errors are clustered at the high school level.
60

Figures
Figure 1: Campus Level Identifying Variation
0.2
.4.6
.81
Perc
ent o
f Bla
ck S
tude
nts
0 .2 .4 .6 .8 1Percent of Black Teachers
Correlation: 0.745
0.2
.4.6
.81
Perc
ent o
f His
pani
c St
uden
ts
0 .2 .4 .6 .8 1Percent of Hispanic Teachers
Correlation: 0.728
0.2
.4.6
Perc
ent o
f Asi
an S
tude
nts
0 .1 .2 .3 .4 .5Percent of Asian Teachers
Correlation: 0.254
0.2
.4.6
.81
Perc
ent o
f Whi
te S
tude
nts
0 .2 .4 .6 .8 1Percent of White Teachers
Correlation: 0.755
Campuses with Courses of Multiple Race TeachersCampuses without Courses of Multiple Race Teachers
Note: These figures plot the relationship at the campus level between students and teachers of the samerace. The top left quadrant shows Black students and teachers, the top right quadrant shows Hispanic
students and teachers, the bottom left quadrant shows Asian students and teachers, and the bottom rightquadrant shows White students and teachers. The gray dots shows campuses that do not contribute to the
identifying variation in that they do not have courses with multiple race teachers. The correlationcoefficient for each race is given below each plot.
61

Figure 2: Likelihood of Same-Race Student Teacher Sorting
Note: These figures plot the coefficients estimated using regressions (1)-(4) estimated separately usingvarying fixed effects to estimate the likelihood that students and teachers are matched along racial lines.The top and bottom figure display the same information and coefficents, but the bottom figure omits the
“No FEs” model to show the scaling between the last three models. Racial sorting of students and teachersdecreases with high school FEs and decreases further using high school by year by course FEs. Standard
errors are clustered at the school level.
62

Figure 3: Covariates that Predict Same-Race Student Teacher Assignment
Note: These figures plot the coefficients estimated using regression (5)-(8) estimated separately usingvarying fixed effects to estimate what covariates predict students and teachers matching along racial lines.
Regressions are limited to one race to examine how the covariates for students of that race predict racematching. Racial sorting of students and teachers decreases with high school FEs and decreases further
using high school by year by course FEs. Standard errors are clustered at the school level.
63

Figure 4: Dosage – Likelihood of Same-Race Student Teacher Sorting
Note: These figures plot the coefficients estimated using regression (10)-(13) estimated separately usingvarying fixed effects to estimate the likelihood that students and teachers are matched along racial lines.The top and bottom figure display the same information and coefficents, but the bottom figure omits the
“No FEs” model to show the scaling between the last three models. Racial sorting of students and teachersdecreases with high school FEs and decreases further using course-set FEs. Standard errors are clustered at
the school level.
64

Figure 5: Dosage – Covariates that Predict Same-Race Student Teacher Assignment
Note: These figures plot the coefficients estimated using regression (14)-(17) estimately separately usingvarying fixed effects to estimate what covariates predict students and teachers matching along racial lines.
Regressions are limited to one race to examine how the covariates for students of that race predict racematching. Racial sorting of students and teachers decreases with high school FEs and decreases further
using course-set FEs. Standard errors are clustered at the school level.
65

Figure 6: Non-linear Race Match Effects on HS Graduation and College Enrollment
0.1
.2.3
.4.5
Mat
ch D
ensi
ty
-.1-.0
50
.05
.1.1
5Ef
fect
of R
ace
Mat
ch
0 1 2 3 4 5 6Black Matches
0.1
.2.3
.4M
atch
Den
sity
0.0
2.0
4.0
6.0
8.1
Effe
ct o
f Rac
e M
atch
0 1 2 3 4 5 6Hispanic Matches
0.2
.4.6
.8M
atch
Den
sity
-.4-.2
0.2
Effe
ct o
f Rac
e M
atch
0 1 2 3Asian Matches
0.1
.2.3
.4M
atch
Den
sity
-.1-.0
50
.05
Effe
ct o
f Rac
e M
atch
0 1 2 3 4 5 6White Matches
HS Grad Enroll Any
Match Density
Note: These plots show the non-linear race match effects for high school graduation and collegeenrollment. The top left quadrant shows the non-linear effects for Black students, the top right quadrant
shows the effects for Hispanic students, the bottom left quadrant shows the effects for Asian students, andthe bottom right quadrant shows the effects for White students. The group for no race matches is omittedas the reference group. For context, I include the histogram for race-matches for each race in the plot todetermine how the support for each plot varies by race. The left y-axis scales the effect size and the righty-axis scales the histogram. The coefficients are displayed in Table 6. Standard errors are clustered at the
school level.
66

Figure 7: Non-linear Race Match Effects on Two- vs Four-Year College Enrollment
0.1
.2.3
.4.5
Mat
ch D
ensi
ty
-.1-.0
50
.05
.1Ef
fect
of R
ace
Mat
ch
0 1 2 3 4 5 6Black Matches
0.1
.2.3
.4M
atch
Den
sity
-.05
0.0
5.1
Effe
ct o
f Rac
e M
atch
0 1 2 3 4 5 6Hispanic Matches
0.2
.4.6
.8M
atch
Den
sity
-.3-.2
-.10
.1Ef
fect
of R
ace
Mat
ch
0 1 2 3Asian Matches
0.1
.2.3
.4M
atch
Den
sity
-.05
0.0
5Ef
fect
of R
ace
Mat
ch
0 1 2 3 4 5 6White Matches
Enroll Two-Yr Enroll Four-Yr
Match Density
Note: These plots show the non-linear race match effects for two- versus four-year college enrollment. Thetop left quadrant shows the non-linear effects for Black students, the top right quadrant shows the effectsfor Hispanic students, the bottom left quadrant shows the effects for Asian students, and the bottom rightquadrant shows the effects for White students. For context, I include the histogram for race-matches foreach race in the plot to determine how the support for each plot varies by race. The left y-axis scales the
effect size and the right y-axis scales the histogram. The group for no race matches is omitted as thereference group. The coefficients are displayed in Table 7. Standard errors are clustered at the school level.
67

Figure 8: Student and Teacher Racial Distribution
0.2
.4.6
.81
Perc
ent o
f Bla
ck S
tude
nts
0 .2 .4 .6 .8 1Percent of Black Teachers
Black students underrepresented in 69.6% of campuses0
.2.4
.6.8
1Pe
rcen
t of H
ispa
nic
Stud
ents
0 .2 .4 .6 .8 1Percent of Hispanic Teachers
Hispanic students underrepresented in 96.1% of campuses
0.2
.4.6
.81
Perc
ent o
f Asi
an S
tude
nts
0 .2 .4 .6 .8 1Percent of Asian Teachers
Asian students underrepresented in 46.9% of campuses
0.2
.4.6
.81
Perc
ent o
f Whi
te S
tude
nts
0 .2 .4 .6 .8 1Percent of White Teachers
White students underrepresented in 2.6% of campuses
HS CampusEqual Representation
Note: These figures plot the relationship at the campus level between students and teachers of the samerace. The top left quadrant shows Black students and teachers, the top right quadrant shows Hispanic
students and teachers, the bottom left quadrant shows Asian students and teachers, and the bottom rightquadrant shows White students and teachers. The dashed line shows where a school would be if the
teaching population was representative of the student population. Being above the dashed line representsstudents being underrepresented by the teaching population and vice-versa for being under the dashed line.
The percentage of campus above the dashed line for each race is given below each plot.
68

Figure 9: Simulated Change in Average Race Matches
Observed Avg Matches
05
1015
20D
ensi
ty
.9 1 1.1 1.2 1.3Simulated Avg Black Matches
Observed Avg Matches
010
2030
Den
sity
1.3 1.6 1.9 2.2 2.5 2.8 3.1Simulated Avg Hispanic Matches
Observed Avg Matches
05
1015
Den
sity
.15 .25 .35 .45 .55 .65 .75Simulated Avg Asian Matches
Observed Avg Matches
05
1015
20D
ensi
ty
2.3 2.55 2.8 3.05 3.3 3.55 3.8Simulated Avg White Matches
Note: These figures show the distribution of the average number of race matches for 5,000 simulationswith the observed number of race matches represented by the dashed red line. The top left quadrant shows
Black students, the top right quadrant shows Hispanic students, the bottom left quadrant shows Asianstudents, and the bottom right quadrant shows White students. In the simulation, there are more Black,
Hispanic, and Asian teacher with fewer White teachers compared to the observed matches.
69

Figure 10: Simulated Change in Distribution of Race Matches
0.1
.2.3
.4.5
Den
sity
0 2 4 6Black Race Matches
0.1
.2.3
.4D
ensi
ty
0 2 4 6Hispanic Race Matches
0.2
.4.6
.8D
ensi
ty
0 1 2 3Asian Race Matches
0.1
.2.3
.4D
ensi
ty
0 2 4 6White Race Matches
Avg Simulated Distribution Observed Distribution
Note: These figures show the change in the average distribution of race matches for 5,000 simulations inthe blue bars with the observed distribution of race matches represented by the white bars. The top left
quadrant shows Black students, the top right quadrant shows Hispanic students, the bottom left quadrantshows Asian students, and the bottom right quadrant shows White students. In the simulation, there aremore Black, Hispanic, and Asian teacher with fewer White teachers compared to the observed matches.
70

Figure 11: Simulated Change in Distribution with Non-Linear Effects of Race Matches
-110
000
1100
0Si
mul
ated
Den
sity
Cha
nge
-.15-
.1-.0
50
.05
.1.1
5Ef
fect
of R
ace
Mat
ch
0 1 2 3 4 5 6Black Matches
-900
000
9000
0Si
mul
ated
Den
sity
Cha
nge
-.1-.0
50
.05
.1Ef
fect
of R
ace
Mat
ch0 1 2 3 4 5 6
Hispanic Matches
-700
0-3
500
035
00Si
mul
ated
Den
sity
Cha
nge
-.4-.3
-.2-.1
0.1
.2Ef
fect
of R
ace
Mat
ch
0 1 2 3Asian Matches
-450
00-1
5000
1500
045
000
Sim
ulat
ed D
ensi
ty C
hang
e
-.1-.0
50
.05
.1Ef
fect
of R
ace
Mat
ch
0 1 2 3 4 5 6White Matches
HS Grad Enroll Any
Simulated Density Change
Note: These figures show the change in the average distribution of race matches for 5,000 simulations inthe grey bars. The top left quadrant shows Black students, the top right quadrant shows Hispanic
students, the bottom left quadrant shows Asian students, and the bottom right quadrant shows Whitestudents. The estimates plotted can be seen in Table 6.
71

Figure 12: Simulated Change in Distribution with Non-Linear Effects of Race Matches
-110
000
1100
0Si
mul
ated
Den
sity
Cha
nge
-.1-.0
50
.05
.1Ef
fect
of R
ace
Mat
ch
0 1 2 3 4 5 6Black Matches
-900
000
9000
0Si
mul
ated
Den
sity
Cha
nge
-.1-.0
50
.05
.1Ef
fect
of R
ace
Mat
ch0 1 2 3 4 5 6
Hispanic Matches
-700
0-3
500
035
00Si
mul
ated
Den
sity
Cha
nge
-.4-.3
-.2-.1
0.1
.2Ef
fect
of R
ace
Mat
ch
0 1 2 3Asian Matches
-450
00-1
5000
1500
045
000
Sim
ulat
ed D
ensi
ty C
hang
e
-.1-.0
50
.05
.1Ef
fect
of R
ace
Mat
ch
0 1 2 3 4 5 6White Matches
Enroll Two-Yr Enroll Four-Yr
Simulated Density Change
Note: These figures show the change in the average distribution of race matches for 5,000 simulations inthe grey bars. The top left quadrant shows Black students, the top right quadrant shows Hispanic
students, the bottom left quadrant shows Asian students, and the bottom right quadrant shows Whitestudents. The estimates plotted can be seen in Table 7.
72

Figure 13: Bounding Sets and Robustness for Short-term Results
Note: These figures plot the bounding set for significant estimates on race-matching for short-termoutcomes. The arrow indicates the direction of the bais and how different the bias adjusted estimate is
from the original estimate. The first figure tests if the bounding set includes zero which is shown using ared line. The second figure tests if the bounding set is within the 99.5% confidence interval of the original
estimate, denoted using dashed red lines.
73

Figure 14: Bounding Sets and Robustness for Long-term Results
Note: These figures plot the bounding set for significant estimates on race-matching for long-termoutcomes. The arrow indicates the direction of the bais and how different the bias adjusted estimate is
from the original estimate. The first figure tests if the bounding set includes zero which is shown using ared line. The second figure tests if the bounding set is within the 99.5% confidence interval of the original
estimate, denoted using dashed red lines.
74

Appendix A. Tables
Table A1: Black Student to Black Teacher Sorting
(1) (2) (3) (4)VARIABLES Black Teacher Black Teacher Black Teacher Black Teacher
Black Student 0.152*** 0.00801*** 0.00797*** 0.00376***(0.0117) (0.000747) (0.000745) (0.000468)
HS FE X X XHS, Year FE X XHS by Year by Course FE X
Observations 8,960,036 8,960,036 8,960,036 8,958,612R-squared 0.039 0.232 0.232 0.620
Table gives the regressions estimated separately using varying fixed effects to estimate thelikelihood that Black students and Black teachers are matched. Standard errors are clusteredat the school level.
75

Table A2: Hispanic Student to Hispanic Teacher Sorting
(1) (2) (3) (4)VARIABLES Hispanic Teacher Hispanic Teacher Hispanic Teacher Hispanic Teacher
Hispanic Student 0.218*** 0.00291*** 0.00281*** 0.00122***(0.0143) (0.000430) (0.000428) (0.000294)
HS FE X X XHS, Year FE X XHS by Year by Course FE X
Observations 8,960,036 8,960,036 8,960,036 8,958,612R-squared 0.039 0.232 0.232 0.620
Table gives the regressions estimated separately using varying fixed effects to estimate thelikelihood that Hispanic students and Hispanic teachers are matched. Standard errors areclustered at the school level.
Table A3: Asian Student to Asian Teacher Sorting
(1) (2) (3) (4)VARIABLES Asian Teacher Asian Teacher Asian Teacher Asian Teacher
Asian Student 0.0266*** 0.00361*** 0.00360*** 0.00144**(0.00343) (0.00109) (0.00109) (0.000675)
HS FE X X XHS, Year FE X XHS by Year by Course FE X
Observations 8,960,036 8,960,036 8,960,036 8,958,612R-squared 0.039 0.232 0.232 0.620
Table gives the regressions estimated separately using varying fixed effects to estimate thelikelihood that Asian students and Asian teachers are matched. Standard errors are clusteredat the school level.
76

Table A4: White Student to White Teacher Sorting
(1) (2) (3) (4)VARIABLES White Teacher White Teacher White Teacher White Teacher
White Student 0.261*** 0.00455*** 0.00437*** 0.00193***(0.0126) (0.000589) (0.000587) (0.000368)
HS FE X X XHS, Year FE X XHS by Year by Course FE X
Observations 8,960,036 8,960,036 8,960,036 8,958,612R-squared 0.039 0.232 0.232 0.620
Table gives the regressions estimated separately using varying fixed effects to estimate thelikelihood that White students and White teachers are matched. Standard errors are clus-tered at the school level.
Table A5: Covariates of Black Students that Predict Black Teachers
(1) (2) (3) (4)VARIABLES Black Teacher Black Teacher Black Teacher Black Teacher
Gifted 0.0381*** -0.0151*** -0.0150*** -0.00586**(0.0101) (0.00291) (0.00290) (0.00232)
Free/Reduced Lunch 0.0531*** 0.00190** 0.00179** 0.00105*(0.00689) (0.000814) (0.000807) (0.000595)
8th Grade Reading Z-Score 0.00880*** 0.00283*** 0.00263** -0.00133**(0.00250) (0.00104) (0.00104) (0.000598)
8th Grade Math Z-Score -0.00662*** 0.00460*** 0.00475*** 0.00244***(0.00254) (0.000801) (0.000825) (0.000625)
HS FE X X XHS, Year FE X XHS by Year by Course FE X
Observations 1,130,802 1,130,781 1,130,781 1,104,843R-squared 0.013 0.280 0.280 0.654
Table give regressions estimated separately using varying fixed effects to estimate whatcovariates of Black students predict having Black teachers matching along racial lines. Re-gressions are limited to Black students. Standard errors are clustered at the school level.
77

Table A6: Covariates of Hispanic Students that Predict Hispanic Teachers
(1) (2) (3) (4)VARIABLES Hispanic Teacher Hispanic Teacher Hispanic Teacher Hispanic Teacher
Gifted 0.100*** -0.00901*** -0.00888*** -0.00362***(0.0129) (0.00136) (0.00136) (0.000999)
Free/Reduced Lunch 0.0926*** 0.00243*** 0.00244*** 0.00153***(0.0121) (0.000588) (0.000588) (0.000395)
8th Grade Reading Z-Score -0.0316*** -0.00246*** -0.00318*** -0.00140***(0.00409) (0.000675) (0.000673) (0.000414)
8th Grade Math Z-Score 0.0335*** -0.000222 0.000103 -0.000410(0.00515) (0.000649) (0.000651) (0.000405)
HS FE X X XHS, Year FE X XHS by Year by Course FE X
Observations 4,415,867 4,415,856 4,415,856 4,400,327R-squared 0.017 0.461 0.461 0.732
This table gives regressions estimated separately using varying fixed effects to estimate whatcovariates of Hispanic students predict having Hispanic teachers matching along racial lines.Regressions are limited to Hispanic students. Standard errors are clustered at the schoollevel.
78

Table A7: Covariates of Asian Students that Predict Asian Teachers
(1) (2) (3) (4)VARIABLES Asian Teacher Asian Teacher Asian Teacher Asian Teacher
Gifted 0.00869 0.00135 0.00174 0.000104(0.00673) (0.00287) (0.00290) (0.00142)
Free/Reduced Lunch 0.00525 -0.000954 -0.00106 -0.00121*(0.00358) (0.000851) (0.000843) (0.000702)
8th Grade Reading Z-Score -0.00210 -0.00110 -0.00265** -0.00167**(0.00144) (0.000983) (0.00110) (0.000793)
8th Grade Math Z-Score 0.000142 -0.00119 -0.000311 0.000430(0.00191) (0.000995) (0.00109) (0.000647)
HS FE X X XHS, Year FE X XHS by Year by Course FE X
Observations 400,796 400,785 400,785 379,993R-squared 0.001 0.062 0.062 0.579
This table gives regressions estimated separately using varying fixed effects to estimate whatcovariates of Asian students predict having Asian teachers matching along racial lines. Re-gressions are limited to Asian students. Standard errors are clustered at the school level.
79

Table A8: Covariates of White Students that Predict White Teachers
(1) (2) (3) (4)VARIABLES White Teacher White Teacher White Teacher White Teacher
Gifted -0.0112*** 0.0105*** 0.0102*** 0.00525***(0.00363) (0.00131) (0.00130) (0.00103)
Free/Reduced Lunch -0.0163*** -0.00363*** -0.00356*** -0.00145***(0.00280) (0.000565) (0.000564) (0.000398)
8th Grade Reading Z-Score -0.00439*** -0.00114* 0.000206 0.00118***(0.00116) (0.000615) (0.000605) (0.000423)
8th Grade Math Z-Score 0.00674*** -0.000385 -0.000998* -0.000623(0.00156) (0.000568) (0.000565) (0.000464)
HS FE X X XHS, Year FE X XHS by Year by Course FE X
Observations 2,965,012 2,964,999 2,964,999 2,949,041R-squared 0.002 0.129 0.129 0.562
This table gives regressions estimated separately using varying fixed effects to estimate whatcovariates of White students predict having White teachers matching along racial lines.Regressions are limited to White students. Standard errors are clustered at the school level.
Table A9: Dosage – Black Student to Black Teacher Sorting
(1) (2) (3) (4)VARIABLES Black Teacher Black Teacher Black Teacher Black Teacher
Black Student 0.669*** 0.0239*** 0.0133*** 0.0142***(0.0557) (0.00447) (0.00309) (0.00306)
HS FE X X XCourse Set X XCohort Course Set X
Observations 562,255 562,246 514,501 506,034R-squared 0.091 0.627 0.749 0.773
Table gives the regressions estimated separately using varying fixed effects to estimate thelikelihood that Black students and Black teachers are matched. Standard errors are clusteredat the school level.
80

Table A10: Dosage – Hispanic Student to Hispanic Teacher Sorting
(1) (2) (3) (4)VARIABLES Hispanic Teacher Hispanic Teacher Hispanic Teacher Hispanic Teacher
Hispanic Student 0.973*** 0.0119*** 0.00619*** 0.00547**(0.0638) (0.00331) (0.00237) (0.00231)
HS FE X X XCourse Set X XCohort Course Set X
Observations 562,255 562,246 514,501 506,034R-squared 0.172 0.801 0.876 0.889
Table gives the regressions estimated separately using varying fixed effects to estimate thelikelihood that Hispanic students and Hispanic teachers are matched. Standard errors areclustered at the school level.
Table A11: Dosage – Asian Student to Asian Teacher Sorting
(1) (2) (3) (4)VARIABLES Asian Teacher Asian Teacher Asian Teacher Asian Teacher
Asian Student 0.0905*** 0.0166*** 0.00917*** 0.00798**(0.0143) (0.00532) (0.00336) (0.00334)
HS FE X X XCourse Set X XCohort Course Set X
Observations 562,255 562,246 514,501 506,034R-squared 0.009 0.279 0.472 0.518
Table gives the regressions estimated separately using varying fixed effects to estimate thelikelihood that Asian students and Asian teachers are matched. Standard errors are clusteredat the school level.
81

Table A12: Dosage – White Student to White Teacher Sorting
(1) (2) (3) (4)VARIABLES White Teacher White Teacher White Teacher White Teacher
White Student 1.144*** 0.0403*** 0.00895*** 0.00763***(0.0524) (0.00492) (0.00286) (0.00283)
HS FE X X XCourse Set X XCohort Course Set X
Observations 562,255 562,246 514,501 506,034R-squared 0.171 0.668 0.835 0.851
Table gives the regressions estimated separately using varying fixed effects to estimate thelikelihood that White students and White teachers are matched. Standard errors are clus-tered at the school level.
Table A13: Dosage – Covariates of Black Students that Predict Black Teachers
(1) (2) (3) (4)VARIABLES Black Teacher Black Teacher Black Teacher Black Teacher
Gifted 0.198*** -0.0415* 0.00584 0.00616(0.0565) (0.0241) (0.0164) (0.0154)
Free/Reduced Lunch 0.293*** 0.0163*** 0.00909* 0.00611(0.0377) (0.00591) (0.00552) (0.00563)
8th Grade Reading Z-Score 0.0255* -0.0115 0.00118 -0.00104(0.0150) (0.00752) (0.00621) (0.00621)
8th Grade Math Z-Score -0.0282** 0.0144** 0.00178 0.000954(0.0134) (0.00681) (0.00643) (0.00610)
HS FE X X XCourse Set X XCohort Course Set X
Observations 73,062 72,910 59,580 57,117R-squared 0.033 0.680 0.797 0.819
Regressions estimated separately using varying fixed effects to estimate what covariates ofBlack students predict having Black teachers matching along racial lines. Regressions arelimited to Black students. Standard errors are clustered at the school level.
82

Table A14: Dosage – Covariates of Hispanic Students that Predict Hispanic Teachers
(1) (2) (3) (4)VARIABLES Hispanic Teacher Hispanic Teacher Hispanic Teacher Hispanic Teacher
Gifted 0.510*** -0.0172 -0.00639 -0.00808(0.0659) (0.0130) (0.00789) (0.00776)
Free/Reduced Lunch 0.418*** 0.00818* 0.00724** 0.00634*(0.0538) (0.00431) (0.00362) (0.00351)
8th Grade Reading Z-Score -0.163*** -0.0376*** 0.00445 -0.00298(0.0204) (0.00673) (0.00557) (0.00396)
8th Grade Math Z-Score 0.144*** -0.0132** -0.00381 0.00189(0.0250) (0.00633) (0.00626) (0.00414)
HS FE X X XCourse Set X XCohort Course Set X
Observations 270,465 270,429 238,125 232,276R-squared 0.028 0.807 0.889 0.901
Regressions estimated separately using varying fixed effects to estimate what covariates ofHispanic students predict having Hispanic teachers matching along racial lines. Regressionsare limited to Hispanic students. Standard errors are clustered at the school level.
83

Table A15: Dosage – Covariates of Asian Students that Predict Asian Teachers
(1) (2) (3) (4)VARIABLES Asian Teacher Asian Teacher Asian Teacher Asian Teacher
Gifted 0.0237 -0.00197 0.00646 0.00480(0.0331) (0.0160) (0.0111) (0.0127)
Free/Reduced Lunch 0.00669 -0.0135* -0.0140** -0.0121*(0.0150) (0.00737) (0.00652) (0.00700)
8th Grade Reading Z-Score -0.00579 0.000577 0.00918 0.00140(0.00866) (0.00815) (0.0101) (0.00854)
8th Grade Math Z-Score 0.00538 -0.00528 0.000744 0.000631(0.0119) (0.00987) (0.00896) (0.00778)
HS FE X X XCourse Set X XCohort Course Set X
Observations 24,274 24,069 18,534 17,438R-squared 0.001 0.329 0.564 0.616
Regressions estimated separately using varying fixed effects to estimate what covariates ofAsian students predict having Asian teachers matching along racial lines. Regressions arelimited to Asian students. Standard errors are clustered at the school level.
84

Table A16: Dosage – Covariates of White Students that Predict White Teachers
(1) (2) (3) (4)VARIABLES White Teacher White Teacher White Teacher White Teacher
Gifted -0.0391* 0.0481*** 0.0186** 0.0207**(0.0227) (0.0129) (0.00842) (0.00832)
Free/Reduced Lunch 0.0179 -0.0182*** -0.00265 -0.00283(0.0169) (0.00590) (0.00379) (0.00356)
8th Grade Reading Z-Score -0.0589*** -0.0442*** -0.000535 0.0111***(0.00885) (0.00697) (0.00647) (0.00410)
8th Grade Math Z-Score 0.00843 -0.0295*** 0.00699 -0.000560(0.0110) (0.00661) (0.00625) (0.00383)
HS FE X X XCourse Set X XCohort Course Set X
Observations 191,190 191,115 168,195 163,583R-squared 0.003 0.427 0.779 0.801
Regressions estimated separately using varying fixed effects to estimate what covariates ofWhite students predict having White teachers matching along racial lines. Regressions arelimited to White students. Standard errors are clustered at the school level.
85