high risk. (brown)* facts
TRANSCRIPT

Facts Monthly fund analysis and market reviews
Figures inMay 2015
We set out to guide you through market ups & downs…
…And we’re right on track!
BOI AXA
EQUITY DEBT REBALANCER FUNDHigh risk. (BROWN)*
*Refer Page No. 22 for Product Labelling
An Open -Ended Dynamic Fund

The BOI AXA EQUITY DEBT REBALANCER FUND, set out to offer you–1) Dynamic Asset Allocation that judiciously allocates assets on your behalf based on Market P/E
2) Lower Volatility as compared to pure equity investment
3) Risk-adjusted returns over the long term
Here is what we have delivered over the past year of choppy markets
BOI AXA Equity Debt Rebalancer Fund –Regular Plan – Growth Option
Scheme Benchmark – 50% CNX Nifty Index and 50% Crisil Short Term Bond Fund Index
100% CNX Nifty Index
100% Crisil Short Term Bond Fund Index
Lower Volatility as compared to pure equity investment
The chart above displays how volatile a pure equity index has been, and in comparison how the BOI AXA Equity Debt Rebalancer Fund, with its dynamic asset allocation has ridden the high and lows of this market cycle.
Dynamic Asset Allocation thatjudiciously allocates assets on yourbehalf based on Market P/E
As the markets scaled higher lastyear, we reduced our equityexposure and now as they correct,we are ramping it back up.
DateCNX Nifty P/E Ratio
Asset Allocation 5 days after month-end
Equity Debt
31-Mar-14 18.86 48.0% 52.0%
30-Apr-14 18.79 44.7% 55.3%
31-May-14 19.82 39.0% 61.0%
30-Jun-14 20.65 41.5% 58.5%
31-Jul-14 20.56 34.1% 65.9%
31-Aug-14 20.8 33.1% 66.9%
30-Sep-14 20.82 33.5% 66.5%
31-Oct-14 21.58 35.7% 64.3%
28-Nov-14 21.94 30.0% 70.0%
31-Dec-14 21.16 34.3% 65.7%
31-Jan-15 22.4 30.1% 69.9%
28-Feb-15 23.8 19.8% 80.2%
31-Mar-15 22.7 24.3% 75.7%
140
135
130
125
120
115
110
105
100
95
90
31
-Mar
-14
30
-Ju
n-1
4
30
-Sep
-14
31
-Oct
-14
31
-Mar
-15
30-Apr-15 20.07 30.0% 70.0%
Risk-adjusted returns resulting out of profit booking as equity markets go up
BOI AXA Equity Debt Rebalancer Fund’s performance speaks for itself
Is this fund meant for you? Yes! If you are looking for…üA judicious allocation of assets based on the Market (CNX Nifty Index) P/E
üRisk-adjusted returns in the long -term
üLower return volatility as compared to pure equity investment
refer page no. 18.

Indian equities gained back some ground in May following the sustained sell off witnessed over the previous two months. However, the corporate earnings continued to
disappoint with benefits of gross margin expansion on the back of benign commodity prices not flowing through to the bottom line. Most of the expected recovery in
growth also has now been pushed to the second half, with most companies hoping for a demand revival during the festive season. A weak monsoon, however, could play
spoilsport for these expectations. The deadlock in parliament was another negative during the month with both key bills i.e. GST and Land Acquisition failing to make it
through the Upper House.
The selling momentum from FIIs seen in the latter half of April spilled over to May and we saw net selling to the tune of US$70Mn – this was tempered only by the large
MSCI Index rebalancing related passive buying on the last day. This YTD net buy tally now stands at approximatelyUS$7.1 Bn. DIIs remained net buyers to the tune of
US$1.3 Bn with mutual funds buying US$725Mn and insurance companies contributing the remaining US$620Mn. With this month’s net buy figure DIIs have now bought
US$2.3 Bn this year to date.
In terms of corporate earnings, the last quarter was amongst the worst inover the last 20 quarters with aggregate Sensex earnings contracting sharply. Overall, Public
sector banks and Cement companies disappointed the most and were joined by select Consumer Staples, IT and Energy companies to further exacerbate the earnings
miss.
On the macro front, the month also saw the release of the FY 15 GDP numbers. The FY15 GDP growth came in at 7.3%, higher than the FY14 growth rate of 6.9%, although
marginally lower than the government’s own estimate of 7.4%. We believe, the government’s continued to focus on institutional (e.g. Jan-Dhan, GST, co-
operativefederalism) and governance reforms (auction based allocation, targeted subsidyetc.) will have a significant impact on growth in the medium term.
However, presently, the other macro indicators are not portraying a very rosy picture. The IIP growth came in at 2.1% vs 5.5% yoy growth in February indicating that there
is still no revival in industrial activity. The inflation numbers were one of the few positives this month, both the CPI and WPI continued their downward trajectory. The WPI
declined to -2.7% in April against -2.3% in previous month. CPI reduced to 4.9% in April against 5.2% in previous month.
In line with expectations India Inc. ended the previous quarter on weak note as the transmission of reform oriented policies; lower interest rate and benign inflation are
yet to reflect on the financials.The economy we expect is likely to get some support (1) increased public investments (2) liberalized FDI and (3) lower interest rates, which
in turn will help revive corporate earnings. We continue to be constructive on the Indian market, as growth revives this year, and steady earnings growth continues.
3
Data as on June 8, 2015
Source: Bloomberg (Unless indicated otherwise)
David PezarkarCHIEF INVESTMENT OFFICER
EQUITYEQUITY OUTLOOK
Data as on June 8, 2015
Source: Bloomberg (Unless indicated otherwise)
Alok SinghCHIEF INVESTMENT OFFICER
FIXED INCOMEFIXED INCOME OUTLOOK The Reserve Bank of India in its policy review reduced the repo rate by 25 bps to 7.25%. Consequently, the reverse repo rate stands adjusted at 6.25% and the marginal
standing facility (MSF) rate and the Bank Rate at 8.25%. The cash reserve ratio (CRR) was kept unchanged at 4.00% of NDTL. RBI also kept the liquidity facility under 7-day
and 14-day term repos unchanged. i.e.:- up to 0.75% of NDTL & liquidity under overnight repos maintained at 0.25% of bank-wise NDTL.
The RBI gave a cautious guidance about inflation while clearly acknowledging that a number of upside risks still remain to headline inflation going ahead. More
specifically, the prospect of a poor monsoon this year remains and could push up food inflation if its negative output impact is not managed efficiently. Oil prices have
firmed up and geo-political risks could push up prices further were the risks to intensify. Lastly, the prospect of further external and exchange rate volatility could also
adversely impact domestic inflation. All of these risks have culminated in the RBI pushing up its CPI inflation forecast higher for January, 2016 by 20 bps to 6.0%.
The RBI still believes domestic demand to be weak and has pulled down its growth reading (as measured by gross value added) for FY16 lower to 7.6% from 7.8% earlier.
The fact that output growth (gross value added) for Q4FY15 fell to 6.1% on top of a downwardly revised growth reading of 6.8% for Q3FY15 corroborates this downgrade
in growth prospects. The tilt of the RBI’s guidance is more dovish than the market is pricing in and the possibility of further policy easing cannot be ruled out. Monetary
policy action going ahead is likely to be data dependent and it is entirely possible that this data plays out in favour of more easing.
The benchmark 10-yr government bond yield has hardened to 7.75%-7.80% range in response to RBIs policy review and reacting largely to the global events and
hardening of US yields by over 25 basis points. The consensus expectation in the market is that the RBI is now likely to pause its policy easing cycle. The markets yields are
expected to remain volatile in absence of any fresh trigger. The yield on the benchmark 10-yr bond to remain in the range of 7.75-7.80% for now and market shall continue
to for cues from forth coming FOMC and progress of Indian monsoon.
The liquidity in the system is expected to remain orderly and money market rates to remain stable in coming month. This shall allow the short term part of the yield curve
to outperform the long end of the yield curve.

BOI Equity Fund
AXA
An Open Ended Equity Growth FundAll data as on May 31, 2015(Unless indicated otherwise)
E
Q
U
I
T
Y
G
R
O
W
T
H
F
U
N
D
Debt Fund Liquid FundHybrid FundEquity Fund
PORTFOLIO DETAILSPortfolio Holdings Industry/ % to Net
Rating Assets
EQUITY & EQUITY RELATED
Listed / awaiting listing on the stock exchanges
HDFC Bank Ltd Banks 6.63
Infosys Ltd Software 5.10
Larsen & Toubro Ltd Construction Project 4.46
ICICI Bank Ltd Banks 4.20
Axis Bank Ltd Banks 3.36
Tata Motors Ltd DVR Shares Auto 3.09
Tata Consultancy Services Ltd Software 3.06
Sun Pharmaceuticals Industries Ltd Pharmaceuticals 3.00
Housing Development Finance Finance 2.75
Corporation Ltd
Bharat Petroleum Corporation Ltd Petroleum Products 2.72
Maruti Suzuki India Ltd Auto 2.70
Dr. Reddy's Laboratories Ltd Pharmaceuticals 2.69
Indusind Bank Ltd Banks 2.56
State Bank of India Banks 2.36
Finolex Industries Ltd Industrial Products 2.36
IDFC Ltd. Finance 2.31
ITC Ltd Consumer Non Durables 2.20
HCL Technologies Ltd Software 2.08
JK Cement Ltd Cement 2.00
Hindustan Zinc Ltd Non - Ferrous Metals 2.00
Tube Investments of India Ltd Auto Ancillaries 1.96
Raymond Ltd Textile Products 1.91
Manappuram Finance Ltd Finance 1.84
Gujarat State Petronet Ltd Gas 1.82
Wipro Ltd Software 1.52
Hero MotoCorp Ltd Auto 1.51
Bajaj Finserv Ltd Finance 1.51
Yes Bank Ltd Banks 1.49
Tata Communications Ltd Telecom - Services 1.47
Colgate Palmolive (India) Ltd Consumer Non Durables 1.43
Pfizer Ltd Pharmaceuticals 1.33
Pidilite Industries Ltd Chemicals 1.33
Godrej Consumer Products Ltd Consumer Non Durables 1.33
KPIT Technologies Limited Software 1.32
TD Power Systems Ltd Industrial Capital Goods 1.27
Power Grid Corporation of India Ltd Power 1.27
Supreme Infrastructure India Ltd Construction Project 1.18
Tata Chemicals Ltd Chemicals 1.18
EID Parry India Ltd Fertilisers 1.13
Adani Ports and Special Economic Zone Ltd Transportation 1.04
Dish TV India Ltd Media & Entertainment 1.02
Glenmark Pharmaceuticals Ltd Pharmaceuticals 0.96
Century Textiles & Industries Ltd Cement 0.66
Jubilant Foodworks Ltd Consumer Non Durables 0.53
Cummins India Ltd Industrial Products 0.52
Bayer CropScience Ltd Pesticides 0.48
Reliance Industries Ltd Petroleum Products 0.10
Nirvikara Paper Mills Ltd Miscellaneous 0.05
Total 94.81
Cash & Cash Equivalent
Net Receivables/Payables 3.55
CBLO / Reverse Repo Investments 1.64
Total 5.19
GRAND TOTAL 100.00
4
THIS PRODUCT IS SUITABLE FOR INVESTORS WHO ARE SEEKING^:
•Long-term capital growth.
•Investment in equity and equity-related securities including equity derivatives of companies across market capitalisations.
•High risk. (BROWN)
^For details, refer Page 22.
* Total Exposure to illiquid securities is 0.00% of the portfolio, i.e. ̀ 0.00 lakhAll corporate ratings are assigned by rating agencies like CRISIL, CARE, ICRA, India Rating.**Thinly traded/Non traded securities and illiquid securities as defined in SEBI Regulations and Guidelines.
TOP 15 INDUSTRY ALLOCATION
INVESTMENT OBJECTIVE
To generate income and long-term capital appreciation through a diversified portfolio of predominantly equity and equity-related securities including equity derivatives, across all market capitalizations. The Scheme is in the nature of diversified multi-cap fund. The Scheme is not providing any assured or guaranteed returns.
WHO SHOULD INVEST
The fund is suited to investors with some prior experience in equity investing or even for first time equity investors who are aware of the risk associated with investing in equities, particularly with regard to mid and small capitalization companies.
BENCHMARK
CNX Nifty Index
DATE OF ALLOTMENT
October 21, 2008
FUND MANAGER
David Pezarkar (w.e.f August 1, 2013) - Around 20 years of industry experience
MINIMUM APPLICATION AMOUNT (LUMPSUM)
Regular/ Direct Plan ` 5,000 and in multiples of 1
ADDITIONAL PURCHASE AMOUNT
Regular/ Direct Plan 1,000 and in multiples of 1
TOTAL EXPENSE RATIO
2.70% 2.25%2.00%
PORTFOLIO TURNOVER RATIO
# #2.90 Times ( Basis last rolling 12 months)
NAV (As on MAY 29, 2015) NAV (`)
Growth 27.62 Growth 28.38Bonus 27.62 Bonus 28.38Regular Dividend 12.37 Regular Dividend 14.06Quarterly Dividend 10.79 Quarterly Dividend 10.38
Growth 28.25
Regular Dividend 14.12Quarterly Dividend 11.60
LOAD STRUCTURE (FOR ALL PLANS)
NIL
1% if redeemed within 1 year from the date of allotment
For Dividend History please refer page no. 13
`
` `
Bonus 14.70
Regular Plan: Institutional Plan: Direct Plan:
Regular Plan Eco Plan
Direct Plan
Entry Load
Exit Load
INVESTMENT STYLE
Growth Blend Value
Small
Medium
Large
Mar
ket
Cap
ital
isat
ion
1.82%1.91%1.96%2.00%
2.51%2.66%2.82%2.88%
5.49%5.64%
7.31%7.98%8.41%
13.09%20.60%
GasTextile ProductsAuto Ancillaries
Non - Ferrous MetalsChemicals
CementPetroleum ProductsIndustrial Products
Consumer Non DurablesConstruction Project
AutoPharmaceuticals
FinanceSoftware
Banks

INVESTMENT OBJECTIVE
The Scheme seeks to generate long-term capital growth from a diversified portfolio of predominantly equity and equity-related securities across all market capitalisations. The Scheme is in the nature of diversified multi-cap fund. The Scheme is not providing any assured or guaranteed returns. There can be no assurance that the investment objectives of the Scheme will be realized.
WHO SHOULD INVEST
The fund is suitable for investors with a long-term investment horizon. In terms of fund management, the 3 year lock-in period gives the fund manager the comfort of planning his investments with a long-term horizon.
BENCHMARK
CNX Nifty Index
DATE OF ALLOTMENT
February 25, 2009
FUND MANAGER
MINIMUM APPLICATION AMOUNT (LUMPSUM)
Regular/ Direct Plan 500 and in multiples of 1
ADDITIONAL PURCHASE AMOUNT
Regular/ Direct Plan ` 500 and in multiples of 1
TOTAL EXPENSE RATIO
2.25% 2.00%
PORTFOLIO TURNOVER RATIO
# #1.13 Times ( Basis last rolling 12 months)
NAV (`)
Growth 38.43 Growth 39.40Dividend 18.19 Dividend 17.96
Growth 39.56Dividend 20.66
LOAD STRUCTURE (FOR ALL PLANS)
NIL
For Dividend History please refer page no. 13
Saurabh Kataria (w.e.f June 29, 2013): Around 7 years of industry experience.
` `
`
2.70%
NAV (As on MAY 29, 2015)
Regular Plan: Eco Plan: Direct Plan:
Regular Plan Eco Plan
Direct Plan
Entry Load
Exit Load NIL
E
Q
U
I
T
Y
L
I
N
K
E
D
S
A
V
I
N
G
S
C
H
E
M
E
BOI AXATax Advantage FundAn Open-Ended Equity Linked Savings SchemeAll data as on May 31, 2015 (Unless indicated otherwise)
80C Benefit
5
THIS PRODUCT IS SUITABLE FOR INVESTORS WHO ARE SEEKING^:
•Long-term capital growth.
•Investment in equity and equity-related securities of companies across market capitalisations.
•High risk. (BROWN)
* Total Exposure to illiquid securities is 0.00% of the portfolio, i.e. ̀ 0.00 lakh
All corporate ratings are assigned by rating agencies like CRISIL, CARE, ICRA, India Rating.
**Thinly traded/Non traded securities and illiquid securities as defined in SEBI Regulations and Guidelines.
PORTFOLIO DETAILSPortfolio Holdings Industry/ % to Net
Rating Assets
EQUITY & EQUITY RELATED
Listed / awaiting listing on the stock exchanges
ICICI Bank Ltd Banks 5.97
Axis Bank Ltd Banks 3.80
Larsen & Toubro Ltd Construction Project 3.48
Tata Motors Ltd DVR Shares Auto 3.31
Sun Pharmaceuticals Industries Ltd Pharmaceuticals 3.09
Maruti Suzuki India Ltd Auto 2.99
HCL Technologies Ltd Software 2.82
Page Industries Ltd Textile Products 2.72
HDFC Bank Ltd Banks 2.65
Yes Bank Ltd Banks 2.51
Infosys Ltd Software 2.46
Tata Consultancy Services Ltd Software 2.24
Eicher Motors Ltd Auto 2.20
Indusind Bank Ltd Banks 2.16
United Spirits Ltd Consumer Non Durables 2.12
Motherson Sumi Systems Ltd Auto Ancillaries 1.92
Glenmark Pharmaceuticals Ltd Pharmaceuticals 1.87
Cummins India Ltd Industrial Products 1.86
Ashoka Buildcon Ltd Construction Project 1.80
IDFC Ltd. Finance 1.70
State Bank of India Banks 1.69
Ramkrishna Forgings Ltd Industrial Products 1.66
Aarti Industries Ltd Chemicals 1.59
Grindwell Norton Ltd Industrial Products 1.56
Kaveri Seed Company Ltd Consumer Non Durables 1.55
Gujarat State Petronet Ltd Gas 1.55
Alstom T&D India Ltd Industrial Capital Goods 1.54
Shriram Transport Finance Company Ltd Finance 1.50
Pidilite Industries Ltd Chemicals 1.47
DCB Bank Ltd Banks 1.45
Gabriel India Ltd Auto Ancillaries 1.43
Housing Development Finance Finance 1.36
Corporation Ltd
Jyothy Laboratories Ltd Consumer Non Durables 1.34
Dish TV India Ltd Media & Entertainment 1.30
Wipro Ltd Software 1.28
Texmaco Rail & Engineering Ltd Industrial Capital Goods 1.27
Adani Ports and Special Economic Zone Ltd Transportation 1.25
Jubilant Foodworks Ltd Consumer Non Durables 1.24
Manappuram Finance Ltd Finance 1.22
Sundaram Finance Ltd Finance 1.21
Multi Commodity Exchange of India Ltd Finance 1.13
Atul Ltd Chemicals 1.10
Dr. Reddy's Laboratories Ltd Pharmaceuticals 1.05
Bajaj Finance Ltd Finance 1.04
ITC Ltd Consumer Non Durables 0.87
Brigade Enterprises Ltd Construction 0.86
KPIT Technologies Limited Software 0.82
Igarshi Motors India Ltd Auto Ancillaries 0.76
Bharti Infratel Limited Telecom - Equipment & 0.67
Accessories
Havells India Ltd Consumer Durables 0.54
Total 90.94
Cash & Cash Equivalent
Net Receivables/Payables 3.71
CBLO / Reverse Repo Investments 5.35
Total 9.06
GRAND TOTAL 100.00
TOP 15 INDUSTRY ALLOCATION
Debt Fund Liquid FundHybrid FundEquity FundINVESTMENT STYLE
Growth Blend Value
Small
Medium
Large
Mar
ket
Cap
ital
isat
ion
^For details, refer Page 22.
1.25%1.30%1.55%
2.72%2.81%
4.11%4.15%
5.07%5.28%
6.00%7.12%
8.50%9.15%9.62%
20.22%
TransportationMedia & Entertainment
GasTextile Products
Industrial Capital GoodsAuto Ancillaries
ChemicalsIndustrial Products
Construction ProjectPharmaceuticals
Consumer Non DurablesAuto
FinanceSoftware
Banks
An Open Ended Equity SchemeAll data as on May 31, 2015 (Unless indicated otherwise)
BOI Focused Infrastructure Fund
AXA
E
Q
U
I
T
Y
S
E
C
T
O
R
S
C
H
E
M
E
* Total Exposure to illiquid securities is 0.00% of the portfolio, i.e. ̀ 0.00 lakh
INVESTMENT OBJECTIVE
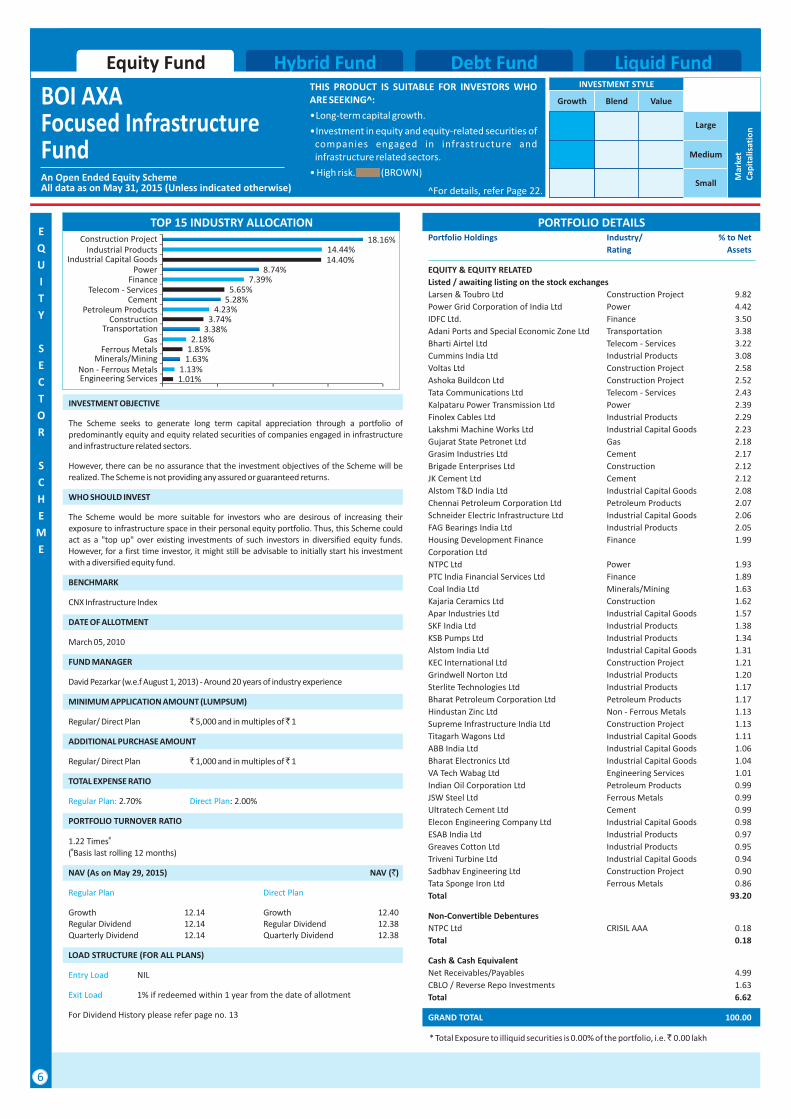
The Scheme seeks to generate long term capital appreciation through a portfolio of predominantly equity and equity related securities of companies engaged in infrastructure and infrastructure related sectors.
However, there can be no assurance that the investment objectives of the Scheme will be realized. The Scheme is not providing any assured or guaranteed returns.
WHO SHOULD INVEST
The Scheme would be more suitable for investors who are desirous of increasing their exposure to infrastructure space in their personal equity portfolio. Thus, this Scheme could act as a "top up" over existing investments of such investors in diversified equity funds. However, for a first time investor, it might still be advisable to initially start his investment with a diversified equity fund.
BENCHMARK
CNX Infrastructure Index
DATE OF ALLOTMENT
March 05, 2010
FUND MANAGER
MINIMUM APPLICATION AMOUNT (LUMPSUM)
Regular/ Direct Plan ` 5,000 and in multiples of 1
ADDITIONAL PURCHASE AMOUNT
Regular/ Direct Plan 1,000 and in multiples of 1
TOTAL EXPENSE RATIO
2.70%
PORTFOLIO TURNOVER RATIO
#1.22 Times#( Basis last rolling 12 months)
NAV (`)
Growth 12.14 Growth 12.40Regular Dividend Regular Dividend 12.38 Quarterly Dividend Quarterly Dividend 12.38
LOAD STRUCTURE (FOR ALL PLANS)
NIL
1% if redeemed within 1 year from the date of allotment
For Dividend History please refer page no. 13
David Pezarkar (w.e.f August 1, 2013) - Around 20 years of industry experience
`
` `
: 2.00%
NAV (As on May 29, 2015)
12.1412.14
Regular Plan: Direct Plan
Regular Plan Direct Plan
Entry Load
Exit Load
PORTFOLIO DETAILSPortfolio Holdings Industry/ % to Net
Rating Assets
EQUITY & EQUITY RELATED
Listed / awaiting listing on the stock exchanges
Larsen & Toubro Ltd Construction Project 9.82
Power Grid Corporation of India Ltd Power 4.42
IDFC Ltd. Finance 3.50
Adani Ports and Special Economic Zone Ltd Transportation 3.38
Bharti Airtel Ltd Telecom - Services 3.22
Cummins India Ltd Industrial Products 3.08
Voltas Ltd Construction Project 2.58
Ashoka Buildcon Ltd Construction Project 2.52
Tata Communications Ltd Telecom - Services 2.43
Kalpataru Power Transmission Ltd Power 2.39
Finolex Cables Ltd Industrial Products 2.29
Lakshmi Machine Works Ltd Industrial Capital Goods 2.23
Gujarat State Petronet Ltd Gas 2.18
Grasim Industries Ltd Cement 2.17
Brigade Enterprises Ltd Construction 2.12
JK Cement Ltd Cement 2.12
Alstom T&D India Ltd Industrial Capital Goods 2.08
Chennai Petroleum Corporation Ltd Petroleum Products 2.07
Schneider Electric Infrastructure Ltd Industrial Capital Goods 2.06
FAG Bearings India Ltd Industrial Products 2.05
Housing Development Finance Finance 1.99
Corporation Ltd
NTPC Ltd Power 1.93
PTC India Financial Services Ltd Finance 1.89
Coal India Ltd Minerals/Mining 1.63
Kajaria Ceramics Ltd Construction 1.62
Apar Industries Ltd Industrial Capital Goods 1.57
SKF India Ltd Industrial Products 1.38
KSB Pumps Ltd Industrial Products 1.34
Alstom India Ltd Industrial Capital Goods 1.31
KEC International Ltd Construction Project 1.21
Grindwell Norton Ltd Industrial Products 1.20
Sterlite Technologies Ltd Industrial Products 1.17
Bharat Petroleum Corporation Ltd Petroleum Products 1.17
Hindustan Zinc Ltd Non - Ferrous Metals 1.13
Supreme Infrastructure India Ltd Construction Project 1.13
Titagarh Wagons Ltd Industrial Capital Goods 1.11
ABB India Ltd Industrial Capital Goods 1.06
Bharat Electronics Ltd Industrial Capital Goods 1.04
VA Tech Wabag Ltd Engineering Services 1.01
Indian Oil Corporation Ltd Petroleum Products 0.99
JSW Steel Ltd Ferrous Metals 0.99
Ultratech Cement Ltd Cement 0.99
Elecon Engineering Company Ltd Industrial Capital Goods 0.98
ESAB India Ltd Industrial Products 0.97
Greaves Cotton Ltd Industrial Products 0.95
Triveni Turbine Ltd Industrial Capital Goods 0.94
Sadbhav Engineering Ltd Construction Project 0.90
Tata Sponge Iron Ltd Ferrous Metals 0.86
Total 93.20
Non-Convertible Debentures
NTPC Ltd CRISIL AAA 0.18
Total 0.18
Cash & Cash Equivalent
Net Receivables/Payables 4.99
CBLO / Reverse Repo Investments 1.63
Total 6.62
GRAND TOTAL 100.00
THIS PRODUCT IS SUITABLE FOR INVESTORS WHO ARE SEEKING^:
•Long-term capital growth.
•Investment in equity and equity-related securities of companies engaged in infrastructure and infrastructure related sectors.
• High risk. (BROWN)
6
TOP 15 INDUSTRY ALLOCATION
Debt Fund Liquid FundHybrid FundEquity FundINVESTMENT STYLE
Growth Blend Value
Small
Medium
Large
Mar
ket
Cap
ital
isat
ion
^For details, refer Page 22.
1.01%1.13%
1.63%1.85%2.18%
3.38%3.74%
4.23%5.28%
5.65%7.39%
8.74%14.40%14.44%
18.16%
Engineering ServicesNon - Ferrous Metals
Minerals/MiningFerrous Metals
GasTransportation
ConstructionPetroleum Products
CementTelecom - Services
FinancePower
Industrial Capital GoodsIndustrial Products
Construction Project

INVESTMENT OBJECTIVE
The Scheme aims at generating long term returns with lower volatility by following a disciplined allocation between equity and debt securities. The equity allocation will be determined based on the month end P/E ratio of the CNX Nifty Index. There is no assurance that the investment objectives of the Scheme will be realized and the Scheme does not assure or guarantee any returns.
BENCHMARK
CNX Nifty (50%) & CRISIL Short Term Bond Fund Index
DATE OF ALLOTMENT
March 14, 2014
FUND MANAGER
Piyush Baranwal (For Debt): Managing this fund since 11th July, 2014. Over 6 years’ experience in Portfolio Management and trading in Fixed Income securities.
Saurabh Kataria (for Equity): Managing this fund since September 11, 2014. Around 7 years of industry experience.
MINIMUM APPLICATION AMOUNT (LUMPSUM)
Regular/ Direct Plan ` 5,000 and in multiples of ̀ 1
ADDITIONAL PURCHASE AMOUNT
Regular/ Direct Plan ` 1,000 and in multiples of ̀ 1
TOTAL EXPENSE RATIO
2.25% 2.00%
AVERAGE MATURITY & MODIFIED DURATION
Average Maturity - 3.19 YearsModified Duration - 2.27
NAV (`)
Growth 12.3759Dividend 11.0276
LOAD STRUCTURE (FOR ALL PLANS)
NIL
1% if redeemed within 1 year from the date of allotment
(50%)
NAV (As on MAY 29, 2015)
Growth 12.4275Dividend 12.1688
For Dividend History please refer page no. 13
Regular Plan:Direct Plan:
Regular Plan Direct Plan
Entry Load
Exit Load
BOI Equity Debt Rebalancer Fund
AXA
Equity Fund Debt Fund Liquid FundEquity Fund Hybrid Fund
H
Y
B
R
I
D
S
C
H
E
M
E
An Open Ended Dynamic FundAll data as on May 31, 2015 (Unless indicated otherwise)
THIS PRODUCT IS SUITABLE FOR INVESTORS WHO ARE SEEKING^:
•Long term capital appreciation
•Dynamic asset allocation between equity and fixed income based on equity market valuations
• High risk. (BROWN)
7
* Total Exposure to illiquid securities is 0.00% of the portfolio, i.e. ̀ 0.00 lakhAll corporate ratings are assigned by rating agencies like CRISIL, CARE, ICRA, India Rating.**Thinly traded/Non traded securities and illiquid securities as defined in SEBI Regulations and Guidelines.
PORTFOLIO DETAILS
COMPOSITION BY ASSETSEQUITY INDUSTRY ALLOCATION
INVESTMENT STYLE
Growth Blend Value
Small
Medium
Large
Mar
ket
Cap
ital
isat
ion
34.41%
17.68%
27.49%
Portfolio Holdings Industry/ % to Net Rating Assets
Portfolio Holdings Industry/ % to Net Rating Assets
EQUITY & EQUITY RELATEDListed / awaiting listing on the stock exchangesICICI Bank Ltd Banks 2.07HDFC Bank Ltd Banks 1.71HCL Technologies Ltd Software 1.07Axis Bank Ltd Banks 1.05Housing Development Finance Corporation Ltd Finance 1.05Maruti Suzuki India Ltd Auto 1.02Infosys Ltd Software 0.97IDFC Ltd. Finance 0.96Yes Bank Ltd Banks 0.96Sun Pharmaceuticals Industries Ltd Pharmaceuticals 0.95Eicher Motors Ltd Auto 0.91United Spirits Ltd Consumer Non Durables 0.90Glenmark Pharmaceuticals Ltd Pharmaceuticals 0.89Tata Consultancy Services Ltd Software 0.87Motherson Sumi Systems Ltd Auto Ancillaries 0.86Tata Motors Ltd DVR Shares Auto 0.84Indusind Bank Ltd Banks 0.84Asian Paints Ltd Consumer Non Durables 0.83Bosch Ltd Auto Ancillaries 0.81Larsen & Toubro Ltd Construction Project 0.80Adani Ports and Special Economic Zone Ltd Transportation 0.80Shriram Transport Finance Company Ltd Finance 0.78Britannia Industries Ltd Consumer Non Durables 0.77Cummins India Ltd Industrial Products 0.69Cipla Ltd Pharmaceuticals 0.61Pidilite Industries Ltd Chemicals 0.53Divi's Laboratories Ltd Pharmaceuticals 0.51Mahindra & Mahindra Ltd Auto 0.48State Bank of India Banks 0.47Wipro Ltd Software 0.45Tata Motors Ltd Auto 0.39Bharti Infratel Limited Telecom - Equipment & 0.38
AccessoriesITC Ltd Consumer Non Durables 0.25Total 27.49
BONDS & NCDsListed / awaiting listing on the stock exchangesEnzen Global Solutions Pvt Ltd CRISIL A- 9.57Shriram Transport Finance Company Ltd CRISIL AA 8.15SREI Equipment Finance Ltd CARE AA 6.24India Infoline Finance Ltd CARE AA 4.59Rural Electrification Corporation Ltd CRISIL AAA 2.50IDFC Ltd. ICRA AAA 2.49Power Grid Corporation of India Ltd CRISIL AAA 0.63India Infoline Finance Ltd ICRA AA 0.25Total 34.41
CENTRAL GOVERNMENT SECURITIESGovernment of India SOV 17.68Total 17.68
Cash & Cash EquivalentNet Receivables/Payables 10.30CBLO / Reverse Repo Investments 10.13Total 20.42
GRAND TOTAL 100.00
^For details, refer Page 22.
Cash & Cash EquivalentSovereignEquity & equity related securities Bonds & NCDs
20.42%
0.38%0.53%0.69%0.80%0.80%
1.67%2.75%2.79%2.96%
3.36%3.64%
7.11%
Telecom - Equipment & AccessoriesChemicals
Industrial ProductsTransportation
Construction ProjectAuto Ancillaries
Consumer Non DurablesFinance
PharmaceuticalsSoftware
AutoBanks

INVESTMENT OBJECTIVE
The Scheme seeks to generate regular income through investments in fixed income securities
and also to generate long term capital appreciation by investing a portion in equity and
equity related instruments. However, there can be no assurance that the income can be
generated, regular or otherwise, or the investment objectives of the Scheme will be realized.
BENCHMARK
CRISIL MIP Blended Index
DATE OF ALLOTMENT
March 18, 2009
FUND MANAGER
Alok Singh : Managing this fund since May 2012. Around 14 years of experience, including
9 years in mutual fund industry.
MINIMUM APPLICATION AMOUNT (LUMPSUM)
Regular/ Direct Plan ` 10,000 and in multiples of ̀ 1
ADDITIONAL PURCHASE AMOUNT
Regular/ Direct Plan ` 1,000 and in multiples of ̀ 1
TOTAL EXPENSE RATIO
2.00% 2.00%
1.75%
AVERAGE MATURITY & MODIFIED DURATION
Average Maturity - 4.44 Years
Modified Duration - 2.97
NAV (`)
Growth 16.3898
12.6218
11.3552
10.7911
Growth 16.5054
10.9065
11.3752
-
LOAD STRUCTURE (FOR ALL PLANS)
NIL
1% if redeemed within 1 year from the date of allotment
For Dividend History please refer page no. 13
Regular Plan: Eco Plan:
Direct Plan:
Regular Plan Eco Plan
Direct Plan
Entry Load
Exit Load
NAV (As on MAY 29, 2015)
Growth 16.5569
Monthly Dividend Monthly Dividend 15.2887
Quarterly Dividend Quarterly Dividend 10.5824
Annual Dividend Annual Dividend -
Monthly Dividend
Quarterly Dividend
Annual Dividend
An Open Ended Income SchemeAll data as on May 31, 2015(Unless indicated otherwise)
BOI Regular Return Fund
AXA
Equity Fund Debt Fund Liquid FundEquity Fund Hybrid Fund
PORTFOLIO DETAILS
H
Y
B
R
I
D
S
C
H
E
M
E
Portfolio Holdings Industry/ % to Net Rating Assets
Portfolio Holdings Industry/ % to Net Rating Assets
EQUITY & EQUITY RELATEDListed / awaiting listing on the stock exchangesSun Pharmaceuticals Industries Ltd Pharmaceuticals 1.43Reliance Industries Ltd Petroleum Products 0.94Eicher Motors Ltd Auto 0.92Power Grid Corporation of India Ltd Power 0.88Asian Paints Ltd Consumer Non Durables 0.86Infosys Ltd Software 0.74HCL Technologies Ltd Software 0.74ICICI Bank Ltd Banks 0.73Bank of Baroda Banks 0.67United Spirits Ltd Consumer Non Durables 0.66Mahindra & Mahindra Ltd Auto 0.61Tata Motors Ltd DVR Shares Auto 0.54Shriram Transport Finance Company Ltd Finance 0.40NTPC Ltd Power 0.37Sadbhav Engineering Ltd Construction Project 0.35Hindalco Industries Ltd Non - Ferrous Metals 0.31ACC Ltd Cement 0.31Bharat Heavy Electricals Ltd Industrial Capital Goods 0.31VRL Logistic Ltd Transportation 0.28IDFC Ltd. Finance 0.28Bajaj Auto Ltd Auto 0.28Maruti Suzuki India Ltd Auto 0.28Biocon Ltd Pharmaceuticals 0.27Emami Ltd Consumer Non Durables 0.27NMDC Ltd Minerals/Mining 0.26Hindustan Zinc Ltd Non - Ferrous Metals 0.25Lupin Ltd Pharmaceuticals 0.25Oil & Natural Gas Corporation Ltd Oil 0.24Motherson Sumi Systems Ltd Auto Ancillaries 0.24Container Corporation of India Ltd Transportation 0.22Indusind Bank Ltd Banks 0.21Coal India Ltd Minerals/Mining 0.21State Bank of India Banks 0.20ITC Ltd Consumer Non Durables 0.20Mahindra & Mahindra Financial Services Ltd Finance 0.16Total 15.89
BONDS & NCDsListed / awaiting listing on the stock exchangesIndia Infoline Finance Ltd CARE AA 5.88Enzen Global Solutions Pvt Ltd CRISIL A- 5.85Shriram Transport Finance Company Ltd CRISIL AA 5.54Rural Electrification Corporation Ltd CRISIL AAA 2.21Power Grid Corporation of India Ltd CRISIL AAA 0.61NTPC Ltd CRISIL AAA 0.03Total 20.12
CENTRAL GOVERNMENT SECURITIESGovernment of India SOV 36.44Total 36.44
Cash & Cash EquivalentNet Receivables/Payables 10.32CBLO / Reverse Repo Investments 17.22Total 27.54
GRAND TOTAL 100.00
THIS PRODUCT IS SUITABLE FOR INVESTORS WHO ARE SEEKING^:
• Long term capital appreciation and regular income.
• Investment in equity and equity related securities (upto 20%) as well as fixed income securities (Debt / Money Market Instruments / Govt. Securities).
• Medium risk. (YELLOW)
8
* Total Exposure to illiquid securities is 0.00% of the portfolio, i.e. ̀ 0.00 lakhAll corporate ratings are assigned by rating agencies like CRISIL, CARE, ICRA, India Rating.**Thinly traded/Non traded securities and illiquid securities as defined in SEBI Regulations and Guidelines.
EQUITY INDUSTRY ALLOCATION COMPOSITION BY ASSETS
15.89%
20.12%
27.54%
INVESTMENT STYLE
Growth Blend Value
Small
Medium
Large
Mar
ket
Cap
ital
isat
ion
SovereignEquity & equity related securities
36.44%
^For details, refer Page 22.
Cash & Cash EquivalentBonds & NCDs
0.24%0.24%
0.31%0.31%0.35%
0.47%0.51%
0.56%0.85%
0.94%1.25%
1.48%1.82%
1.95%2.00%
2.63%
Auto AncillariesOil
Industrial Capital GoodsCement
Construction ProjectMinerals/Mining
TransportationNon - Ferrous Metals
FinancePetroleum Products
PowerSoftware
BanksPharmaceuticals
Consumer Non DurablesAuto

10
COMPOSITION BY ASSETS
BOI Corporate CreditSpectrum Fund
AXA Equity Fund Debt Fund Liquid FundHybrid FundEquity Fund
D
E
B
T
S
C
H
E
M
E
PORTFOLIO DETAILS
All corporate ratings are assigned by rating agencies like CRISIL, CARE, ICRA, India Rating.
**Thinly traded/Non traded securities and illiquid securities as defined in SEBI Regulations and Guidelines.
Portfolio Holdings Industry/ % to Net
Rating Assets
BONDS & NCDs
Listed / awaiting listing on the stock exchanges
Enzen Global Solutions Pvt Ltd CRISIL A- 18.73
Bacchus Hospitality Services & Real Estate Pvt Ltd BWR A (SO) 15.38
IDFC Ltd. ICRA AAA 12.69
National Bank For Agriculture and Rural Development CRISIL AAA 10.14
Vijaya Bank CARE AA+ 5.57
Steel Authority of India Ltd CARE AAA 2.58
Power Grid Corporation of India Ltd CRISIL AAA 2.52
Total 67.60
MONEY MARKET INSTRUMENTS
Certificate of Deposit**
Punjab & Sind Bank ICRA A1+ 5.04
Oriental Bank of Commerce CRISIL A1+ 3.03
Total 8.07
Cash & Cash Equivalent
Net Receivables/Payables 1.87
CBLO / Reverse Repo Investments 22.46
Total 24.33
GRAND TOTAL 100.00
CREDIT PROFILE
CREDIT QUALITY
High Medium Low
Low
Medium
High
Inte
rest
Rat
eSe
nsi
tivi
ty
An Open Ended Debt SchemeAll data as on May 31, 2015 (Unless indicated otherwise)
Cash & Cash EquivalentBonds & NCDs Certificate of Deposit
^For details, refer Page 22.
24.33%
67.60%8.07%
THIS PRODUCT IS SUITABLE FOR INVESTORS WHO ARE SEEKING^:
• Long term capital appreciation
• Investment primarily in corporate debt securities with medium to long term maturities across the credit spectrum within the universe of investment grade rating.
• Medium risk. (YELLOW)
8.07%
5.57%
18.73%
27.93%
24.33%
A1+ Cash & Cash EquivalentA (SO) AAAAA+ A-
15.38%
9
INVESTMENT OBJECTIVE
The Scheme’s investment objective is to generate capital appreciation over the long term by investing predominantly in corporate debt across the credit spectrum within the universe of investment grade rating. To achieve this objective, the Scheme will seek to make investments in rated, unrated instruments and structured obligations of public and private companies.
BENCHMARK
CRISIL Composite Bond Fund Index
DATE OF ALLOTMENT
February 27, 2015
FUND MANAGER
Alok Singh : Managing this fund since February 2015. Around 14 years of experience, including 9 years in mutual fund industry
MINIMUM APPLICATION AMOUNT (LUMPSUM)
Regular/ Direct Plan ` 5,000 and in multiples of ̀ 5,000
TOTAL EXPENSE RATIO
1.85% 1.75%
AVERAGE MATURITY & MODIFIED DURATION
Average Maturity - 2.12 YearsModified Duration - 1.68
NAV (As on MAY 29, 2015) NAV (`)
LOAD STRUCTURE (FOR ALL PLANS)
NIL
• 4% if redeemed within 12 months from the date of allotment
• 3% if redeemed after 12 months but within 24 months from the date of allotment
• 2% if redeemed after 24 months but within 36 months from the date of allotment
• Nil if redeemed after 36 months from the date of allotment
For Dividend History please refer page no. 13
ADDITIONAL PURCHASE AMOUNT
Regular/ Direct Plan ` 5,000 and in multiples of ̀ 5,000
10.1800 10.1831
Regular Plan: Direct Plan:
Regular Plan: Direct Plan:
Entry Load
Exit Load

Duration % of Assets
Upto 3 months 44.26
4 months to 6 months 0
7 months to 1 year 0
> 1 year 55.74
An Open Ended Income SchemeAll data as on May 31, 2015(Unless indicated otherwise)
BOI Short TermIncome Fund
AXA Equity Fund Hybrid Fund Liquid FundDebt Fund Liquid FundHybrid FundEquity Fund
I
N
C
O
M
E
S
C
H
E
M
E
INVESTMENT OBJECTIVE
The Scheme seeks to generate income and capital appreciation by investing in a diversified
portfolio of debt and money market securities. However, there can be no assurance that the
income can be generated, regular or otherwise, or the investment objectives of the Scheme
will be realized. The Scheme is not providing any assured or guaranteed returns.
BENCHMARK
CRISIL Short Term Bond Fund Index
DATE OF ALLOTMENT
December 18, 2008
FUND MANAGER
Alok Singh : Managing this fund since May 2014. Around 14 years of experience, including
9 years in mutual fund industry.
MINIMUM APPLICATION AMOUNT (LUMPSUM)
Regular/ Direct Plan ` 5,000 and in multiples of ̀ 1
ADDITIONAL PURCHASE AMOUNT
Regular/ Direct Plan ` 1,000 and in multiples of ̀ 1
TOTAL EXPENSE RATIO
1.25% 0.60%
0.40%
AVERAGE MATURITY & MODIFIED DURATION
Average Maturity - 2.87 Years
Modified Duration - 2.04
NAV (`)
Growth 15.2008
Monthly Dividend 10.5479
Quarterly Dividend 10.2084
LOAD STRUCTURE (FOR ALL PLANS)
NIL
1% if redeemed within 6 months from date of allotment
For Dividend History please refer page no. 13
Regular Plan: Institutional Plan:
Direct Plan:
Regular Plan Direct Plan
Entry Load
Exit Load
NAV (As on MAY 29, 2015)
Growth 15.5483
Monthly Dividend 10.1141
Quarterly Dividend -
PORTFOLIO DETAILS
All corporate ratings are assigned by rating agencies like CRISIL, CARE, ICRA, India Rating.
**Thinly traded/Non traded securities and illiquid securities as defined in SEBI Regulations and Guidelines.
# The assigned rating AAAmfs is valid only for “BOI AXA Short Term Income Fund”. The rating of CRISIL is not an opinion of the Asset Management Company’s willingness or ability to make timely payments to the investor. The rating is also not an opinion on the stability of the NAV of the Fund, which could vary with market developments.
The rating indicates that the funds' portfolios will provide 'very strong' protection against losses from credit default. CRISIL's assessment of a rated fund's credit quality is based on the creditworthiness of the fund's portfolio. CRISIL reserves the right to suspend, withdraw or revise the ratings assigned to the scheme at any time on the basis of new information, or unavailability of information or other circumstances, which CRISIL believes, may have an impact on the rating. For detail methodology, please visit CRISIL's website www.crisil.com. Past performance is no guarantee of the future results.
Portfolio Holdings Industry/ % to Net
Rating Assets
BONDS & NCDs
Listed / awaiting listing on the stock exchanges
Enzen Global Solutions Pvt Ltd CRISIL A- 9.25
IDFC Ltd. ICRA AAA 9.25
Rural Electrification Corporation Ltd CRISIL AAA 6.52
Shriram Transport Finance Company Ltd CRISIL AA 3.89
Dewan Housing Finance Corporation Ltd CARE AAA 3.70
India Infoline Finance Ltd CARE AA 0.95
Total 33.57
MONEY MARKET INSTRUMENTS
Certificate of Deposit**
Punjab & Sind Bank ICRA A1+ 15.35
Oriental Bank of Commerce CRISIL A1+ 9.21
Total 24.56
CENTRAL GOVERNMENT SECURITIES
Government of India SOV 20.58
Total 20.58
Cash & Cash Equivalent
Net Receivables/Payables 6.91
CBLO / Reverse Repo Investments 14.38
Total 21.29
GRAND TOTAL 100.00
THIS PRODUCT IS SUITABLE FOR INVESTORS WHO ARE SEEKING^:
• Regular income over short to medium term.
• Investment in Debt/ Money Market Instruments/ Govt. Securities with portfolio average maturity not exceeding 5 years.
• Low risk. (BLUE)
10
CREDIT QUALITY
High Medium Low
Low
Medium
High
Inte
rest
Rat
eSe
nsi
tivi
ty
A1+
^For details, refer Page 22.
COMPOSITION BY ASSETS
AAA SovereignA- Cash & Cash EquivalentAA
CREDIT PROFILE
21.29% 24.56%
9.25%
4.84%20.58%
19.48%

COMPOSITION BY ASSETS
BOI TreasuryAdvantage Fund
AXA Equity Fund Debt Fund Liquid FundHybrid FundEquity Fund
I
N
C
O
M
E
S
C
H
E
M
E
THIS PRODUCT IS SUITABLE FOR INVESTORS WHO ARE SEEKING^:
• Regular income over short term.
• Investment in Debt and Money Market Instruments
• Low risk. (BLUE)
11
PORTFOLIO DETAILSINVESTMENT OBJECTIVE
The Scheme seeks to deliver reasonable market related returns with lower risk and higher liquidity through portfolio of debt and money market instruments. The Scheme is not providing any assured or guaranteed returns.
BENCHMARK
CRISIL Liquid Fund Index
DATE OF ALLOTMENT
July 16, 2008
FUND MANAGER
Alok Singh : Managing this fund since May 2014. Around 14 years of experience, including 9 years in mutual fund industry
Piyush Baranwal (Co-Fund Manager): Managing this fund since 11th July, 2014. Over 6 years’ experience in Portfolio Management and trading in Fixed Income securities.
MINIMUM APPLICATION AMOUNT (LUMPSUM)
Regular/ Direct Plan ` 5,000 and in multiples of ̀ 1
ADDITIONAL PURCHASE AMOUNT
Regular/ Direct Plan ` 1,000 and in multiples of ̀ 1
TOTAL EXPENSE RATIO
0.50% 0.50%
0.35%
AVERAGE MATURITY & MODIFIED DURATION
Average Maturity - 0.23 YearsModified Duration - 0.2
NAV (`)
Growth 1,666.9560
Daily Dividend 1,002.9232Weekly Dividend 1,005.8094
LOAD STRUCTURE (FOR ALL PLANS)
NIL
NIL
For Dividend History please refer page no. 13
Regular Plan: Institutional Plan:
Direct Plan:
Regular Plan Direct Plan
Entry Load
Exit Load
NAV (As on MAY 29, 2015)
Growth 1,678.1623Bonus - Bonus 1,677.6126
Daily Dividend 1,002.9232Weekly Dividend 1,005.8763 All corporate ratings are assigned by rating agencies like CRISIL, CARE, ICRA, India Rating.
**Thinly traded/Non traded securities and illiquid securities as defined in SEBI Regulations and Guidelines.
# The assigned rating AAAmfs is valid only for “BOI AXA Treasury Advantage Fund”. The rating of CRISIL is not an opinion of the Asset Management Company’s willingness or ability to make timely payments to the investor. The rating is also not an opinion on the stability of the NAV of the Fund, which could vary with market developments.
The rating indicates that the funds' portfolios will provide 'very strong' protection against losses from credit default. CRISIL's assessment of a rated fund's credit quality is based on the creditworthiness of the fund's portfolio. CRISIL reserves the right to suspend, withdraw or revise the ratings assigned to the scheme at any time on the basis of new information, or unavailability of information or other circumstances, which CRISIL believes, may have an impact on the rating. For detail methodology, please visit CRISIL's website www.crisil.com. Past performance is no guarantee of the future results.
Portfolio Holdings Industry/ % to Net
Rating Assets
BONDS & NCDs
Listed / awaiting listing on the stock exchanges
India Infoline Finance Ltd CARE AA 4.15
Dewan Housing Finance Corporation Ltd CARE AAA 4.07
IDFC Ltd. ICRA AAA 2.31
India Infoline Finance Ltd ICRA AA 1.08
Total 11.62
MONEY MARKET INSTRUMENTS
Certificate of Deposit**
Oriental Bank of Commerce CRISIL A1+ 7.37
Punjab & Sind Bank ICRA A1+ 6.89
RBL Bank Limited ICRA A1+ 6.84
ING Vysya Bank Ltd CRISIL A1+ 4.49
Total 25.60
Commercial Paper**
Reliance Capital Ltd CARE A1+ 22.98
National Fertilizers Ltd CRISIL A1+ 11.52
Jindal Steel & Power Ltd CRISIL A1+ 11.38
Shapoorji Pallonji and Company Private Ltd ICRA A1+ 11.27
National Fertilizers Ltd CRISIL A1+ 2.30
Bilt Graphic Paper Products Ltd FITCH A1+ 2.28
Total 61.72
Cash & Cash Equivalent
Net Receivables/Payables 0.04
CBLO / Reverse Repo Investments 1.02
Total 1.06
GRAND TOTAL 100.00
CREDIT PROFILE
CREDIT QUALITY
High Medium Low
Low
Medium
High
Inte
rest
Rat
eSe
nsi
tivi
ty
An Open Ended Income SchemeAll data as on May 31, 2015 (Unless indicated otherwise)
Cash & Cash EquivalentCommercial PaperBonds & NCDs Certificate of Deposit
^For details, refer Page 22.
AAAA1+ Cash & Cash EquivalentAA
1.06%
87.32%
5.24%
6.38% 11.62%
25.60%
61.72%
1.06%
An Open Ended Liquid SchemeAll data as on May 31, 2015(Unless indicated otherwise)
BOI Liquid Fund
AXA
Debt FundHybrid FundEquity Fund Liquid Fund
L
I
Q
U
I
D
S
C
H
E
M
E
THIS PRODUCT IS SUITABLE FOR INVESTORS WHO ARE SEEKING^:
• Income over short term.
• Investment in Debt and Money Market Instruments.
• Low risk. (BLUE)
All corporate ratings are assigned by rating agencies like CRISIL, CARE, ICRA, India Rating.**Thinly traded/Non traded securities and illiquid securities as defined in SEBI Regulations and Guidelines.
# Disclaimer for CRISIL AAAmfs: The assigned rating AAAmfs is valid only for “BOI AXA Liquid Fund”. The rating of CRISIL is not an opinion of the Asset Management Company’s willingness or ability to make timely payments to the investor. The rating is also not an opinion on the stability of the NAV of the Fund, which could vary with market developments.The rating indicates that the funds' portfolios will provide 'very strong' protection against losses from credit default. CRISIL's assessment of a rated fund's credit quality is based on the creditworthiness of the fund's portfolio. CRISIL reserves the right to suspend, withdraw or revise the ratings assigned to the scheme at any time on the basis of new information, or unavailability of information or other circumstances, which CRISIL believes, may have an impact on the rating. For detail methodology, please visit CRISIL's website www.crisil.com. Past performance is no guarantee of the future results.$Disclaimer for ICRA AAAmfs: Schemes with this rating are considered to have the highest degree of safety regarding timely receipt of payments from the investments that they have made. This rating should however, not be construed as an indication of the performance of the Mutual Fund scheme or of volatility in its returns. The rating should not be treated as a recommendation to buy, sell or hold units issued by the Mutual Fund.
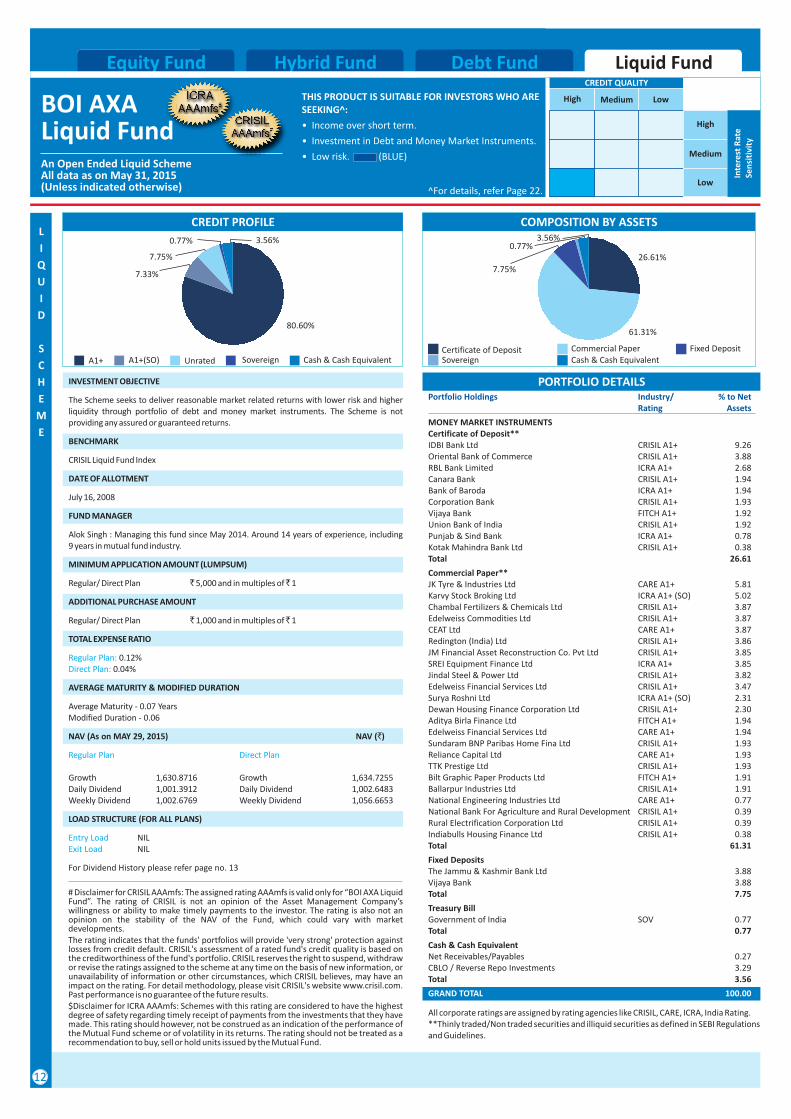
INVESTMENT OBJECTIVE
The Scheme seeks to deliver reasonable market related returns with lower risk and higher liquidity through portfolio of debt and money market instruments. The Scheme is not providing any assured or guaranteed returns.
BENCHMARK
CRISIL Liquid Fund Index
DATE OF ALLOTMENT
July 16, 2008
FUND MANAGER
Alok Singh : Managing this fund since May 2014. Around 14 years of experience, including 9 years in mutual fund industry.
MINIMUM APPLICATION AMOUNT (LUMPSUM)
Regular/ Direct Plan ` 5,000 and in multiples of ̀ 1
ADDITIONAL PURCHASE AMOUNT
Regular/ Direct Plan ` 1,000 and in multiples of ̀ 1
TOTAL EXPENSE RATIO
0.12% 0.04%
AVERAGE MATURITY & MODIFIED DURATION
Average Maturity - 0.07 YearsModified Duration - 0.06
NAV (`)
LOAD STRUCTURE (FOR ALL PLANS)
NILNIL
For Dividend History please refer page no. 13
Regular Plan:Direct Plan:
Regular Plan Direct Plan
Entry LoadExit Load
NAV (As on MAY 29, 2015)
Growth 1,630.8716 Growth 1,634.7255Daily Dividend 1,001.3912 Daily Dividend 1,002.6483Weekly Dividend 1,002.6769 Weekly Dividend 1,056.6653
PORTFOLIO DETAILSPortfolio Holdings Industry/ % to Net
Rating Assets
MONEY MARKET INSTRUMENTSCertificate of Deposit**IDBI Bank Ltd CRISIL A1+ 9.26Oriental Bank of Commerce CRISIL A1+ 3.88RBL Bank Limited ICRA A1+ 2.68Canara Bank CRISIL A1+ 1.94Bank of Baroda ICRA A1+ 1.94Corporation Bank CRISIL A1+ 1.93Vijaya Bank FITCH A1+ 1.92Union Bank of India CRISIL A1+ 1.92Punjab & Sind Bank ICRA A1+ 0.78Kotak Mahindra Bank Ltd CRISIL A1+ 0.38Total 26.61
Commercial Paper**JK Tyre & Industries Ltd CARE A1+ 5.81Karvy Stock Broking Ltd ICRA A1+ (SO) 5.02Chambal Fertilizers & Chemicals Ltd CRISIL A1+ 3.87Edelweiss Commodities Ltd CRISIL A1+ 3.87CEAT Ltd CARE A1+ 3.87Redington (India) Ltd CRISIL A1+ 3.86JM Financial Asset Reconstruction Co. Pvt Ltd CRISIL A1+ 3.85SREI Equipment Finance Ltd ICRA A1+ 3.85Jindal Steel & Power Ltd CRISIL A1+ 3.82Edelweiss Financial Services Ltd CRISIL A1+ 3.47Surya Roshni Ltd ICRA A1+ (SO) 2.31Dewan Housing Finance Corporation Ltd CRISIL A1+ 2.30Aditya Birla Finance Ltd FITCH A1+ 1.94Edelweiss Financial Services Ltd CARE A1+ 1.94Sundaram BNP Paribas Home Fina Ltd CRISIL A1+ 1.93Reliance Capital Ltd CARE A1+ 1.93TTK Prestige Ltd CRISIL A1+ 1.93Bilt Graphic Paper Products Ltd FITCH A1+ 1.91Ballarpur Industries Ltd CRISIL A1+ 1.91National Engineering Industries Ltd CARE A1+ 0.77National Bank For Agriculture and Rural Development CRISIL A1+ 0.39Rural Electrification Corporation Ltd CRISIL A1+ 0.39Indiabulls Housing Finance Ltd CRISIL A1+ 0.38Total 61.31
Fixed DepositsThe Jammu & Kashmir Bank Ltd 3.88Vijaya Bank 3.88Total 7.75
Treasury BillGovernment of India SOV 0.77Total 0.77
Cash & Cash EquivalentNet Receivables/Payables 0.27CBLO / Reverse Repo Investments 3.29Total 3.56
GRAND TOTAL 100.00
12
CREDIT QUALITY
High Medium Low
Low
Medium
High
Inte
rest
Rat
eSe
nsi
tivi
ty
COMPOSITION BY ASSETS
^For details, refer Page 22.
CREDIT PROFILE
SovereignCertificate of Deposit Commercial Paper
Cash & Cash Equivalent
7.33%
80.60%
7.75%
0.77% 3.56%
A1+ Cash & Cash Equivalent SovereignUnratedA1+(SO)Fixed Deposit
26.61%
61.31%
7.75%
0.77%3.56%

Dividend History
$EQUITY FUNDS
Record Date Dividend/ Unit NAV^ as onDeclared (in `) Record Date
BOI AXA Tax Advantage Fund
Regular Plan
Eco Plan
Direct Plan
16-March-2010 3.00 15.4325-March-2014 0.50 14.4725-March-2015 2.00 18.20
16-March-2010 3.00 15.4525-March-2014 1.00 14.7025-March-2015 2.00 17.94
25-March-2015 0.77 20.61
$EQUITY FUNDS
Record Date Dividend/ Unit NAV^ as on
Declared (in `) Record Date
BOI AXA Equity Fund
Regular Plan - Regular Dividend
Regular Plan - Quarterly Dividend
Eco Plan - Regular Dividend
Eco Plan - Quarterly Dividend
Eco Plan - Annual Dividend
Institutional Plan - #Regular Dividend
Institutional Plan - #Quarterly Dividend
Direct Plan - Regular Dividend
Direct Plan - Quarterly Dividend
25-November-2009 1.00 14.3129-April-2010 1.00 13.9618-December-2014 7.00 19.08
25-March-2014 0.50 12.8825-June-2014 0.30 15.2225-March-2015 6.40 11.11
25-March-2014 0.70 14.5625-March-2015 5.00 14.41
25-March-2014 0.10 12.4725-June-2014 0.30 14.7025-March-2015 6.30 10.67
18-December-2014 5.00 18.59
25-November-2009 1.00 - 29-March-2010 1.00 - 29-April-2010 1.00 -
25-March-2014 0.50 14.45
25-March-2015 6.40 11.89
29-April-2010 1.00 13.99
15-October-2009 1.00 - 25-November-2009 1.00 - 29-April-2010 1.00 -
$Face Value - ̀ 10/-
#Since there are no investors in BOI AXA Equity Fund - Institutional Plan - Regular Dividend and Institutional Plan - Quarterly Dividend the data of NAV as on record date is not provided
^Pursuant to payment of dividend, NAV of the Dividend Option of the Plan/ Scheme falls to the extent of such dividend payment and applicable statutory levy (taxes, levies, cess etc.), if any.
a bIndividual/ HUFs. Others. Past performance may or may no be sustained in the future.
For complete Dividend History please visit www.boiaxa-im.com
DEBT / INCOME FUNDS
Record Date Dividend/ Unit NAV^ as onDeclared (in `) Record Date
$BOI AXA Short Term Income Fund
Institutional Monthly
Institutional
Regular Monthly
Regular Quarterly
Dividend
Quarterly Dividend
Dividend
Dividend
Direct Monthly Dividend
Direct Quarterly Dividend
a27-December-2010 0.043921 10.1575b27-December-2010 0.040935 10.1575a25-January-2011 0.043921 10.1704b25-January-2011 0.040935 10.1704a25-February-2011 0.052705 10.1881b25-February-2011 0.049122 10.1881
a29-December-2009 0.1751890 10.2708b29-December-2009 0.1630520 10.2708
a25-March-2015 0.072587 10.5929b25-March-2015 0.067314 10.5929a27-April-2015 0.072225 10.5728b27-April-2015 0.066917 10.5728a25-May-2015 0.072227 10.5318b25-May-2015 0.066916 10.5318
a18-December-2014 0.0130656 10.3086b18-December-2014 0.0121166 10.3086a25-March-2015 0.217760 10.0603b25-March-2015 0.201946 10.0603
a27-April-2015 0.072225 10.1237b27-April-2015 0.066909 10.1237a25-May-2015 0.065003 10.0976b25-May-2015 0.060215 10.0976
a25-June-2013 0.155854 10.2594b25-June-2013 0.149265 10.2594
$HYBRID FUND
Record Date Dividend/ Unit NAV^ as onDeclared (in `) Record Date
BOI AXA Regular Return Fund
Regular Monthly
Regular Quarterly
Eco Monthly
Eco Quarterly
Dividend
Dividend
Regular Annual Dividend
Regular Plan Regular Dividend
Direct Monthly Dividend
Direct Quarterly Dividend
Direct Annual Dividend
Dividend
Dividend
Eco Plan Regular Dividend
a25-March-2015 0.072586 12.6573b25-March-2015 0.067277 12.6573a27-April-2015 0.072227 12.5800b27-April-2015 0.066880 12.5800a25-May-2015 0.072226 12.5932b25-May-2015 0.066880 12.5932
a25-September-2014 0.0389636 11.6532b25-September-2014 0.0373162 11.6532a18-December-2014 0.0217759 11.4833b18-December-2014 0.0201943 11.4833a25-March-2015 0.217760 11.2092
a25-March-2015 0.362939 10.6530
a27-May-2013 0.105113 12.1665b27-May-2013 0.089559 12.1665a25-June-2013 0.389636 12.0556b25-June-2013 0.373162 12.0556a25-March-2014 0.389636 10.9004b25-March-2014 0.373162 10.9004
a25-March-2015 0.072581 10.9589a27-April-2015 0.072226 10.8811a25-May-2015 0.072224 10.8814
a25-March-2015 0.217753 11.2234
a18-December-2014 0.0181466 11.0972b18-December-2014 0.0168285 11.0972
a25-March-2010 0.116891 11.0573b25-March-2010 0.111949 11.0573
a25-September-2014 0.0389636 10.9334b25-September-2014 0.0373162 10.9334a18-December-2014 0.0217759 10.7422b18-December-2014 0.0201943 10.7422a25-March-2015 0.217691 10.4463
a26-December-2012 0.440456 13.1164b26-December-2012 0.377515 13.1164a25-March-2013 0.440456 12.5487b25-March-2013 0.377515 12.5487a25-March-2014 0.779271 11.5826b25-March-2014 0.746324 11.5826
13
$HYBRID FUND
Record Date Dividend/ Unit NAV^ as onDeclared (in `) Record Date
BOI AXA Equity Debt Rebalancer Fund
Regular Plan - Regular Dividend
Direct Plan - Regular Dividend
a25-September-2014 0.0389636 11.0024b25-September-2014 0.0373162 11.0024a18-December-2014 0.0181466 10.9556b18-December-2014 0.0168285 10.9556a25-March-2015 0.181466 10.9382
a25-March-2015 0.181448 12.0628
14
^ Past performance may or may not be sustained in the future. *Date of Allotment - January 2, 2013. #NAV as on the last date of the respective periods above.
Scheme PerformanceAll data as on March 31, 2015 (Unless indicated otherwise)
Since inception* till March 31, 2015 (CAGR)
March 31, 2014 to March 31, 2015 (Absolute)
March 28, 2013 to March 31, 2014 (Absolute)
29.09 22.2327% 16.7959% N.A.
29.09 39.2532% 26.6519% N.A.
20.89 21.5416% 17.8198% N.A.
17.16 N.A. N.A. N.A.
Period
#NAV Per Unit (`)
(Face Value ` 10)
Scheme Returns
(%) ^
Benchmark Returns
(CNX Nifty) (%)
Additional Benchmark Returns (%)
Period
#NAV Per Unit (`)
(Face Value ` 10)
Scheme Returns
(%) ^
Benchmark Returns
(CNX Nifty) (%)
Additional Benchmark
Returns (%)
Scheme (`)
Current Value of Standard Investment of ` 10,000 in the
Benchmark (CNX Nifty)
(`)
Additional Benchmark
(`)
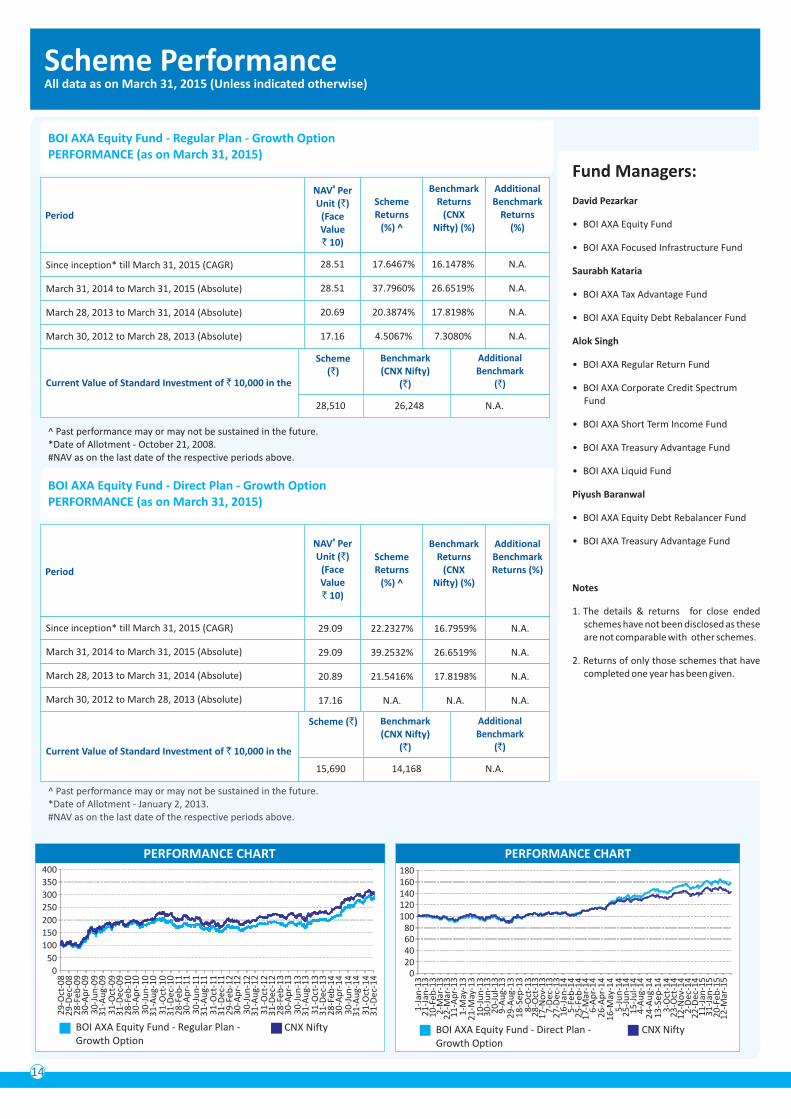
Since inception* till March 31, 2015 (CAGR)
March 31, 2014 to March 31, 2015 (Absolute)
March 28, 2013 to March 31, 2014 (Absolute)
March 30, 2012 to March 28, 2013 (Absolute)
28.51 17.6467% 16.1478% N.A.
28.51 37.7960% 26.6519% N.A.
20.69 20.3874% 17.8198% N.A.
17.16 4.5067% 7.3080% N.A.
28,510 26,248 N.A.
15,690
^ Past performance may or may not be sustained in the future. *Date of Allotment - October 21, 2008.#NAV as on the last date of the respective periods above.
Benchmark (CNX Nifty)
(`)
Additional Benchmark
(`)
March 30, 2012 to March 28, 2013 (Absolute)
Scheme (`)
Current Value of Standard Investment of ` 10,000 in the
N.A.14,168
BOI AXA Equity Fund - Direct Plan - Growth Option PERFORMANCE (as on March 31, 2015)
BOI AXA Equity Fund - Regular Plan - Growth Option PERFORMANCE (as on March 31, 2015)
Fund Managers:
David Pezarkar
• BOI AXA Equity Fund
• BOI AXA Focused Infrastructure Fund
Saurabh Kataria
• BOI AXA Tax Advantage Fund
• BOI AXA Equity Debt Rebalancer Fund
Alok Singh
• BOI AXA Regular Return Fund
• BOI AXA Corporate Credit Spectrum Fund
• BOI AXA Short Term Income Fund
• BOI AXA Treasury Advantage Fund
• BOI AXA Liquid Fund
Piyush Baranwal
• BOI AXA Equity Debt Rebalancer Fund
• BOI AXA Treasury Advantage Fund
Notes
1. The details & returns for close ended schemes have not been disclosed as these are not comparable with other schemes.
2. Returns of only those schemes that have completed one year has been given.
PERFORMANCE CHART
BOI AXA Equity Fund - Direct Plan - Growth Option
CNX Nifty
020406080
100120140160180
1-J
an-1
32
1-J
an-1
31
0-F
eb
-13
2-M
ar-1
32
2-M
ar-1
31
1-A
pr-
13
1-M
ay-1
32
1-M
ay-1
31
0-J
un
-13
30
-Ju
n-1
32
0-J
ul-
13
9-A
ug-
13
29
-Au
g-1
31
8-S
ep
-13
8-O
ct-1
32
8-O
ct-1
31
7-N
ov-
13
7-D
ec-
13
27
-De
c-1
31
6-J
an-1
45
-Fe
b-1
42
5-F
eb
-14
17
-Mar
-14
6-A
pr-
14
26
-Ap
r-1
41
6-M
ay-1
45
-Ju
n-1
42
5-J
un
-14
15
-Ju
l-1
44
-Au
g-1
42
4-A
ug-
14
13
-Se
p-1
43
-Oct
-14
23
-Oct
-14
12
-No
v-1
42
-De
c-1
42
2-D
ec-
14
11
-Jan
-15
31
-Jan
-15
20
-Fe
b-1
51
2-M
ar-1
5
PERFORMANCE CHART
0
50
100
150
200
250
300
350
400
29
-Oct
-08
29
-Dec
-08
28
-Feb
-09
30
-Ap
r-0
93
0-J
un
-09
31
-Au
g-0
93
1-O
ct-0
93
1-D
ec-0
92
8-F
eb-1
03
0-A
pr-
10
30
-Ju
n-1
03
1-A
ug-
10
31
-Oct
-10
31
-Dec
-10
28
-Feb
-11
30
-Ap
r-1
13
0-J
un
-11
31
-Au
g-1
13
1-O
ct-1
13
1-D
ec-1
12
9-F
eb-1
23
0-A
pr-
12
30
-Ju
n-1
23
1-A
ug-
12
31
-Oct
-12
31
-Dec
-12
28
-Feb
-13
30
-Ap
r-1
33
0-J
un
-13
31
-Au
g-1
33
1-O
ct-1
33
1-D
ec-1
32
8-F
eb-1
43
0-A
pr-
14
30
-Ju
n-1
43
1-A
ug-
14
31
-Oct
-14
31
-Dec
-14
BOI AXA Equity Fund - Regular Plan - Growth Option
CNX Nifty

15
BOI AXA Focused Infrastructure Fund - Regular Plan - Growth OptionPERFORMANCE (as on March 31, 2015)
^ Past performance may or may not be sustained in the future. January 2, 2013.
#NAV as on the last date of the respective periods above. *Date of Allotment -
Since inception* till March 31, 2015 (CAGR)
March 31, 2014 to March 31, 2015 (Absolute)
March 28, 2013 to March 31, 2014 (Absolute)
12.59 18.7605% 9.7073% 16.7959%
12.59 46.9078% 24.2672% 26.6519%
8.57 16.6101% 18.1764% 17.8198%
7.34 N.A. N.A. N.A.
Scheme PerformanceAll data as on March 31, 2015 (Unless indicated otherwise)
Period
#NAV Per Unit (`)
(Face Value ` 10)
SchemeReturns
(%) ^
Benchmark Returns
(CNX Infrastructure
Index) (%)
Additional Benchmark
Returns (CNX Nifty)
(%)
PERFORMANCE CHART
0
20
40
60
80
100
120
140
10-M
ar-1
010
-May
-10
10-J
ul-
1010
-Sep
-10
10-N
ov-
1010
-Jan
-11
10-M
ar-1
110
-May
-11
10-J
ul-
1110
-Sep
-11
10-N
ov-
1110
-Jan
-12
10-M
ar-1
210
-May
-12
10-J
ul-
1210
-Sep
-12
10-N
ov-
1210
-Jan
-13
10-M
ar-1
310
-May
-13
10-J
ul-
1310
-Sep
-13
10-N
ov-
1310
-Jan
-14
10-M
ar-1
410
-May
-14
10-J
ul-
1410
-Sep
-14
10-N
ov-
1410
-Jan
-15
10-M
ar-1
5
BOI AXA Focused Infrastructure Fund - Regular Plan - Growth Option
CNX Infrastructure Index
PERFORMANCE CHART
BOI AXA Focused Infrastructure Fund - Direct Plan - Growth Option
CNX Infrastructure Index
020406080
100120140160180
1-Ja
n-1
321
-Jan
-13
10-F
eb-1
32-
Mar
-13
22-M
ar-1
311
-Ap
r-13
1-M
ay-1
321
-May
-13
10-J
un
-13
30-J
un
-13
20-J
ul-
139-
Au
g-13
29-A
ug-
1318
-Sep
-13
8-O
ct-1
328
-Oct
-13
17-N
ov-
137-
Dec
-13
27-D
ec-1
316
-Jan
-14
5-Fe
b-1
425
-Feb
-14
17-M
ar-1
46-
Ap
r-14
26-A
pr-
1416
-May
-14
5-Ju
n-1
425
-Ju
n-1
415
-Ju
l-14
4-A
ug-
1424
-Au
g-14
13-S
ep-1
43-
Oct
-14
23-O
ct-1
412
-No
v-14
2-D
ec-1
422
-Dec
-14
11-J
an-1
531
-Jan
-15
20-F
eb-1
512
-Mar
-15
Fund Managers:
David Pezarkar
• BOI AXA Equity Fund
• BOI AXA Focused Infrastructure Fund
Saurabh Kataria
• BOI AXA Tax Advantage Fund
• BOI AXA Equity Debt Rebalancer Fund
Alok Singh
• BOI AXA Regular Return Fund
• BOI AXA Corporate Credit Spectrum Fund
• BOI AXA Short Term Income Fund
• BOI AXA Treasury Advantage Fund
• BOI AXA Liquid Fund
Piyush Baranwal
• BOI AXA Equity Debt Rebalancer Fund
• BOI AXA Treasury Advantage Fund
Notes
1. The details & returns for close ended schemes have not been disclosed as these are not comparable with other schemes.
2. Returns of only those schemes that have completed one year has been given.
Period
#NAV Per Unit (`)
(Face Value ` 10)
SchemeReturns
(%) ^
Benchmark Returns
(CNX Infrastructure
Index) (%)
Additional Benchmark
Returns (CNX Nifty)
(%)
Scheme (`)
Current Value of Standard Investment of ` 10,000 in the
Benchmark (CNX Infrastructure
Index) (`)
Additional Benchmark (CNX Nifty) (`)
Since inception* till March 31, 2015 (CAGR)
March 31, 2014 to March 31, 2015 (Absolute)
March 28, 2013 to March 31, 2014 (Absolute)
March 30, 2012 to March 28, 2013 (Absolute)
12.36 4.2619% -0.8512% 10.6110%
12.36 45.5830% 24.2672% 26.6519%
8.49 15.6867% 18.1764% 17.8198%
7.33 -9.8401% -11.9303% 7.3080%
12,360 9,575 16,686
14,708
^ Past performance may or may not be sustained in the future.
#NAV as on the last date of the respective periods above. *Date of Allotment - March 5, 2010.
Benchmark (CNX Infrastructure
Index) (`)
Additional Benchmark (CNX Nifty) (`)
March 30, 2012 to March 28, 2013 (Absolute)
Scheme (`)
Current Value of Standard Investment of ` 10,000 in the
14,16812,311
BOI AXA Focused Infrastructure Fund - Direct Plan - Growth Option PERFORMANCE (as on March 31, 2015)

16
BOI AXA Tax Advantage Fund - Regular Plan - Growth Option PERFORMANCE (as on March 31, 2015)
^ Past performance may or may not be sustained in the future. *Date of Allotment - January 2, 2013. #NAV as on the last date of the respective periods above.
Scheme PerformanceAll data as on March 31, 2015 (Unless indicated otherwise)
Fund Managers:
David Pezarkar
• BOI AXA Equity Fund
• BOI AXA Focused Infrastructure Fund
Saurabh Kataria
• BOI AXA Tax Advantage Fund
• BOI AXA Equity Debt Rebalancer Fund
Alok Singh
• BOI AXA Regular Return Fund
• BOI AXA Corporate Credit Spectrum Fund
• BOI AXA Short Term Income Fund
• BOI AXA Treasury Advantage Fund
• BOI AXA Liquid Fund
Piyush Baranwal
• BOI AXA Equity Debt Rebalancer Fund
• BOI AXA Treasury Advantage Fund
Notes
1. The details & returns for close ended schemes have not been disclosed as these are not comparable with other schemes.
2. Returns of only those schemes that have completed one year has been given.
Period
#NAV Per Unit (`)
(Face Value ` 10)
Scheme Returns
(%) ^
Benchmark Returns
(CNX Nifty) (%)
Additional Benchmark
Returns (%)
Scheme(`)
Current Value of Standard Investment of ` 10,000 in the
Benchmark (CNX Nifty)
(`)
Additional Benchmark
(`)
Since inception* till March 31, 2015 (CAGR)
March 31, 2014 to March 31, 2015 (Absolute)
March 28, 2013 to March 31, 2014 (Absolute)
March 30, 2012 to March 28, 2013 (Absolute)
38.80 24.8968% 20.2158% N.A.
38.80 43.8636% 26.6519% N.A.
26.97 23.5011% 17.8198% N.A.
21.80 4.9086% 7.3080% N.A.
38,800 30,737 N.A.
^ Past performance may or may not be sustained in the future. *Date of Allotment - February 25, 2009. #NAV as on the last date of the respective periods above.
Since inception* till March 31, 2015 (CAGR)
March 31, 2014 to March 31, 2015 (Absolute)
March 28, 2013 to March 31, 2014 (Absolute)
39.83 26.5088% 16.7959% N.A.
39.83 45.6307% 26.6519% N.A.
27.35 24.5470% 17.8198% N.A.
21.92 N.A. N.A. N.A.
Period
#NAV Per Unit (`)
(Face Value ` 10)
Scheme Returns
(%) ^
Benchmark Returns
(CNX Nifty) (%)
Additional Benchmark
Returns (%)
16,949
Benchmark (CNX Nifty)
(`)
Additional Benchmark
(`)
March 30, 2012 to March 28, 2013 (Absolute)
Scheme(`)
Current Value of Standard Investment of ` 10,000 in the
N.A.14,168
BOI AXA Tax Advantage Fund - Direct Plan - Growth Option PERFORMANCE (as on March 31, 2015)
PERFORMANCE CHART
BOI AXA Tax Advantage Fund - Direct Plan - Growth Option
CNX Nifty
020406080
100120140160180200
1-J
an
-13
21
-Ja
n-1
31
0-F
eb
-13
2-M
ar-
13
22
-Ma
r-1
31
1-A
pr-
13
1-M
ay-1
32
1-M
ay-1
31
0-J
un
-13
30
-Ju
n-1
32
0-J
ul-
13
9-A
ug
-13
29
-Au
g-1
31
8-S
ep
-13
8-O
ct-1
32
8-O
ct-1
31
7-N
ov-
13
7-D
ec-
13
27
-De
c-1
31
6-J
an
-14
5-F
eb
-14
25
-Fe
b-1
41
7-M
ar-
14
6-A
pr-
14
26
-Ap
r-1
41
6-M
ay-1
45
-Ju
n-1
42
5-J
un
-14
15
-Ju
l-1
44
-Au
g-1
42
4-A
ug
-14
13
-Se
p-1
43
-Oct
-14
23
-Oct
-14
12
-No
v-1
42
-De
c-1
42
2-D
ec-
14
11
-Ja
n-1
53
1-J
an
-15
20
-Fe
b-1
51
2-M
ar-
15
PERFORMANCE CHART
050
100150200250300350400450
27
-Fe
b-0
92
7-M
ay-0
9
27
-Au
g-0
9
27
-No
v-0
92
7-F
eb
-10
27
-May
-10
27
-Au
g-1
0
27
-No
v-1
02
7-F
eb
-11
27
-May
-11
27
-Au
g-1
1
27
-No
v-1
12
7-F
eb
-12
27
-May
-12
27
-Au
g-1
2
27
-No
v-1
22
7-F
eb
-13
27
-May
-13
27
-Au
g-1
3
27
-No
v-1
32
7-F
eb
-14
27
-May
-14
27
-Au
g-1
4
27
-No
v-1
42
7-F
eb
-15
BOI AXA Tax Advantage Fund - Regular Plan - Growth Option
CNX Nifty

17
BOI AXA Regular Return Fund - Regular Plan - Growth Option PERFORMANCE (as on March 31, 2015)
^ Past performance may or may not be sustained in the future. *Date of Allotment - January 14, 2013. #NAV as on the last date of the respective periods above. **The returns for Additional Benchmark in respect of MIP will be published as and when made available by market data providers.
Scheme PerformanceAll data as on March 31, 2015 (Unless indicated otherwise)
Fund Managers:
David Pezarkar
• BOI AXA Equity Fund
• BOI AXA Focused Infrastructure Fund
Saurabh Kataria
• BOI AXA Tax Advantage Fund
• BOI AXA Equity Debt Rebalancer Fund
Alok Singh
• BOI AXA Regular Return Fund
• BOI AXA Corporate Credit Spectrum Fund
• BOI AXA Short Term Income Fund
• BOI AXA Treasury Advantage Fund
• BOI AXA Liquid Fund
Piyush Baranwal
• BOI AXA Equity Debt Rebalancer Fund
• BOI AXA Treasury Advantage Fund
Notes
1. The details & returns for close ended schemes have not been disclosed as these are not comparable with other schemes.
2. Returns of only those schemes that have completed one year has been given.
Period
#NAV Per Unit (`)
(Face Value ` 10)
Scheme Returns
(%) ^
Benchmark Returns
(%)
(CRISIL MIPBlended
Index)
Additional Benchmark Returns **
(%)
Scheme (`)
Current Value of Standard Investment of ` 10,000 in the
Benchmark (CRISIL MIP
Blended Index) (`)
Additional Benchmark
(`)
Since inception* till March 31, 2015 (CAGR)
March 31, 2014 to March 31, 2015 (Absolute)
March 28, 2013 to March 31, 2014 (Absolute)
March 30, 2012 to March 28, 2013 (Absolute)
16.2317 8.3483% 9.6790% N.A.
16.2317 14.6300% 16.3931% N.A.
14.1442 9.2697% 6.4350% N.A.
12.9443 8.0565% 9.0629% N.A.
16,232 17,474 N.A.
^ Past performance may or may not be sustained in the future. *Date of Allotment - March 18, 2009. #NAV as on the last date of the respective periods above. **The returns for Additional Benchmark in respect of MIP will be published as and when made available by market data providers.
Since inception* till March 31, 2015 (CAGR)
March 31, 2014 to March 31, 2015 (Absolute)
March 28, 2013 to March 31, 2014 (Absolute)
16.3361 10.9077% 10.1670% N.A.
16.3361 15.0072% 16.3931% N.A.
14.1881 9.5589% 6.4350% N.A.
12.9502 N.A. N.A. N.A.
Period
#NAV Per Unit (`)
(Face Value ` 10)
Scheme Returns
(%) ^
Benchmark Returns
(CRISIL MIPBlended
Index) (%)
Additional Benchmark Returns **
(%)
12,572
Benchmark (CRISIL MIP
Blended Index) (`)
Additional Benchmark
(`)
March 30, 2012 to March 28, 2013 (Absolute)
Scheme(`)
Current Value of Standard Investment of ` 10,000 in the
N.A.12,387
BOI AXA Regular Return Fund - Direct Plan - Growth Option PERFORMANCE (as on March 31, 2015)
PERFORMANCE CHART
BOI AXA Tax Advantage Fund - Direct Plan - Growth Option
CNX Nifty
020406080
100120140160180200
1-J
an
-13
21
-Ja
n-1
31
0-F
eb
-13
2-M
ar-
13
22
-Ma
r-1
31
1-A
pr-
13
1-M
ay-1
32
1-M
ay-1
31
0-J
un
-13
30
-Ju
n-1
32
0-J
ul-
13
9-A
ug
-13
29
-Au
g-1
31
8-S
ep
-13
8-O
ct-1
32
8-O
ct-1
31
7-N
ov-
13
7-D
ec-
13
27
-De
c-1
31
6-J
an
-14
5-F
eb
-14
25
-Fe
b-1
41
7-M
ar-
14
6-A
pr-
14
26
-Ap
r-1
41
6-M
ay-1
45
-Ju
n-1
42
5-J
un
-14
15
-Ju
l-1
44
-Au
g-1
42
4-A
ug
-14
13
-Se
p-1
43
-Oct
-14
23
-Oct
-14
12
-No
v-1
42
-De
c-1
42
2-D
ec-
14
11
-Ja
n-1
53
1-J
an
-15
20
-Fe
b-1
51
2-M
ar-
15
PERFORMANCE CHART
0
20
40
60
80
100
120
140
BOI AXA Regular Return Fund - Direct Plan - Growth Option
CRISIL MIP Blended Index
1-J
an
-13
1-F
eb
-13
1-M
ar-
13
1-A
pr-
13
1-M
ay
-13
1-J
un
-13
1-J
ul-
13
1-A
ug
-13
1-S
ep
-13
1-O
ct-1
31
-No
v-1
31
-De
c-1
31
-Ja
n-1
41
-Fe
b-1
41
-Ma
r-1
41
-Ap
r-1
4
1-M
ay
-14
1-J
un
-14
1-J
ul-
14
1-A
ug
-14
1-S
ep
-14
1-O
ct-1
41
-No
v-1
41
-De
c-1
41
-Ja
n-1
51
-Fe
b-1
51
-Ma
r-1
5
PERFORMANCE CHART
020406080
100120140160180200
20
-Ma
r-0
9
20
-Ju
n-0
9
20
-Se
p-0
9
20
-De
c-0
9
20
-Ma
r-1
0
20
-Ju
n-1
0
20
-Se
p-1
0
20
-De
c-1
0
20
-Ma
r-1
1
20
-Ju
n-1
1
20
-Se
p-1
1
20
-De
c-1
1
20
-Ma
r-1
2
20
-Ju
n-1
2
20
-Se
p-1
2
20
-De
c-1
2
20
-Ma
r-1
3
20
-Ju
n-1
3
20
-Se
p-1
3
20
-De
c-1
3
20
-Ma
r-1
4
20
-Ju
n-1
4
20
-Se
p-1
4
20
-De
c-1
4
20
-Ma
r-1
5
BOI AXA Regular Return Fund -Regular Plan - Growth Option
CRISIL MIP Blended Index

18
BOI AXA Equity Debt Rebalancer Fund - Regular Plan - Growth OptionPERFORMANCE (as on March 31, 2015)
^ Past performance may or may not be sustained in the future. *Date of Allotment - March 14, 2014. #NAV as on the last date of the respective periods above. ##CNX Nifty (50%) & CRISIL Short Term Bond Fund Index (50%)
Scheme PerformanceAll data as on March 31, 2015 (Unless indicated otherwise)
Fund Managers:
David Pezarkar
• BOI AXA Equity Fund
• BOI AXA Focused Infrastructure Fund
Saurabh Kataria
• BOI AXA Tax Advantage Fund
• BOI AXA Equity Debt Rebalancer Fund
Alok Singh
• BOI AXA Regular Return Fund
• BOI AXA Corporate Credit Spectrum Fund
• BOI AXA Short Term Income Fund
• BOI AXA Treasury Advantage Fund
• BOI AXA Liquid Fund
Piyush Baranwal
• BOI AXA Equity Debt Rebalancer Fund
• BOI AXA Treasury Advantage Fund
Notes
1. The details & returns for close ended schemes have not been disclosed as these are not comparable with other schemes.
2. Returns of only those schemes that have completed one year has been given.
Period
#NAV Per Unit (`)
(Face Value ` 10)
Scheme Returns
(%) ^
Benchmark ##Returns
Additional Benchmark
Returns(%)
Scheme (`)
Current Value of Standard Investment of ` 10,000 in the
##Benchmark(`)
Additional Benchmark
(`)
Since inception* till March 31, 2015 (CAGR)
March 31, 2014 to March 31, 2015 (Absolute)
March 28, 2013 to March 31, 2014 (Absolute)
March 30, 2012 to March 28, 2013 (Absolute)
12.2997 21.8063% 19.7082% N.A.
12.2997 21.0962% 18.4393% N.A.
10.1410 N.A. N.A. N.A.
N.A. N.A. N.A. N.A.
12,300 12,077 N.A.
^ Past performance may or may not be sustained in the future. *Date of Allotment - March 14, 2014. #NAV as on the last date of the respective periods above. ##CNX Nifty (50%) & CRISIL Short Term Bond Fund Index (50%)
Since inception* till March 31, 2015 (CAGR)
March 31, 2014 to March 31, 2015 (Absolute)
March 28, 2013 to March 31, 2014 (Absolute)
12.3430 22.2149% 19.7082% N.A.
12.3430 21.5059% 18.4393% N.A.
10.1421 N.A. N.A. N.A.
N.A. N.A. N.A. N.A.
Period
#NAV Per Unit (`)
(Face Value ` 10)
Scheme Returns
(%) ^
Benchmark ##Returns
Additional Benchmark Returns **
(%)
12,343
##Benchmark (`)
Additional Benchmark
(`)
March 30, 2012 to March 28, 2013 (Absolute)
Scheme (`)
Current Value of Standard Investment of ` 10,000 in the
N.A.12,077
BOI AXA Equity Debt Rebalancer Fund - Direct Plan - Growth OptionPERFORMANCE (as on March 31, 2015)
BOI AXA Equity Debt Rebalancer Fund - Regular Plan - Growth Option
CNX Nifty (50%) & CRISIL Short Term Bond Fund Index (50%)
020
40
60
80100
120
140
24
-Ma
r-1
4
7-A
pr-
14
21
-Ap
r-1
4
5-M
ay
-14
19
-Ma
y-1
4
2-J
un
-14
16
-Ju
n-1
4
30
-Ju
n-1
4
14
-Ju
l-1
4
28
-Ju
l-1
4
11
-Au
g-1
4
25
-Au
g-1
4
8-S
ep
-14
22
-Se
p-1
4
6-O
ct-1
4
20
-Oct
-14
3-N
ov-1
4
17
-No
v-1
4
1-D
ec-
14
15
-De
c-1
4
29
-De
c-1
4
12
-Ja
n-1
5
26
-Ja
n-1
5
9-F
eb
-15
PERFORMANCE CHART
0
20
40
60
80
100
120
140
BOI AXA Equity Debt Rebalancer Fund - Direct Plan - Growth Option
CNX Nifty (50%) & CRISIL Short Term Bond Fund Index (50%)
24
-Ma
r-1
4
7-A
pr-
14
21
-Ap
r-1
4
5-M
ay
-14
19
-Ma
y-1
4
2-J
un
-14
16
-Ju
n-1
4
30
-Ju
n-1
4
14
-Ju
l-1
4
28
-Ju
l-1
4
11
-Au
g-1
4
25
-Au
g-1
4
8-S
ep
-14
22
-Se
p-1
4
6-O
ct-1
4
20
-Oct
-14
3-N
ov-1
4
17
-No
v-1
4
1-D
ec-
14
15
-De
c-1
4
29
-De
c-1
4
12
-Ja
n-1
5
26
-Ja
n-1
5
9-F
eb
-15
PERFORMANCE CHART

19
BOI AXA Treasury Advantage Fund - Regular Plan - Growth Option PERFORMANCE (as on March 31, 2015)
^ Past performance may or may not be sustained in the future.
*Date of Allotment - January 3, 2013.
#NAV as on the last date of the respective periods above.
Scheme PerformanceAll data as on March 31, 2015 (Unless indicated otherwise)
Period
#NAV Per Unit (`)
(Face Value
` 1,000)
Scheme Returns
(%) ^
Benchmark Returns
(CRISIL Liquid Fund Index)
(%)
Additional Benchmark
Returns (CRISIL 91 Day
T-Bill Index) (%)
Scheme(`)
Current Value of Standard Investment of ` 10,000 in the
Benchmark (CRISIL Liquid
Fund Index) (`)
Additional Benchmark (CRISIL 91 DayT-Bill Index) (`)
Since inception* till March 31, 2015 (CAGR)
March 31, 2014 to March 31, 2015 (Absolute)
March 28, 2013 to March 31, 2014 (Absolute)
March 30, 2012 to March 28, 2013 (Absolute)
1644.4629 7.6919% 7.6802% 6.4903%
1644.4629 9.0417% 8.9813% 8.8445%
1507.0317 9.3855% 9.4611% 8.5831%
1377.7259 8.7516% 8.1744% 8.4601%
16,445 16,433 15,252
^ Past performance may or may not be sustained in the future.
*Date of Allotment - July 16, 2008.
#NAV as on the last date of the respective periods above.
Since inception* till March 31, 2015 (CAGR)
March 31, 2014 to March 31, 2015 (Absolute)
March 28, 2013 to March 31, 2014 (Absolute)
1654.9328 9.5269% 9.1036% 8.6577%
1654.9328 9.3168% 8.9813% 8.8445%
1512.7795 9.7882% 9.4611% 8.5831%
1377.9072 N.A. N.A. N.A.
Period
#NAV Per Unit (`)
(Face Value
` 1,000)
Scheme Returns
(%) ^
Benchmark Returns (CRISIL Liquid Fund
Index) (%)
Additional Benchmark
Returns(CRISIL 91 Day T-BillIndex) (%)
12,262
Benchmark (CRISIL Liquid
Fund Index) (`)
Additional Benchmark (CRISIL 91 DayT-Bill Index) (`)
March 30, 2012 to March 28, 2013 (Absolute)
Scheme(`)
Current Value of Standard Investment of ` 10,000 in the
12,04512,077
BOI AXA Treasury Advantage Fund - Direct Plan - Growth Option PERFORMANCE (as on March 31, 2015)
Fund Managers:
David Pezarkar
• BOI AXA Equity Fund
• BOI AXA Focused Infrastructure Fund
Saurabh Kataria
• BOI AXA Tax Advantage Fund
• BOI AXA Equity Debt Rebalancer Fund
Alok Singh
• BOI AXA Regular Return Fund
• BOI AXA Corporate Credit Spectrum Fund
• BOI AXA Short Term Income Fund
• BOI AXA Treasury Advantage Fund
• BOI AXA Liquid Fund
Piyush Baranwal
• BOI AXA Equity Debt Rebalancer Fund
• BOI AXA Treasury Advantage Fund
Notes
1. The details & returns for close ended schemes have not been disclosed as these are not comparable with other schemes.
2. Returns of only those schemes that have completed one year has been given.
PERFORMANCE CHART
BOI AXA Short Term Income Fund - Regular Plan - Growth Option
CRISIL Short Term Bond Fund Index
0
20
40
60
80
100
120
140
160
180
22-D
ec-0
822
-Mar
-09
22-J
un-0
922
-Sep
-09
22-D
ec-0
922
-Mar
-10
22-J
un-1
022
-Sep
-10
22-D
ec-1
022
-Mar
-11
22-J
un-1
122
-Sep
-11
22-D
ec-1
122
-Mar
-12
22-J
un-1
222
-Sep
-12
22-D
ec-1
222
-Mar
-13
22-J
un-1
322
-Sep
-13
22-D
ec-1
322
-Mar
-14
22-J
un-1
422
-Sep
-14
22-D
ec-1
422
-Mar
-15
PERFORMANCE CHART
BOI AXA Short Term Income Fund - Direct Plan - Growth Option
CRISIL Short Term Bond Fund Index
0
20
40
60
80
100
120
140
1-Ja
n-13
1-Fe
b-13
1-M
ar-1
31-
Apr
-13
1-M
ay-1
3
1-Ju
n-13
1-Ju
l-13
1-A
ug-1
3
1-Se
p-13
1-O
ct-1
31-
Nov
-13
1-D
ec-1
31-
Jan-
141-
Feb-
141-
Mar
-14
1-A
pr-1
4
1-M
ay-1
4
1-Ju
n-14
1-Ju
l-14
1-A
ug-1
4
1-Se
p-14
1-O
ct-1
41-
Nov
-14
1-D
ec-1
41-
Jan-
151-
Feb-
151-
Mar
-15

BOI AXA Treasury Advantage Fund - Regular Plan - Growth Option
CRISIL Liquid Fund Index
PERFORMANCE CHART
0
50
100
150
200
250
300
350
400
450
27-F
eb-0
927
-May
-09
27-A
ug-0
9
27-N
ov-0
9
27-F
eb-1
027
-May
-10
27-A
ug-1
0
27-N
ov-1
0
27-F
eb-1
127
-May
-11
27-A
ug-1
1
27-N
ov-1
1
27-F
eb-1
227
-May
-12
27-A
ug-1
2
27-N
ov-1
2
27-F
eb-1
327
-May
-13
27-A
ug-1
3
27-N
ov-1
3
27-F
eb-1
427
-May
-14
27-A
ug-1
4
27-N
ov-1
4
27-F
eb-1
5
20
BOI AXA Short Term Income Fund - Regular Plan - Growth Option PERFORMANCE (as on March 31, 2015)
^ Past performance may or may not be sustained in the future. *Date of Allotment - January 3, 2013.#NAV as on the last date of the respective periods above.
Scheme PerformanceAll data as on March 31, 2015 (Unless indicated otherwise)
Period
#NAV PerUnit (`)
(Face Value ` 10)
Scheme Returns
(%) ^
Benchmark Returns (CRISIL
Short Term Bond Fund Index) (%)
Additional Benchmark
Returns (CRISIL 1 Year T-BillIndex) (%)
Scheme(`)
Current Value of Standard Investment of ` 10,000 in the
Benchmark (CRISIL Short Term Bond Fund Index)
(`)
Additional Benchmark(CRISIL 1 YearT-Bill Index)
(`)
Since inception* till March 31, 2015 (CAGR)
March 31, 2014 to March 31, 2015 (Absolute)
March 28, 2013 to March 31, 2014 (Absolute)
March 30, 2012 to March 28, 2013 (Absolute)
15.0155 6.6786% 7.9610% 5.9614%
15.0155 9.5266% 10.3150% 8.7414%
13.6992 7.2496% 8.7810% 5.7674%
12.7732 7.7016% 9.0510% 8.3311%
15,016 16,187 14,392
^ Past performance may or may not be sustained in the future. *Date of Allotment - December 18, 2008. #NAV as on the last date of the respective periods above.
Since inception* till March 31, 2015 (CAGR)
March 31, 2014 to March 31, 2015 (Absolute)
March 28, 2013 to March 31, 2014 (Absolute)
1654.9328 9.5269% 9.1036% 8.6577%
1654.9328 9.3168% 8.9813% 8.8445%
1512.7795 9.7882% 9.4611% 8.5831%
1377.9072 N.A. N.A. N.A.
Period
#NAV PerUnit (`)
(Face Value ` 10)
Scheme Returns
(%) ^
Benchmark Returns (CRISIL
Short TermBond FundIndex) (%)
Additional Benchmark
Returns(CRISIL 1
Year T-BillIndex) (%)
12,224
Benchmark (CRISIL Short
Term Bond Fund Index) (`)
Additional Benchmark(CRISIL 1 YearT-Bill Index)
(`)
March 30, 2012 to March 28, 2013 (Absolute)
Scheme(`)
Current Value of Standard Investment of ` 10,000 in the
11,72512,229
BOI AXA Short Term Income Fund - Direct Plan - Growth Option PERFORMANCE (as on March 31, 2015)
CRISIL Liquid Fund Index
PERFORMANCE CHART
0
20
40
60
80
100
120
140
1-Ja
n-13
1-Fe
b-13
1-M
ar-1
31-
Apr
-13
1-M
ay-1
3
1-Ju
n-13
1-Ju
l-13
1-A
ug-1
3
1-Se
p-13
1-O
ct-1
31-
Nov
-13
1-D
ec-1
31-
Jan-
141-
Feb-
141-
Mar
-14
1-A
pr-1
4
1-M
ay-1
4
1-Ju
n-14
1-Ju
l-14
1-A
ug-1
4
1-Se
p-14
1-O
ct-1
41-
Nov
-14
1-D
ec-1
41-
Jan-
151-
Feb-
151-
Mar
-15
BOI AXA Treasury Advantage Fund - Direct Plan - Growth Option
Fund Managers:
David Pezarkar
• BOI AXA Equity Fund
• BOI AXA Focused Infrastructure Fund
Saurabh Kataria
• BOI AXA Tax Advantage Fund
• BOI AXA Equity Debt Rebalancer Fund
Alok Singh
• BOI AXA Regular Return Fund
• BOI AXA Corporate Credit Spectrum Fund
• BOI AXA Short Term Income Fund
• BOI AXA Treasury Advantage Fund
• BOI AXA Liquid Fund
Piyush Baranwal
• BOI AXA Equity Debt Rebalancer Fund
• BOI AXA Treasury Advantage Fund
Notes
1. The details & returns for close ended schemes have not been disclosed as these are not comparable with other schemes.
2. Returns of only those schemes that have completed one year has been given.
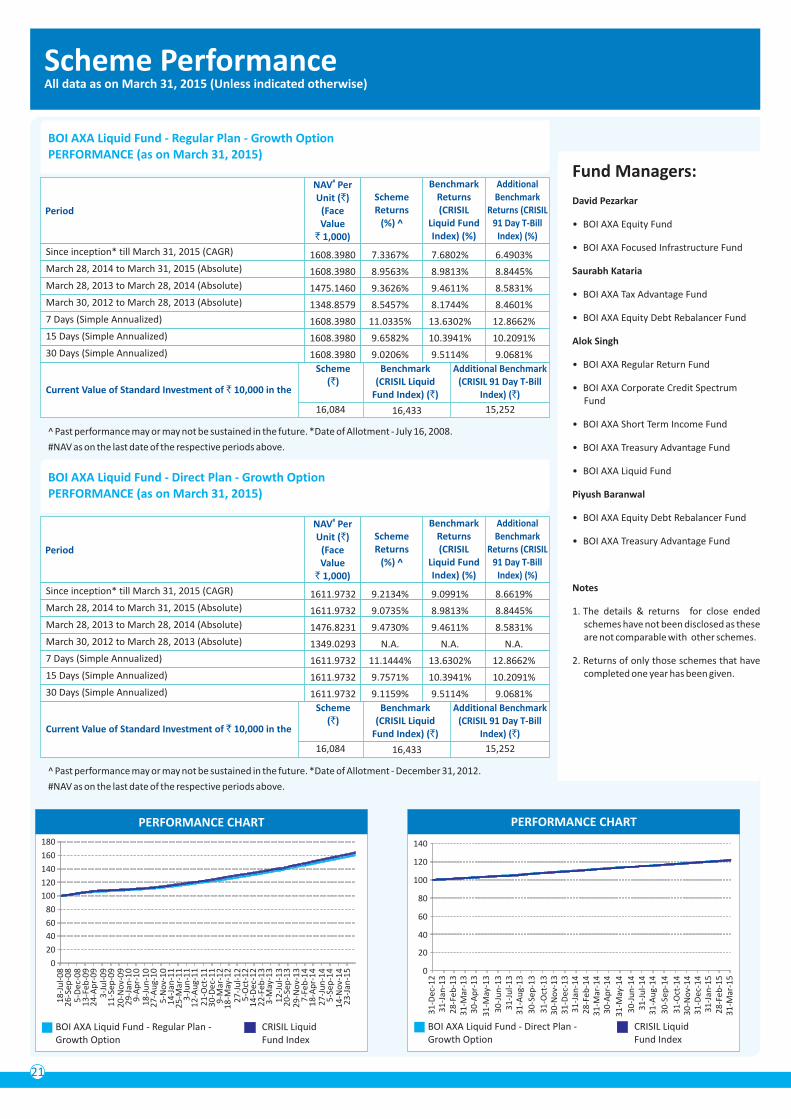
21
Scheme PerformanceAll data as on March 31, 2015 (Unless indicated otherwise)
BOI AXA Liquid Fund - Regular Plan - Growth Option PERFORMANCE (as on March 31, 2015)
BOI AXA Liquid Fund - Direct Plan - Growth Option PERFORMANCE (as on March 31, 2015)
Fund Managers:
David Pezarkar
• BOI AXA Equity Fund
• BOI AXA Focused Infrastructure Fund
Saurabh Kataria
• BOI AXA Tax Advantage Fund
• BOI AXA Equity Debt Rebalancer Fund
Alok Singh
• BOI AXA Regular Return Fund
• BOI AXA Corporate Credit Spectrum Fund
• BOI AXA Short Term Income Fund
• BOI AXA Treasury Advantage Fund
• BOI AXA Liquid Fund
Piyush Baranwal
• BOI AXA Equity Debt Rebalancer Fund
• BOI AXA Treasury Advantage Fund
Notes
1. The details & returns for close ended schemes have not been disclosed as these are not comparable with other schemes.
2. Returns of only those schemes that have completed one year has been given.
Period
#NAV Per Unit (`)
(Face Value
` 1,000)
Scheme Returns
(%) ^
BenchmarkReturns (CRISIL
Liquid FundIndex) (%)
Additional Benchmark
Returns (CRISIL 91 Day T-Bill
Index) (%)
Scheme(`)
Current Value of Standard Investment of ` 10,000 in the
Benchmark(CRISIL Liquid
Fund Index) (`)
16,084 16,433 15,252
Additional Benchmark(CRISIL 91 Day T-Bill
Index) (`)
Since inception* till March 31, 2015 (CAGR)
March 28, 2014 to March 31, 2015 (Absolute)
March 28, 2013 to March 28, 2014 (Absolute)
March 30, 2012 to March 28, 2013 (Absolute)
7 Days (Simple Annualized)
15 Days (Simple Annualized)
30 Days (Simple Annualized)
1608.3980 7.3367% 7.6802% 6.4903%
1608.3980 8.9563% 8.9813% 8.8445%
1475.1460 9.3626% 9.4611% 8.5831%
1348.8579 8.5457% 8.1744% 8.4601%
1608.3980 11.0335% 13.6302% 12.8662%
1608.3980 9.6582% 10.3941% 10.2091%
1608.3980 9.0206% 9.5114% 9.0681%
Period
#NAV Per Unit (`)
(Face Value
` 1,000)
Scheme Returns
(%) ^
BenchmarkReturns (CRISIL
Liquid FundIndex) (%)
Additional Benchmark
Returns (CRISIL 91 Day T-Bill
Index) (%)
Scheme(`)
Current Value of Standard Investment of ` 10,000 in the
Benchmark(CRISIL Liquid
Fund Index) (`)
16,084 16,433 15,252
Additional Benchmark(CRISIL 91 Day T-Bill
Index) (`)
Since inception* till March 31, 2015 (CAGR)
March 28, 2014 to March 31, 2015 (Absolute)
March 28, 2013 to March 28, 2014 (Absolute)
March 30, 2012 to March 28, 2013 (Absolute)
7 Days (Simple Annualized)
15 Days (Simple Annualized)
30 Days (Simple Annualized)
1611.9732 9.2134% 9.0991% 8.6619%
1611.9732 9.0735% 8.9813% 8.8445%
1476.8231 9.4730% 9.4611% 8.5831%
1349.0293 N.A. N.A. N.A.
1611.9732 11.1444% 13.6302% 12.8662%
1611.9732 9.7571% 10.3941% 10.2091%
1611.9732 9.1159% 9.5114% 9.0681%
PERFORMANCE CHART
BOI AXA Liquid Fund - Direct Plan - Growth Option
CRISIL Liquid Fund Index
0
20
40
60
80
100
120
140
31
-Dec
-12
31
-Jan
-13
28
-Feb
-13
31
-Mar
-13
30
-Ap
r-1
3
31
-May
-13
30
-Ju
n-1
33
1-J
ul-
13
31
-Au
g-1
3
30
-Sep
-13
31
-Oct
-13
30
-No
v-1
33
1-D
ec-1
33
1-J
an-1
42
8-F
eb-1
43
1-M
ar-1
43
0-A
pr-
14
31
-May
-14
30
-Ju
n-1
43
1-J
ul-
14
31
-Au
g-1
4
30
-Sep
-14
31
-Oct
-14
30
-No
v-1
43
1-D
ec-1
43
1-J
an-1
52
8-F
eb-1
53
1-M
ar-1
5
PERFORMANCE CHART
BOI AXA Liquid Fund - Regular Plan - Growth Option
CRISIL Liquid Fund Index
0
20
40
60
80
100
120
140
160
180
18
-Ju
l-0
82
6-S
ep-0
85
-Dec
-08
13
-Feb
-09
24
-Ap
r-0
93
-Ju
l-0
91
1-S
ep-0
92
0-N
ov-
09
29
-Jan
-10
9-A
pr-
10
18
-Ju
n-1
02
7-A
ug-
10
5-N
ov-
10
14
-Jan
-11
25
-Mar
-11
3-J
un
-11
12
-Au
g-1
12
1-O
ct-1
13
0-D
ec-1
19
-Mar
-12
18
-May
-12
27
-Ju
l-1
25
-Oct
-12
14
-Dec
-12
22
-Feb
-13
3-M
ay-1
31
2-J
ul-
13
20
-Sep
-13
29
-No
v-1
37
-Feb
-14
18
-Ap
r-1
42
7-J
un
-14
5-S
ep-1
41
4-N
ov-
14
23
-Jan
-15
^ Past performance may or may not be sustained in the future. *Date of Allotment - July 16, 2008.
#NAV as on the last date of the respective periods above.
^ Past performance may or may not be sustained in the future. *Date of Allotment - December 31, 2012.
#NAV as on the last date of the respective periods above.

Disclaimer/Statutory Details
This report is as of May 31, 2015 unless indicated otherwise. Statements relating to outlook and forecast are the opinions of the Author. The views expressed by the author are
personal and are not necessarily that of BOI AXA Investment Managers Private Limited (AMC). This report is for information purpose only and is not intended to be any
investment advice. Please make independent research/ obtain professional help before taking any decision of investment / sale. AMC makes no representation as to the
quality, liquidity or market perception of any securities/ issuer / borrower, if described in the report above, nor does it provide any guarantee whatsoever. Information and
material used in this report are believed to be from reliable sources. However, AMC does not warrant the accuracy, reasonableness and/or completeness of any information.
AMC does not undertake to update any information or material in this report. Decisions taken by you based on the information provided in this report are to your own account
and risk. AMC and any of its officers, directors and employees shall not be liable for any loss or damage of any nature, as also any loss of profit in any way arising from the use of
this material in any manner. AMC or its directors, officers and employees, including author of this report / persons involved in the preparation or issuance of this report may,
from time to time, have long or short positions in, and buy or sell the securities, if any, mentioned herein or have other potential conflict of interest with respect to any
recommendation and related information and opinions given in the report /report. This report, or any part of it, should not be duplicated, or contents altered / modified, in
whole or in part in any form and or re-distributed without AMC’s prior written consent. © BOI AXA Investment Managers Private Limited 2015.
Mutual Fund investments are subject to market risks, read all scheme related documents carefully.
22
*Investor should consult their financial advisor if they are not clear about the suitability of the product.Note:1. BLUE - Investor understands that their principal will be at low risk
2. YELLOW - Investor understands that their principal will be at medium risk 3. BROWN - Investor understands that their principal will be at High risk
BOI AXA Equity Fund
(an Open Ended Equity Growth Fund)
SCHEME THIS PRODUCT IS SUITABLE FOR INVESTORS WHO ARE SEEKING*:
• Long-term capital growth.
• Investment in equity and equity-related securities including equity derivatives of companies across market capitalisations.
• High risk. (BROWN)
BOI AXA Tax Advantage Fund
(an Open-Ended Equity Linked Savings Scheme)
• Long-term capital growth.
• Investment in equity and equity-related securities including equity derivatives of companies across market capitalisations.
• High risk. (BROWN)
BOI AXA Focused Infrastructure Fund
(an Open Ended Equity Scheme)
• Long-term capital growth.
• Investment in equity and equity-related securities of companies engaged in infrastructure and infrastructure related sectors.
• High risk. (BROWN)
BOI AXA Liquid Fund
(an Open Ended Liquid Scheme)
• Income over short term.
• Investment in Debt and Money Market Instruments.
• Low risk. (BLUE)
BOI AXA Treasury Advantage Fund
(an Open Ended Income Scheme)
• Regular income over short term.
• Investment in Debt and Money Market Instruments
• Low risk. (BLUE)
BOI AXA Short Term Income Fund
(an Open Ended Income Scheme)
• Regular income over short to medium term.
• Investment in Debt / Money Market Instruments / Govt. Securities with portfolio average maturity not exceeding 5 years.
• Low risk. (BLUE)
BOI AXA Regular Return Fund
(an Open Ended Income Scheme)
• Long term capital appreciation and regular income.
• Investment in equity and equity related securities (upto 20%) as well as fixed income securities (Debt / Money MarketInstruments Govt.Securities).
• Medium risk. (YELLOW)
BOI AXA Equity Debt Rebalancer Fund
(an Open Ended Dynamic Fund)
• Long term capital appreciation
• Dynamic asset allocation between equity and fixed income based on equity market valuations
• High risk. (BROWN)
PRODUCT LABEL
BOI AXA Corporate Credit Spectrum Fund
(an Open Ended Debt Scheme)
• Long term capital appreciation
• Investment primarily in corporate debt securities with medium to long term maturities across the credit spectrum within the universe of investment grade rating
• Medium risk. (YELLOW)

• Ahmedabad - Shop No.:- 405, 4th Floor, Zodiac Plaza, Plot no: - 229, Village Kochrab, H. L. College Road, Navrangpura, Ahmedabad - 380 009. • Bangalore - 957, Regus
Business Centre, Bangalore Pvt. Ltd., Level 9, Raheja Towers, 26 - 27, Mahatma Gandhi Road, Bangalore - 560 001. • Bhopal - F. F. 16, Part B, First Floor, Mansarover Complex,
Near Habibganj Railway Station, Bhopal - 462 016. • Chandigarh - 205, Megabyte Business Centre, SCO-333-334, Ist Floor, Sec-35B Chandigarh - 160 022. Chennai - Cabin No.
203, Apeejay Business Center No: 39/12, Haddows Road, Nungambakkam, Chennai - 600 034. • Hyderabad - Cabin No. 23, Apeejay Business Centre, Tresorie, The Park, 22
Rajbhavan Road, Somajiguda, Hyderabad - 500 082. • Jaipur - Office no.154, 1st Floor, Ganpati Plaza,M I Road, Jaipur - 302 001. • Kolkata - Cabin 06, Block - A, 8th Floor,
Apeejay House, 15 Park Street, Kolkata - 700 016. Lucknow - Office No-504, 5th Floor, Sriram Tower, 13 Ashok Marg, Hazratganj, Lucknow - 226 001. • Mumbai - 51, East Wing,
Kalpataru Synergy, Opp. Grand Hyatt, Vakola, Santacruz (E), Mumbai - 400 055. • New Delhi - Room No. 610, Avanta Business Center, 4th Floor, Statesman House, Barakhamba
Road, Connaught Place, New Delhi - 110 001. • Pune - Apeejay Business Centre, 1st Floor, Pride House, S.No. 108/7, Shivajinagar, University Road, Pune - 411 016. • Vadodara -
118, 1st Floor, Siddharth Complex, R C Dutt Road, Alkapuri, Vadodara - 390 005.
•
•
• Agra: F-1, Ist Floor, Deepak Wasan Plaza, Above HDFC Bank, Sanjay Place, Agra - 282 002. • Ahmedabad: 201,Shail Building, Opp : Madhusudhan House, Nr. Navrangpura
Telephone Exchange; Navrangpura Ahmedabad - 380 006. • Amritsar: 72-A, Taylor'S Road, Aga Heritage Gandhi Ground, Amritsar - 143 001. • Anand: B/ 42, Vaibhav
Commercial Center, Nr TVS Down Town Shrow Room, Grid Char Rasta, Anand - 388 001. • Asansol: 114 /71, G.T. Road, Near Sony Centre, Bhanga Pachil, Asansol - 713 303.
• Bangalore: 59, ‘Skanda’ Puttanna Road, Basavanagudi, Bangalore - 560 004. • Baroda: SB-4&5, Mangaldeep Complex, Opposite Mesonic Hall. Productivity Road, Alkapuri,
Vadodara - 390 007. • Belgaum: CTS No 3939/ A2 A1, Above Raymonds Show Room, Beside Harsha Appliances, Club Road, Belgaum - 590 001. • Bhagalpur: 2nd Floor,
Chandralok Complex, Ghantaghar, Radha Rani Sinha Road, Bhagalpur - 812 001. • Bhopal: Kay Kay Busniss Centre, 133, Zone I, M P Nagar, Bhopal - 462 011. • Bhubaneswar:
2nd & 3rd Floor, Janardan, House, A 181, Saheed Nagar, Bhubaneswar - 751 007. • Chandigarh: SCO-2423-2424 1ST Floor, Above TVS showroom, Sec 22C Chandigarh - 160 022.
• Chennai: Flat No F11, First Floor, Akshya Plaza,(Erstwhile Harris Road), Opp Chief City Metropolitan Court, #108, Adhithanar Salai,Egmore, Chennai - 600 002. • Cochin:
Building Nos.39 Ali Arcade, 1st floor, Near Atlantis Junction, Kizhvana Road, Panampili Nagar, Cochin - 682 036. Ernakulum District. • Coimbatore: 3rd Floor,Jaya Enclave, 1056-
1057, Avinashi Road, Coimbatore – 641 018. • Dehradun: Kaulagarh Road, Near Sirmour Marg, Above Reliance Webworld, Dehradun - 248 001. • Dhanbad: 208, New Market,
2Nd Floor, Katras Road, Bank More, Dhanbad - 826 001. • Gandhinagar: Plot No. - 945/2, Sector - 7/C, Gandhinagar - 382 007. • Ghaziabad: 1st Floor, C-7, Lohia Nagar,
Ghaziabad - 201 001. • Gorakhpur: Above V.I.P. House, Ajdacent A.D. Girls Inter College, Bank Road Gorakpur - 273 001. • Guwahati: 1st Floor, Bajrangbali Building, Near Bora
Service Station, GS Road, Guwahati - 781 007. • Gwalior: 2nd Floor- Rajeev Plaza, Jayendra Ganj, Lashkar, Gwalior, M.P.- 474 009. • Hubli: CTS 483/A1/A2, Gr floor, Sri Ram
Plaza, Club Road, Behind Kotak Mahindra Bank, Hubli - 580 023. • Hyderabad: 8-2-596 Karvy Plaza, Avenue 4, Street No.1, Banjara Hills, Hyderabad - 500 034. • Indore: 19/1,
New Palasia, Balaji Corporate-203, 204 & 205, 2nd Floor, Above ICICI Bank, Near Curewell Hospital, Janjeerwala Square, Indore, Madhya Pradesh - 452 001. • Jabalpur: 43,
Naya Bazar, Opposite shyam talkies Jabalpur (M.P.) 482 001. • Jaipur: S-16 A, 3Rd Floor Land Mark, Opposite Jaipur Club Mahavir Marg, C- Scheme Jaipur - 302 001.
• Jamshedpur: 2nd Floor, R R Square, SB Shop Area, Near Reliance Foot Print & Hotel - BS Park Plaza, Main Road, Bistpur,Jamshedpur 831001. • Jodhpur: 203, Modi Arcade;
Chupasni Road, Jodhpur - 342 001. • Kanpur: 15/46,Ground Floor, Opp: Muir Mills, Civil Lines, Kanpur - 208 001. • Kolhapur: 605/1/4 E Ward, Near Sultane Chambers,
Shahupuri 2nd Lane Kolhapur - 416 001. • Kolkata: 166A, Rashbehari Avenue, 2nd Floor Near Adi Dhakeshwari Bastralaya OPP- Fortis Hospital Kolkata - 700 029. • Lucknow:
1st Floor, A. A. Complex, Thaper House, 5 Park Road, Hazratganj, Lucknow - 226 001. • Ludhiana: SCO - 136, First Floor Above Airtel Show Room, Feroze Gandhi Market,
Ludhiana - 141 001. • Madurai: Rakesh Towers, 30-C, Bye Pass Road Ist Floor, Opp Nagappa Motors, Madurai - 625 010. • Mumbai: Office number: 01/04 24/B, Raja Bahadur
Compound Ambalal Doshi Marg, Behind Bombay Stock Exchange,Fort Mumbai - 400 001. • Muzaffarpur: 1St Floor, Uma Market, Near Thana Gumti, Motijheel, Muzaffarpur,
Bihar - 842 001. • Nagpur: Plot No.2/1, House no. 102/1, Mangaldeep Apartment, Mata Mandir road, opp. Khandelwal Jewellers, Dharampeth, Nagpur - 440 010. • Nasik:
S-12, Second Floor, Suyojit Sankul, Sharanpur Road Nasik - 422 002. • New Delhi: 305, 3rd Floor New Delhi House, Bara Khamba Road Connaught Place New Delhi - 110 001.
• Noida: 307 Jaipuria Plaza; D 68 A, 2nd Floor Opp Delhi Public School, Sector 26 Noida - 201 301. • Panipat: 1st Floor, Krishna Tower Above Amertex, G.T. Road, Panipat - 132
103. • Panjim: City Business Centre, Coelho Pereira Building Room Nos.18,19 & 20 Dada Vaidya Road, Panjim - 403 001. • Patna: 3A, 3rd floor, Anand tower Beside chankya
cinema hall; Exhibition road Patna - 800 001. • Pune: Mozaic Bldg, CTS No.1216/1, Final Plot No.576/1 TP, Scheme No.1, F C Road, Bhamburda, Shivaji Nagar, Pune - 411 004.
• Raipur: Room No. TF 31, 3 Rd Floor, Millennium Plaza Behind Indian Coffee House, G E Road, Raipur - 492 001. • Rajkot: 104, Siddhi Vinayak Complex Dr Yagnik Road, Opp
Ramkrishna Ashram Rajkot - 360 001. • Ranchi: Room No. 307, 3Rd Floor, Commerce Towers, Beside Mahabir Towers Main Road Ranchi - 834 001. • Shillong: Mani Bhawan,
Lower Thana Road, Police Bazar, Shillong - 793 001. • Siliguri: Nanak Complex, Near Church Road, Sevoke Road, Siliguri - 734 001. • Solapur: Block No. 06, Vaman Nagar, Opp. D-
Mart, Jule Solapur, Solapur, Maharashtra - 413004. • Surat: G-6 Empire State Building, Near Parag House,Udhna Darwaja Ring Road Surat - 395 002. • Ujjain: 101, Aastha
Tower, 13/1, Dhanwantri Marg, Free Gunj Ujjain - 456 010. • Varanasi: D-64/132, KA 1st Floor, Anant Complex, Sigra, Varanasi - 221 010. • Vijayawada: 39-10-7, Opposite
Municipal Water Tank, Labbipet, Vijayawada - 520 010. • Visakhapatnam: Door No: 48-8-7, Dwaraka Dimond, Ground Floor, Srinagar, Visakhapatnam - 530016.
Karvy Computershare Private Limited Branches - Investor Service Centers (ISC's)
AMC Website: www.boiaxa-im.com is also an Investor Service Centre (for online transactions)
BOI AXA Investment Managers’ Branches - Investor Service Centers (ISC's)
51, 5th Floor, East Wing, Kalpataru Synergy, Opp. Grand Hyatt, Vakola, Santacruz (E), Mumbai - 400 055
Toll free number : 1800-103-2263 • Alternate number : 020 - 40112300 • Website : www.boiaxa-im.com • Email : [email protected]
BOI AXA Investment Managers Pvt. Ltd.(Investment Manager for BOI AXA Mutual Fund)
23

PRODUCT SUITE
Mutual Fund investments are subject to market risks, read all scheme related documents carefully.
Tenure
Risk
Ret
urn
s
Low
Me
diu
mH
igh
Low Medium High
0 - 1 Year 1 - 3 Years 3 - 5 Years
BOI AXA Equity Fund (An Open-Ended Equity Fund)
BOI AXA Equity Debt Rebalancer Fund(An Open-Ended Dynamic Scheme)
BOI AXA Regular Return Fund (An Open-Ended Income Scheme)
BOI AXA Short Term Income Fund (An Open-Ended Income Scheme)
BOI AXA Treasury Advantage Fund (An Open-Ended Income Scheme)
BOI AXA Liquid Fund (An Open-Ended Liquid Scheme)
Refer Page No. 22 for product labelling
BOI AXA Focused Infrastructure Fund (An Open-Ended Equity Scheme)
BOI AXA Tax Advantage Fund (An Open-Ended Equity Linked Savings Scheme)
BOI AXA Corporate Credit Spectrum Fund(An Open-Ended Debt Scheme)