high resolution weather radar through ...boonleng/pdf/ams08_albert_134127.pdfp1.15 1 high resolution...
TRANSCRIPT

P1.15 1
HIGH RESOLUTION WEATHER RADAR THROUGH PULSE COMPRESSION
T. A. Alberts1 ,∗, P. B. Chilson1 , B. L. Cheong1 , R. D. Palmer1 , M. Xue1 ,2
1 School of Meteorology, University of Oklahoma, Norman, Oklahoma, USA2 Center for Analysis and Prediction of Storms, Norman, Oklahoma, USA
Abstract
In order to evaluate pulse compression for use inphased array weather radar systems, modifications tothe Time-Series Weather Radar Simulator have beenmade which incorporate phase-coding into its function-ality. This allows for evaluating the performance of var-ious pulse compression schemes under controlled con-ditions. Barker-coded pulses with matched and mis-matched filters were examined in relation to uncodedpulses to determine the performance of the codes withregard to errors in estimating equivalent reflectivity, ra-dial velocity, and spectral width. The 13-bit Barker codewith a mismatched filter provided the most accurate esti-mations due to superior Integrated Sidelobe Level (ISL)suppression capability.
1. INTRODUCTION
With the current trend towards fielding phased arrayradars that utilize low peak-power T/R modules, meth-ods of recovering potentially lost performance are beingexamined in greater detail. As such, weather radars thatincorporate pulse compression technologies are beinganalyzed to provide equivalent or better performance tothose currently in use.
As a phased array weather radar that is capable of incor-porating pulse compression was not available, a simpli-fied framework was created in which the effects of pulsecompression on radar returns from meteorological tar-gets could be tested and evaluated. This was completedby leveraging the work by Cheong et al. [2006] and Xueet al. [2003] whereby a weather radar simulator inte-grates output from the Advanced Regional PredictionSystem (ARPS) to initialize itself. The ultimate goal ofthis research is to identify promising waveform and filtercombinations that could offset the loss in peak trans-mitting power in the Multifunction Phased Array Radarbeing developed through the National Severe StormsLaboratory [Forsyth and et al, 2006] and [Zrnic et al.,
∗ Corresponding author address: Timothy Alberts, Univer-sity of Oklahoma, School of Meteorology, 120 David L. BorenBlvd., Rm 4631, Norman, OK 73072-7307; e-mail: [email protected]
2007]. This paper focuses on utilizing Barker codes inthe Time-Series Weather Radar Simulator (TSWRS) tobaseline the functionality and performance of a limitedset of pulse compression schemes.
2. BACKGROUND
2.1. Pulse Compression
Pulse compression involves transmitting a coded, wide-band signal and compressing the return signal throughfiltering, which results in increased signal power andenhanced range resolution. Phase codes partition thetransmitted pulse into equal segments, or subpulses,and then switch the phase of the signal at specified in-tervals. In particular, binary phase codes switch thephase between two values, usually 0 and π. Theamount of compression possible is equivalent to thetime-bandwidth product (BT) of the code, which is theproduct of the signal bandwidth and signal total dura-tion. Bandwidth of a phase-coded signal is calculatedvia B=1/τ where τ is taken to be the code subpulselength. The returned signal power increase is propor-tional to the code length while the range resolution isinversely related to bandwidth as shown in Eq. 1. Thisimplies that decreasing subpulse duration results in acorresponding enhancement in range resolution.
∆R =c
2B(1)
The weakness of such systems is in the creationof range sidelobes which are artifacts produced bythe compression process whereby returns from otherranges contaminate the signal at the desired range.The resulting output can cause erroneous estimationsof reflectivity, radial velocity, and spectral width. Me-teorological applications have the issue of measuringwidely distributed phenomena, amplifying the need foradequate ISL suppression. In particular, Barker codeswith matched filters have uniformly distributed sidelobesabout the mainlobe [Nathanson, 1999] which is higherthan the sidelobes by a factor equal to the code length.For example, a 5-bit Barker code in conjunction with a

P1.15 2
matched filter will produce a mainlobe 5 times higherthan the sidelobes.
Using output of this type we can calculate two metricsthat describe the performance of the filtering process.The first metric is the Integrated Sidelobe Level (ISL),as shown in Eq. 2, which compares the total power con-tained within the sidelobes to the mainlobe. The secondmetric is the Peak Sidelobe Level (PSL), calculated viaEq. 3, which compares the sizes of the highest sidelobeto the size of the mainlobe. In both of these equations,x0 refers to the mainlobe magnitude while xi refers to allother output range sidelobes except the mainlobe. Im-provement for both metrics is indicated by a reductionin their respective values. Errors also can be producedby wind velocities within the pulse width but they are ofmuch smaller magnitude than those produced by reflec-tivity gradients at these transmitting frequencies.
ISL = 10 log∑i=1
x2i
x20
(2)
PSL = 10 log[max(xi)2
x20
](3)
2.2. Radar Simulator
Data were generated using the Time-Series WeatherRadar Simulator (TSWRS) created by Cheong et al.[2006]. The TSWRS is a 3-dimensional radar simula-tor consisting of an ensemble of thousands of scatterersplaced within the field of view of the virtual radar. It iscapable of operating in a dish mode akin to a WSR-88Dweather radar as well as in a phased array mode. Themeteorological fields used as input to the simulator cor-respond to output data from the Advanced Regional Pre-diction System (ARPS) numerical simulation model de-veloped at the Center for the Analysis and Prediction ofStorms (CAPS) at OU. The spatial and temporal resolu-tion of the ARPS output used in this study was 25 m and1 s, respectively. To begin the simulation process, scat-terer characteristics are initialized from a known ARPSdata set. At the next time step, the scatterer positionsare updated according to the wind field as well as theircorresponding properties at their new locations. The re-turn signal amplitude and phase from each scatterer isthen processed via Monte Carlo integration to calculatetime series of the desired meteorological parameters.The test case for all simulations consisted of 99 imagesrepresenting a small time segment of a tornadic super-cell thunderstorm as modeled by the ARPS model. Datawere gathered using the dish mode of the TSWRS op-erating in the S-band at 3.2 GHz. The pulse width was
fixed at 1.57µs with a pulse repetition interval of 1 ms,giving an unambiguous range and velocity of 150 kmand 23.5 m/s respectively.
2.3. Simulation Procedure
The simulation begins with the input of ARPS data intothe TSWRS and the initialization of the scatterer prop-erties. For the cases performed, 30,000 scatterers wereused for the standard resolution case while cases in-corporating pulse compression increased the number ofscatterers that would result in the same average scat-terer density of 20 per resolution volume. Next the pulseis propagated throughout the radar field of view on agate-by-gate basis as shown in Figure 3. The radar thenreceives the returns from the scatterers and composesthe signal. Mathematically, this step can be describedby Eq. 4, taken from Mudukutore and Chandrasekar[1998].
y[i, j] =∑
∀m+n−1=j
xi[m,n] (4)
After the signal is composed, the simulator decodes thedata through the filtering process to produce the dataused for estimation of the reflectivity, radial velocity, andspectral width via the autocovariance method. A signal-to-noise ratio of 70 dB was used for all conditions.
3. RESULTS
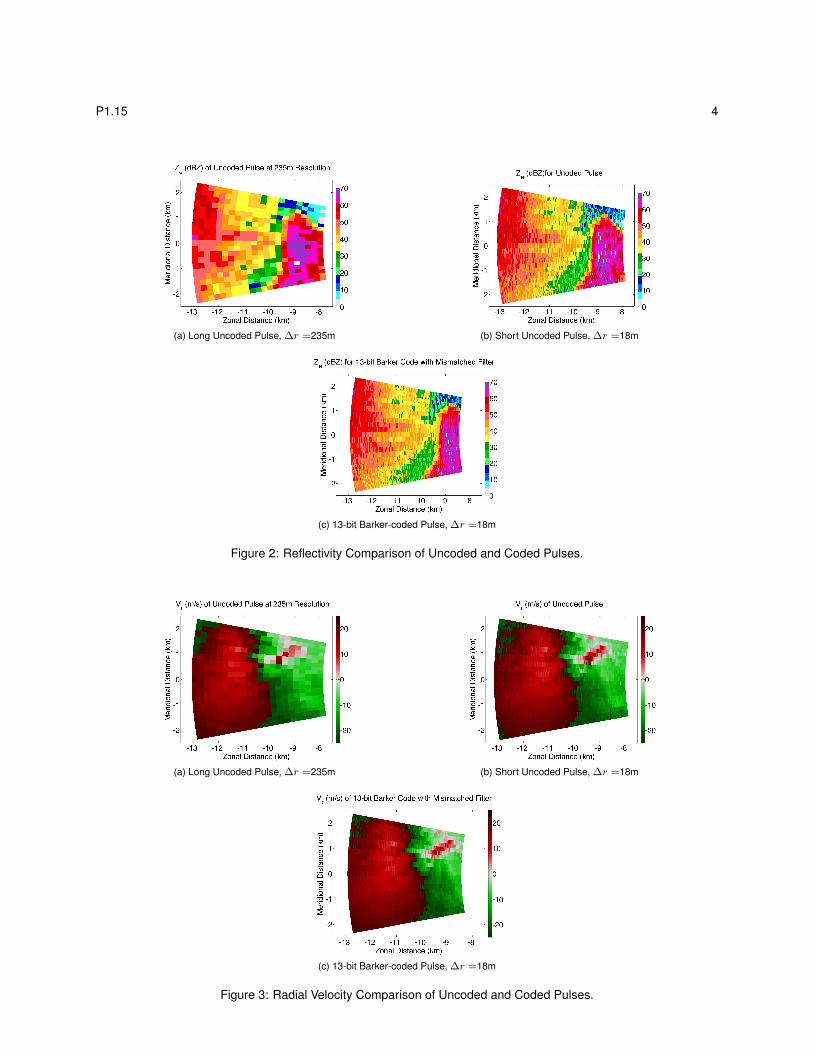
Using the method described above, Barker codes wereincorporated into the simulator for testing the basic func-tionality of the simulator under controlled conditions. Re-flectivity factor, radial velocity, and spectral width werecalculated for uncoded and coded pulses at the samerange resolution in order to evaluate error performanceof the pulse compression scheme. For all cases, the 5-bit Barker code provides a range resolution of 47m whilethe 13-bit code gives a range resolution of 18m. Figures2 and 3 illustrate the resolution enhancement obtainedby using a 13-bit Barker code with a 25 element mis-matched filter. In both figures, plot (a) is the standard235m resolution case while plots (b) and (c) are 18mresolution cases obtained by an uncoded pulse and aBarker-coded pulse respectively. In these plots, a tor-nado is located in the upper right corner and is mostreadily seen by the large gate-to-gate shear in Figure3 where the large red area on the left is aliased. Plot(c) for each figure has a reduced field of view in termsof minimum and maximum range. The minimum range

P1.15 3
xn=∑[I + jQ]
x1=[1,1]
x2=[2,2]+[1,2]
x3=[3,3]+[2,3]+[1,3]
x4=[4,4]+[3,4]+[2,4]
x5=[5,5]+[4,5]+[3,5]
x6=[5,6]+[4,6]
x7=[6,7]
Unusable
Data
Usable
Data
Unusable
Data
Signal Composition
Data
5
4
3
Sample Time
-1 +3+2x3=
-2 +4+3x4=
-3 +5+4x5=
Multiplication and
Cross Correlation with Code
Decoding
Decoded data
for gate 3
7 -
+
+
5
+
4
-
+
+
3
+
-
+
2
-
++
-
+
1
6
5
4
3
2
1
Gate Number
Sam
ple
Tim
e
[gate #, sample #]
Pulse Propagation
RadarReceivesReturns
+
-
++
+-++-
++-
++-
x5x3 x4
++-
Figure 1: Summary of Simulation Procedure with Matched Filter
increase is due to data needing to fill the mismatched fil-ter which is common to all pulse compression schemeswhile the reduction of maximum range is the result ofthe pulse exiting the domain area which again results ina filter that is not filled.
Inspecting plots (b) and (c) in Figures 2 and 3 illustratesthat the Barker code process gives reasonable agree-ment. However, the pulse compression scheme dis-tributes the sharp reflectivity gradient found on the rightside of the plot over several range gates. This is a re-sult of the decoding process which can be alleviated bydecreasing the ISL as this decreases the amount of in-terference caused by targets at other ranges. The ef-fect of reducing ISL is illustrated in Figure 4 where thetop set of plots use a matched filter for decoding whilethe bottom plots use a mismatched filter. In all plots,the greatest error coincides with the strong reflectivitygradient around a zonal distance of -9 km but the mis-matched filter reduces the mean error from 0.74 dBZfor the matched filter to 0.39 dBZ while also reducingthe standard deviation from 2.55 dBZ to 1.81 dBZ. Table1 summarizes the error performance in terms of meanand standard deviation of various code/filter combina-tions along the same radial at the same time step. Itis shown that using longer codes and mismatched fil-ters drives ISL downward and hence error. This sametrend was also seen in errors for velocity and spectralwidth. Errors due to velocity also occurred but were of
Table 1: Error Statistics for Barker-coded Pulses
Code Filter µ (dBZ) σ (dBZ)5-bit Matched 1.46 3.765-bit Mismatched 0.87 3.5213-bit Matched 0.74 2.5513-bit Mismatched 0.39 1.81
significantly smaller magnitude than those resulting fromreflectivity.
4. CONCLUSIONS/FUTURE WORK
A successful modification to the TSWRS was pre-sented that produces an increase in range resolutionthrough pulse compression. The simulator currently in-corporates Barker phase codes with matched and mis-matched filters which show good performance with re-spect to reflectivity, radial velocity, and spectral width.Large errors did occur where strong reflectivity gradientswere present. This highlights the need to explore othercode/filter combinations that can suppress ISL even fur-ther. This can be achieved by changing code type, codelength, filtering method, or any combination of these.However, as code length increases, the Doppler toler-
P1.15 4
(a) Long Uncoded Pulse, ∆r =235m (b) Short Uncoded Pulse, ∆r =18m
(c) 13-bit Barker-coded Pulse, ∆r =18m
Figure 2: Reflectivity Comparison of Uncoded and Coded Pulses.
(a) Long Uncoded Pulse, ∆r =235m (b) Short Uncoded Pulse, ∆r =18m
(c) 13-bit Barker-coded Pulse, ∆r =18m
Figure 3: Radial Velocity Comparison of Uncoded and Coded Pulses.

P1.15 5
Figure 4: Reflectivity Comparison Along a Radial.
ance of the signal decreases as moving targets can be-gin to significantly alter the phase of the signal, causingadditional errors that need to be mitigated.
Future iterations using this simulator involve testing andevaluation of additional waveform designs and filteringmethods. It is also of great interest to expand the do-main size beyond what is currently capable. Ideally wewould like to recover resolution back to the WSR-88Dstandard but are currently limited to only 5 km of data.Transmitting a considerably longer pulse would reducethe number of range gates that could be fully decodedto show a valid comparison between an -88D and aphased array radar incorporating pulse compression.
5. ACKNOWLEDGEMENTS
Funding for this work was provided under NOAA coop-erative agreement NA17RJ1227. We would also like tothank all those who provided comments to improve thispaper.
References
Cheong, B. L., R. D. Palmer, and M. Xue, 2006: A Time-Series Weather Radar Simulator Based on High-Resolution Atmospheric Models. Submitted to Jour-nal of Atmospheric and Oceanic Technology.
Forsyth, D. E., and et al, 2006: The National WeatherRadar Testbed (Phased-Array). in 32nd Conferenceon Radar Meteorology.
Mudukutore, A. S., and V. Chandrasekar, 1998: PulseCompression for Weather Radars. IEEE Transactionson Geoscience and Remote Sensing, 36(1).
Nathanson, F. E., 1999: Radar Design Principles.Prentice-Hall.
Xue, M., D.-H. Wang, J.-D. Gao, K. Brewster, andK. K. Droegemeier, 2003: 2003: The Advanced Re-gional Prediction System (ARPS), storm-scale nu-merical weather prediction and data assimilation. Me-teorology and Atmospheric Physics, 82, 139–170.
Zrnic, D. S., J. F. Kimpel, D. E. Forsyth, A. Shapiro,G. Crain, R. Ferek, J. Heimmer, W. Benner, T. J. Mc-Nellis, and R. J. Vogt, 2007: Agile-beam Phase Ar-ray Radar for Weather Observations. BAMS, 88(11),1753–1766.