high-resolution structure and dynamics of mitochondrial
TRANSCRIPT

Parey et al., Sci. Adv. 7, eabj3221 (2021) 12 November 2021
S C I E N C E A D V A N C E S | R E S E A R C H A R T I C L E
1 of 12
B I O C H E M I S T R Y
High-resolution structure and dynamics of mitochondrial complex I—Insights into the proton pumping mechanismKristian Parey1,2,3†‡, Jonathan Lasham4‡, Deryck J. Mills2§, Amina Djurabekova4, Outi Haapanen4, Etienne Galemou Yoga1,3, Hao Xie5, Werner Kühlbrandt2, Vivek Sharma4,6*, Janet Vonck2*, Volker Zickermann1,3*
Mitochondrial NADH:ubiquinone oxidoreductase (complex I) is a 1-MDa membrane protein complex with a cen-tral role in energy metabolism. Redox-driven proton translocation by complex I contributes substantially to the proton motive force that drives ATP synthase. Several structures of complex I from bacteria and mitochondria have been determined, but its catalytic mechanism has remained controversial. We here present the cryo-EM structure of complex I from Yarrowia lipolytica at 2.1-Å resolution, which reveals the positions of more than 1600 protein-bound water molecules, of which ~100 are located in putative proton translocation pathways. Another structure of the same complex under steady-state activity conditions at 3.4-Å resolution indicates conformational transitions that we associate with proton injection into the central hydrophilic axis. By combining high-resolution structural data with site-directed mutagenesis and large-scale molecular dynamic simulations, we define details of the proton translocation pathways and offer insights into the redox-coupled proton pumping mechanism of complex I.
INTRODUCTIONMitochondrial NADH:ubiquinone oxidoreductase (complex I) is the largest and most intricate membrane protein complex of the re-spiratory chain (1–4). Complex I couples the transfer of electrons from reduced nicotinamide adenine dinucleotide (NADH) to ubiquinone with the translocation of protons across the inner mito-chondrial membrane, with a stoichiometry of 4H+ per NADH (5–8). Redox-linked proton translocation by complex I contributes substantially to the proton motive force that drives ATP synthase. Complex I dysfunction is associated with neuromuscular and neu-rodegenerative diseases (9, 10). The structure of complex I has been determined by x-ray crystallography (11, 12) and cryo–electron mi-croscopy (cryo-EM) at increasing resolution (13–19), but the mo-lecular details of the coupling mechanism are not fully understood and remain controversial.
The L-shaped enzyme complex has three functional modules. The NADH oxidation module (N module) and ubiquinone (Q) re-duction module (Q module) together constitute the peripheral arm. The membrane arm has a proximal and a distal proton transloca-tion module (PP and PD modules). The Q module is located above the membrane plane so that the hydrophobic quinone substrate has
to pass through a ~35-Å tunnel to reach the Q reduction site near FeS cluster N2. In the P module, proton translocation pathways from the negative (N) side to the positive (P) side of the membrane were assigned to subunits ND2, ND4, and ND5 that resemble Mrp-type sodium-proton antiporter subunits (20). A fourth proton channel has long been anticipated, but its position remains un-known. It is generally accepted that Q reduction releases the energy for proton translocation, but the proton pumping sites are up to 200 Å away from the Q reduction site. Several lines of evidence indi-cate that a set of conserved loops at the interface between the Q and PP modules plays a key role in energy conversion (12, 15, 16, 21–23). The loop connecting transmembrane helices (TMHs) 5 and 6 of membrane subunit ND1 (the ND1 loop) harbors a cluster of strictly conserved acidic residues close to the Q reduction site and lines part of the Q tunnel. A chain of charged residues in the membrane- embedded central subunits forms an extended hydrophilic axis that connects ND1 with the proton pumping sites. Recent cryo-EM structures at 2.7-Å (15) and 2.5- to 2.9-Å (16) resolution indicated water molecules that define putative proton translocation pathways in the P module.
The dynamics of complex I have been studied by molecular sim-ulations (4, 24, 25) and by determining its structure in different functional states (16, 26–28). For mammalian and plant complex I, a change of the relative orientation of the peripheral arm and mem-brane arm was found in conjunction with well-defined changes in several central subunits (16, 19, 27, 29). We have previously ana-lyzed substrate binding to complex I during steady-state activity (26), but at the time, the resolution of our cryo-EM structure did not allow us to identify molecular changes in detail.
As a characteristic feature, complex I undergoes a reversible transition between an active (A) and a deactive (D) form (30). The A form converts into the D form when complex I is idle in the ab-sence of substrates. The reconversion into the A form takes several turnover cycles. Deactivation of complex I is thought to protect
1Institute of Biochemistry II, University Hospital, Goethe University, 60590 Frankfurt am Main, Germany. 2Department of Structural Biology, Max Planck Institute of Bio-physics, 60438 Frankfurt am Main, Germany. 3Centre for Biomolecular Magnetic Resonance, Institute for Biophysical Chemistry, Goethe University, 60438 Frankfurt am Main, Germany. 4Department of Physics, University of Helsinki, 00014 Helsinki, Finland. 5Department of Molecular Membrane Biology, Max Planck Institute of Biophysics, 60438 Frankfurt am Main, Germany. 6HiLIFE Institute of Biotechnology, University of Helsinki, 00014 Helsinki, Finland.*Corresponding author. Email: [email protected] (V.S.); [email protected] (J.V.); [email protected] (V.Z.)†Present address: Department of Structural Biology, University of Osnabrück, 49076 Osnabrück, Germany.‡These authors contributed equally to this work.§Deceased.
Copyright © 2021 The Authors, some rights reserved; exclusive licensee American Association for the Advancement of Science. No claim to original U.S. Government Works. Distributed under a Creative Commons Attribution NonCommercial License 4.0 (CC BY-NC).
Dow
nloaded from https://w
ww
.science.org on Decem
ber 01, 2021
Parey et al., Sci. Adv. 7, eabj3221 (2021) 12 November 2021
S C I E N C E A D V A N C E S | R E S E A R C H A R T I C L E
2 of 12
against excessive reactive oxygen species (ROS) formation during ischemia/reperfusion (31), but the structural basis of the A/D tran-sition is not clear. Biochemical analysis has shown that complex I purified from Yarrowia lipolytica is in the D form (17) as a default ground state. The energy barrier between A and D forms in fungal complex I is smaller (32), and deactivation appears to be less strin-gent than in the mammalian complex, because structural hallmarks of the D form described for mammalian complex I, including the pronounced weakening of loop densities in and around the Q bind-ing site (27), and the notable relocation of TMH4 in ND6 (16) are not observed.
Here, we present the 2.1-Å resolution structure of respiratory complex I from the yeast Y. lipolytica in the D form, and a 3.4-Å resolution structure of the same complex captured under turnover conditions. Our data provide a comprehensive picture of protein- bound water molecules in the P module. Under turnover condi-tions, we observe structural changes in the ND1 subunit that forms the link between Q and P modules. Large-scale atomistic molecular dynamics (MD) simulations based on our high-resolution structure reveal how the protonation states of key amino acid residues con-trol the hydration and dynamics of regions that are crucial for the coupling mechanism.
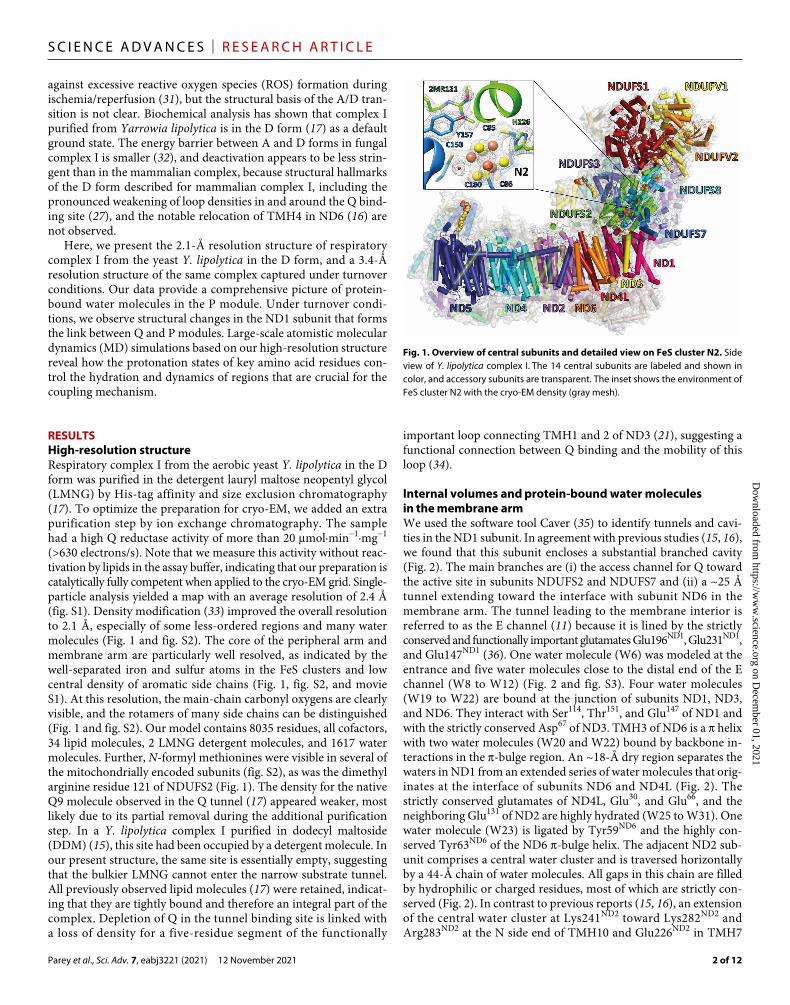
RESULTSHigh-resolution structureRespiratory complex I from the aerobic yeast Y. lipolytica in the D form was purified in the detergent lauryl maltose neopentyl glycol (LMNG) by His-tag affinity and size exclusion chromatography (17). To optimize the preparation for cryo-EM, we added an extra purification step by ion exchange chromatography. The sample had a high Q reductase activity of more than 20 mol·min−1·mg−1 (>630 electrons/s). Note that we measure this activity without reac-tivation by lipids in the assay buffer, indicating that our preparation is catalytically fully competent when applied to the cryo-EM grid. Single- particle analysis yielded a map with an average resolution of 2.4 Å (fig. S1). Density modification (33) improved the overall resolution to 2.1 Å, especially of some less-ordered regions and many water molecules (Fig. 1 and fig. S2). The core of the peripheral arm and membrane arm are particularly well resolved, as indicated by the well-separated iron and sulfur atoms in the FeS clusters and low central density of aromatic side chains (Fig. 1, fig. S2, and movie S1). At this resolution, the main-chain carbonyl oxygens are clearly visible, and the rotamers of many side chains can be distinguished (Fig. 1 and fig. S2). Our model contains 8035 residues, all cofactors, 34 lipid molecules, 2 LMNG detergent molecules, and 1617 water molecules. Further, N-formyl methionines were visible in several of the mitochondrially encoded subunits (fig. S2), as was the dimethyl arginine residue 121 of NDUFS2 (Fig. 1). The density for the native Q9 molecule observed in the Q tunnel (17) appeared weaker, most likely due to its partial removal during the additional purification step. In a Y. lipolytica complex I purified in dodecyl maltoside (DDM) (15), this site had been occupied by a detergent molecule. In our present structure, the same site is essentially empty, suggesting that the bulkier LMNG cannot enter the narrow substrate tunnel. All previously observed lipid molecules (17) were retained, indicat-ing that they are tightly bound and therefore an integral part of the complex. Depletion of Q in the tunnel binding site is linked with a loss of density for a five-residue segment of the functionally
important loop connecting TMH1 and 2 of ND3 (21), suggesting a functional connection between Q binding and the mobility of this loop (34).
Internal volumes and protein-bound water molecules in the membrane armWe used the software tool Caver (35) to identify tunnels and cavi-ties in the ND1 subunit. In agreement with previous studies (15, 16), we found that this subunit encloses a substantial branched cavity (Fig. 2). The main branches are (i) the access channel for Q toward the active site in subunits NDUFS2 and NDUFS7 and (ii) a ~25 Å tunnel extending toward the interface with subunit ND6 in the membrane arm. The tunnel leading to the membrane interior is referred to as the E channel (11) because it is lined by the strictly conserved and functionally important glutamates Glu196ND1, Glu231ND1, and Glu147ND1 (36). One water molecule (W6) was modeled at the entrance and five water molecules close to the distal end of the E channel (W8 to W12) (Fig. 2 and fig. S3). Four water molecules (W19 to W22) are bound at the junction of subunits ND1, ND3, and ND6. They interact with Ser114, Thr151, and Glu147 of ND1 and with the strictly conserved Asp67 of ND3. TMH3 of ND6 is a helix with two water molecules (W20 and W22) bound by backbone in-teractions in the -bulge region. An ~18-Å dry region separates the waters in ND1 from an extended series of water molecules that orig-inates at the interface of subunits ND6 and ND4L (Fig. 2). The strictly conserved glutamates of ND4L, Glu30, and Glu66, and the neighboring Glu131 of ND2 are highly hydrated (W25 to W31). One water molecule (W23) is ligated by Tyr59ND6 and the highly con-served Tyr63ND6 of the ND6 -bulge helix. The adjacent ND2 sub-unit comprises a central water cluster and is traversed horizontally by a 44-Å chain of water molecules. All gaps in this chain are filled by hydrophilic or charged residues, most of which are strictly con-served (Fig. 2). In contrast to previous reports (15, 16), an extension of the central water cluster at Lys241ND2 toward Lys282ND2 and Arg283ND2 at the N side end of TMH10 and Glu226ND2 in TMH7
Fig. 1. Overview of central subunits and detailed view on FeS cluster N2. Side view of Y. lipolytica complex I. The 14 central subunits are labeled and shown in color, and accessory subunits are transparent. The inset shows the environment of FeS cluster N2 with the cryo-EM density (gray mesh).
Dow
nloaded from https://w
ww
.science.org on Decem
ber 01, 2021

Parey et al., Sci. Adv. 7, eabj3221 (2021) 12 November 2021
S C I E N C E A D V A N C E S | R E S E A R C H A R T I C L E
3 of 12
indicates a clear entry point for protons (Fig. 2). The Lys in TMH10 is also conserved in ND4, and the Lys-Arg motif is conserved in TMH10 of ND5 (fig. S4), suggesting similar N side entry portals for protons for all three subunits. Intriguingly, fewer water molecules were detected in subunits ND4 and ND5 than in ND2. Overall, the pattern of water molecules in ND4 resembles that in ND2, but gaps between water molecules or clusters are larger. Water molecules are found near the N side TMH10 Lys, but the pathway into the subunit interior is less clear. In ND5, which differs from ND2 and ND4 at the sequence level (fig. S4) (37), water molecules line up along the strictly conserved ND5 residues Glu144, Arg175, Asp178, and Lys226, while single water molecules reside close to conserved histidines (His251ND5 and His335ND5).
Overall, a previous study on Y. lipolytica complex I (fig. S3) (15) agrees with our structure, which is, however, substantially more complete and of considerably higher resolution, indicating the po-sitions of 99 water molecules in the central membrane arm subunits [as compared to 34 in (15)]. Moreover, our high-resolution structure
shows a clear proton input pathway from the N side and a contiguous horizontal network of waters and connecting amino acid side chains in ND2. In the mammalian complex, subunit ND5 was more hydrated, and similar numbers of water molecules were found in ND2 and ND4, but in ND2, a connection to the N side was not apparent (16).
Atomistic MD simulations of complex IFor a better insight into complex I dynamics, we performed atomis-tic MD simulations based on the 2.1-Å structure. We simulated two different protonation states of the enzyme (see table S2, fig. S5, and Computational methods). In state PN1, all titratable residues were modeled in their charged states, whereas in state PN2, the protona-tion state of side chains was taken from the pKa calculations (see table S3 and Computational methods). The MD simulations indi-cated that hydration of the E channel and the region between the channel and subunits ND3/ND6 depends on the charged state of the associated residues. Extensive hydration of this entire segment was observed only when all residues were modeled in their charged
Fig. 2. Protein-bound water molecules in the membrane arm. Side view of the central membrane arm subunits and central subunits NDUFS2 and NDUFS7 of the Q module; the internal volume (blue surface) represents the E channel and Q access pathway, and 99 water molecules (red spheres, see fig S3) were resolved in the transmembrane region and at the entrance of putative proton uptake pathways at the N side of the inner mitochondrial membrane. The left inset shows water molecules with interspersed hydrophilic and charged residues in ND2; the inset on the right shows a view of the -bulge region of TMH3 of ND6 from the matrix side; and residues interacting with water molecules with their carbonyl oxygens are labeled in italics. An ~18-Å dry region (dashed curve) separates the water cluster at ND1/ND3 from the water chain leading from ND4L to ND4.
Dow
nloaded from https://w
ww
.science.org on Decem
ber 01, 2021

Parey et al., Sci. Adv. 7, eabj3221 (2021) 12 November 2021
S C I E N C E A D V A N C E S | R E S E A R C H A R T I C L E
4 of 12
states (state PN1), whereas hydration dropped considerably in sev-eral regions upon charge neutralization of selected titratable resi-dues (state PN2), as shown in fig. S6 (A and B). A smaller number of water molecules observed in these map regions suggests a pre-ponderance of titratable residues in their charge-neutral state, so that dynamic water molecules might not be sufficiently immobilized by interaction with the protein. Analysis of water-residue hydrogen bonds and radial distribution functions show clear differences in water structure around a titratable residue in its neutral and charged states (fig. S7).
On the basis of pKa estimates (table S3), we found that all four titratable residues of the central hydrophilic axis Glu131, Lys211, Lys241, and Lys383 in ND2 are charged, whereas in ND4, Glu395, Lys252, and Glu142 are predicted to be neutral. As expected, the higher overall charge in subunit ND2 resulted in a higher hydration level, compared to subunit ND4 (Fig. 3A). PN2 state–based water occupancies are in excellent agreement with water positions from the high-resolution map for both the central hydrophilic axis and the N side pathway in ND2 (Fig. 3A and fig. S8). A similar water occupancy map and con-verged hydration profiles are also observed when MD simulations are performed with a different molecular mechanics force field (see fig. S9 and Computational methods). We analyzed the H-bonding connectivity in ND2 and found a remarkable, near-continuous hydrogen
bond network capable of long-range lateral proton transfer along this section of the central membrane arm (Fig. 3E). We note that the highly conserved residue Phe343 of TMH11 in ND4 interrupts the water chain between the hydrated central axis and the N side Lys299 (Fig. 3B). We therefore modeled the conformation state of TMH11 and charged state of the ND4 subunit in the same way as in ND2, where a higher level of hydration was observed between the N side and the central axis (Fig. 3A). Upon remodeling, we observed a rap-id hydration of the region (Fig. 3D) as in the ND2 subunit, suggest-ing a potential gating role of Phe343, which is conserved in all three antiporter-like subunits (fig. S4). In addition, in the ND5 subunit, which differs from ND2 and ND4 at the sequence level (fig. S4), the N side connection emerged at the conserved KR motif and continued toward His251 via Ser247 and stable water molecules (Fig. 3C). How-ever, the proton path was partly blocked between His251 and Lys339 by the conserved Phe343 residue, whereas from Lys339 onward, a continuous string of side chains and water molecules formed toward the P side. The conserved Phe in TMH11 and its equivalent in the other two antiporter modules may thus play an important role in preventing a proton short circuit between the two membrane sur-faces. Overall, the MD simulations and structural data suggest strongly that three antiporter-like subunits differ from each other with respect to conformation, charge, and hydration states.
Fig. 3. Hydration of antiporter-like subunits. (A) Water molecules resolved in the cryo-EM map (red spheres) and hydrated regions observed in MD simulations (gray mesh) in subunits ND5 (dark blue), ND4 (cyan), and ND2 (pink). The volumetric map (gray mesh, isovalue 0.15) was calculated from all replicas of simulation PN2 by select-ing water molecules within 6 Å from the labeled residues. (B) An overlay of ND2 and ND4 subunits with TMH11 and conserved Phe324/343, Lys282/299, and Lys241/252 residues highlighted. Because of the conformation of TMH11, Phe343 blocks the water-based N side connection in the ND4 subunit. Resolved structural waters (red spheres) are from subunit ND2. (C) N- and P side water/residue-based connections in the ND5 subunit from simulation PN1. The gray-colored volumetric map (isovalue 0.2) was calculated by selecting MD-based water molecules (oxygen atoms, red spheres) within 6 Å of selected residues. (D) Water wire and volumetric map (isovalue 0.2) from the N side to the central axis of the ND4 subunit after remodeling of the conserved Phe343 and associated TMH11 (table S2). (E) Simulation snapshot showing a continuous hydrogen bond network in subunit ND2 from simulation PN2. Yellow dashed lines indicate hydrogen bonds that meet the 3.6-Å distance and 30° angle criteria. Red and white sticks indicate water molecules.
Dow
nloaded from https://w
ww
.science.org on Decem
ber 01, 2021

Parey et al., Sci. Adv. 7, eabj3221 (2021) 12 November 2021
S C I E N C E A D V A N C E S | R E S E A R C H A R T I C L E
5 of 12
Our cryo-EM structures and MD simulations revealed substan-tial hydration in the central segments of subunits ND2 and ND4. The hydrated paths in the middle of the subunits connect to the N side of the membrane, as also observed in simulation studies of bac-terial complex I (38, 39). A proton transfer path between the central axis and the P side was not apparent in the structures or in any of the ND2/ND4 subunit simulations (fig. S10). In contrast, P side connectivity was clearly observed in the ND5 subunit (Fig. 3C and fig. S10). This is most likely due to the charged residues Asp397ND5, Glu401ND5, and Lys511ND5 closer to the P side that are only found in the ND5 subunit (Fig. 3C and fig. S4) but not in ND2/ND4. When the hydrophobic residues Phe396ND4 and Leu384ND2, which correspond to Asp397ND5 in the ND2/ND4 subunits, were changed to aspartate, we observed extensive hydration between the central segments of ND2/ND4 subunits and the P side (fig. S6, C to F). This suggests that hydrophobic residues in the ND2/ND4 subunits insu-late the hydrated central axis from the P side and prevent proton equilibration, thus conserving the electrochemical gradient.
While there is only one conserved Lys396/Asp397 pair in the ND5 homolog of the bacterial enzyme, mitochondrial complexes contain an additional ion pair (Glu401 and Lys511), which further adds to the hydration of this region (Fig. 3, A and C). The hydrated P side path in ND5 encompasses a unique lipid-protein architecture in which accessory subunits NDUFB2 and NDUFB3 bend the lipid bilayer (fig. S11). This unique lipid-protein arrangement is confined to the ND5 subunit and may, thus, be important in forming a proton exit route that is characteristic of this subunit only. We suggest that per-turbation of the lipid bilayer by the unique complex I architecture is crucial for proton pumping and exchange of the quinone substrate at subunits ND5 and ND1, respectively [see also (17, 34)].
Complex I under turnover conditionsWe previously reported an experimental strategy to capture complex I during steady-state NADH:decylbenzoquinone (DBQ) oxidoreduc-tase activity for cryo-EM analysis (26). By enzymatic recycling in a minimal respiratory chain consisting of complex I and a quinol ox-idase, this method ensures a sufficient supply of the oxidized hydro-phobic substrate and thus circumvents problems of low DBQ solubility at the concentrations required (>200 M). We now im-proved the resolution from 4.5 to 3.4 Å, which enabled us to build a model of 7921 residues, all cofactors, 33 lipids, and bound sub-strates in complex I under turnover conditions.
Overall, we observed a small shift of the PD module toward the matrix side and toward the PP module (fig. S12 and movie S2). The angle between the peripheral arm and membrane arm decreased slightly by about ~1°, corresponding to a 2- to 3-Å shorter distance between the distal ends of the two arms. At the junction of the two arms and toward the PD/PP interface, the map density of the turn-over map suggests a local loss of order and higher mobility of the protein structure in the interface region (fig. S12, E and F). Com-pared to mammalian complex I (16, 27), the change in angle be-tween the peripheral arm and membrane arm in the Y. lipolytica complex I is moderate (fig. S12, C and D), most likely because the Y. lipolytica complex I is less flexible. Note that we recently observed larger rearrangements of the two arms comparable to mammalian complex I in an inactive mutant of Y. lipolytica complex I (23).
A clear additional density in the NDUFV1 subunit enabled us to model an NADH molecule in electron transfer distance to the flavin mononucleotide (fig. S13, A and B). Another clear density in the Q
reduction site close to His95FS2 was modeled as the substrate qui-none head group (Fig. 4, A and B). His95FS2 and Tyr144FS2 are thought to act as ligands for Q during electron transfer from FeS cluster N2 in NDUFS7 (11, 28, 40, 41). In our model, the distance from the Q head group to Tyr144FS2 is 5 to 6 Å, which argues against a strong hydrogen bond. Met91FS7 points to the center of the Q head group, and Ser192FS2 is closer than 4 Å to one of the methoxy groups. The Q head group position agrees well with our previous observation (26) and with the recent structure of ovine complex I under turnover conditions (fig. S13C) (16) but differs from the crys-tal structure of Thermus thermophilus complex I (fig. S13D) (28). A comparison with the empty Q binding site of complex I reveals structural changes in the 12 loop of NDUFS2 that harbors the functionally important residues His91FS2 and His95FS2 and at posi-tions 78 to 81 of NDUFS7 (movie S3). This rearrangement narrows the distance between Gln90FS2 and Thr80FS7 and constricts the site.
For mammalian complex I, different functional states involve the transition of TMH3 in ND6 from a -bulge to a regular helix (16, 27, 29). It has recently been proposed that an uninterrupted water chain along the hydrophilic axis can form only when this he-lix is in the -helical conformation (16). However, TMH3 of ND6 clearly forms a -bulge helix in both our present structures of Y. lipolytica complex I. In our MD simulations based on the 2.1-Å resolution structure, we monitored transient changes in the region. Ile62ND6 was found to adopt a conformation that would tend to enhance local hydration (fig. S14). As a result, the dry ~18-Å gap (Fig. 2) is bridged by water molecules connecting the acidic residues of ND4L and ND3 (fig. S14, B and C), so that large-scale rearrange-ments such as the ↔ transition are not required in Y. lipolytica. Instead, conformational changes at the side-chain level may be suf-ficient to achieve lateral proton transfer through this route.
Conformational changes in membrane subunit ND1Subunit ND1 forms the major part of the membrane/peripheral arm interface and therefore must play a key role in the coupling mechanism. We observed clear conformational changes in TMH4 and in the TMH5-TMH6 loop of this subunit (Fig. 4 and movie S3). The TMH5-TMH6 loop contains the strictly conserved acidic resi-dues Asp203ND1, Glu206ND1, Glu208ND1, and Glu210ND1 and is re-solved in both our structures. In contrast, the loop is disordered in the open state (16, 29) and in the D form (27) of mammalian com-plex I. Note that, while previous reports compared conformational changes of mouse and Y. lipolytica complex I (15), we now describe the reorganization of the ND1 TMH5-TMH6 loop in one and the same enzyme complex.
In our high-resolution structure, the strictly conserved Arg274FS2 and Arg302ND1closely interact with Glu208ND1 (Fig. 4C). Under turn-over conditions, the C-terminal part of TMH4 bends, and the salt bridge between the strictly conserved Arg138ND1 at the helix kink and Glu107FS2 in subunit NDUFS2 opens (Fig. 4D). Because this helix cannot bend without clashing with the ND1 loop near position 210, the loop must rearrange. The strictly conserved Glu210ND1 moves into the Arg274FS2/Arg302ND1 binding pocket, replacing Glu208ND1, which shifts more than 9 Å toward the Q tunnel. This results in a roughly triangular arrangement of Asp203ND1, Glu206ND1, and Glu208ND1 close to the branch point of Q tunnel and E channel. The conformation is similar to that observed in the closed state (16) and the A form (27) of mammalian complex I. The almost complete loss of activity after exchanging Glu107FS2 and Arg274FS2 by site-directed
Dow
nloaded from https://w
ww
.science.org on Decem
ber 01, 2021

Parey et al., Sci. Adv. 7, eabj3221 (2021) 12 November 2021
S C I E N C E A D V A N C E S | R E S E A R C H A R T I C L E
6 of 12
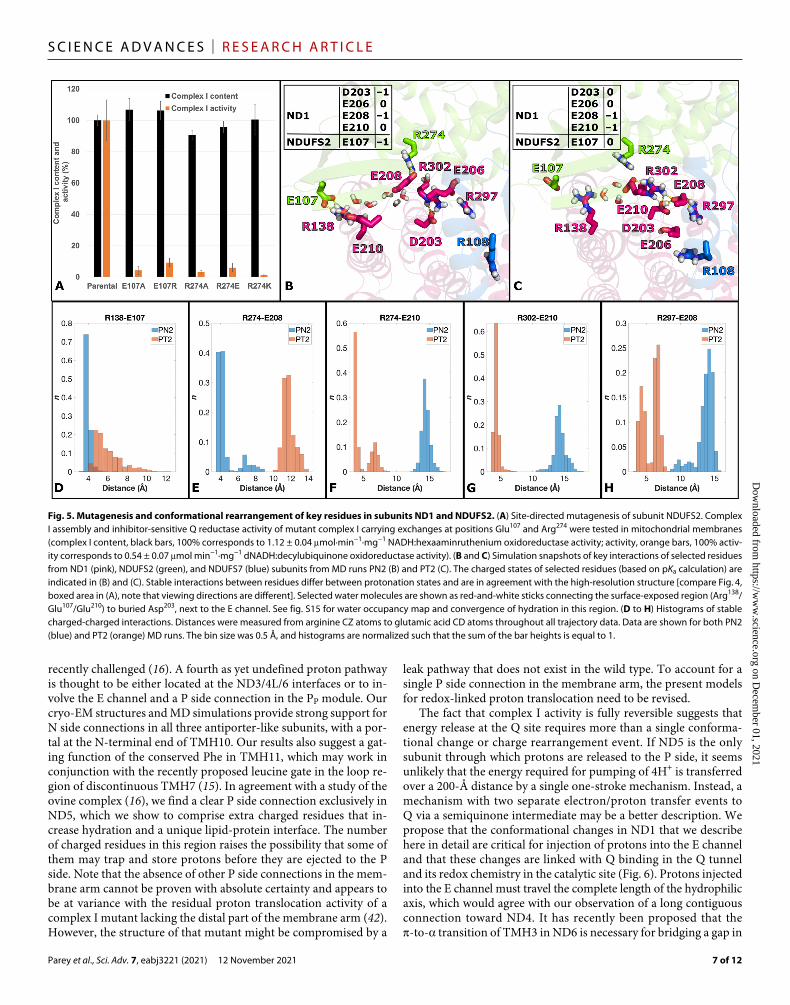
mutagenesis showed that both contact points between ND1 and NDUFS2 are critical for function (Fig. 5A). Note that ND1 cannot be mutagenized because it is encoded by mitochondrial DNA.
To investigate the observed structural changes in the TMH5-TMH6 loop, we performed MD simulations of the turnover structure (table S2). In the first setup, PT1, all titratable amino acid residues were kept in the standard protonation state. In the second setup, PT2, protonation states were taken from pKa calculations (tables S2 and S3). With these protonation states, the simulation recapitulated the inter-actions observed in the turnover structure very well (Fig. 5). Hydra-tion analysis revealed that the conserved acidic residues Glu107FS2/Glu210ND1 at the protein surface are connected by water molecules to the buried Asp203ND1 near the E channel, suggesting a previously unknown proton uptake route (Fig. 5). A comparison of calculated protonation states for the two conformations of the ND1 loop (Fig. 5, B and C) shows two remarkable differences. On the one hand, relocation and deprotonation of Glu210ND1 connect this residue to the positively charged binding pocket formed by Arg274FS2 and Arg302ND1. On the other hand, rearrangement of the loop and approach of the
charged Glu208ND1 results in the uptake of a proton at Asp203ND1 at the entrance of the E channel (Figs. 4 and 5). In effect, a proton is transferred from the protein surface to the starting point of the route into the membrane arm through the pathway identified here.
It is interesting to note that the conformational changes in the ND1 loop are not isolated from the rest of the complex I structure. Movie 3 suggests that the rearrangements in ND1 are coordinated with changes in the Q reduction site and surrounding subunits, in agreement with earlier proposals (12, 22). Intriguingly, the bending motion of TMH4 coincides with movement of the PD module (movie S2). The mechanistic implications of this small movement are difficult to judge at this stage.
DISCUSSIONMost current mechanistic models of complex I propose that each of the antiporter-like subunits ND2, ND4, and ND5 encompasses a com-plete proton translocation pathway that connects the mitochondrial matrix (N side) to the intermembrane space (P side). This view was
Fig. 4. Q reduction site and conformational changes in ND1. (A) The Q reduction site near FeS cluster N2 is formed by subunits NDUFS2 (green) and NDUFS7 (blue) and is connected to the membrane by a tunnel crossing subunit ND1 (magenta); the branch point from where the E channel leads into the membrane arm interior is surrounded by protonatable residues. TMH4 and the TMH5-TMH6 loop of ND1 (boxed area, see Fig. 5) undergo a conformational change. (B) Binding of the Q head group in the Q reduction site; numbers indicate distances in ångström. (C) Complex I in the D form, view from the matrix side toward TMH4, and the ND1 loop at the level of the branch point of the E channel and Q access pathway (violet circle). (D) Same view as in (C) for steady-state activity conditions.
Dow
nloaded from https://w
ww
.science.org on Decem
ber 01, 2021
Parey et al., Sci. Adv. 7, eabj3221 (2021) 12 November 2021
S C I E N C E A D V A N C E S | R E S E A R C H A R T I C L E
7 of 12
recently challenged (16). A fourth as yet undefined proton pathway is thought to be either located at the ND3/4L/6 interfaces or to in-volve the E channel and a P side connection in the PP module. Our cryo-EM structures and MD simulations provide strong support for N side connections in all three antiporter-like subunits, with a por-tal at the N-terminal end of TMH10. Our results also suggest a gat-ing function of the conserved Phe in TMH11, which may work in conjunction with the recently proposed leucine gate in the loop re-gion of discontinuous TMH7 (15). In agreement with a study of the ovine complex (16), we find a clear P side connection exclusively in ND5, which we show to comprise extra charged residues that in-crease hydration and a unique lipid-protein interface. The number of charged residues in this region raises the possibility that some of them may trap and store protons before they are ejected to the P side. Note that the absence of other P side connections in the mem-brane arm cannot be proven with absolute certainty and appears to be at variance with the residual proton translocation activity of a complex I mutant lacking the distal part of the membrane arm (42). However, the structure of that mutant might be compromised by a
leak pathway that does not exist in the wild type. To account for a single P side connection in the membrane arm, the present models for redox-linked proton translocation need to be revised.
The fact that complex I activity is fully reversible suggests that energy release at the Q site requires more than a single conforma-tional change or charge rearrangement event. If ND5 is the only subunit through which protons are released to the P side, it seems unlikely that the energy required for pumping of 4H+ is transferred over a 200-Å distance by a single one-stroke mechanism. Instead, a mechanism with two separate electron/proton transfer events to Q via a semiquinone intermediate may be a better description. We propose that the conformational changes in ND1 that we describe here in detail are critical for injection of protons into the E channel and that these changes are linked with Q binding in the Q tunnel and its redox chemistry in the catalytic site (Fig. 6). Protons injected into the E channel must travel the complete length of the hydrophilic axis, which would agree with our observation of a long contiguous connection toward ND4. It has recently been proposed that the -to- transition of TMH3 in ND6 is necessary for bridging a gap in
Fig. 5. Mutagenesis and conformational rearrangement of key residues in subunits ND1 and NDUFS2. (A) Site-directed mutagenesis of subunit NDUFS2. Complex I assembly and inhibitor-sensitive Q reductase activity of mutant complex I carrying exchanges at positions Glu107 and Arg274 were tested in mitochondrial membranes (complex I content, black bars, 100% corresponds to 1.12 ± 0.04 mol·min−1·mg−1 NADH:hexaaminruthenium oxidoreductase activity; activity, orange bars, 100% activ-ity corresponds to 0.54 ± 0.07 mol min−1·mg−1 dNADH:decylubiquinone oxidoreductase activity). (B and C) Simulation snapshots of key interactions of selected residues from ND1 (pink), NDUFS2 (green), and NDUFS7 (blue) subunits from MD runs PN2 (B) and PT2 (C). The charged states of selected residues (based on pKa calculation) are indicated in (B) and (C). Stable interactions between residues differ between protonation states and are in agreement with the high-resolution structure [compare Fig. 4, boxed area in (A), note that viewing directions are different]. Selected water molecules are shown as red-and-white sticks connecting the surface-exposed region (Arg138/Glu107/Glu210) to buried Asp203, next to the E channel. See fig. S15 for water occupancy map and convergence of hydration in this region. (D to H) Histograms of stable charged-charged interactions. Distances were measured from arginine CZ atoms to glutamic acid CD atoms throughout all trajectory data. Data are shown for both PN2 (blue) and PT2 (orange) MD runs. The bin size was 0.5 Å, and histograms are normalized such that the sum of the bar heights is equal to 1.
Dow
nloaded from https://w
ww
.science.org on Decem
ber 01, 2021
Parey et al., Sci. Adv. 7, eabj3221 (2021) 12 November 2021
S C I E N C E A D V A N C E S | R E S E A R C H A R T I C L E
8 of 12
the hydrophilic axis to enable proton movements between ND4L and ND1 (16) and that the TMH3 transition is tightly linked with a bending of TMH4 in ND1 (15). Our data do not support either of these proposals because (i) structural changes in ND1, including a bending of TMH4, occur while the -bulge is present and (ii) simu-lations show that a water/protein connection across ND6 can form after moderate changes in TMH3 at the side-chain level. However, a transient formation of the helix cannot be excluded at this stage.
On the basis of these considerations, we propose a molecular mechanism of proton pumping in complex I, which resembles the well-documented proton pumping mechanism of cytochrome c oxidase, the terminal enzyme of the respiratory chain [(43, 44), see also (4) and (24)]. In cytochrome c oxidase, for every electron transfer to the oxygen reduction site, a proton is transferred to the proton- loading site, followed by substrate proton transfer to the active site, which then electrostatically drives the ejection of the pumped pro-ton from the proton-loading site to the P side of the membrane.
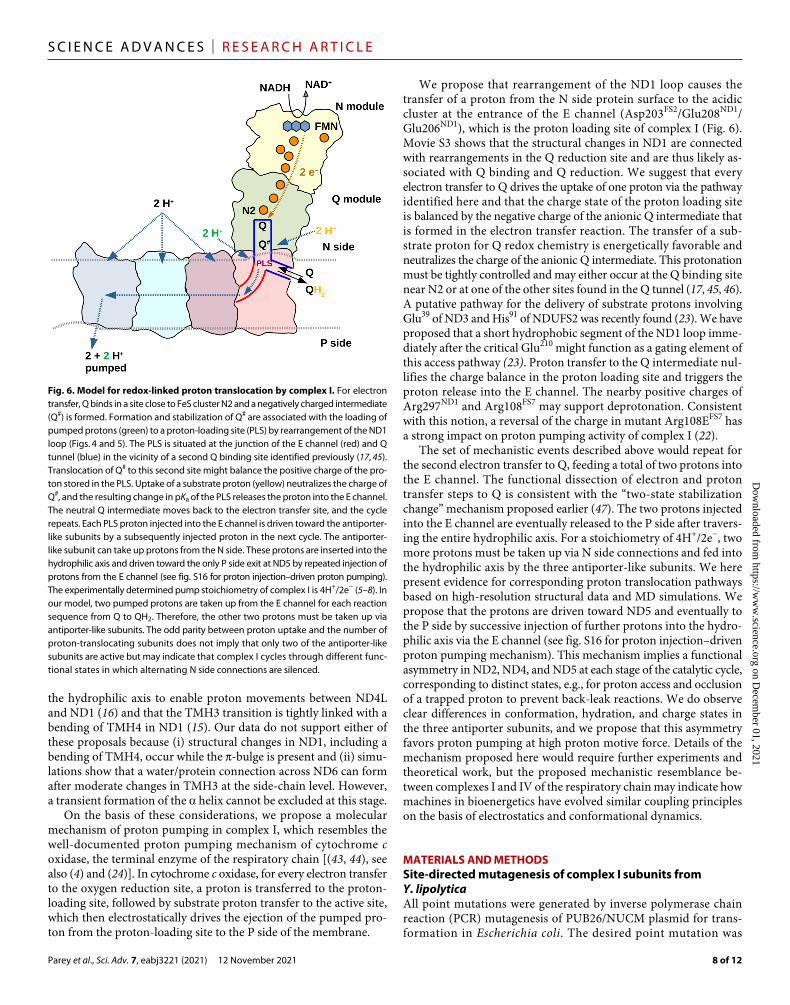
We propose that rearrangement of the ND1 loop causes the transfer of a proton from the N side protein surface to the acidic cluster at the entrance of the E channel (Asp203FS2/Glu208ND1/Glu206ND1), which is the proton loading site of complex I (Fig. 6). Movie S3 shows that the structural changes in ND1 are connected with rearrangements in the Q reduction site and are thus likely as-sociated with Q binding and Q reduction. We suggest that every electron transfer to Q drives the uptake of one proton via the pathway identified here and that the charge state of the proton loading site is balanced by the negative charge of the anionic Q intermediate that is formed in the electron transfer reaction. The transfer of a sub-strate proton for Q redox chemistry is energetically favorable and neutralizes the charge of the anionic Q intermediate. This protonation must be tightly controlled and may either occur at the Q binding site near N2 or at one of the other sites found in the Q tunnel (17, 45, 46). A putative pathway for the delivery of substrate protons involving Glu39 of ND3 and His91 of NDUFS2 was recently found (23). We have proposed that a short hydrophobic segment of the ND1 loop imme-diately after the critical Glu210 might function as a gating element of this access pathway (23). Proton transfer to the Q intermediate nul-lifies the charge balance in the proton loading site and triggers the proton release into the E channel. The nearby positive charges of Arg297ND1 and Arg108FS7 may support deprotonation. Consistent with this notion, a reversal of the charge in mutant Arg108EFS7 has a strong impact on proton pumping activity of complex I (22).
The set of mechanistic events described above would repeat for the second electron transfer to Q, feeding a total of two protons into the E channel. The functional dissection of electron and proton transfer steps to Q is consistent with the “two-state stabilization change” mechanism proposed earlier (47). The two protons injected into the E channel are eventually released to the P side after travers-ing the entire hydrophilic axis. For a stoichiometry of 4H+/2e−, two more protons must be taken up via N side connections and fed into the hydrophilic axis by the three antiporter-like subunits. We here present evidence for corresponding proton translocation pathways based on high-resolution structural data and MD simulations. We propose that the protons are driven toward ND5 and eventually to the P side by successive injection of further protons into the hydro-philic axis via the E channel (see fig. S16 for proton injection–driven proton pumping mechanism). This mechanism implies a functional asymmetry in ND2, ND4, and ND5 at each stage of the catalytic cycle, corresponding to distinct states, e.g., for proton access and occlusion of a trapped proton to prevent back-leak reactions. We do observe clear differences in conformation, hydration, and charge states in the three antiporter subunits, and we propose that this asymmetry favors proton pumping at high proton motive force. Details of the mechanism proposed here would require further experiments and theoretical work, but the proposed mechanistic resemblance be-tween complexes I and IV of the respiratory chain may indicate how machines in bioenergetics have evolved similar coupling principles on the basis of electrostatics and conformational dynamics.
MATERIALS AND METHODSSite-directed mutagenesis of complex I subunits from Y. lipolyticaAll point mutations were generated by inverse polymerase chain reaction (PCR) mutagenesis of PUB26/NUCM plasmid for trans-formation in Escherichia coli. The desired point mutation was
Fig. 6. Model for redox-linked proton translocation by complex I. For electron transfer, Q binds in a site close to FeS cluster N2 and a negatively charged intermediate (Q#) is formed. Formation and stabilization of Q# are associated with the loading of pumped protons (green) to a proton-loading site (PLS) by rearrangement of the ND1 loop (Figs. 4 and 5). The PLS is situated at the junction of the E channel (red) and Q tunnel (blue) in the vicinity of a second Q binding site identified previously (17, 45). Translocation of Q# to this second site might balance the positive charge of the pro-ton stored in the PLS. Uptake of a substrate proton (yellow) neutralizes the charge of Q#, and the resulting change in pKa of the PLS releases the proton into the E channel. The neutral Q intermediate moves back to the electron transfer site, and the cycle repeats. Each PLS proton injected into the E channel is driven toward the antiporter- like subunits by a subsequently injected proton in the next cycle. The antiporter- like subunit can take up protons from the N side. These protons are inserted into the hydrophilic axis and driven toward the only P side exit at ND5 by repeated injection of protons from the E channel (see fig. S16 for proton injection–driven proton pumping). The experimentally determined pump stoichiometry of complex I is 4H+/2e− (5–8). In our model, two pumped protons are taken up from the E channel for each reaction sequence from Q to QH2. Therefore, the other two protons must be taken up via antiporter-like subunits. The odd parity between proton uptake and the number of proton-translocating subunits does not imply that only two of the antiporter-like subunits are active but may indicate that complex I cycles through different func-tional states in which alternating N side connections are silenced.
Dow
nloaded from https://w
ww
.science.org on Decem
ber 01, 2021
Parey et al., Sci. Adv. 7, eabj3221 (2021) 12 November 2021
S C I E N C E A D V A N C E S | R E S E A R C H A R T I C L E
9 of 12
introduced using appropriate primer pairs. For site-directed muta-genesis, 5′-hydroxyl ends of primers were phosphorylated using T4 polynucleotide kinase before PCR. The PCR mixture contained the template DNA (10 ng of plasmid DNA harboring the NUCM gene), both primers (forward primer and reverse primer; 0.5 M each), deoxynucleotide triphosphates (dNTPs) (200 M), 1× Phusion HF buffer, and Phusion DNA polymerase (2 U) in a final volume of 50 l. The remaining unmutated template DNA was removed by digestion with Dpn I overnight at 37°C. Digested DNA frag-ments were separated on a 1% agarose gel stained with peqGREEN (Peqlab) at 120 V for 1 hour. Linear DNA (~11 kb) was cut out of the agarose gel after electrophoresis and isolated using the NucleoSpin Gel and PCR Clean-up kit from Macherey-Nagel according to the manufacturer’s instructions. Linear PCR products were ligated by blunt-end ligation using the Fast-link DNA ligation kits from Epicentre. The ligation reaction (5 l) was used for the transforma-tion of chemically competent E. coli XL-Gold cells. LB (1 ml) was added to the mixture and incubated for 1 hour at 37°C on a rotating wheel. Last, 50 to 100 l was spread on ampicillin-containing LB plates. The plates were incubated overnight at 37°C. On the follow-ing day, five clones were picked for each mutant and cultivated in 5 ml of LB medium containing ampicillin for 16 hours at 37°C. After overnight culture, plasmid DNA was isolated from E. coli cells using the NucleoSpin Plasmid kit from Macherey-Nagel and according to the manufacturer’s instructions. After sequencing, plasmid DNA containing the desired mutation was transformed into Y. lipolytica strain nucm using the lithium acetate method. Briefly, cells from 0.5 to 1 ml of an overnight culture were spun down, washed with 0.9% NaCl, and centrifuged again. The cells were resuspended in 90 l of 50% polyethylene glycol 4000 with 100 mM lithium acetate (pH 6), 100 mM dithiothreitol, and ssDNA (0.25 mg/ml). Plasmid DNA (200 to 300 ng) were added for each transformation mixture, vortexed, and incubated at 39°C for 60 min. After transformation, the mixture was spread onto a selective yeast extract, peptone, and dextrose (YPD) plate containing hygromycin (50 g/ml) and incubated for 3 to 4 days at 28°C.
Preparation of mitochondrial membranesPreparation of mitochondrial membranes of parental and mutant strains was carried out on a small scale as described (22). Pellets of 5 to 8 g of cells (wet weight) were resuspended in 10 ml of mitobuf-fer [600 mM sucrose, 20 mM MOPS, and 1 mM EDTA (pH 7.2)] supplemented with 2 mM phenylmethylsulfonyl fluoride (PMSF) and broken by vortexing with 10 g of glass beads (0.25 to 0.5 mm) in a series of 15 × 1 min with 1-min resting intervals on ice. Cell debris and glass beads were removed by centrifugation at 3238g for 30 min at 4°C. Mitochondrial membranes were sedimented from superna-tant by ultracentrifugation at 147,642g for 1 hour at 4°C. Last, the pellets were resuspended in 0.5 to 1 ml of mitobuffer with 5 mM PMSF and homogenized. Aliquots of the membrane suspension were immediately frozen in liquid nitrogen and stored at −80°C.
Complex content and activity in mitochondrial membranesComplex I content in mitochondrial membranes was determined as NADH:HAR oxidoreductase activity. This unphysiological activity reflects the amount of fully assembled complex I in a preparation and was determined spectrophotometrically at 340-nm wavelength ( = 6.22 mM−1 cm−1) by measuring the initial oxidation rate of NADH. The reaction was started by the addition of 20 to 40 g of
protein of mitochondrial membranes to the HAR buffer [250 mM sucrose, 20 mM Hepes, 0.2 mM EDTA, 2 mM KCN (pH 8)] con-taining 200 M NADH and 2 mM HAR.
Complex I activity in mitochondrial membranes was determined spectrophotometrically at 340 nm wavelength ( = 6.22 mM−1 cm−1) by measuring the physiological electron transfer activity of deamino- NADH (dNADH) to the short short-chain ubiquinone analog DBQ. dNADH is specific to complex I and is used in the complex I activity assay to exclude oxidation by alternative dehydrogenases. The reaction was started by the addition of 100 M dNADH to a solution of DBQ buffer [20 mM MOPS-Na, 50 mM NaCl, and 2 mM KCN (pH 7.2)] containing 60 M DBQ and 20 to 40 g of protein of mitochondrial membranes. The reaction was stopped by the addition of 2 M complex I inhibitor 2-decyl-4-quinazolinylamine (DQA). The inhibitor-insensitive activity was subtracted from the initial rate, and the result was normalized to complex I content to allow compari-son between different preparations. All activity measurements were performed at 30°C in a Shimadzu UV-2450 spectrophotometer. For each mutant, two biological replicates of mitochondrial membranes were analyzed, and each measurement was carried out in duplicate.
Complex I purification and characterizationComplex I was purified in the detergent LMNG by His-tag affinity and size exclusion chromatography as described (17), with an addi-tional polishing step on a Mono-Q ion exchange column. Inhibitor- sensitive NADH:decylubiquinone oxidoreductase activity of purified complex I was measured as described (17) but with 0.0015% LMNG in the assay buffer.
In vitro assay of a minimal respiratory chainThe in vitro assay of a minimal respiratory chain was carried out in 2-ml glass vials with stirring in a water bath at 10°C. The reaction vial was filled with 20 mM tris-HCl (pH 7.2), 100 mM NaCl, and 0.025% LMNG, followed by the addition of 200 M DBQ, 2 M complex I, and 1 M cytochrome bo3 ubiquinol oxidase (complex IV) to a final volume of 600 l. The reaction was started by adding 2 mM NADH and inhibited by the addition of DQA or KCN. Oxygen consumption was determined polarographically using a Clark-type oxygen electrode (OX-MR, Unisense) connected to a picoammeter (PA2000 Multimeter, Unisense). Signals were converted with an A/D converter (ADC-216, Unisense) and then recorded with the soft-ware Sensor Trace Basic 2.1 supplied by the manufacturer.
Cryo-EM structuresComplex I samples were applied at a concentration of 1.5 mg/ml in 20 mM tris-HCl (pH 7.2), 100 mM NaCl, 1 mM EDTA, and 0.025% LMNG to freshly glow-discharged 1.2/1.3 holey carbon grids (Pro-tochips, USA). Grids were blotted for 12 to 14 s in a Vitrobot Mark IV (Thermo Fisher Scientific Inc., USA) at 10°C and 70% humidity (drain and wait time, 0 s; blot force, −2), plunge frozen in liquid ethane, and stored in liquid nitrogen until further use. Cryo-EM data were collected automatically using EPU software (Thermo Fisher Scientific Inc., USA) on an FEI Titan Krios microscope (Thermo Fisher Scien-tific Inc., USA) at 300 kV equipped with a K3 Summit detector (Gatan, USA) operating in counting mode. Cryo-EM images were acquired at a nominal magnification of ×160,000 with a calibrated pixel size of 0.5316 Å, at a defocus range from −0.8 to −2.2 m, with an ex-posure time of 3 s, and a total electron exposure on the specimen of ~50 e−/Å2.
Dow
nloaded from https://w
ww
.science.org on Decem
ber 01, 2021
Parey et al., Sci. Adv. 7, eabj3221 (2021) 12 November 2021
S C I E N C E A D V A N C E S | R E S E A R C H A R T I C L E
10 of 12
A set of 21,770 dose-fractionated micrographs from four inde-pendently collected datasets were subjected to motion correction and dose weighting by MotionCor2 (48). The micrograph-based contrast transfer function (CTF) was determined by Gctf (49). CTF-corrected images were used for further analysis with the software package RELION3.1 (50). Particles were picked using Autopick within RELION3.1. A total of 1,078,966 particles were extracted with a box size of 600 × 600 pixels. Extracted particles from each dataset were subjected to reference-free two-dimensional (2D) classification with fourfold binned data to remove false positives and imperfect parti-cles. A further 3D classification step with a previous cryo-EM map of complex I (EMD-4873) (17) as an initial reference was applied. The 3D classes from each dataset were combined and used for autorefinement, CTF refinement, and Bayesian polishing in RELION3.1 (50). The final map from 178,960 particles at 2.4-Å resolution was sharpened using an isotropic B factor of −47 Å2 (fig. S1 and table S1), and the local resolution was estimated with ResMap (http://resmap.sourceforge.net) (fig. S1) (51). All resolutions were estimated using the 0.143 cutoff criterion (52) with gold standard Fourier shell correlation (FSC) of two independently refined half maps (53). Density modification with phenix.resolve_cryo_em (33) was carried out using two half-maps together with the FSC-based reso-lution and the postprocessed map. This resulted in a considerable improvement of the map quality at a final resolution of 2.12 Å.
The cryo-EM structure of Y. lipolytica complex I [Protein Data Bank (PDB) ID: 6rfr] was used as a template and fitted to the map with COOT (54). The structure was manually rebuilt in COOT and refined using phenix.real_space_refine (55). Water molecules were built automatically with phenix.douse and checked manually. The “check/delete water” function in COOT was used to verify the mol-ecules with clear map features and appropriate hydrogen bonding and geometry. Refinement and validation statistics are summarized in table S1.
For cryo-EM studies of complex I under turnover, 4 M complex I incubated with 400 M DBQ was mixed 1:1 with 2 M bo3-type ubi-quinol oxidase and 4 mM NADH. Three microliters of the mixture was applied to freshly glow-discharged 1.2/1.3 holey carbon grids (Protochips, USA) as described above. Cryo-EM data were collected automatically at 300 kV using EPU (Thermo Fisher Scientific Inc., USA) on an FEI Titan Krios microscope (Thermo Fisher Scientific Inc., USA) equipped with a Gatan K2 in movie mode at a calibrated magnification of 1.077 Å pixel−1 (×105,000). Cryo-EM images were acquired at a total exposure of 40 e−/Å2 at −0.8 to −3.2 m defocus.
CTF parameters were estimated by Gctf (49) within the RELION3.0 workflow (50). A total of 124,092 particles were extracted from 4776 motion-corrected micrographs. The particles were subjected to reference-free 2D classification and sorted by 3D classification, which resulted in a final dataset of 54,863 particles that yielded a 3.4-Å map after CTF refinement and Bayesian polishing. An isotro-pic B factor of −62 Å2 was applied, and the local resolution was esti-mated with ResMap (fig. S1).
The cryo-EM structure of complex I in the D form (17) was used as a template, and the structure was fitted into the map using phenix.real_space_refine in combination with rigid-body refine-ment. Critical loops were rebuilt, and the model was checked with COOT (54).
Figures were made with Chimera (56) and PyMOL (57). Movies were made with ChimeraX (58). Alignments were prepared using Jalview (59).
Computational methodsAtomistic MD simulations were performed on the complete 2.1- and 3.4-Å structures of Y. lipolytica complex I, including all resolved lipids, ligands, and water molecules. The protein was embedded into a membrane of 50% palmitoyl-oleoyl-phosphatidylcholine (POPC), 35% palmitoyl-oleoyl-phosphatidylethanolamine (POPE), and 15% cardiolipin, generated with CHARMM-GUI (60). The sys-tem was solvated with TIP3P water and 100 mM of Na+/Cl− ions. The force field for protein, lipids, water, and ions was CHARMM36 (61, 62), and corresponding force field parameters were used for oxidized Q1 (63), FMN (64), FeS clusters (65), NADPH (66), and ZMP (60). One model system was constructed each for the two structures with all titratable residues either kept in their standard protonation states (MD runs PN1 and PT1) or with the protonation states of titratable residues fixed based on pKa values estimated with Propka (MD runs PN2 and PT2, see tables S2 and S3) (67). The total system size was around 1.3 million atoms (fig. S5).
To test the force field–based dependency of hydration observed in antiporter-like subunits, we performed two additional MD simu-lations using the AMBER force field (68–70) in PN1 and PN2 charged states (see table S2 for MD simulation setups and table S3 for nonstandard protonation states of amino acid residues based on pKa calculations). These model systems comprised only the membrane arm of the 2.1-Å resolution structure immersed in POPC lipids, TIP3P water molecules, and 100 mM Na+/Cl− ions.
Gromacs v2020.3 (71) was used to perform the system minimi-zation, equilibration, and production MD runs. An energy minimi-zation step was applied to release strain from the system, with restraints on protein heavy atoms and lipid phosphorus atoms, followed by a 100 ps NVT (canonical ensemble with constant num-ber of particles N, volume V and temperature T) equilibration using velocity rescale algorithm (72) with the same restraints. The final equilibration was a 10-ns NPT (isothermal-isobaric ensemble with constant number of particles N, pressure P and temperature T) step using velocity rescale algorithm and Berendsen barostat (73), with restraints only on protein backbone atoms. In the production run, all restraints were released, and the Nosé-Hoover thermo-stat (74, 75) and Parrinello-Rahman barostat (76) were applied at a temperature of 310 K and a pressure of 1 atm. The LINCS algo-rithm was used to achieve a 2-fs time step (77). Trajectory analysis was performed using visual molecular dynamics (VMD) (78). The total simulation time was ~5.6 s.
The water occupancy map (shown as a gray volumetric mesh) was calculated using the entire simulation data including replicas, unless otherwise mentioned. The amino acid residues that show nonstandard protonation states are listed in table S3 for the 2.1-Å (PN2) and 3.4-Å (PT2) resolution structures.
SUPPLEMENTARY MATERIALSSupplementary material for this article is available at https://science.org/doi/10.1126/sciadv.abj3221
View/request a protocol for this paper from Bio-protocol.
REFERENCES AND NOTES 1. L. A. Sazanov, A giant molecular proton pump: Structure and mechanism of respiratory
complex I. Nat. Rev. Mol. Cell Biol. 16, 375–388 (2015). 2. E. Galemou Yoga, H. Angerer, K. Parey, V. Zickermann, Respiratory complex I -
Mechanistic insights and advances in structure determination. Biochim. Biophys. Acta 1861, 148153 (2020).
3. J. Hirst, Mitochondrial complex I. Annu. Rev. Biochem. 82, 551–575 (2013).
Dow
nloaded from https://w
ww
.science.org on Decem
ber 01, 2021

Parey et al., Sci. Adv. 7, eabj3221 (2021) 12 November 2021
S C I E N C E A D V A N C E S | R E S E A R C H A R T I C L E
11 of 12
4. O. Haapanen, V. Sharma, A modeling and simulation perspective on the mechanism and function of respiratory complex I. Biochim. Biophys. Acta 1859, 510–523 (2018).
5. A. J. Jones, J. N. Blaza, F. Varghese, J. Hirst, Respiratory complex I in Bos taurus and Paracoccus denitrificans pumps four protons across the membrane for every NADH oxidized. J. Biol. Chem. 292, 4987–4995 (2017).
6. A. Galkin, S. Dröse, U. Brandt, The proton pumping stoichiometry of purified mitochondrial complex I reconstituted into proteoliposomes. Biochim. Biophys. Acta 1757, 1575–1581 (2006).
7. A. S. Galkin, V. G. Grivennikova, A. D. Vinogradov, H+/2e− Stoichiometry in NADH-quinone reductase reactions catalyzed by bovine heart submitochondrial particles. FEBS Lett. 451, 157–161 (1999).
8. M. Wikström, Two protons are pumped from the mitochondrial matrix per electron transferred between NADH and ubiquinone. FEBS Lett. 169, 300–304 (1984).
9. R. J. Rodenburg, Mitochondrial complex I-linked disease. Biochim. Biophys. Acta 1857, 938–945 (2016).
10. K. Fiedorczuk, L. A. Sazanov, Mammalian mitochondrial complex I structure and disease-causing mutations. Trends Cell Biol. 28, 835–867 (2018).
11. R. Baradaran, J. M. Berrisford, G. S. Minhas, L. A. Sazanov, Crystal structure of the entire respiratory complex I. Nature 494, 443–448 (2013).
12. V. Zickermann, C. Wirth, H. Nasiri, K. Siegmund, H. Schwalbe, C. Hunte, U. Brandt, Mechanistic insight from the crystal structure of mitochondrial complex I. Science 347, 44–49 (2015).
13. A. A. Agip, J. N. Blaza, J. G. Fedor, J. Hirst, Mammalian respiratory complex I through the lens of cryo-EM. Annu. Rev. Biophys. 48, 165–184 (2019).
14. K. Parey, C. Wirth, J. Vonck, V. Zickermann, Respiratory complex I — Structure, mechanism and evolution. Curr. Opin. Struct. Biol. 63, 1–9 (2020).
15. D. N. Grba, J. Hirst, Mitochondrial complex I structure reveals ordered water molecules for catalysis and proton translocation. Nat. Struct. Mol. Biol. 27, 892–900 (2020).
16. D. Kampjut, L. A. Sazanov, The coupling mechanism of mammalian respiratory complex I. Science 370, eabc4209 (2020).
17. K. Parey, O. Haapanen, V. Sharma, H. Köfeler, T. Züllig, S. Prinz, K. Siegmund, I. Wittig, D. J. Mills, J. Vonck, W. Kühlbrandt, V. Zickermann, High-resolution cryo-EM structures of respiratory complex I: Mechanism, assembly, and disease. Sci. Adv. 5, eaax9484 (2019).
18. H. Soufari, C. Parrot, L. Kuhn, F. Waltz, Y. Hashem, Specific features and assembly of the plant mitochondrial complex I revealed by cryo-EM. Nat. Commun. 11, 5195 (2020).
19. N. Klusch, J. Senkler, O. Yildiz, W. Kühlbrandt, H. P. Braun, A ferredoxin bridge connects the two arms of plant mitochondrial complex I. Plant Cell 33, 2072–2091 (2021).
20. C. Mathiesen, C. Hägerhäll, Transmembrane topology of the NuoL, M and N subunits of NADH:quinone oxidoreductase and their homologues among membrane-bound hydrogenases and bona fide antiporters. Biochim. Biophys. Acta 1556, 121–132 (2002).
21. A. Cabrera-Orefice, E. G. Yoga, C. Wirth, K. Siegmund, K. Zwicker, S. Guerrero-Castillo, V. Zickermann, C. Hunte, U. Brandt, Locking loop movement in the ubiquinone pocket of complex I disengages the proton pumps. Nat. Commun. 9, 4500 (2018).
22. E. Galemou Yoga, O. Haapanen, I. Wittig, K. Siegmund, V. Sharma, V. Zickermann, Mutations in a conserved loop in the PSST subunit of respiratory complex I affect ubiquinone binding and dynamics. Biochim. Biophys. Acta 1860, 573–581 (2019).
23. E. Galemou Yoga, K. Parey, A. Djurabekova, O. Haapanen, K. Siegmund, K. Zwicker, V. Sharma, V. Zickermann, H. Angerer, Essential role of accessory subunit LYRM6 in the mechanism of mitochondrial complex I. Nat. Commun. 11, 6008 (2020).
24. G. Hummer, M. Wikström, Molecular simulation and modeling of complex I. Biochim. Biophys. Acta 1857, 915–921 (2016).
25. V. R. I. Kaila, Long-range proton-coupled electron transfer in biological energy conversion: Towards mechanistic understanding of respiratory complex I. J. R. Soc. Interface 15, 20170916 (2018).
26. K. Parey, U. Brandt, H. Xie, D. J. Mills, K. Siegmund, J. Vonck, W. Kühlbrandt, V. Zickermann, Cryo-EM structure of respiratory complex I at work. eLife 7, e39213 (2018).
27. A. A. Agip, J. N. Blaza, H. R. Bridges, C. Viscomi, S. Rawson, S. P. Muench, J. Hirst, Cryo-EM structures of complex I from mouse heart mitochondria in two biochemically defined states. Nat. Struct. Mol. Biol. 25, 548–556 (2018).
28. J. Gutierrez-Fernandez, K. Kaszuba, G. S. Minhas, R. Baradaran, M. Tambalo, D. T. Gallagher, L. A. Sazanov, Key role of quinone in the mechanism of respiratory complex I. Nat. Commun. 11, 4135 (2020).
29. J. A. Letts, K. Fiedorczuk, G. Degliesposti, M. Skehel, L. A. Sazanov, Structures of respiratory supercomplex I+III2 reveal functional and conformational crosstalk. Mol. Cell 75, 1131–1146.e6 (2019).
30. A. B. Kotlyar, A. D. Vinogradov, Slow active/inactive transition of the mitochondrial NADH-ubiquinone reductase. Biochim. Biophys. Acta 1019, 151–158 (1990).
31. E. T. Chouchani, C. Methner, S. M. Nadtochiy, A. Logan, V. R. Pell, S. Ding, A. M. James, H. M. Cochemé, J. Reinhold, K. S. Lilley, L. Partridge, I. M. Fearnley, A. J. Robinson, R. C. Hartley, R. A. J. Smith, T. Krieg, P. S. Brookes, M. P. Murphy, Cardioprotection by
S-nitrosation of a cysteine switch on mitochondrial complex I. Nat. Med. 19, 753–759 (2013).
32. E. Maklashina, A. B. Kotlyar, G. Cecchini, Active/de-active transition of respiratory complex I in bacteria, fungi, and animals. Biochim. Biophys. Acta 1606, 95–103 (2003).
33. T. C. Terwilliger, S. J. Ludtke, R. J. Read, P. D. Adams, P. V. Afonine, Improvement of cryo-EM maps by density modification. Nat. Methods 17, 923–927 (2020).
34. O. Haapanen, M. Reidelbach, V. Sharma, Coupling of quinone dynamics to proton pumping in respiratory complex I. Biochim. Biophys. Acta Bioenerg. 1861, 148287 (2020).
35. E. Chovancova, A. Pavelka, P. Benes, O. Strnad, J. Brezovsky, B. Kozlikova, A. Gora, V. Sustr, M. Klvana, P. Medek, L. Biedermannova, J. Sochor, J. Damborsky, CAVER 3.0: A tool for the analysis of transport pathways in dynamic protein structures. PLOS Comput. Biol. 8, e1002708 (2012).
36. S. Kurki, V. Zickermann, M. Kervinen, I. Hassinen, M. Finel, Mutagenesis of three conserved Glu residues in a bacterial homologue of the ND1 subunit of complex I affects ubiquinone reduction kinetics but not inhibition by dicyclohexylcarbodiimide. Biochemistry 39, 13496–13502 (2000).
37. A. Djurabekova, O. Haapanen, V. Sharma, Proton motive function of the terminal antiporter-like subunit in respiratory complex I. Biochim. Biophys. Acta 1861, 148185 (2020).
38. O. Haapanen, V. Sharma, Role of water and protein dynamics in proton pumping by respiratory complex I. Sci. Rep. 7, 7747 (2017).
39. A. Di Luca, A. P. Gamiz-Hernandez, V. R. I. Kaila, Symmetry-related proton transfer pathways in respiratory complex I. Proc. Natl. Acad. Sci. U.S.A. 114, E6314–E6321 (2017).
40. M. A. Tocilescu, U. Fendel, K. Zwicker, S. Dröse, S. Kerscher, U. Brandt, The role of a conserved tyrosine in the 49-kDa subunit of complex I for ubiquinone binding and reduction. Biochim. Biophys. Acta 1797, 625–632 (2010).
41. V. Sharma, G. Belevich, A. P. Gamiz-Hernandez, T. Róg, I. Vattulainen, M. L. Verkhovskaya, M. Wikström, G. Hummer, V. R. I. Kaila, Redox-induced activation of the proton pump in the respiratory complex I. Proc. Natl. Acad. Sci. U.S.A. 112, 11571–11576 (2015).
42. S. Dröse, S. Krack, L. Sokolova, K. Zwicker, H. D. Barth, N. Morgner, H. Heide, M. Steger, E. Nübel, V. Zickermann, S. Kerscher, B. Brutschy, M. Radermacher, U. Brandt, Functional dissection of the proton pumping modules of mitochondrial complex I. PLOS Biol. 9, e1001128 (2011).
43. P. R. Rich, Mitochondrial cytochrome c oxidase: Catalysis, coupling and controversies. Biochem. Soc. Trans. 45, 813–829 (2017).
44. M. Wikström, K. Krab, V. Sharma, Oxygen activation and energy conservation by cytochrome c oxidase. Chem. Rev. 118, 2469–2490 (2018).
45. O. Haapanen, A. Djurabekova, V. Sharma, Role of second quinone binding site in proton pumping by respiratory complex I. Front. Chem. 7, 221 (2019).
46. J. Warnau, V. Sharma, A. P. Gamiz-Hernandez, A. Di Luca, O. Haapanen, I. Vattulainen, M. Wikström, G. Hummer, V. R. I. Kaila, Redox-coupled quinone dynamics in the respiratory complex I. Proc. Natl. Acad. Sci. U.S.A. 115, E8413–E8420 (2018).
47. U. Brandt, A two-state stabilization-change mechanism for proton-pumping complex I. Biochim. Biophys. Acta 1807, 1364–1369 (2011).
48. S. Q. Zheng, E. Palovcak, J. P. Armache, K. A. Verba, Y. Cheng, D. A. Agard, MotionCor2: Anisotropic correction of beam-induced motion for improved cryo-electron microscopy. Nat. Methods 14, 331–332 (2017).
49. K. Zhang, Gctf: Real-time CTF determination and correction. J. Struct. Biol. 193, 1–12 (2016). 50. J. Zivanov, T. Nakane, B. O. Forsberg, D. Kimanius, W. J. H. Hagen, E. Lindahl,
S. H. W. Scheres, New tools for automated high-resolution cryo-EM structure determination in RELION-3. eLife 7, e42166 (2018).
51. A. Kucukelbir, F. J. Sigworth, H. D. Tagare, Quantifying the local resolution of cryo-EM density maps. Nat. Methods 11, 63–65 (2014).
52. P. B. Rosenthal, R. Henderson, Optimal determination of particle orientation, absolute hand, and contrast loss in single-particle electron cryomicroscopy. J. Mol. Biol. 333, 721–745 (2003).
53. S. H. W. Scheres, RELION: Implementation of a Bayesian approach to cryo-EM structure determination. J. Struct. Biol. 180, 519–530 (2012).
54. P. Emsley, B. Lohkamp, W. G. Scott, K. Cowtan, Features and development of Coot. Acta Crystallogr. D Biol. Crystallogr. 66, 486–501 (2010).
55. P. V. Afonine, B. K. Poon, R. J. Read, O. V. Sobolev, T. C. Terwilliger, A. Urzhumtsev, P. D. Adams, Real-space refinement in PHENIX for cryo-EM and crystallography. Acta Crystallogr. D Struct. Biol. 74, 531–544 (2018).
56. E. F. Pettersen, T. D. Goddard, C. C. Huang, G. S. Couch, D. M. Greenblatt, E. C. Meng, T. E. Ferrin, UCSF Chimera—A visualization system for exploratory research and analysis. J. Comput. Chem. 25, 1605–1612 (2004).
57. L. Schrödinger, W. DeLano, Pymol. Retrieved from http://www.pymol.org/pymol, (2020). 58. T. D. Goddard, C. C. Huang, E. C. Meng, E. F. Pettersen, G. S. Couch, J. H. Morris, T. E. Ferrin,
UCSF ChimeraX: Meeting modern challenges in visualization and analysis. Protein Sci. 27, 14–25 (2018).
Dow
nloaded from https://w
ww
.science.org on Decem
ber 01, 2021

Parey et al., Sci. Adv. 7, eabj3221 (2021) 12 November 2021
S C I E N C E A D V A N C E S | R E S E A R C H A R T I C L E
12 of 12
59. A. M. Waterhouse, J. B. Procter, D. M. Martin, M. Clamp, G. J. Barton, Jalview Version 2—A multiple sequence alignment editor and analysis workbench. Bioinformatics 25, 1189–1191 (2009).
60. S. Jo, T. Kim, V. G. Iyer, W. Im, CHARMM-GUI: A web-based graphical user interface for CHARMM. J. Comput. Chem. 29, 1859–1865 (2008).
61. A. D. MacKerell Jr., D. Bashford, M. Bellott, R. L. Dunbrack Jr., J. D. Evanseck, M. J. Field, S. Fischer, J. Gao, H. Guo, S. Ha, D. Joseph-McCarthy, L. Kuchnir, K. Kuczera, F. T. K. Lau, C. Mattos, S. Michnick, T. Ngo, D. T. Nguyen, B. Prodhom, W. E. Reiher, B. Roux, M. Schlenkrich, J. C. Smith, R. Stote, J. Straub, M. Watanabe, J. Wiórkiewicz-Kuczera, D. Yin, M. Karplus, All-atom empirical potential for molecular modeling and dynamics studies of proteins. J. Phys. Chem. B 102, 3586–3616 (1998).
62. J. B. Klauda, R. M. Venable, J. A. Freites, J. W. O’Connor, D. J. Tobias, C. Mondragon-Ramirez, I. Vorobyov, A. D. MacKerell Jr., R. W. Pastor, Update of the CHARMM all-atom additive force field for lipids: Validation on six lipid types. J. Phys. Chem. B 114, 7830–7843 (2010).
63. V. V. Galassi, G. M. Arantes, Partition, orientation and mobility of ubiquinones in a lipid bilayer. Biochim. Biophys. Acta 1847, 1560–1573 (2015).
64. P. L. Freddolino, M. Dittrich, K. Schulten, Dynamic switching mechanisms in LOV1 and LOV2 domains of plant phototropins. Biophys. J. 91, 3630–3639 (2006).
65. C. H. Chang, K. Kim, Density functional theory calculation of bonding and charge parameters for molecular dynamics studies on [FeFe] hydrogenases. J. Chem. Theor. Comput. 5, 1137–1145 (2009).
66. J. J. Pavelites, J. L. Gao, P. A. Bash, A. D. J. Mackerell Jr., A molecular mechanics force field for NAD+, NADH, and the pyrophosphate groups of nucleotides. J. Comput. Chem. 18, 221–239 (1997).
67. M. H. Olsson, C. R. Sondergaard, M. Rostkowski, J. H. Jensen, PROPKA3: Consistent treatment of internal and surface residues in empirical pKa predictions. J. Chem. Theor. Comput. 7, 525–537 (2011).
68. Y. Duan, C. Wu, S. Chowdhury, M. C. Lee, G. Xiong, W. Zhang, R. Yang, P. Cieplak, R. Luo, T. Lee, J. Caldwell, J. Wang, P. Kollman, A point-charge force field for molecular mechanics simulations of proteins based on condensed-phase quantum mechanical calculations. J. Comput. Chem. 24, 1999–2012 (2003).
69. C. J. Dickson, B. D. Madej, Å. A. Skjevik, R. M. Betz, K. Teigen, I. R. Gould, R. C. Walker, Lipid14: The Amber Lipid Force Field. J. Chem. Theor. Comput. 10, 865–879 (2014).
70. J. Lee, M. Hitzenberger, M. Rieger, N. R. Kern, M. Zacharias, W. Im, CHARMM-GUI supports the Amber force fields. J. Chem. Phys. 153, 035103 (2020).
71. M. J. Abraham, T. Murtola, R. Schulz, S. Páll, J. C. Smith, B. Hess, E. Lindahl, GROMACS: High performance molecular simulations through multi-level parallelism from laptops to supercomputers. SoftwareX 1-2, 19–25 (2015).
72. G. Bussi, D. Donadio, M. Parrinello, Canonical sampling through velocity rescaling. J. Chem. Phys. 126, 014101 (2007).
73. H. J. C. Berendsen, J. P. M. Postma, W. F. van Gunsteren, A. DiNola, J. R. Haak, Molecular-dynamics with coupling to an external bath. J. Chem. Phys. 81, 3684–3690 (1984).
74. S. Nosé, A unified formulation of the constant temperature molecular-dynamics methods. J. Chem. Phys. 81, 511–519 (1984).
75. W. G. Hoover, Canonical dynamics: Equilibrium phase-space distributions. Phys. Rev. A Gen. Phys. 31, 1695–1697 (1985).
76. M. Parrinello, A. Rahman, Polymorphic transitions in single crystals: A new molecular dynamics method. J. Appl. Phys. 52, 7182–7190 (1981).
77. B. Hess, P-LINCS: A parallel linear constraint solver for molecular simulation. J. Chem. Theor. Comput. 4, 116–122 (2008).
78. W. Humphrey, A. Dalke, K. Schulten, VMD: Visual molecular dynamics. J. Mol. Graph. Mod. 14, 33–38 (1996).
Acknowledgments: We are thankful to the Center for Scientific Computing (CSC), Finland, for high-performance computing support, specially acknowledging the pilot grand challenge project Complexity2 (Mahti supercomputer). We also acknowledge PRACE for awarding us access to Marconi100 at CINECA, Italy. We acknowledge technical assistance by K. Siegmund and S. Prinz. Funding: This work was supported by the German Research Foundation (Deutsche Forschungsgemeinschaft) grant ZI 552/4-2 (to V.Z.), Sigrid Jusélius Foundation senior researcher and project grant (to V.S.), Jane and Aatos Erkko Foundation project grant (V.S.), Academy of Finland grants 294652 and 338176 (to V.S.), University of Helsinki grant (to V.S.), and Magnus Ehrnrooth Foundation grant (to V.S.). EM data were collected and processed through the cryo-EM suite of the MPI of Biophysics, funded by the Max Planck Society. Author contributions: K.P. purified and characterized complex I, prepared cryo-EM grids, acquired and processed cryo-EM data, analyzed the data, drew figures, and wrote the manuscript. J.L. performed modeling and simulations, analyzed the data, drew the figures, and wrote the manuscript. D.J.M. collected cryo-EM data. A.D. performed simulations, analyzed the data, and drew the figures. O.H. analyzed the data and drew figures. E.G.Y. performed mutagenesis and analyzed mutants. H.X. provided quinol oxidase. W.K. provided cryo-EM infrastructure, supervised the cryo-EM work, and wrote the manuscript. J.V. analyzed the data, built the models, drew the figures, and wrote the manuscript. V.S. analyzed the data and interpreted its mechanistic implications, supervised modeling and simulation work, drew the figures, and wrote the manuscript. V.Z. designed the study, interpreted the mechanistic implications of the structures, drew the figures, and wrote the manuscript. Competing interests: The authors declare that they have no competing interests. Data and materials availability: All data needed to evaluate the conclusions in the paper are present in the paper and/or the Supplementary Materials. Cryo-EM maps of D form and turnover structure have been deposited in the electron microscopy data bank (EMDB) under accession codes EMD-12742 and EMD-12741, respectively. The atomic models have been deposited in the Protein Data Bank (PDB) under accession codes 7o71 and 7o6y.
Submitted 5 May 2021Accepted 24 September 2021Published 12 November 202110.1126/sciadv.abj3221
Dow
nloaded from https://w
ww
.science.org on Decem
ber 01, 2021

Use of think article is subject to the Terms of service
Science Advances (ISSN ) is published by the American Association for the Advancement of Science. 1200 New York Avenue NW,Washington, DC 20005. The title Science Advances is a registered trademark of AAAS.Copyright © 2021 The Authors, some rights reserved; exclusive licensee American Association for the Advancement of Science. No claimto original U.S. Government Works. Distributed under a Creative Commons Attribution NonCommercial License 4.0 (CC BY-NC).
High-resolution structure and dynamics of mitochondrial complex I—Insights intothe proton pumping mechanismKristian PareyJonathan LashamDeryck J. MillsAmina DjurabekovaOuti HaapanenEtienne Galemou YogaHao XieWernerKühlbrandtVivek SharmaJanet VonckVolker Zickermann
Sci. Adv., 7 (46), eabj3221. • DOI: 10.1126/sciadv.abj3221
View the article onlinehttps://www.science.org/doi/10.1126/sciadv.abj3221Permissionshttps://www.science.org/help/reprints-and-permissions
Dow
nloaded from https://w
ww
.science.org on Decem
ber 01, 2021