high resolution refraction seismic tomographyd284f45nftegze.cloudfront.net/gec/lithium exploration...
TRANSCRIPT
High Resolution Refraction Seismic Tomography
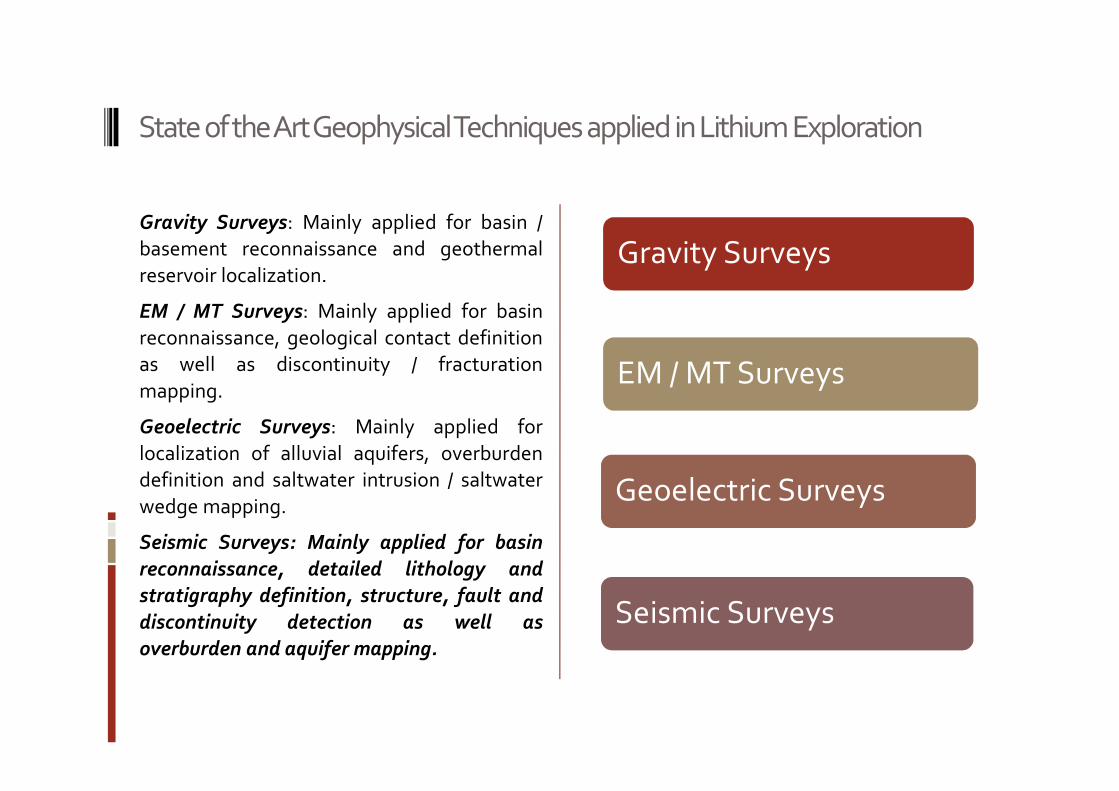
State of the Art Geophysical Techniques applied in Lithium Exploration
Gravity Surveys: Mainly applied for basin /
basement reconnaissance and geothermal
reservoir localization.
EM / MT Surveys: Mainly applied for basin
reconnaissance, geological contact definition
as well as discontinuity / fracturation
mapping.
Geoelectric Surveys: Mainly applied for
localization of alluvial aquifers, overburden
definition and saltwater intrusion / saltwater
wedge mapping.
Seismic Surveys: Mainly applied for basin
reconnaissance, detailed lithology and
stratigraphy definition, structure, fault and
discontinuity detection as well as
overburden and aquifer mapping.
Gravity Surveys
EM / MT Surveys
Geoelectric Surveys
Seismic Surveys
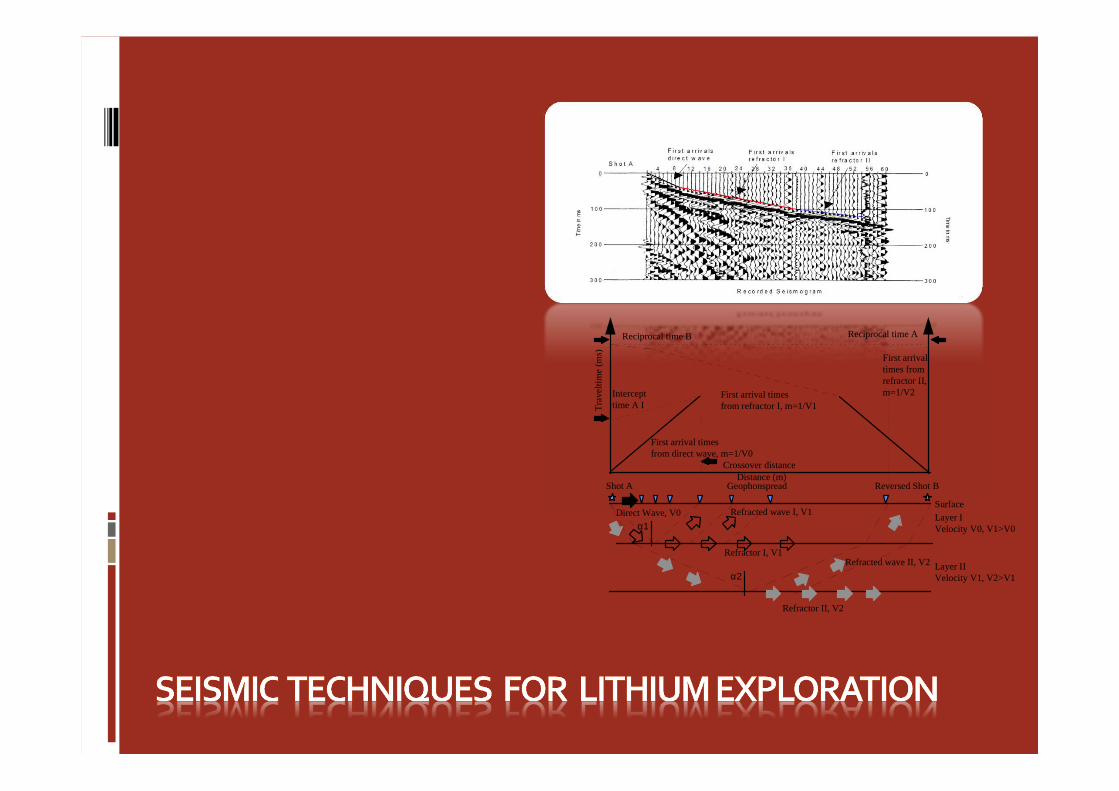
Refractor II, V2
Refractor I, V1
Direct Wave, V0
Layer IVelocity V0, V1>V0
Surface
Layer IIVelocity V1, V2>V1
GeophonspreadShot A Reversed Shot B
First arrival timesfrom direct wave, m=1/V0
Crossover distanceDistance (m)
First arrival timesfrom refractor I, m=1/V1
First arrivaltimes fromrefractor II,m=1/V2
Tra
velti
me
(ms)
Intercepttime A I
Reciprocal time B Reciprocal time A
Refracted wave I, V1
Refracted wave II, V2
α2
α1
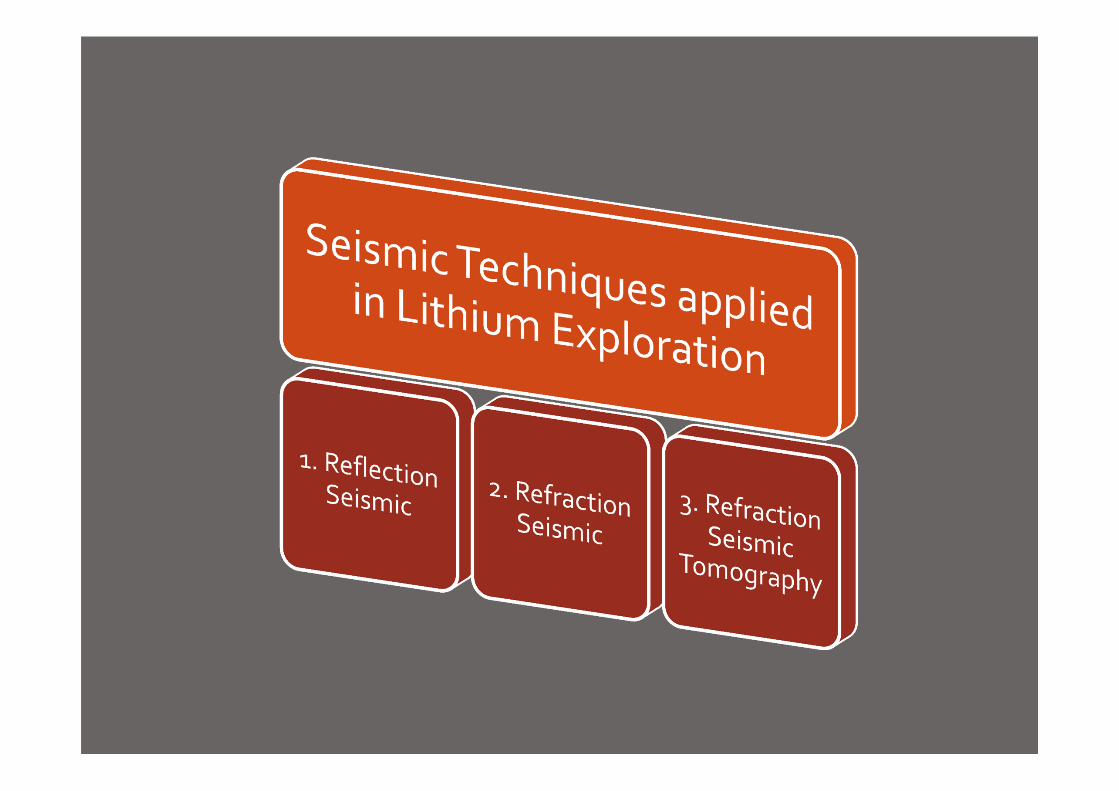
Seismic Techniques
Introduction
The difference between seismic refraction and seismic reflection is neverobvious to the non geophysicist, and rarely explained in simple terms bygeophysicists. Due to the similarity of the names, many non geophysicistsassume that the terms are interchangeable, or are unaware that there arecritical differences between the two techniques that may make one vastlypreferred or the other completely unusable given site specific conditionsor project goals.
General Seismic Principles
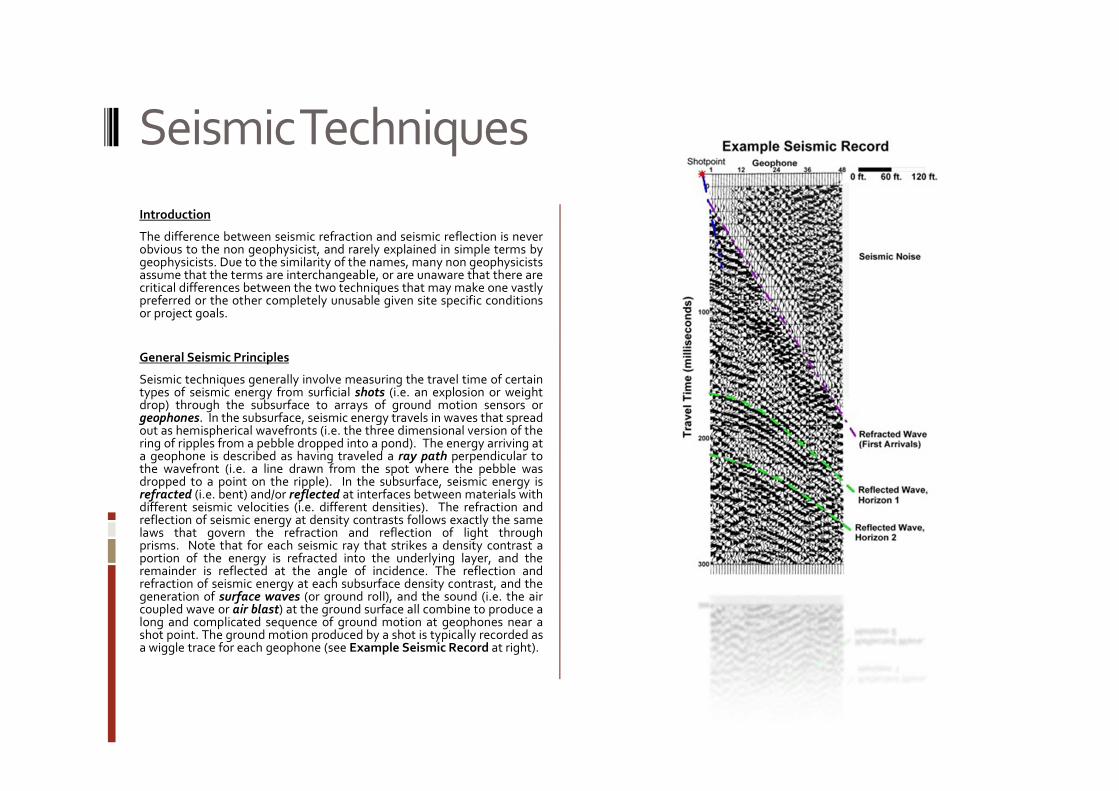
Seismic techniques generally involve measuring the travel time of certaintypes of seismic energy from surficial shots (i.e. an explosion or weightdrop) through the subsurface to arrays of ground motion sensors orgeophones. In the subsurface, seismic energy travels in waves that spreadout as hemispherical wavefronts (i.e. the three dimensional version of thering of ripples from a pebble dropped into a pond). The energy arriving ata geophone is described as having traveled a ray path perpendicular tothe wavefront (i.e. a line drawn from the spot where the pebble wasdropped to a point on the ripple). In the subsurface, seismic energy isrefracted (i.e. bent) and/or reflected at interfaces between materials withdifferent seismic velocities (i.e. different densities). The refraction andreflection of seismic energy at density contrasts follows exactly the samelaws that govern the refraction and reflection of light throughprisms. Note that for each seismic ray that strikes a density contrast aportion of the energy is refracted into the underlying layer, and theremainder is reflected at the angle of incidence. The reflection andrefraction of seismic energy at each subsurface density contrast, and thegeneration of surface waves (or ground roll), and the sound (i.e. the aircoupled wave or air blast) at the ground surface all combine to produce along and complicated sequence of ground motion at geophones near ashot point. The ground motion produced by a shot is typically recorded asa wiggle trace for each geophone (see Example Seismic Record at right).
1. Reflection Seismic Method
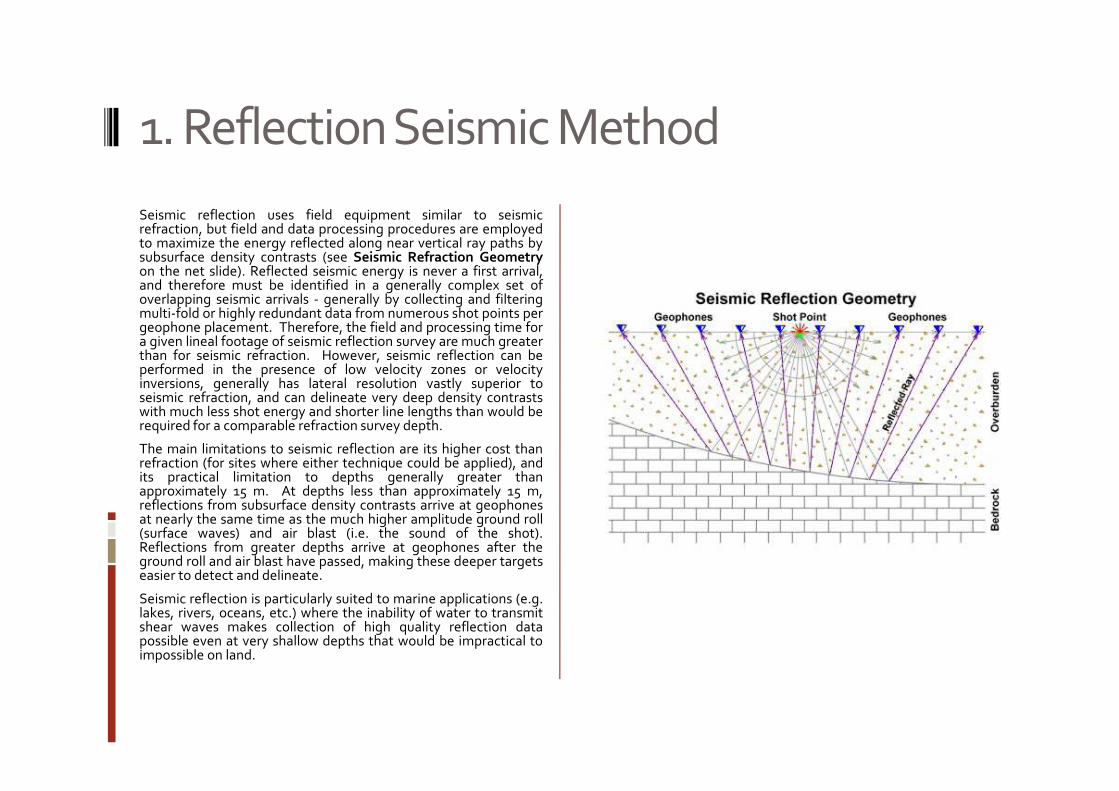
Seismic reflection uses field equipment similar to seismicrefraction, but field and data processing procedures are employedto maximize the energy reflected along near vertical ray paths bysubsurface density contrasts (see Seismic Refraction Geometryon the net slide). Reflected seismic energy is never a first arrival,and therefore must be identified in a generally complex set ofoverlapping seismic arrivals - generally by collecting and filteringmulti-fold or highly redundant data from numerous shot points pergeophone placement. Therefore, the field and processing time fora given lineal footage of seismic reflection survey are much greaterthan for seismic refraction. However, seismic reflection can beperformed in the presence of low velocity zones or velocityinversions, generally has lateral resolution vastly superior toseismic refraction, and can delineate very deep density contrastswith much less shot energy and shorter line lengths than would berequired for a comparable refraction survey depth.
The main limitations to seismic reflection are its higher cost thanrefraction (for sites where either technique could be applied), andits practical limitation to depths generally greater thanapproximately 15 m. At depths less than approximately 15 m,reflections from subsurface density contrasts arrive at geophonesat nearly the same time as the much higher amplitude ground roll(surface waves) and air blast (i.e. the sound of the shot).Reflections from greater depths arrive at geophones after theground roll and air blast have passed, making these deeper targetseasier to detect and delineate.
Seismic reflection is particularly suited to marine applications (e.g.lakes, rivers, oceans, etc.) where the inability of water to transmitshear waves makes collection of high quality reflection datapossible even at very shallow depths that would be impractical toimpossible on land.
2. Refraction Seismic Method
Seismic Refraction
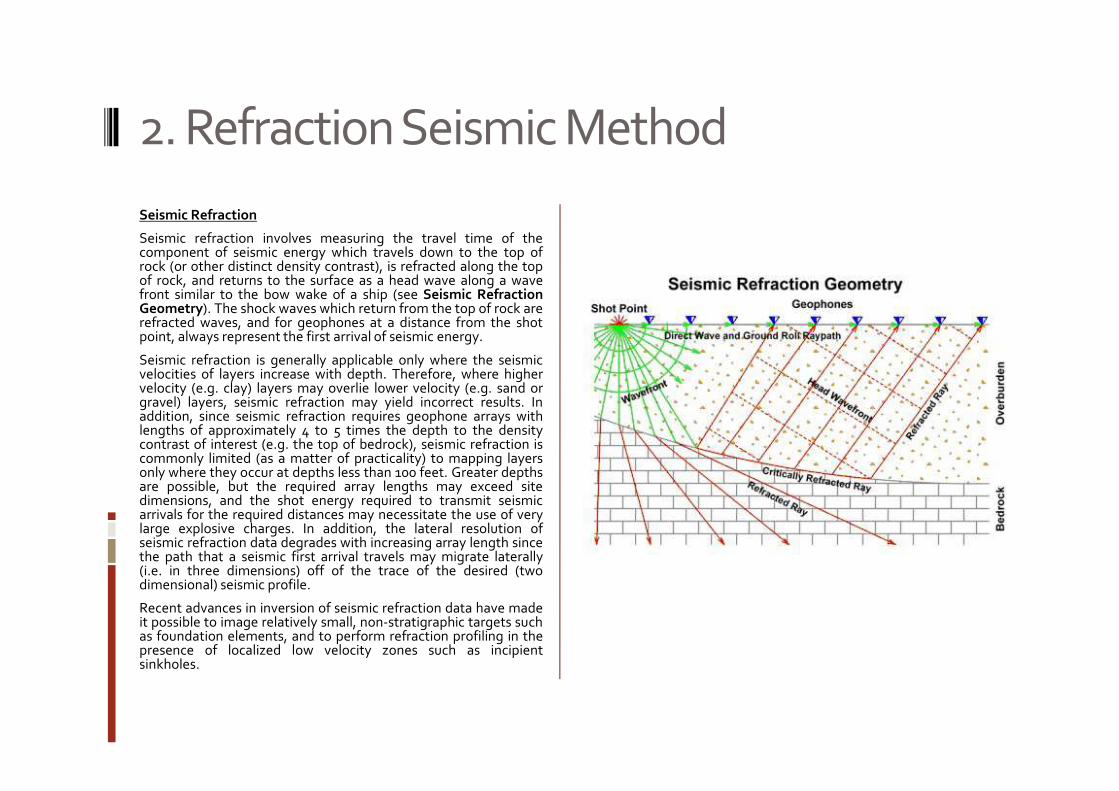
Seismic refraction involves measuring the travel time of thecomponent of seismic energy which travels down to the top ofrock (or other distinct density contrast), is refracted along the topof rock, and returns to the surface as a head wave along a wavefront similar to the bow wake of a ship (see Seismic RefractionGeometry). The shock waves which return from the top of rock arerefracted waves, and for geophones at a distance from the shotpoint, always represent the first arrival of seismic energy.
Seismic refraction is generally applicable only where the seismicvelocities of layers increase with depth. Therefore, where highervelocity (e.g. clay) layers may overlie lower velocity (e.g. sand orgravel) layers, seismic refraction may yield incorrect results. Inaddition, since seismic refraction requires geophone arrays withlengths of approximately 4 to 5 times the depth to the densitycontrast of interest (e.g. the top of bedrock), seismic refraction iscommonly limited (as a matter of practicality) to mapping layersonly where they occur at depths less than 100 feet. Greater depthsare possible, but the required array lengths may exceed sitedimensions, and the shot energy required to transmit seismicarrivals for the required distances may necessitate the use of verylarge explosive charges. In addition, the lateral resolution ofseismic refraction data degrades with increasing array length sincethe path that a seismic first arrival travels may migrate laterally(i.e. in three dimensions) off of the trace of the desired (twodimensional) seismic profile.
Recent advances in inversion of seismic refraction data have madeit possible to image relatively small, non-stratigraphic targets suchas foundation elements, and to perform refraction profiling in thepresence of localized low velocity zones such as incipientsinkholes.
3. Seismic Refraction Tomography
The traditional technique for processing and interpretation of refraction seismic
data (see 2. Refraction Seismics,) often results in geological models which show
disturbed subsoil areas (deformations, weak zones, discontinuities, faults, etc.) as
a thin sharp low velocity zone surrounded by fresh rock. The real case is most
likely much more complex. Deformation zones may have a narrow core of heavily
crushed rocks, but they are often surrounded by a wider zone (influence area)
constituting altered, fractured rocks with deteriorated mechanical properties as
compared to the fresh rock.
In order to extract more information from the seismic data as compared to the
traditional processing technique, to overcome the limitations of the standard
refraction seismic technique and to be able to create more advanced geological
models (more diverse bedrock velocity models) that come closer to the complex
reality, the data are processed by use of modern computerized tools for analyzing
refraction seismic data with tomography inversion techniques.
The tomography inversion is performed with the software RAYFRACTTM. The
program uses so called WET orWave Eikonal Traveltime tomography processing.
The software RAYFRACT is a windows based 32-bits software package for
processing of refraction seismic data. The program basically offers two different
ways of processing the data:
1.Delta T-V method, Gebrande and Miller (1985). The Delta TV method is a
pseudo 2D Inversion method that delivers a continuous 1D velocity versus depth
model for all geophone stations. The method handles real life geological
situations such as velocity gradients / linear increasing of velocity with depth /
velocity inversions / pinching out layers and outcrops / faults and local velocity
anomalies gracefully. It is especially a very strong tool for structural interpretation
of the geologic situation.
Refraction Seismic Tomography
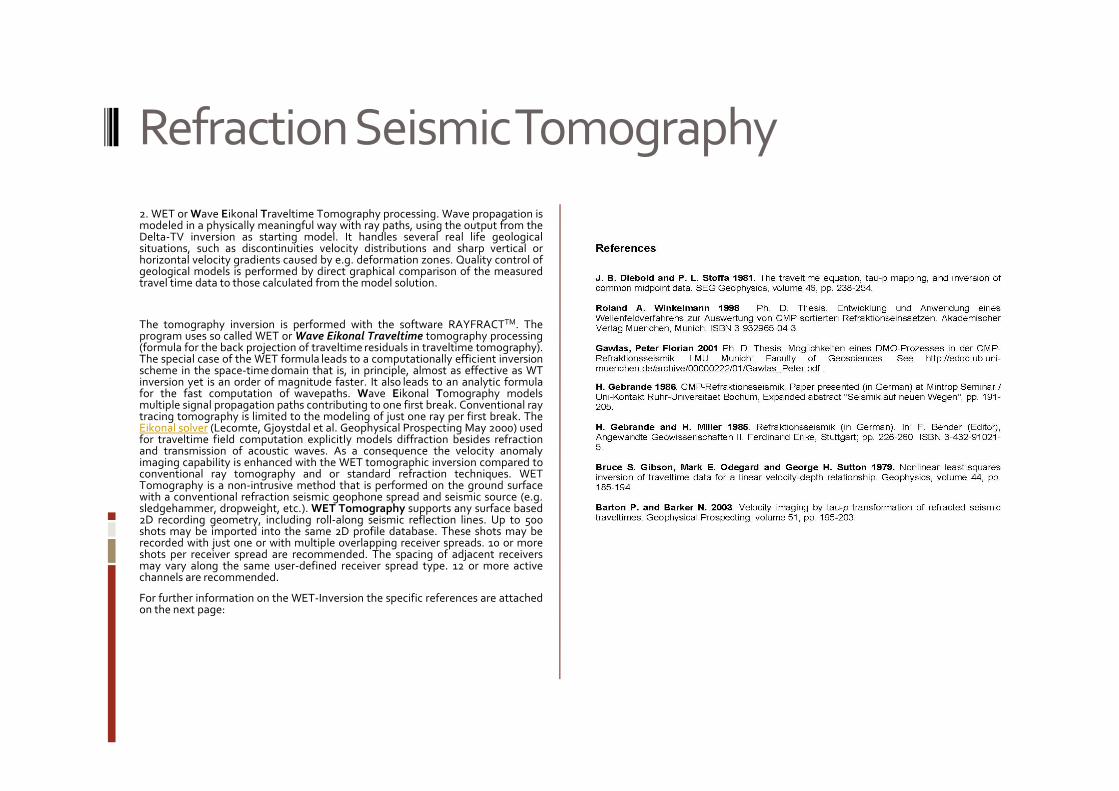
2. WET or Wave Eikonal Traveltime Tomography processing. Wave propagation ismodeled in a physically meaningful way with ray paths, using the output from theDelta-TV inversion as starting model. It handles several real life geologicalsituations, such as discontinuities velocity distributions and sharp vertical orhorizontal velocity gradients caused by e.g. deformation zones. Quality control ofgeological models is performed by direct graphical comparison of the measuredtravel time data to those calculated from the model solution.
The tomography inversion is performed with the software RAYFRACTTM. Theprogram uses so called WET orWave Eikonal Traveltime tomography processing(formula for the back projection of traveltime residuals in traveltime tomography).The special case of the WET formula leads to a computationally efficient inversionscheme in the space-time domain that is, in principle, almost as effective as WTinversion yet is an order of magnitude faster. It also leads to an analytic formulafor the fast computation of wavepaths. Wave Eikonal Tomography modelsmultiple signal propagation paths contributing to one first break. Conventional raytracing tomography is limited to the modeling of just one ray per first break. TheEikonal solver (Lecomte, Gjoystdal et al. Geophysical Prospecting May 2000) usedfor traveltime field computation explicitly models diffraction besides refractionand transmission of acoustic waves. As a consequence the velocity anomalyimaging capability is enhanced with the WET tomographic inversion compared toconventional ray tomography and or standard refraction techniques. WETTomography is a non-intrusive method that is performed on the ground surfacewith a conventional refraction seismic geophone spread and seismic source (e.g.sledgehammer, dropweight, etc.). WET Tomography supports any surface based2D recording geometry, including roll-along seismic reflection lines. Up to 500shots may be imported into the same 2D profile database. These shots may berecorded with just one or with multiple overlapping receiver spreads. 10 or moreshots per receiver spread are recommended. The spacing of adjacent receiversmay vary along the same user-defined receiver spread type. 12 or more activechannels are recommended.
For further information on the WET-Inversion the specific references are attachedon the next page:
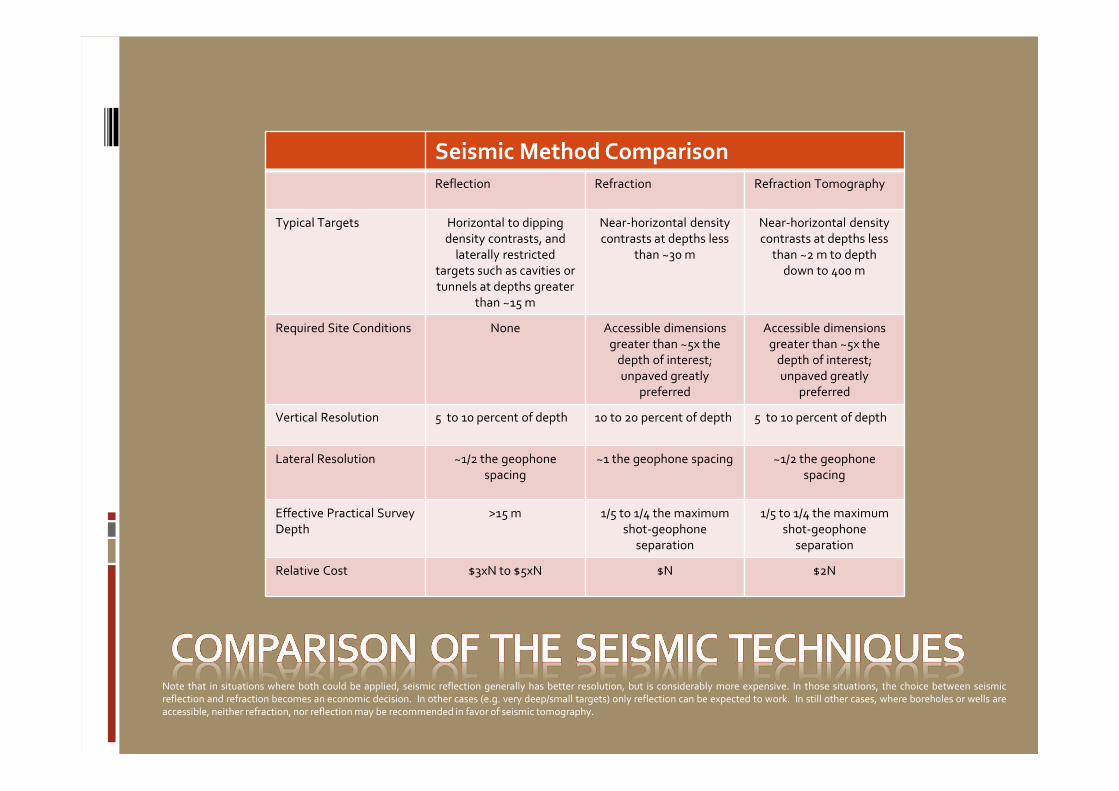
Seismic Method Comparison
Reflection Refraction Refraction Tomography
Typical Targets Horizontal to dipping
density contrasts, and
laterally restricted
targets such as cavities or
tunnels at depths greater
than ~15 m
Near-horizontal density
contrasts at depths less
than ~30 m
Near-horizontal density
contrasts at depths less
than ~2 m to depth
down to 400 m
Required Site Conditions None Accessible dimensions
greater than ~5x the
depth of interest;
unpaved greatly
preferred
Accessible dimensions
greater than ~5x the
depth of interest;
unpaved greatly
preferred
Vertical Resolution 5 to 10 percent of depth 10 to 20 percent of depth 5 to 10 percent of depth
Lateral Resolution ~1/2 the geophone
spacing
~1 the geophone spacing ~1/2 the geophone
spacing
Effective Practical Survey
Depth
>15 m 1/5 to 1/4 the maximum
shot-geophone
separation
1/5 to 1/4 the maximum
shot-geophone
separation
Relative Cost $3xN to $5xN $N $2N
Note that in situations where both could be applied, seismic reflection generally has better resolution, but is considerably more expensive. In those situations, the choice between seismicreflection and refraction becomes an economic decision. In other cases (e.g. very deep/small targets) only reflection can be expected to work. In still other cases, where boreholes or wells areaccessible, neither refraction, nor reflection may be recommended in favor of seismic tomography.
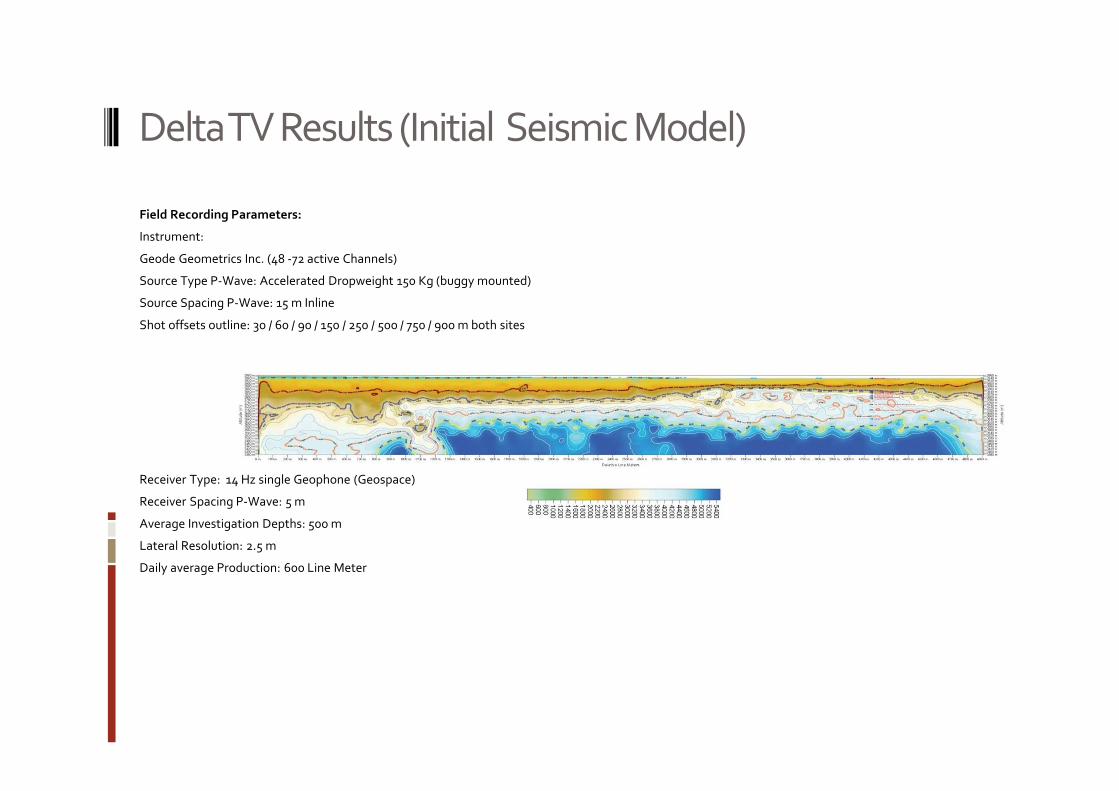
Delta TV Results (Initial Seismic Model)
Interletraje
Tachado
Subrayado con estilo
Field Recording Parameters:
Instrument:
Geode Geometrics Inc. (48 -72 active Channels)
Source Type P-Wave: Accelerated Dropweight 150 Kg (buggy mounted)
Source Spacing P-Wave: 15 m Inline
Shot offsets outline: 30 / 60 / 90 / 150 / 250 / 500 / 750 / 900 m both sites
Receiver Type: 14 Hz single Geophone (Geospace)
Receiver Spacing P-Wave: 5 m
Average Investigation Depths: 500 m
Lateral Resolution: 2.5 m
Daily average Production: 600 Line Meter
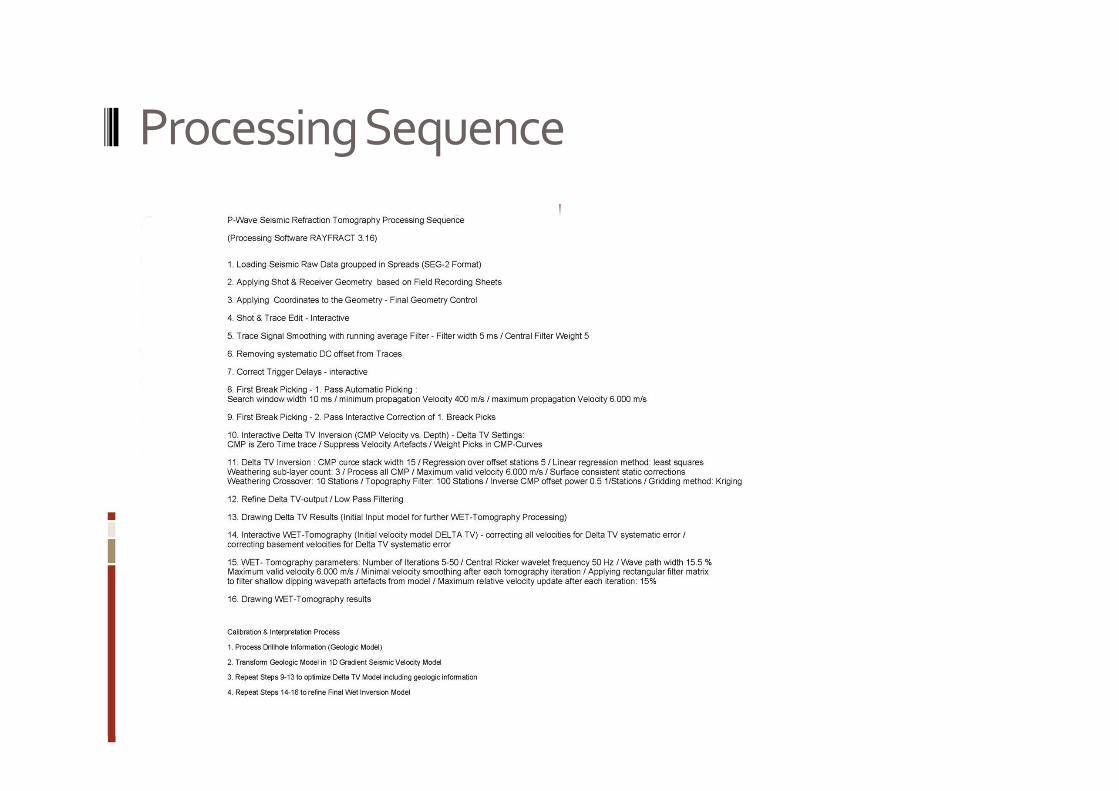
Processing Sequence
Cree un comunicado con gráficos
espectaculares. PowerPoint facilita
la creación de presentaciones para
las que normalmente se necesitaban
varias aplicaciones. Podrá aplicar con
facilidad sombras suaves, reflejos,
resplandores, biseles, 3D ¡y mucho
más!
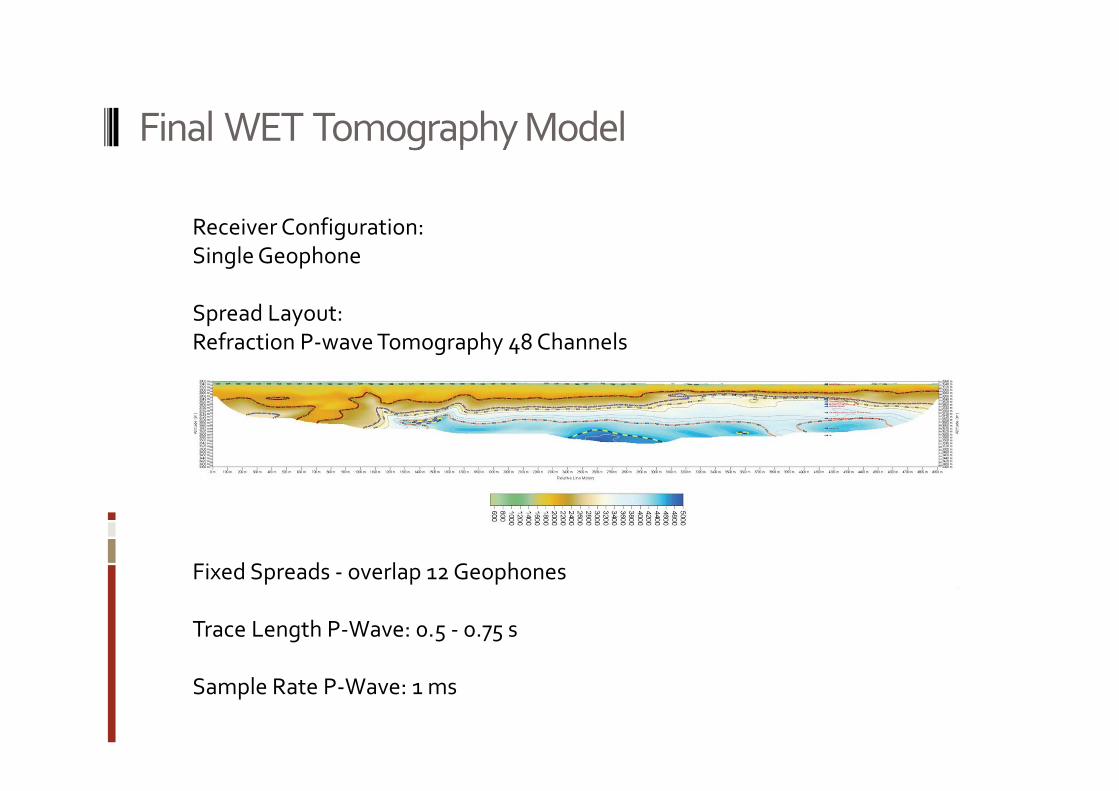
Final WET Tomography Model
Interletraje
Tachado
Subrayado con estilo
Receiver Configuration:
Single Geophone
Spread Layout:
Refraction P-wave Tomography 48 Channels
Fixed Spreads - overlap 12 Geophones
Trace Length P-Wave: 0.5 - 0.75 s
Sample Rate P-Wave: 1 ms
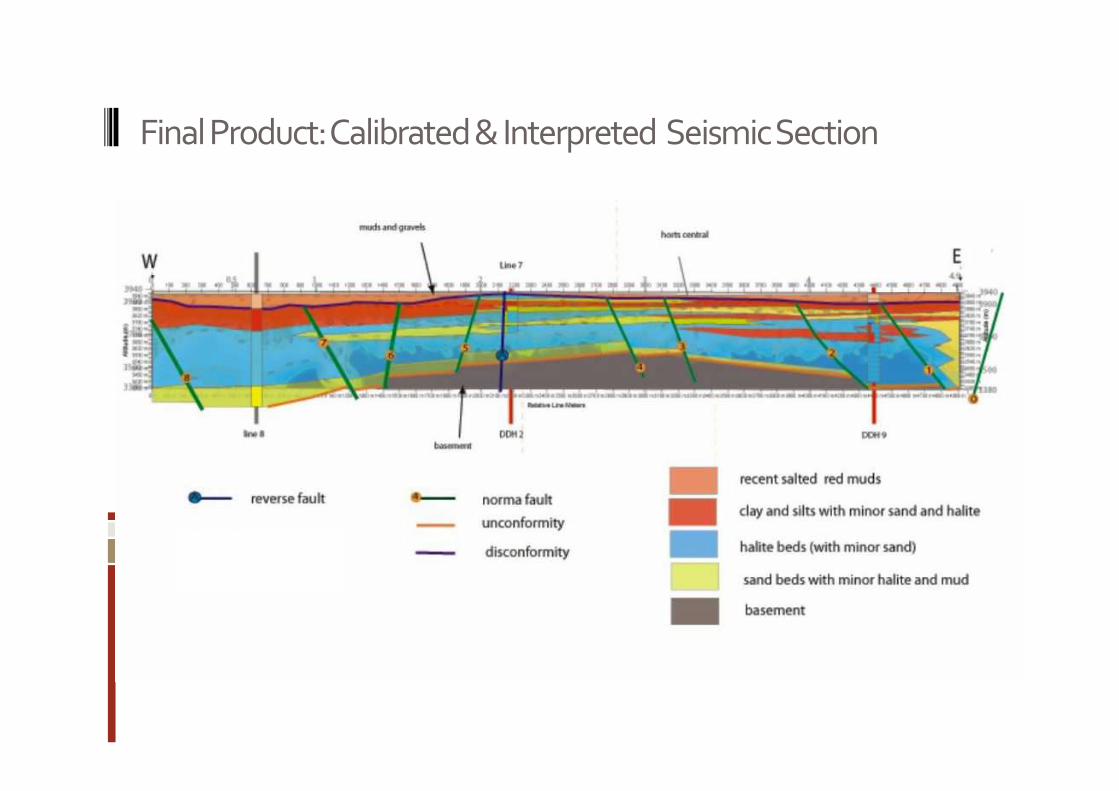
Final Product: Calibrated & Interpreted Seismic Section

References
Seismic Tomography CSAMT
� 2010 – 50.000 m Salar de Cauchari / Olaroz / Pocitos for Lithium Americas
� 2011 – 52.000 m Salar de Diablillos for Rodinia
� 2011 – 20.000 m Salar de Maricunga for Lithium 3 Energy
� 2012 – 6.500 m Pastos Grandes Salar for Eramine South America
� 2012 – 33.000 m Salar de Centenario / Ratones for EramineSouth America
� 2012 – 15.000 m Salar de Carachi Pampa for Eramine South America
� 2013 – 29.000 m Salar de Centenario / Ratones for EramineSouth America
� 2014 – 8.000 m Salar de Centenario Norte for EramineSouth America
� 2016 – 25.000 m Salar de Llullaillaco for International Lithium Corporation
� 2007 – 205 VES Soundings Salar de Arizaro, Vega Arizaro, Socompa, Llullaillaco, Ricon for Minas Argentinas
� 2010 – 110 VES Soundings Salar Cauchari / Olaroz for Lithium Americas
� 2011 – 50 VES Soundings Salar del Hombre Muerto / Sal de Vida for Lithium One / Galaxy
� 2011 – 134 CSAMT Soundings Laguna Verde, PastosGrandes y Salar de Rincon for Eramine South America
� 2012 – 202 CSAMT Soundings Salar de Centenario / Ratones for Eramine South America
� 2012 – 19 CSAMT Soundings Salar de Carachi Pampa for Eramine South America
� 2013 – 44 CSAMT Soundings Salar de Centenario / Ratones for Eramine South America
� 2013 – 46 CSAMT Soundings Salar del Hombre Muerto / Olaroz for Minera Santa Rita
� 2014 – 127 CSAMT Soundings Salar de Centenario / Ratones for Eramine South America
� 2015 – 68 CSAMT Soundings Salar de Arizaro for EramineSouth America
