high-resolution probabilistic scenarios for · high-resolution probabilistic scenarios for...
TRANSCRIPT
High-resolution probabilistic scenarios for
wine-making
Philippe Roy, Patrick Grenier, Evelyne Barriault and Diane Chaumont
4 mai 2015
[email protected] 514-282-6464, 349#

• What is the probability to have increased wine-making conditions over the province of Québec in the next decades?
•Where?
• When?
Main questions
• Vine needs temperature for growth!
• Based on users input (Barriault et al. 2013) : • Minimum number of consecutive days without ground
frost : 150 days without frost
• Enough degree-days (bare minimum being ~900)
• Gentle wintertime minimum temperature (there are workaround to reduce the vulnerability to brutal wintertime temperatures)
• Based on these indices, we estimate the probability to exceed some defined thresholds over the agricultural regions in Québec
Basics of (climate) wine-making suitability

Highlight #1 : New regions emerge
What are the new regions that will be suitable for wine making? We need at least 900 degree days.
The color scale gives the year where the probability to exceed 900 DD is higher than 80%
2020-2030

Highlight #1 : New regions emerge
What about length of season without frost?
Consecutive days without frost
The color scale gives the year where the probability to exceed 180 days without frost is higher than 80%
Highest threshold

Highlight #1 : New regions emerge
What about length of season without frost?
Consecutive days without frost
The 2 indices gives complementary information. Let’s mix them and see where they combine for an increased suitability. This will give us regions where new grape variety can be cultivated

Highlight #2 : New grape variety
What about thresholds that would allow Vinis Vinifera grape variety? 180 days without frost and 1250 DD
Some Vitis Vinifera grape variety:
• Chardonnay • Pinot Noir • Gamay • ...

Highlight #2 : New grape variety
What about thresholds that would allow Vinis Vinifera grape variety? 180 days without frost and 1250 DD
Quite good! Especially in the southern part of the province of Québec
Some Vitis Vinifera grape variety:
• Chardonnay • Pinot Noir • Gamay • ...
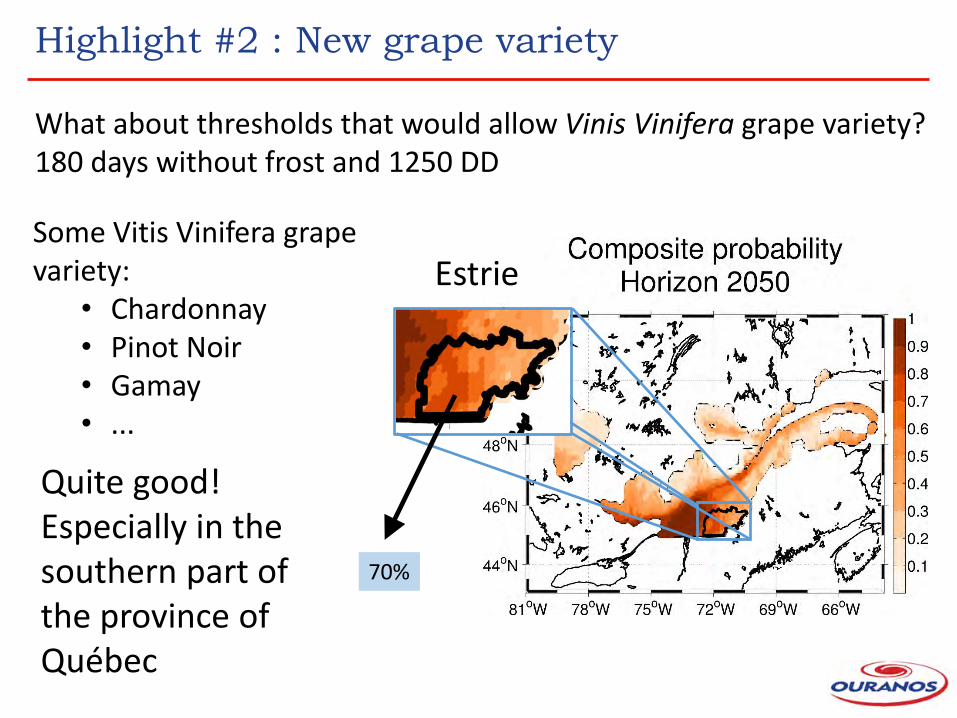
Highlight #2 : New grape variety
What about thresholds that would allow Vinis Vinifera grape variety? 180 days without frost and 1250 DD
70%
Quite good! Especially in the southern part of the province of Québec
Estrie Some Vitis Vinifera grape variety:
• Chardonnay • Pinot Noir • Gamay • ...
• By 2050, we can expect great wine-making potential in the southern part of the province of Québec
• Vinis Vinifera grape variety could strive in coming decades, though mainly in the southern part of the province of Québec
• The wine-making in Québec is still at an early stage, but things are looking good on the climate side in the next decades!
Conclusions

Methods
How are probabilities estimated?
Methods
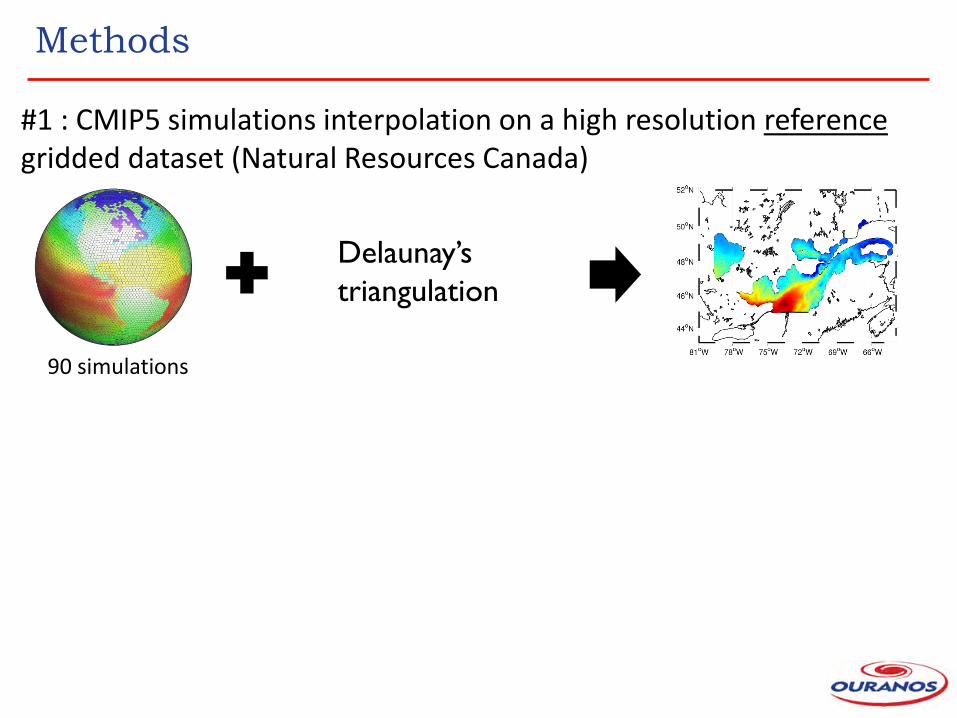
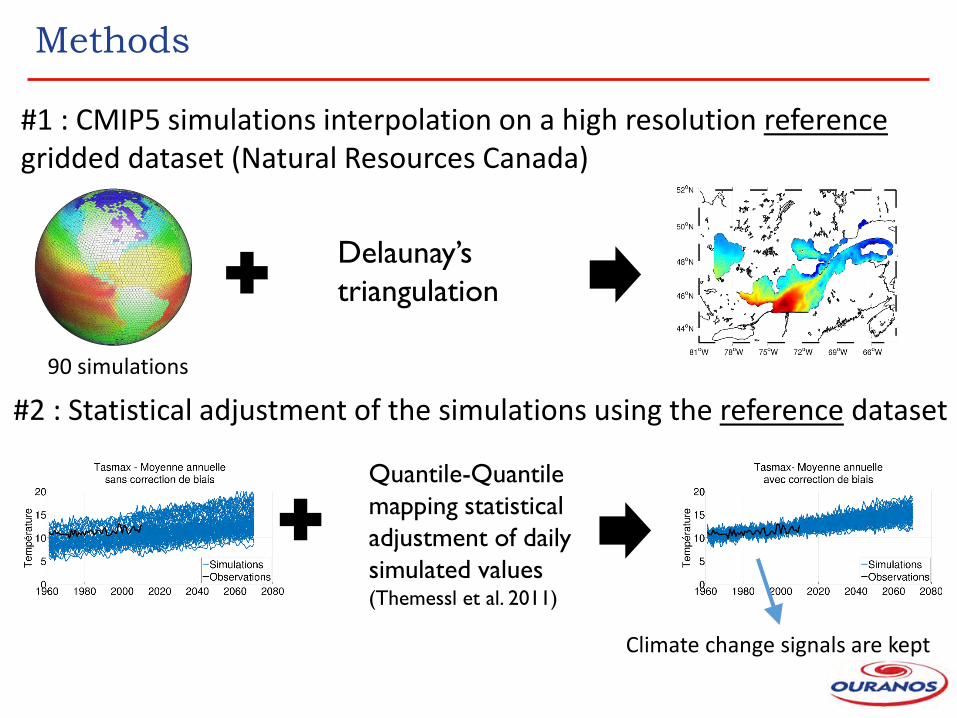
Delaunay’s
triangulation
#1 : CMIP5 simulations interpolation on a high resolution reference gridded dataset (Natural Resources Canada)
90 simulations
Methods
Delaunay’s
triangulation
#1 : CMIP5 simulations interpolation on a high resolution reference gridded dataset (Natural Resources Canada)
Quantile-Quantile
mapping statistical
adjustment of daily
simulated values (Themessl et al. 2011)
#2 : Statistical adjustment of the simulations using the reference dataset
90 simulations
Climate change signals are kept
Methods
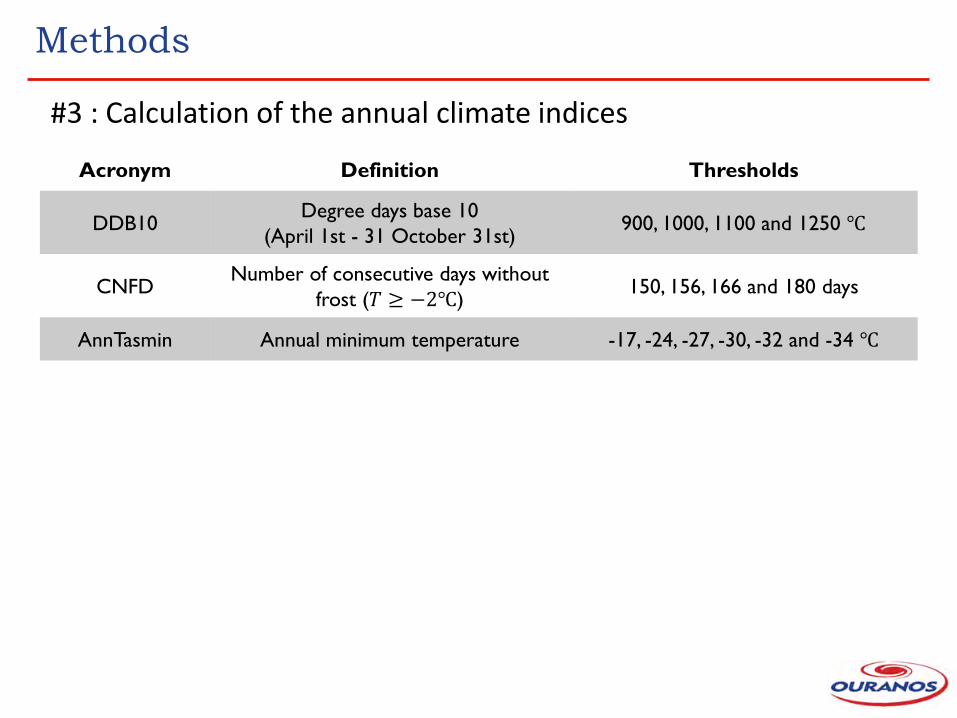
Acronym Definition Thresholds
DDB10 Degree days base 10
(April 1st - 31 October 31st) 900, 1000, 1100 and 1250 ℃
CNFD Number of consecutive days without
frost (𝑇 ≥ −2℃) 150, 156, 166 and 180 days
AnnTasmin Annual minimum temperature -17, -24, -27, -30, -32 and -34 ℃
#3 : Calculation of the annual climate indices
Methods
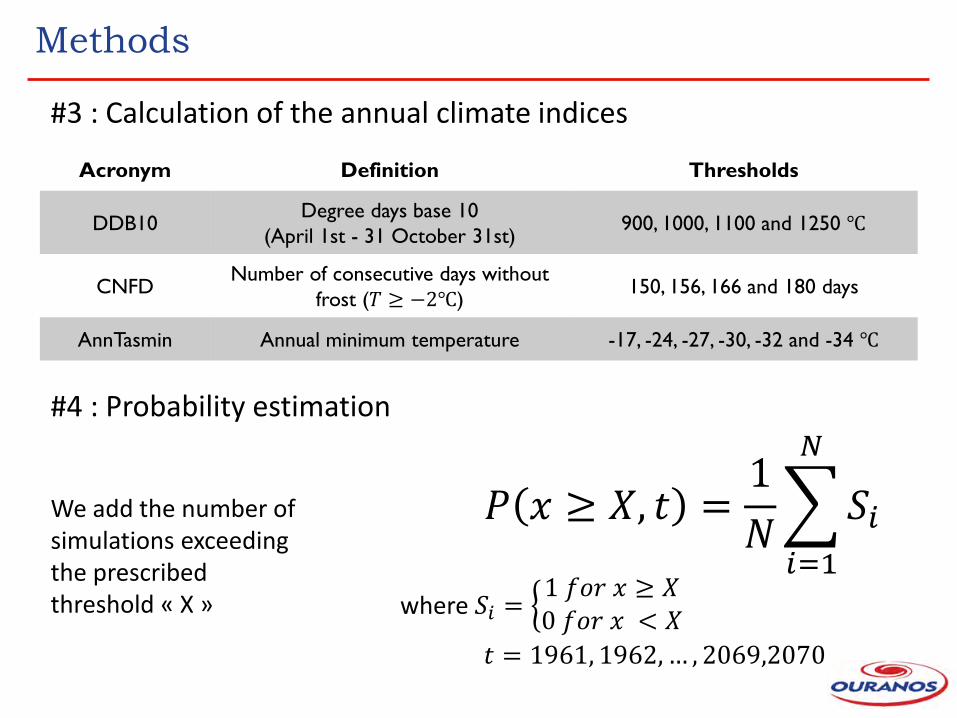
Acronym Definition Thresholds
DDB10 Degree days base 10
(April 1st - 31 October 31st) 900, 1000, 1100 and 1250 ℃
CNFD Number of consecutive days without
frost (𝑇 ≥ −2℃) 150, 156, 166 and 180 days
AnnTasmin Annual minimum temperature -17, -24, -27, -30, -32 and -34 ℃
#3 : Calculation of the annual climate indices
We add the number of simulations exceeding the prescribed threshold « X »
𝑃 𝑥 ≥ 𝑋, 𝑡 =1
𝑁 𝑆𝑖
𝑁
𝑖=1
where 𝑆𝑖 = 1 𝑓𝑜𝑟 𝑥 ≥ 𝑋0 𝑓𝑜𝑟 𝑥 < 𝑋
𝑡 = 1961, 1962,… , 2069,2070
#4 : Probability estimation

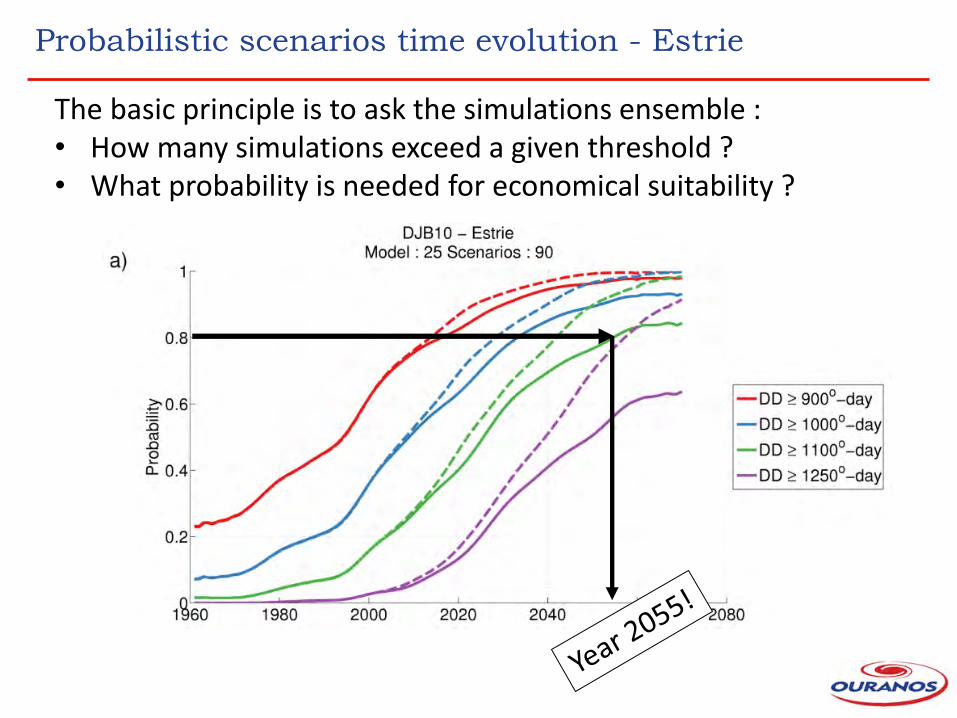
Probabilistic scenarios time evolution - Estrie
The basic principle is to ask the simulations ensemble : • How many simulations exceed a given threshold ? • What probability is needed for economical suitability ?
Probabilistic scenarios time evolution - Estrie
The basic principle is to ask the simulations ensemble : • How many simulations exceed a given threshold ? • What probability is needed for economical suitability ?
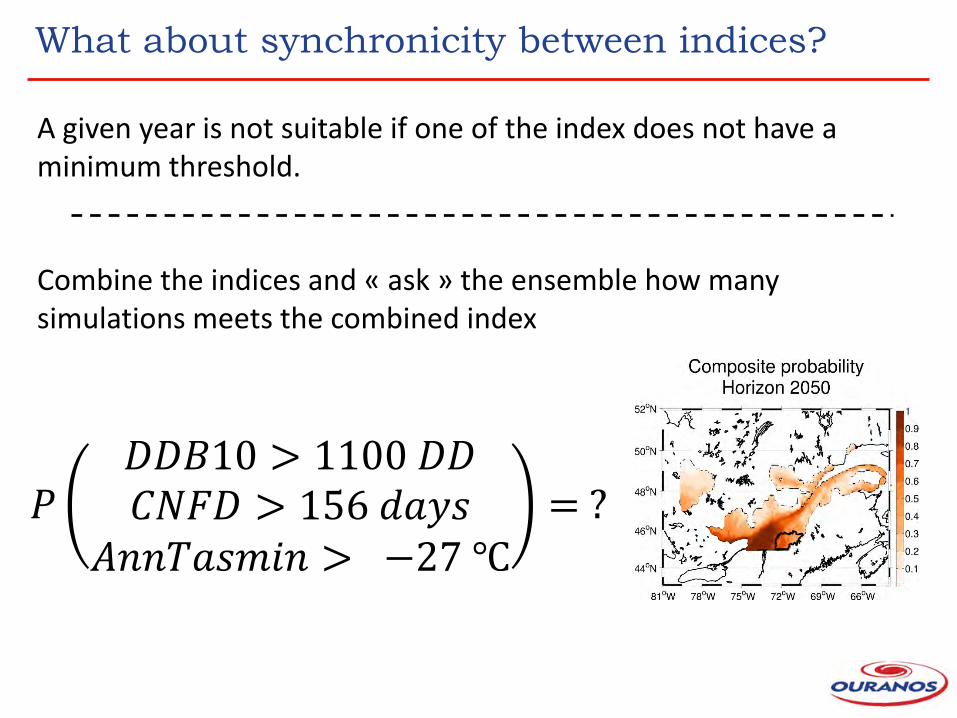
What about synchronicity between indices?
A given year is not suitable if one of the index does not have a minimum threshold.
Combine the indices and « ask » the ensemble how many simulations meets the combined index
𝑃𝐷𝐷𝐵10 > 1100 𝐷𝐷𝐶𝑁𝐹𝐷 > 156 𝑑𝑎𝑦𝑠𝐴𝑛𝑛𝑇𝑎𝑠𝑚𝑖𝑛 > −27 ℃
= ?
• The results shows that climate change is an opportunity for the wine growing sector of the economy and that the probabilistic framework can provide rich information to decision-making
• In terms of climatic conditions, we can expect increased wine-making potential (i.e. new grape variety or better conditions for actual grape variety) in some regions: • Estrie • Montérégie • Along the St-Lawrence river • Outaouais river
• The proposed probabilistic approach can be tailored to specific index, thresholds, etc…
Implications
Thank you!
Philippe Roy, [email protected]
Évelyne Barriault, [email protected]
Isabelle Charron, [email protected]
Patrick Grenier, [email protected]
Diane Chaumont, [email protected]
• Barriault, E. R. Fonclara, G. Bourgeois, A. Drouin, L. Grenon, A.R. Michaud, D. Plouffe, D. Venneman, 2013. Grille d’évaluation du potentiel viticole. Consulté sur agriréseau. http://www.agrireseau.qc.ca/Vigne-vin/documents/Guide.zip
• Efron B. ,1979. Bootstrap Methods: Another Look at the Jackknife. Ann Stat 7:1–26.
• Themeßl MJ, Gobiet A, Heinrich G., 2012. Empirical-statistical downscaling and error correction of regional climate models and its impact on the climate change signal. Clim Change 112:449–468.
References

Annex

Some heating degree days examples…
Region Heating Degree-days
Champagne, France 1131
Burgundy, France 1264
Lenswood, South Australia 1278
Bordeaux, France 1420
Coonawarra, South Australia 1437
Napa Valley, California 1499
Barossa Valley, South Australia
1587
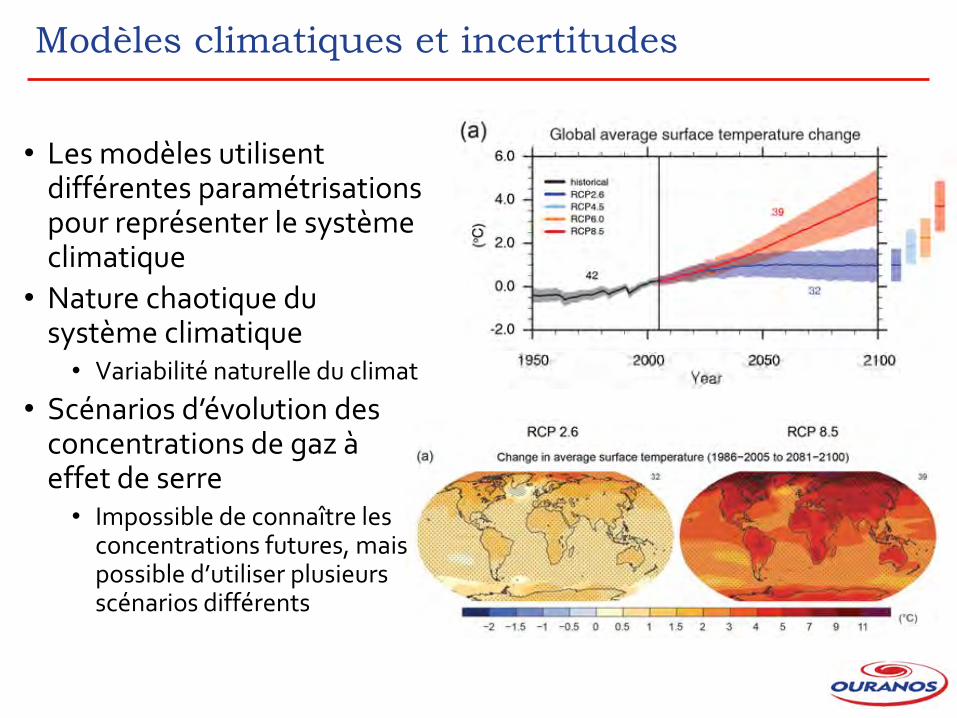
• Les modèles utilisent différentes paramétrisations pour représenter le système climatique
• Nature chaotique du système climatique • Variabilité naturelle du climat
• Scénarios d’évolution des concentrations de gaz à effet de serre • Impossible de connaître les
concentrations futures, mais possible d’utiliser plusieurs scénarios différents
Modèles climatiques et incertitudes

Détails de l’approche
probabiliste
O
A
𝑦
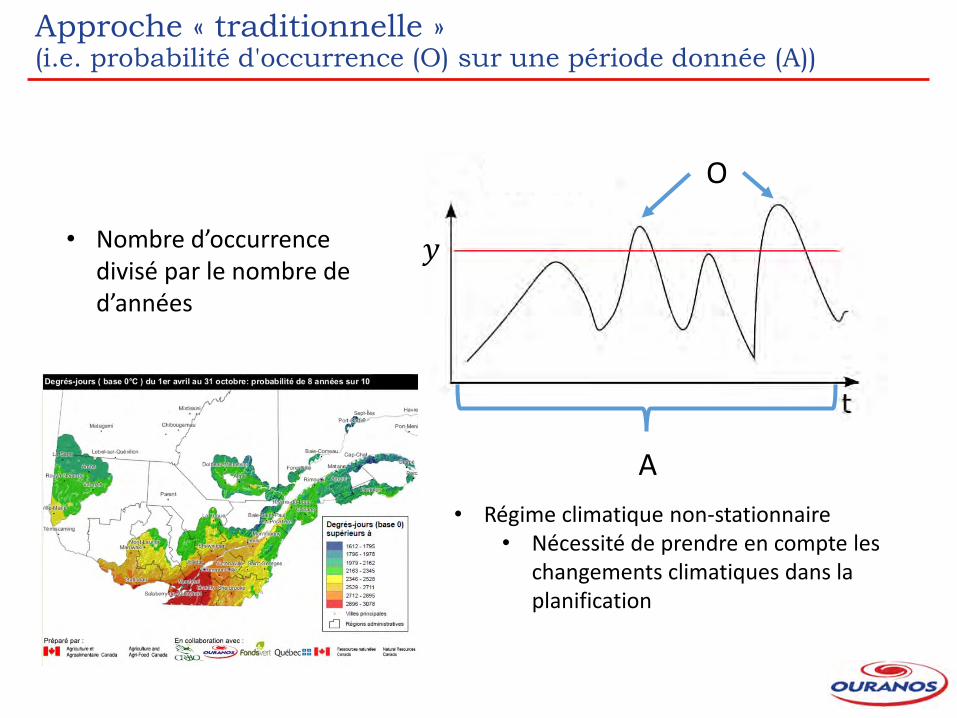
Approche « traditionnelle » (i.e. probabilité d'occurrence (O) sur une période donnée (A))
• Régime climatique non-stationnaire • Nécessité de prendre en compte les
changements climatiques dans la planification
• Nombre d’occurrence divisé par le nombre de d’années
𝑡
𝑦
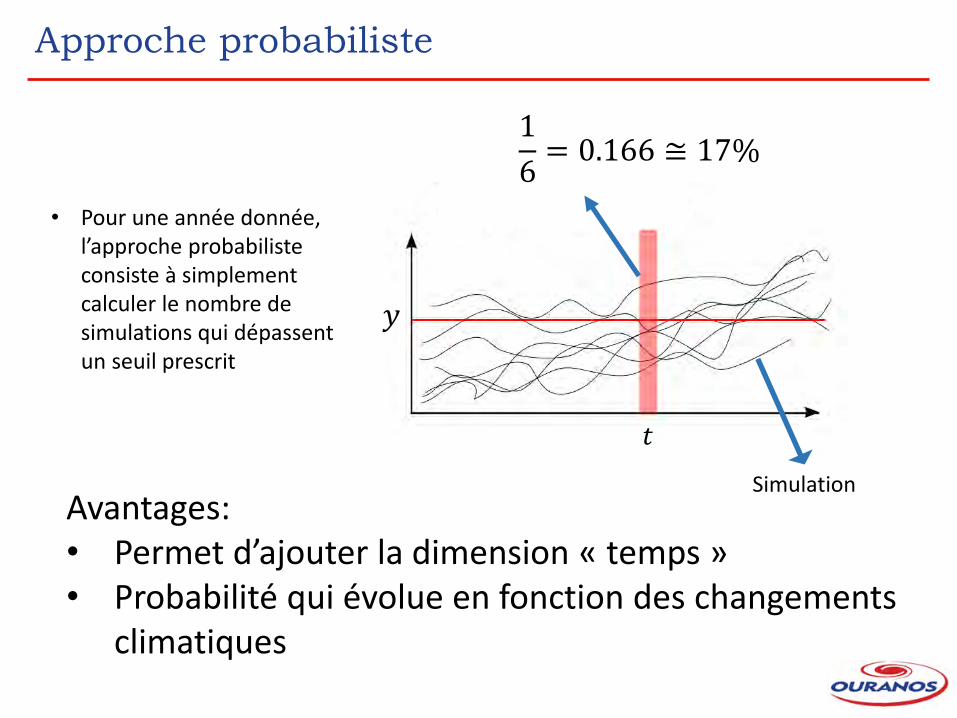
Approche probabiliste
Avantages: • Permet d’ajouter la dimension « temps » • Probabilité qui évolue en fonction des changements
climatiques
1
6= 0.166 ≅ 17%
• Pour une année donnée, l’approche probabiliste consiste à simplement calculer le nombre de simulations qui dépassent un seuil prescrit
Simulation
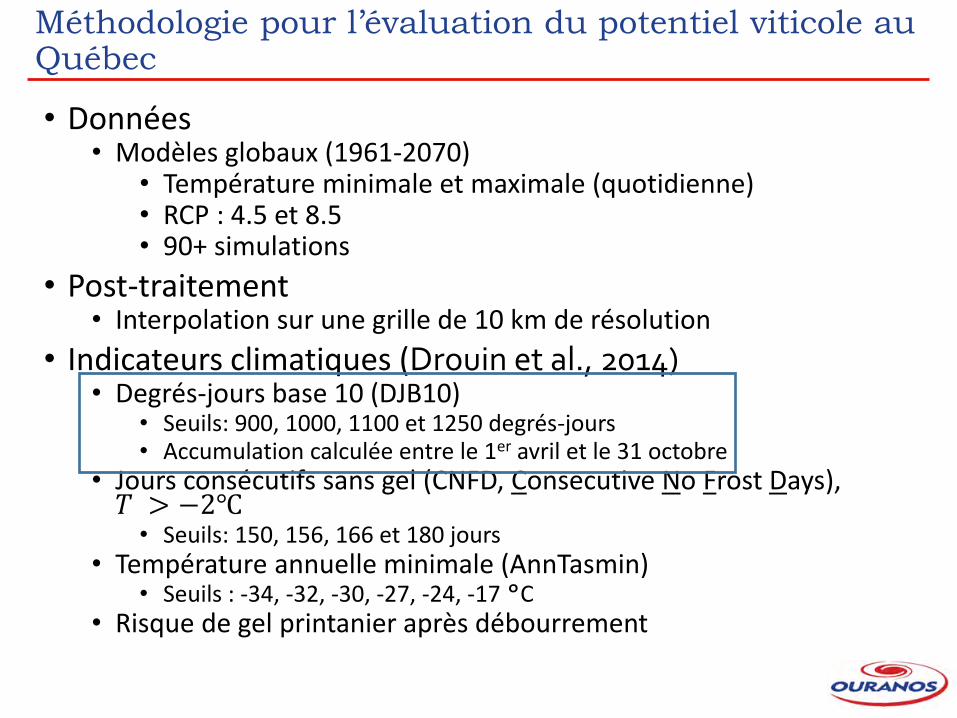
Méthodologie pour l’évaluation du potentiel viticole au Québec
• Données • Modèles globaux (1961-2070)
• Température minimale et maximale (quotidienne) • RCP : 4.5 et 8.5 • 90+ simulations
• Post-traitement • Interpolation sur une grille de 10 km de résolution
• Indicateurs climatiques (Drouin et al., 2014) • Degrés-jours base 10 (DJB10)
• Seuils: 900, 1000, 1100 et 1250 degrés-jours • Accumulation calculée entre le 1er avril et le 31 octobre
• Jours consécutifs sans gel (CNFD, Consecutive No Frost Days), 𝑇 > −2℃ • Seuils: 150, 156, 166 et 180 jours
• Température annuelle minimale (AnnTasmin) • Seuils : -34, -32, -30, -27, -24, -17 °C
• Risque de gel printanier après débourrement
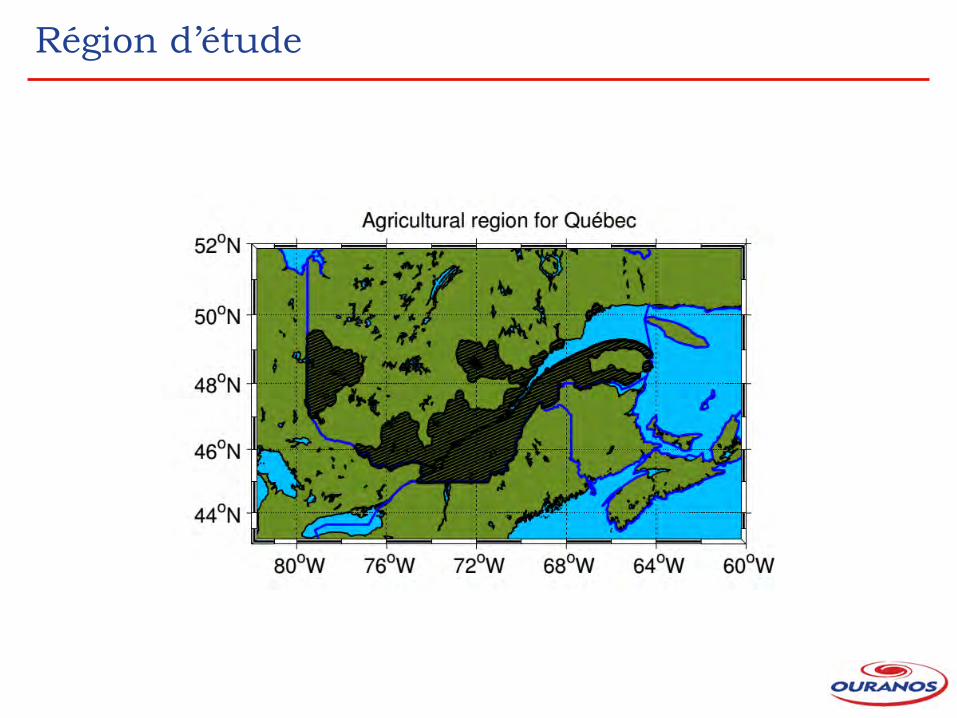
Région d’étude

Résultats
Accumulation des degrés-jours (base 10) – DJB10

Probabilité composite
Combinaison des indicateurs climatiques

• Problématique : Pour qu’une année soit considérée comme « viable », il faut une certaine synchronicité entre les indicateurs climatiques
Probabilité composite – Combinaison des indicateurs climatiques
À titre d’exemple, nous pourrions être intéressés à connaître la probabilité que chacun des indicateurs climatiques ait un score de 2 (ou plus) :
Degrés-jours ≥ 1100 ℃ Jours consécutifs sans gel ≥ 166 𝑗𝑜𝑢𝑟𝑠 Température minimale ≥ −27 ℃
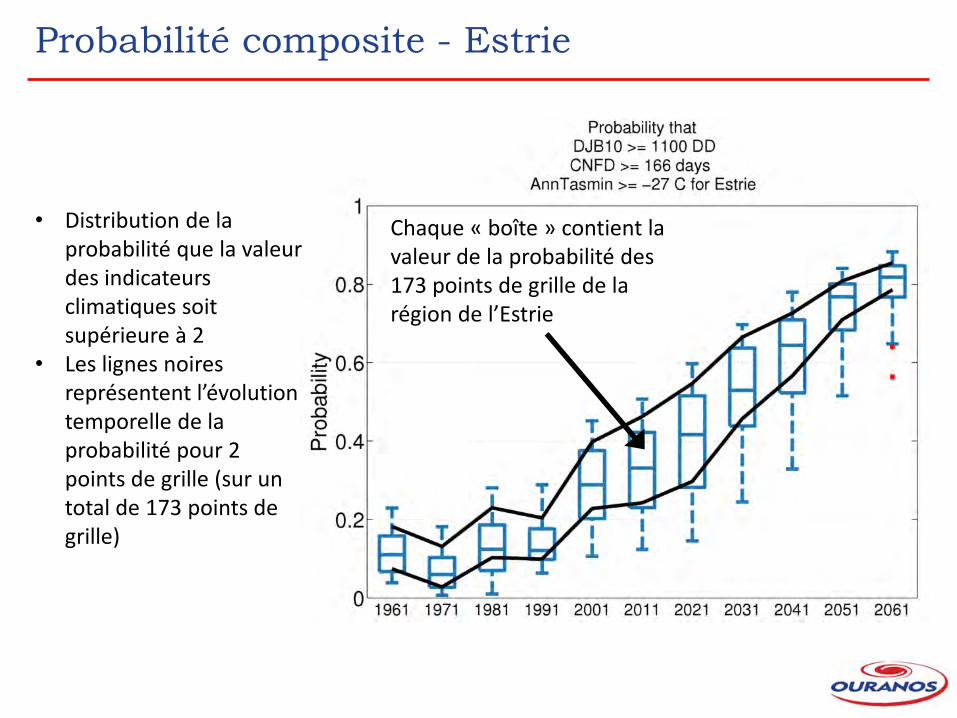
Probabilité composite - Estrie
• Distribution de la probabilité que la valeur des indicateurs climatiques soit supérieure à 2
• Les lignes noires représentent l’évolution temporelle de la probabilité pour 2 points de grille (sur un total de 173 points de grille)
Chaque « boîte » contient la valeur de la probabilité des 173 points de grille de la région de l’Estrie

Probabilité composite – Estrie
Question : Quelle est la probabilité d’avoir ces 3 indicateurs climatiques autour de l’année 2050?
70%
80%
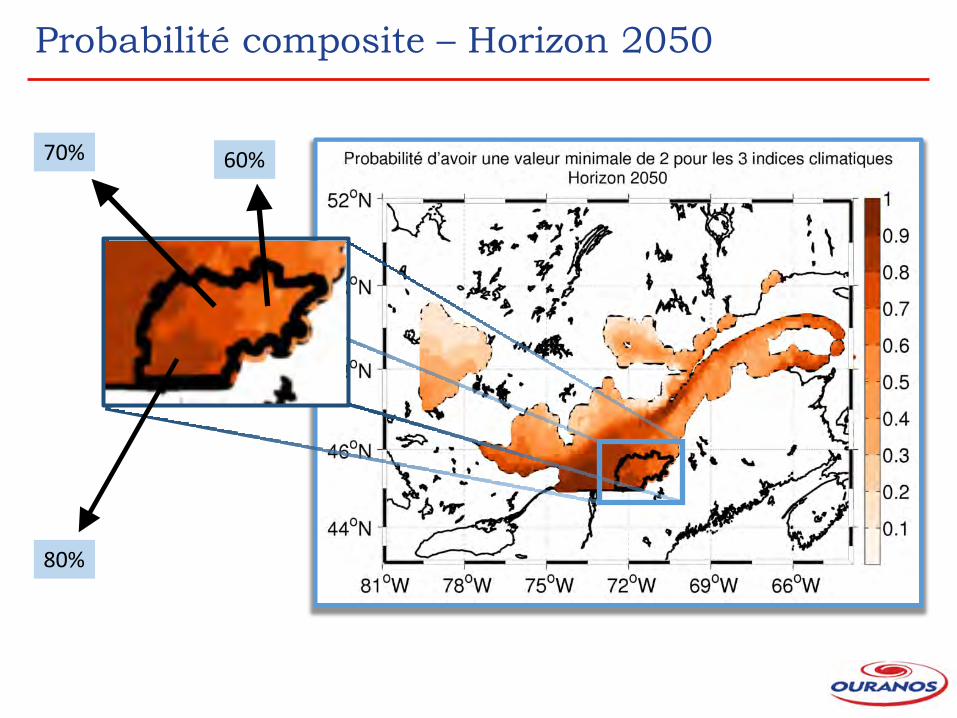
Probabilité composite – Horizon 2050
80%
70% 60%
Conclusions
• Approche probabiliste : • Méthode flexible (suffit de définir un indicateur et des
seuils d’intérêts)
• Nouvelle approche qui permet de calculer des probabilités qui prennent en compte les changements climatiques
• Questions : • Est-ce les produits proposés vous semblent faciles à
comprendre ? Si non, comment pourraient-ils être améliorés ?
• Que pensez-vous de leur format ? Devrait-il être améliorés? Comment ?

• Pensez-vous que ces produits pourraient vous être utiles dans votre pratique ? • SI OUI
• De quelle manière pourriez-vous les utiliser et à quelle fin ? • Certains produits vous semblent-ils plus utiles que d'autres ? Lesquels ?
Pour quelles raisons ? • SI NON
• Comment ces produits pourraient-ils être modifiés pour vous être utiles et à quelle fin ?
• Identifiez-vous d'autres produits de scénarios climatiques qui vous seraient utiles et pour quoi faire ?
• Identifiez-vous d'autres usagers pour ces produits dans le secteur de la viticulture, des autres productions agricoles et éventuellement d'autres secteurs d'activité ? À quelle fin ?
• Sous quelle forme et de quelle manière ces produits devraient-ils être diffusés ?
Autres questions

Annexes

Forçages radiatifs

Résultats - Degrés-jours base 10
RCP 8.5
RCP 4.5
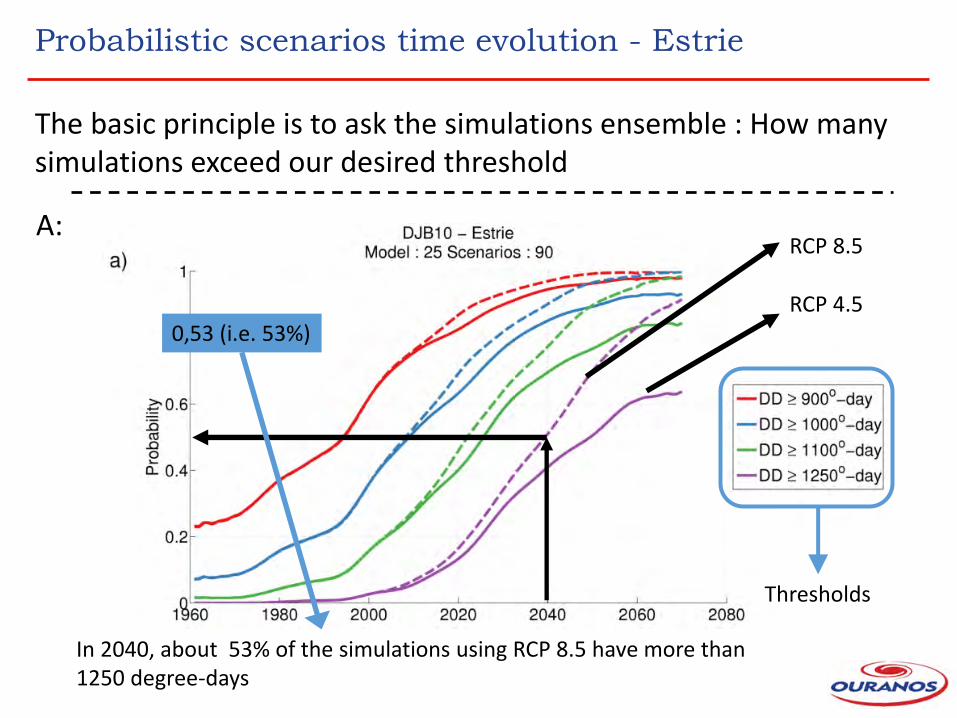
Probabilistic scenarios time evolution - Estrie
0,53 (i.e. 53%)
In 2040, about 53% of the simulations using RCP 8.5 have more than 1250 degree-days
RCP 8.5
RCP 4.5
Thresholds
The basic principle is to ask the simulations ensemble : How many simulations exceed our desired threshold
A:
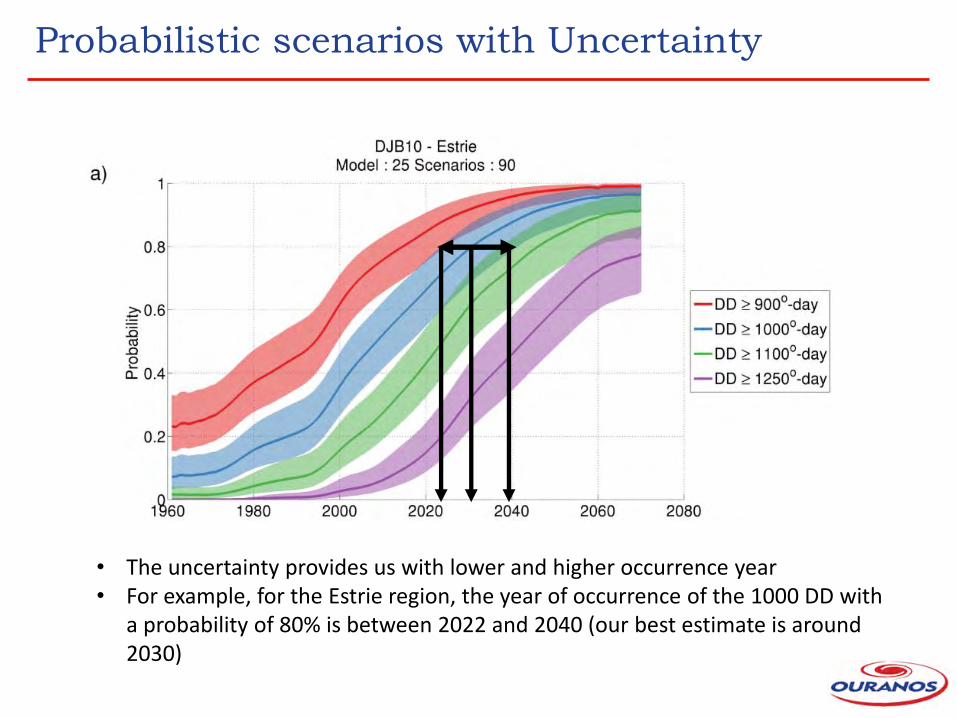
Probabilistic scenarios with Uncertainty
• The uncertainty provides us with lower and higher occurrence year • For example, for the Estrie region, the year of occurrence of the 1000 DD with
a probability of 80% is between 2022 and 2040 (our best estimate is around 2030)

Séries temporelles des probabilités

Séries temporelles des probabilités - Incertitudes
• L’incertitude nous donne une plage temporelle d’apparition de notre seuil.
• Par exemple, l’année d’occurrence où nous avons 80% de chance d’avoir 1000 degré-jour en Estrie est 2030, avec un scénario inférieur de 2022 et un scénario supérieur de 2042.
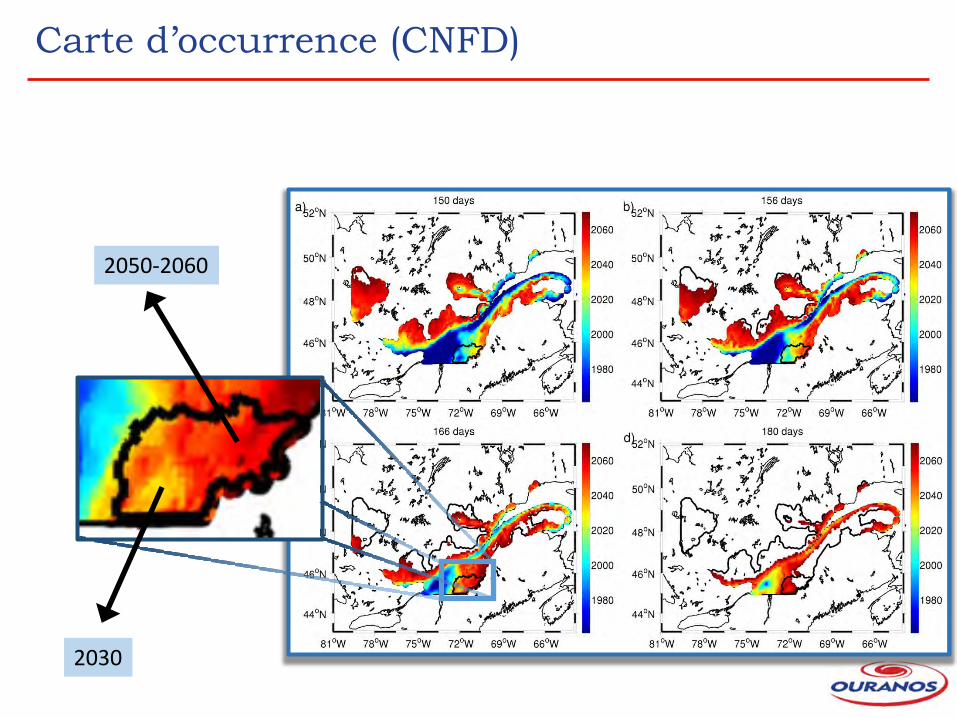
Carte d’occurrence (CNFD)
2030
2050-2060

Carte d’occurrence (AnnTasmin)
2040
2050-2060

Highlight #1 : New regions
What about higher thresholds?
The color scale gives the year where the probability to exceed 900 DD is higher than 80%

Highlight #2 : New grape variety
Some Vitis Vinifera grape variety:
• Chardonnay • Pinot Noir • Gamay • ...
For Vitis Vinifera grape variety, some of them need more than 165 days without frost conditions and more than 1250 degree-days.
80%
Estrie

Composite index probability for 2050
80%
70% 60%
Q: What’s the probability to have synchronous climate indices in 2050 ?
A:
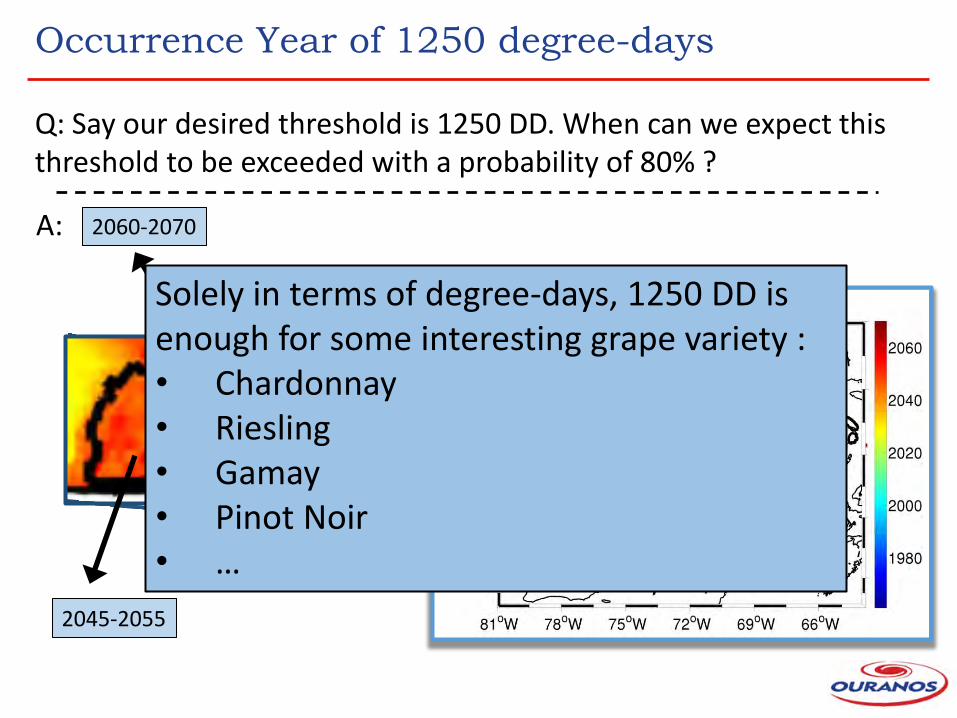
Occurrence Year of 1250 degree-days
2045-2055
2060-2070
Q: Say our desired threshold is 1250 DD. When can we expect this threshold to be exceeded with a probability of 80% ?
A:
Solely in terms of degree-days, 1250 DD is enough for some interesting grape variety : • Chardonnay • Riesling • Gamay • Pinot Noir • …