high resolution modelling for the vancouver 2010 olympics 1 numerical weather prediction research...
Post on 22-Dec-2015
273 views
TRANSCRIPT

High Resolution Modelling for the Vancouver 2010 Olympics1Numerical Weather Prediction Research Section
Ron McTaggart-Cowan1
Manfred Dorninger3
Amin Erfani2
Andre Giguere2
Jocelyn Mailhot1
Jason Milbrandt1
Reinhold Steinacker3
5 November 2008
www.ec.gc.ca
2Canadian Meteorological Centre3University of Vienna

10/31/08 Page 2
Outline
• Vancouver 2010 description• Forecasting challenges• High resolution guidance in steep terrain
– Description of the 1.0 km high resolution modelling system
• Analysis and model evaluation• Discussion

10/31/08 Page 3
Vancouver 2010 Olympics
• Olympic games: 12-28 February 2010• Paralympic games: 12-21 March 2010• Host cities: Vancouver, Whistler,
Richmond, Surrey BC• Organized by VANOC (local organizing
committee)• Weather observation and forecasting
support provided by Environment Canada (EC)
• SNOW-2010 Nowcasting RDP led by EC

10/31/08 Page 4
Vancouver 2010 Olympics
Vancouver
Whistler
CypressYVR
YYJ
The Olympic Autostation Network consists of almost 40 standard and special surface observing sites, all hourly or synop data available on the GTS. Additional data:
12-hourly soundings and profiler data from Squamish (WSK) Additional doppler radar from Callaghan Valley ...
• Despite the (relatively) large number of surface stations, they are concentrated in a very small region
(Source: http://weatheroffice.pyr.ec.gc.ca/2010)

10/31/08 Page 5
Vancouver 2010 Olympics
Downhill skiing, sliding (i.e. bobsleigh, luge etc), cross-country skiing and biathlon will be held in the Whistler area. The autostation network has been designed to provide continuous sampling of “profiles” along the slopes of Whistler (western) and Blackcomb (eastern) mountains.
• Forecasters will be assigned to individual venues (downhill, Callaghan, sliding) for the games
(Courtesy of G. Isaac)

10/31/08 Page 6
Forecasting Challenges
• The Olympic venues cover highly varied terrain:
– Vancouver area - Fraser river delta
– Cypress - North Shore mountains 1000+ m above the Fraser Delta
– Whistler - Whistler Valley extends from Howe Sound
Domain for 1 km GEM model
Strait o
f Geo
rgia
Vancouver
Strait of Juan de Fuca
VancouverIsland
Pu
ge
t So
un
d
OlympicMountains
Whistler
Fra
ser
Val
ley
Pem
berto
n V
alley
Pitt L
ak
eHowe S.

10/31/08 Page 7
Forecasting Challenges
• Local terrain-induced flows include:– Split flow around
Olympics– Puget sound
convergence zone (PSCZ)
– Shallow, cold valley dynamically-driven outflow
– Possible North Shore upsloping
L
Domain for 1 km GEM model

10/31/08 Page 8
Forecasting Challenges
• Local terrain-induced flows include:
– Reversal of valley flow to inflow, possibly overriding remnant cold dome
– Moist onshore post-frontal flow
– Case-dependent flow in marine channels
L
Domain for 1 km GEM model

10/31/08 Page 9
Forecasting Challenges
• Forecasts are required twice daily, and cover ranges from nowcasting to day-2 at one-hour intervals
Sample forecast form for the Slalom venue, proposed as part of the SNOW-V10 project.
(Courtesy of G. Isaac)

10/31/08 Page 10
Forecasting Challenges
• Forecasts are required twice daily, and cover ranges from nowcasting to day-2 at one-hour intervals
• Some of the Olympic events have extremely sensitive thresholds for caution/cancellation: Wind
ChillHigh TempLow
TempRainVisibility WindNew
SnowSport and Weather
< - 20CX-Country
>3 but < 4 m/s or variability >45 but <90 degrees or gusts >4m/s
> 0C or sharply rising temperature tendency thru 0C.
< - 20C Yes or no and how much
> 4 m/s sustained or variability > 90 degrees
Yes or no and how much
Ski Jump
(Courtesy of C. Doyle)

10/31/08 Page 11
Production of High Resolution Guidance• The goal of high resolution guidance is to
add information about highly localized events– Wind channeling / gusts during frontal passage
– Precipitation (type and quantity)
– Visibility in valley cloud that forms fog at mid-mountain
• This information can be used to add value to lower-resolution model guidance (including ensemble) and standard mountain forecasting techniques

10/31/08 Page 12
Production of High Resolution Guidance
GEM LAM
GEM LAM
GEM LAM
GEM LAM
GEM LAM
GEM LAM
06Z 18Z12Z 00Z
15 km – 20 h
2.5 km – 17 h
1.0 km – 15 h
3h
2h
Daily Nesting Strategy
15 km
1.0 km
2.5 km
R1 R2 R1R1 R2
00Z
• Triple-nested integrations run twice daily from 0600 UTC and 1800 UTC GEM Regional forecasts
15 km

10/31/08 Page 13
2.5 km
Production of High Resolution Guidance• Triple-nested integrations run twice daily
from 0600 UTC and 1800 UTC GEM Regional forecasts
GEM LAM
GEM LAM
GEM LAM
GEM LAM
GEM LAM
GEM LAM
06Z 18Z12Z 00Z
15 km – 20 h
2.5 km – 17 h
1.0 km – 15 h
3h
2h
Daily Nesting Strategy
15 km
1.0 km
2.5 km
R1 R2 R1R1 R2
00Z
15 km

10/31/08 Page 14
1 km
Whistler
Production of High Resolution Guidance• Triple-nested integrations run twice daily
from 0600 UTC and 1800 UTC GEM Regional forecasts
GEM LAM
GEM LAM
GEM LAM
GEM LAM
GEM LAM
GEM LAM
06Z 18Z12Z 00Z
15 km – 20 h
2.5 km – 17 h
1.0 km – 15 h
3h
2h
Daily Nesting Strategy
15 km
1.0 km
2.5 km
R1 R2 R1R1 R2
00Z 2.5 km
Vancouver
10/31/08 Page 15
• Refinements to the GEM model for use at high resolution in steep terrain are under evaluation. For example:– Inclusion of land slope and aspect for
computing the radiative balance of the surface
– Double moment bulk microphysics with a prognostic snow/liquid ratio (snow density)
– Wind variance and gust diagnostics
– Visibility reduction due to hydrometeors
Production of High Resolution Guidance
10/31/08 Page 16
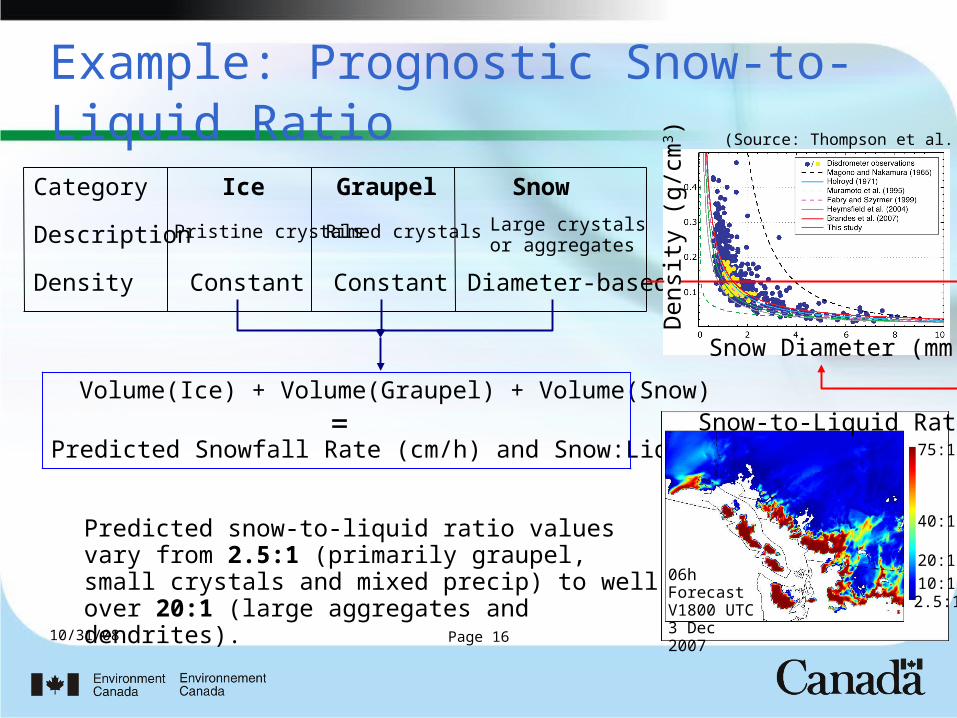
Example: Prognostic Snow-to-Liquid Ratio
Category
Density
Ice SnowGraupel
Description Pristine crystals Large crystalsor aggregates
Rimed crystals
Constant Diameter-basedConstant
Snow Diameter (mm)
Den
sity
(g/
cm3 )
(Source: Thompson et al. 2008)
Volume(Ice) + Volume(Graupel) + Volume(Snow)
=Predicted Snowfall Rate (cm/h) and Snow:Liquid Ratio
Predicted snow-to-liquid ratio values vary from 2.5:1 (primarily graupel, small crystals and mixed precip) to well over 20:1 (large aggregates and dendrites).
75:1
20:1
10:1
40:1
06h ForecastV1800 UTC3 Dec 2007
Snow-to-Liquid Ratio
2.5:1

10/31/08 Page 17
High Resolution Analysis
• Observing networks are inhomogeneous in mountains
• Traditional analysis schemes:– Rely heavily on model-generated first guess fields
– Reduce data and smooth analysis in mountains
• The Vienna Enhanced Resolution Analysis (VERA) uses physically-derived “fingerprints” to locally extend the impact of surface observations, eliminating the need for a background (Steinacker et al. 2006)
(Bica and Steinacker 2006)
Idealized Ororgraphy
Upslope PrecipitationFingerprint

10/31/08 Page 18
High Resolution Analysis
• The VERA analysis uses no model background: model-independent
• Analysis resolution varies with observation spacing, but will be 4 km in southwestern British Columbia
• VERA surface analyses can be used for both nowcasting and real-time high resolution model evaluation
VERA Analysis of MSLP and potential temperature (16 km prototype) for the Olympics region

10/31/08 Page 19
Discussion
• Vancouver/Whistler will host the Winter Olympics in Feb-March 2010
• An Olympic autostation network and remote sensing data support SNOW-V10 RDP
• A 3-nest high resolution (1 km) forecast system has been designed to provide hourly guidance to forecasters (slope, microphysics, wind, visibility…)
• Evaluation (VERA and subjective) of the forecast system will continue during the January-March test period in 2009

10/31/08 Page 20
www.ec.gc.ca