high-resolution mass models of dwarf galaxies … · se-heon oh1,2, deidre a ... trisha ashley15,...
TRANSCRIPT

HIGH-RESOLUTION MASS MODELS OF DWARF GALAXIES FROM LITTLE THINGS
Se-Heon Oh1,2, Deidre A. Hunter
3, Elias Brinks
4, Bruce G. Elmegreen
5, Andreas Schruba
6,7, Fabian Walter
8,
Michael P. Rupen9, Lisa M. Young
10, Caroline E. Simpson
11, Megan C. Johnson
12, Kimberly A. Herrmann
13,
Dana Ficut-Vicas4, Phil Cigan
10, Volker Heesen
14, Trisha Ashley
15, and Hong-Xin Zhang
16
1 The International Centre for Radio Astronomy Research (ICRAR), The University of Western Australia,35 Stirling Highway, Crawley, Western Australia 6009, Australia; [email protected]
2 ARC Centre of Excellence for All-sky Astrophysics (CAASTRO), 44 Rosehill Street, Redfern, NSW 2016, Australia3 Lowell Observatory, 1400 West Mars Hill Road, Flagstaff, AZ 86001, USA
4 Centre for Astrophysics Research, University of Hertfordshire, College Lane, Hatfield, AL10 9AB, UK5 IBM T. J. Watson Research Center, P.O. Box 218, Yorktown Heights, NY 10598, USA
6 Max-Planck-Institut für extraterrestrische Physik, Giessenbachstrasse 1, D-85748 Garching, Germany7 Cahill Center for Astronomy and Astrophysics, California Institute of Technology, 1200 East California Blvd, Pasadena, CA 91125, USA
8Max-Planck-Institut für Astronomie, Königstuhl 17, D-69117 Heidelberg, Germany9 National Radio Astronomy Observatory, 1003 Lopezville Road, Socorro, NM 87801, USA
10 Physics Department, New Mexico Institute of Mining and Technology, Socorro, NM 87801, USA11 Department of Physics, Florida International University, CP 204, 11200 SW 8th St, Miami, FL 33199, USA
12 Australia Telescope National Facility, CSIRO Astronomy and Space Science, P.O. Box 76, Epping NSW 1710, Australia13 Department of Physics, Pennsylvania State University Mont Alto, Science Technology Building, Mont Alto, PA 17237, USA
14 School of Physics and Astronomy, University of Southampton, Southampton SO17 1BJ, UK15 Bay Area Environmental Research Institute, Petaluma, CA 94952, USA
16 Peking University, Astronomy Department, No. 5 Yiheyuan Road, Haidian District, Beijing, P. R. China 100871Received 2014 November 14; accepted 2015 February 3; published 2015 May 12
ABSTRACT
We present high-resolution rotation curves and mass models of 26 dwarf galaxies from “Local Irregulars That TraceLuminosity Extremes, The H I Nearby Galaxy Survey” (LITTLE THINGS). LITTLE THINGS is a high-resolution(∼6″ angular; <2.6 km s−1 velocity resolution) Very Large Array H I survey for nearby dwarf galaxies in the localvolume within 11Mpc. The high-resolution H I observations enable us to derive reliable rotation curves of thesample galaxies in a homogeneous and consistent manner. The rotation curves are then combined with Spitzerarchival 3.6 μm and ancillary optical U, B, and V images to construct mass models of the galaxies. This high qualitymulti-wavelength data set significantly reduces observational uncertainties and thus allows us to examine the massdistribution in the galaxies in detail. We decompose the rotation curves in terms of the dynamical contributions bybaryons and dark matter (DM) halos, and compare the latter with those of dwarf galaxies from THINGS as well asΛCDMSmoothed Particle Hydrodynamic (SPH) simulations in which the effect of baryonic feedback processes isincluded. Being generally consistent with THINGS and simulated dwarf galaxies, most of the LITTLE THINGSsample galaxies show a linear increase of the rotation curve in their inner regions, which gives shallower logarithmicinner slopes α of their DM density profiles. The mean value of the slopes of the 26 LITTLE THINGS dwarf galaxiesis α = − ±0.32 0.24 which is in accordance with the previous results found for low surface brightness galaxies(α = − ±0.2 0.2) as well as the seven THINGS dwarf galaxies (α = − ±0.29 0.07). However, this significantlydeviates from the cusp-like DM distribution predicted by DM-only ΛCDM simulations. Instead our results are morein line with the shallower slopes found in the ΛCDMSPH simulations of dwarf galaxies in which the effect ofbaryonic feedback processes is included. In addition, we discuss the central DM distribution of DDO 210 whosestellar mass is relatively low in our sample to examine the scenario of inefficient supernova feedback in low massdwarf galaxies predicted from recent ΛCDMSPH simulations of dwarf galaxies where central cusps still remain.
Key words: dark matter – galaxies: dwarf – galaxies: halos – galaxies: irregular – galaxies: kinematics anddynamics
Supporting material: data behind figures
1. INTRODUCTION
Dark matter (DM), the existence of which is indirectlyinvoked by its gravitational effect in individual galaxies as wellas in galaxy clusters, dominates, together with dark energy, theenergy budget in the universe (Zwicky 1937; van denBergh 1961; Rubin & Ford 1970; Bosma 1978; Peebles 1982;Riess et al. 1998; Perlmutter et al. 1999; Spergel et al. 2003). Inparticular, the role of DM is critical not only in forming andevolving galaxies in the early universe but also in shaping thelarge-scale structure in the universe through cosmic time(Blumenthal et al. 1984; Colless et al. 2001a; Padmanabhanet al. 2007; Jones et al. 2009; Komatsu et al. 2011, etc.). The
cosmological importance of DM has driven efforts to explorethe physical nature of DM particles and to attempt their directdetection (Moore et al. 2001; Gaitskell 2004; Angloheret al. 2012; Akerib et al. 2014, and references therein). Ofmany candidates for DM particles, Cold Dark Matter (CDM)has been envisaged as one of the most successful models in thatnumerical simulations based on a paradigm combining CDMwith the cosmological constant, Λ (so-called ΛCDM). Thisdescribes well the large-scale structure in the universe traced bysurveys such as the SDSS17 (York et al. 2000; Doroshkevich
The Astronomical Journal, 149:180 (96pp), 2015 June doi:10.1088/0004-6256/149/6/180© 2015. The American Astronomical Society. All rights reserved.
17 The Sloan Digital Sky Survey (http://www.sdss.org/).
1

et al. 2004), 2dFGRS18 (Colless et al. 2001b), 6dFGS19 (Joneset al. 2004), and CMB power spectrum observations(Primack 2003; Spergel et al. 2003, 2007; Planck Collaborationet al. 2014).
However, despite the success of cosmologicalΛCDM simulations in producing the large-scale structure ofthe universe, distinct differences between the simulations andobservations have been found in the DM distribution near thecenter of individual galaxies. The simulations have consistentlypredicted cusp-like DM distributions toward the centers ofgalaxies, being described by a power law, ρ ∼ αR where R isthe galaxy radius and α ∼ −1.0 (Moore 1994; Navarroet al. 1996b, 1997, 2004a, 2010; Moore et al. 1999; Ghignaet al. 2000; Klypin et al. 2001; Power et al. 2003; Stoehret al. 2003; Diemand et al. 2008; Stadel et al. 2009; Ishiyamaet al. 2013, etc.). In contrast, inferred DM distributions innearby dwarf galaxies in the local universe have shown a linearvelocity increase toward their centers, giving rise to a sizabledensity-core (ρ ∼ αR where α ∼ 0.0) (Moore 1994; de Bloket al. 1996, 2001; de Blok & McGaugh 1997; de Blok &Bosma 2002; Weldrake et al. 2003; Spekkens et al. 2005;Kuzio de Naray et al. 2006, 2008; Oh et al. 2008, 2011b,2011a; see, however, Adams et al. 2014 for a discussion on gaskinematics which produces shallower density profiles thanthose from stellar kinematics). This clear discrepancy of thecentral DM distribution in galaxies between ΛCDM simula-tions and observations, the so-called “cusp/core” problem, hasbeen one aspect of the small-scale crisis in ΛCDM cosmologywhich is likely connected to the “missing satellites” problem(Brooks et al. 2013) and “too-big-to-fail” problem (densesatellites; see Boylan-Kolchin et al. 2011, 2012). Given thatDM combined with the ΛCDM paradigm is successful inexplaining both the large-scale structure in the universe as wellas galaxy formation and evolution, there are good reasons toexplore ways to resolve the “cusp/core” problem. We refer tode Blok (2010) and Pontzen & Governato (2014) for the latestreview of the “cusp/core” problem.
Late-type dwarf galaxies in the local universe, with a simpledynamical structure (no bulge and spiral components) havebeen used for addressing the central DM distribution ingalaxies since their dynamics are usually dominated by DM,enabling us to derive more accurately the DM distribution neartheir centers. These diffuse dwarf galaxies have providedsignificant observational constraints on the central DMdistribution in galaxies. Over the past decade, several high-resolution neutral hydrogen (H I) surveys of galaxies in thelocal universe (<11Mpc) using radio interferometers, amongothers The H I Nearby Galaxy Survey (THINGS)20 (Walteret al. 2008), Very Large Array (VLA)-ANGST21(Ottet al. 2012), Local Irregulars That Trace Luminosity Extremes,THINGS (LITTLE THINGS)22 (Hunter et al. 2012),FIGGS23 (Begum et al. 2008), SHIELD24 (Cannon et al.
2011), LVHIS25 (Koribalski 2010), have allowed us to derivemore reliable H I rotation curves of galaxies and examine theircentral mass distributions within 1 kpc where the predictions ofΛCDM simulations are most distinctive. For example, high-resolution (0.1–0.2 kpc) DM density profiles of seven dwarfgalaxies from THINGS, complemented with the “SpitzerInfrared Nearby Galaxies Survey” (SINGS; Kennicutt et al.2003), were derived by Oh et al. (2008, 2011b). From this,they found that the mean value of the inner density slopes, α, ofthe seven dwarf galaxies is −0.29± 0.07 which is in goodagreement with the value of −0.2± 0.2 derived earlierfrom a larger number of Low Surface Brightness (LSB)galaxies (de Blok & Bosma 2002). In the past, it has beenargued that observational systematic effects such as beamsmearing, center offsets, and non-circular motions could haveaffected the derived central DM distributions of galaxies asthese observational biases tend to flatten the derived innerDM density profiles, hiding the central cusps. However,because of the high resolution and quality of the abovementioned observations, these potential biases were signifi-cantly reduced. As a result, observational evidence for the core-like distribution of DM near the centers of dIrr galaxies isparticularly strong.In order to explain this behavior, baryonic feedback
processes have been proposed as a means for removing thecentral cusps expected from ΛCDMDM-only simulations.More specifically, it is expected that DM and baryons ingalaxies can be substantially redistributed by frequent explo-sions of supernovae (SNe) (Larson 1974; Navarro et al. 1996a;Dekel et al. 2003; Mo & Mao 2004; Mashchenko et al.2008; de Souza et al. 2011; Brook et al. 2011; Pontzen &Governato 2012; di Cintio et al. 2014; Ogiya & Mori 2014,etc.). However, due to numerical difficulties in simulatingmulti-phase gas physics as well as the lack of understanding ofthe detailed baryonic physics in galaxies, taking the baryonicfeedback into account in hydrodynamical simulations of dwarfgalaxies was considered difficult and limited to simulations ofhigh-redshift galaxies (e.g., Mashchenko et al. 2006).Governato et al. (2010) were the first to perform high-
resolution cosmological N-body+Smoothed Particle Hydrody-namic (SPH) simulations of dwarf galaxies which include theeffect of detailed baryonic feedback processes, in particularphysically motivated gas outflows driven by SN explosions.From this, they found that the photometric and kinematicproperties of the simulated dwarf galaxies are in close,qualitative agreement with those of observed nearby dwarfgalaxies. More quantitatively, Oh et al. (2011a) performed ananalysis of the baryonic and DM mass distributions of thesimulated dwarf galaxies, in exactly the same way as theTHINGS dwarf galaxies were analyzed, and showed that theirderived rotation curves and the corresponding DM densityprofiles are consistent with those of the THINGS dwarfgalaxies and show a linear increase of velocity in the innerregion inherent of shallow DM density profiles. This suggeststhat repeated gas outflows driven by SN explosions evenwithout a burst of star formation are able to play a fundamentalrole in removing the central cusps and inducing flatter DMdensity slopes near the centers of dwarf galaxies. This is incontrast to clusters of galaxies where galaxy interactions aremore likely to be the dominant mechanisms for the removal of
18 The 2dF Galaxy Redshift Survey (http://www2.aao.gov.au/2dfgrs/).19 The 6dF Galaxy Survey (http://oldweb.aao.gov.au/local/www/6df/).20 The H I Nearby Galaxy Survey (http://www.mpia-hd.mpg.de/THINGS/Overview.html).21 VLA—ACS Nearby Galaxy Survey Treasury (https://science.nrao.edu/science/surveys/vla-angst).22 Local Irregulars That Trace Luminosity Extremes, The H I Nearby GalaxySurvey (https://science.nrao.edu/science/surveys/littlethings).23 Faint Irregular Galaxies GMRT Survey.24 The Survey of HI in Extremely Low-mass Dwarfs (http://www.macalester.edu/∼jcannon/shield.html). 25 The Local Volume HI Survey (http://www.atnf.csiro.au/research/LVHIS/).
2
The Astronomical Journal, 149:180 (96pp), 2015 June Oh et al.

central cusps rather than star formation activities (Richtleret al. 2011). See Governato et al. (2010) and Pontzen &Governato (2012, 2014) for detailed discussions regarding theeffect of SN explosions on the central cusps.
THINGS was only able to probe a small number (i.e., seven)of dwarf galaxies. It is therefore essential to extend theinvestigation to a larger number of dwarf galaxies in order toobtain a statistically robust observational sample to whichsimulations can be compared. Data on a larger sample of dIrrgalaxies have now been provided by the latest H I survey ofnearby galaxies, LITTLE THINGS (Hunter et al. 2012).LITTLE THINGS is a high-resolution (∼6″ angular; ⩽2.6km s−1 velocity resolution) H I survey for 41 nearby
<( 11 Mpc) gas-rich dwarf galaxies undertaken with theNRAO26 VLA in the northern sky. The H I observations arecomplemented with other wavelength data, such as Hα, opticalU, B, V, and near-infrared (Hunter & Elmegreen 2006),archival Spitzer infrared, and GALEX ultraviolet images as wellas follow-up observations with ALMA and Herschel. Thesehigh-quality multi-wavelength data sets significantly reduce theobservational uncertainties inherent in low resolution datawhich may result in hiding the central cusps. Of the 41galaxies, we select a sample of 26 dwarf galaxies (three ofthem are also in THINGS) which show a regular rotationpattern in their velocity fields. In this paper, we extract (1) bulkand non-circular motions of the sample galaxies, (2) deriverotation curves, (3) decompose the derived rotation curves interms of the contributions by baryons and DM halos, and (4)address the central DM distribution by making a directcomparison between the derived DM distributions of thegalaxies to those of SPH+N-body simulations of dwarfgalaxies.
The structure of this paper is as follows. The data used forderiving the mass models of our sample galaxies are describedin Section 2. In Section 3, we present the rotation curves, themass models of baryons, and the DM mass modeling of thegalaxies. In Section 4, we discuss the central DM distributionsof the sample galaxies by comparing them with those of dwarfgalaxies from both THINGS and simulations. We then discussthe effect of SN feedback on the central cusp in Section 5,followed by the discussion of the effect of beam smearing onthe central DM distribution of galaxies in Section 6. Lastly, wesummarize the main results of this paper and conclusions inSection 7.
2. THE DATA
We use high-resolution H I data of 26 nearby (<11Mpc)dwarf galaxies from LITTLE THINGS to address the centralDM distribution of the galaxies. The sample galaxies show aregular rotation pattern in their two-dimensional (2D) H I
velocity fields (see appendix), allowing us to derive reliablerotation curves which include the contributions to theirkinematics of both their DM halo, i.e., non-baryonic andbaryonic matter. Considering the distances of the samplegalaxies, the linear resolutions of the LITTLE THINGS H I data
(∼6″) range from ∼26 to 200 pc with an average of 100 pcwhich is sufficient to resolve the inner 1 kpc region of thegalaxies in so far unmatched detail. This enables us to examinethe central DM distributions of the galaxies in detail. Inaddition, observational systematic effects inherent in low-resolution data (e.g., beam smearing, kinematic center offsetand non-circular motions) are significantly reduced in the high-resolution H I data, which allows us to derive more accurateunderlying kinematics of the sample galaxies.Although the total kinematics of late-type dwarf galaxies is
dominated by DM (Prada & Burkert 2002), it is nonethelessimportant to separate the contribution by baryons from the totalrotation curve. This is achieved by using Spitzer archivalIRAC 3.6μm and ancillary optical color information (Hunter& Elmegreen 2006). Spitzer IRAC 3.6 μm images are muchless affected by dust than maps at shorter wavelengths and tracethe old stellar populations that occupy the dominant fraction ofthe stellar mass in galaxies (Walter et al. 2007). Although thereis some contamination by polycyclic aromatic hydrocarbonemission extending into the 3.6 μm band (Meidt et al. 2014)this is reduced in dIrr galaxies which, by virtue of having lowheavy element abundances, have a correspondingly lower dustcontent.According to the simulations by Governato et al. (2012), the
degree of baryonic feedback is largely dependent on theamount of stars, so past star formation activity in the sense thatfor the same total mass budget (baryons + DM), those galaxieswith a higher past star formation activity will have had moresignificant outflows. Therefore a reliable measurement of thestellar mass in a galaxy is essential to investigating the effect ofbaryonic feedback on the central cusp. The basic observationalproperties of the sample galaxies are listed in Table 1. We referto Hunter et al. (2012) for a complete description of the H I
observations and data reduction.
3. MASS MODELS
In this section, we perform mass modeling of the 26 LITTLETHINGS dwarf galaxies using the high-resolution VLA H I
data and Spitzer IRAC 3.6 μm images as described in Section 2.As mentioned earlier, the simple dynamical structure anddominant circular rotation in the disk of the sample galaxieshelp to reduce uncertainties stemming from the decompositionof galaxy rotation curves into contributions due to baryonic andnon-baryonic matter.The first step in the mass modeling includes deriving rotation
curves of the sample galaxies using the 2D H I velocity fieldswhich reflect the total kinematics including both baryons and aDM halo. H I is mostly distributed in the disk of a galaxy wherethe circular rotation is dominant and is a useful kinematic tracerfor deriving the galaxy rotation curve. This is mainly due to thelarger radial extent of H I in the disk compared to stellarcomponents (e.g., 3–4 times; Sofue & Rubin 2001). Weproceed to derive mass models of the baryons (gas and stars)using H I integrated intensity maps and Spitzer IRAC 3.6 μmimages, and subtract their contribution from the totalkinematics. Lastly, we quantify the kinematic residuals inorder to examine the DM distribution near the centers of thegalaxies. In the following sections, we describe these massmodeling procedures in more detail.
26 NRAO is a facility of the National Science Foundation operated undercooperative agreement by Associated Universities, Inc. These data were takenduring the upgrade of the VLA to the Expanded VLA or EVLA. In this paperwe refer to the instrument as the VLA, the retrofitted antennas as EVLAantennas, and non-retrofitted antennas as VLA antennas. This emphasizes thehybrid nature of the instrument and distinguishes it from the far more powerfulJansky VLA or JVLA it has become since 2012.
3
The Astronomical Journal, 149:180 (96pp), 2015 June Oh et al.

Table 1Properties and Tilted-ring Parameters of the LITTLE THINGS Sample Galaxies
00.0) D Vsys ⟨ ⟩P. A. ⟨ ⟩i MV +12 log(O H) αlog(SFR )DH log(SFR )D
FUV
′ ″) (Mpc) (km s−1) (°) (°) (mag) ( ⊙ − −M yr kpc1 2) ( ⊙ − −M yr kpc1 2)2) (3) (4) (5) (6) (7) (8) (9) (10)
5 41.0 3.6 306.2 ± 1.3 48.4 ± 13.9 66.5 ± 5.2 −12.4 7.3 ± 0.06 −2.58 ± 0.01 −2.48 ± 0.016 08.3 7.8 355.4 ± 3.6 294.1 ± 0.1 40.6 ± 0.1 −15.1 8.3 ± 0.09 −1.78 ± 0.01 −1.55 ± 0.016 37.5 6.1 360.8 ± 1.3 274.1 ± 5.0 27.9 ± 0.1 −14.7 8.1 ± 0.10 −2.89 ± 0.01 −2.46 ± 0.018 07.1 5.2 270.7 ± 1.3 311.6 ± 11.9 45.5 ± 9.0 −15.5 7.8 ± 0.20 −2.70 ± 0.01 −2.40 ± 0.013 24.6 3.4 156.5 ± 1.2 175.7 ± 10.1 49.7 ± 6.0 −16.6 7.7 ± 0.14 −1.67 ± 0.01 −1.55 ± 0.011 26.5 10.3 399.0 ± 2.3 8.2 ± 5.3 43.0 ± 0.0 −15.4 7.7 ±K −3.20 ± 0.01 −2.43 ± 0.010 47.9 3.6 18.6 ± 0.7 131.6 ± 0.1 27.0 ± 0.0 −13.8 7.6 ± 0.11 −2.42 ± 0.01 −2.41 ± 0.010 12.9 1.3 303.5 ± 1.2 44.5 ± 13.5 50.0 ± 0.0 −14.1 7.5 ± 0.06 −2.85 ± 0.01 −2.16 ± 0.001 47.9 7.7 340.0 ± 1.0 235.1 ± 3.9 55.5 ± 4.8 −15.0 7.8 ± 0.04 −1.36 ± 0.01 −1.00 ± 0.0131 9.9 6.4 589.4 ± 1.0 287.4 ± 2.8 51.0 ± 7.1 −15.0 8.7 ± 0.03 −2.85 ± 0.01 −2.81 ± 0.018 15.9 4.9 219.4 ± 1.8 138.0 ± 3.6 65.0 ± 0.0 −14.9 7.8 ±K −2.37 ± 0.01 −2.10 ± 0.012 19.1 3.5 330.7 ± 1.0 359.6 ± 8.4 43.4 ± 0.1 −14.8 8.2 ± 0.09 −2.88 ± 0.01 −2.62 ± 0.019 09.9 3.7 372.0 ± 1.3 226.3 ± 3.1 68.2 ± 3.1 −14.2 7.5 ± 0.09 −2.50 ± 0.01 −1.93 ± 0.015 37.3 4.3 192.6 ± 1.2 275.5 ± 5.8 46.5 ± 0.1 −15.7 8.3 ± 0.07 −2.27 ± 0.01 −2.04 ± 0.010 57.7 0.9 −139.5 ± 1.0 65.0 ± 0.0 66.7 ± 0.1 −10.9 7.2 ±K K −2.71 ± 0.064 56.2 1.1 −186.0 ± 1.1 133.6 ± 7.5 63.7 ± 4.6 −13.7 7.9 ± 0.15 −4.10 ± 0.07 −3.21 ± 0.014 26.3 8.7 481.0 ± 2.0 12.5 ± 0.0 56.5 ± 9.9 −14.0 7.6 ±K K −2.79 ± 0.027 49.9 0.7 −348.0 ± 2.9 55.7 ± 10.1 47.0 ± 15.6 −16.3 8.2 ± 0.12 −1.11 ± 0.01 K8 14.1 0.7 −232.2 ± 2.2 73.7 ± 0.0 48.0 ± 0.0 −14.6 7.6 ± 0.05 −2.56 ± 0.01 −1.99 ± 0.011 10.3 3.4 −85.4 ± 5.6 122.5 ± 1.5 69.1 ± 0.1 −18.2 8.2 ± 0.05 +0.19 ± 0.01 −0.01 ± 0.012 49.6 3.4 103.5 ± 1.4 38.7 ± 4.2 63.0 ± 0.8 −16.8 7.9 ± 0.01 −1.67 ± 0.01 −1.66 ± 0.011 44.8 4.9 235.8 ± 1.2 292.2 ± 5.1 22.6 ± 0.1 −17.1 8.4 ± 0.01 −1.66 ± 0.01 −1.53 ± 0.014 32.4 2.6 60.5 ± 1.1 126.1 ± 3.2 82.5 ± 0.1 −13.6 7.9 ± 0.20 −2.03 ± 0.01 K7 57.2 1.0 −122.3 ± 1.2 174.5 ± 2.8 74.0 ± 0.1 −14.4 7.8 ± 0.06 −2.77 ± 0.01 −2.05 ± 0.019 40.4 5.9 279.3 ± 2.2 214.5 ± 2.8 61.2 ± 4.0 −14.6 7.9 ± 0.07 −0.77 ± 0.01 −1.07 ± 0.016 47.3 9.3 499.3 ± 3.9 248.4 ± 12.5 70.0 ± 0.0 −15.9 8.4 ± 0.08 −1.86 ± 0.01 −1.55 ± 0.01
ived from the tilted-ring analysis in Section 3.1.1; (3): distance as given in Hunter et al. (2012); (4): systemic velocity derived from the tilted-ring analysis in Section 3.1.1;angle (PA) derived from the tilted-ring analysis in Section 3.1.1. PA is the angle measured counter-clockwise from the north direction in the sky to the major axis of thee of the kinematic inclination derived from the tilted-ring analysis in Section 3.1.1; (7): absolute V magnitude as given in Hunter et al. (2012); (8): oxygen abundance taken
l. (2012). “K” indicates no uncertainty available on the measurements; (9), (10): the Hα and GALEX FUV star formation rates normalized to the area (πRd2 where Rd is the
megreen (2004) and Hunter et al. (2010), respectively. “K” indicates that no measurements are available.
TheAstronomicalJournal,149:180
(96pp),2015
JuneOhetal.

3.1. Rotation Curves: Total Kinematics
3.1.1. Tilted-ring Fits
For the derivation of the rotation curves of our samplegalaxies, we fit a 2D tilted-ring model which consists of aseries of concentric ellipses to the 2D velocity fields extractedfrom the H I data cubes of the sample galaxies (Rogstadet al. 1974). Each ellipse has its own geometric andkinematic parameters, such as center position (XPOS,YPOS), position angle (PA), inclination (INCL), systemicvelocity (VSYS), and rotation velocity (VROT). This so-called “tilted-ring analysis” of 2D velocity fields obtainedfrom H I, CO or Hα spectroscopic observations has beenwidely used for deriving rotation curves of disk-dominatedgalaxies (e.g., rotation curves of the THINGS galaxiessample; de Blok et al. 2008).
Tilted-ring models, however, only hold for those cases wherethe velocity field is a reliable representation of the overallkinematics of a galaxy. Non-circular motions caused by star-forming activity like stellar winds, SNe, etc., as well as spiralarms, a bar-like or triaxial galaxy potential, galaxy mergers ortidal interactions disturb gas motions in galaxies on small andlarge scales, resulting in distorted velocity fields.
Low resolution H I data usually smooth any features relatedto small-scale non-circular motions. This is known as beamsmearing and tends to yield a velocity gradient along themajor axis of a galaxy that is less steep, particularly in thecentral regions (e.g., de Blok & McGaugh 1997; Swaterset al. 2000; van den Bosch & Swaters 2001; McGaughet al. 2001). Beam smearing is significantly reduced in high-resolution data such as THINGS and LITTLE THINGS (seede Blok et al. 2001; McGaugh et al. 2001; Kuzio de Narayet al. 2006).
The LITTLE THINGS sample dwarf galaxies selected in thisstudy, with few exceptions, appear to show no significant large-scale kinematic features, such as bars, spiral arms or warps intheir H I or Spitzer IRAC 3.6 μm images. However, our samplegalaxies do suffer from the effect of small-scale turbulent gasmotions due to stellar winds and SNe. In general, the derivedvelocity field in dwarf galaxies is more vulnerable to the impactof stellar activity due to their low gravitational potential(Walter et al. 1998; Walter & Brinks 2001; see also Bagetakoset al. 2011). Therefore, the extraction of a robust velocity fieldis essential if one wants to derive the undisturbed underlyingkinematics of a galaxy.
In order to correct for small-scale random motions andextract only the component due to circular rotating velocity in agalaxy, we derive the “bulk velocity field” as proposed by Ohet al. (2008, 2011b). Compared with other typical types ofvelocity fields, such as intensity-weighted mean (IWM), singleGaussian fit and hermite h3, the bulk velocity field has beenfound to be ideally suited to extracting the underlying bulkrotation of a galaxy in the presence of random non-circularmotions. We point out, as an example, how the “kinks” or“wiggles” of the iso-velocity contours of the extracted bulkvelocity fields displayed in panel (e) of Figure 8 are weakerthan those of the IWM velocity fields (panel b). The bulkvelocity field appears to much better represent the overallkinematics of the galaxy and hence the underlying gravitationalpotential.
Following the standard procedure described in Begeman(1989), we fit tilted-ring models to the bulk velocity fields of
the sample galaxies. For this, we use the “rotcur” task inGIPSY27 (van der Hulst et al. 1992). The derived rotationcurves of the galaxies are presented in the figures of theappendix (e.g., Figure 9). As seen from the scatter in the fitsmade with all ring parameters free (open circles) in the figures,the extracted bulk velocity fields are not completely free fromthe effect of small-scale random motions in the galaxies.However, they are relatively insignificant and are averaged outafter several iterations as shown in the final rotation curves(solid lines) in the figures.This is also confirmed in the harmonic analysis of the
velocity fields. As described in Schoenmakers et al. (1997), weperform harmonic decompositions of the bulk and IWMvelocity fields of the sample galaxies. For this, we use thetask “RESWRI” in GIPSY. We expand the velocity fields intosine and cosine terms up to 3rd order (i.e., cm and sm where
=m 1, 2 and 3) after fixing the center position, PA and INCLwith those derived from the tilted-ring analysis. If we allowRESWRI to fit a velocity field with center position, PA and INCLas free parameters, non-circular motions tend to be absorbedinto variations in these geometrical parameters, underestimat-ing the amount of non-circular motions. As an example,streaming non-circular motions in a barred galaxy are mainlyresponsible for the radial motions that are typically reflected inthe s1 and s3 terms (Schoenmakers et al. 1997; Wonget al. 2004; Spekkens & Sellwood 2007). However, theseradial motions can also be modeled by a radial variation of PA,without the need for s1 and s3 terms. Similarly, other ringparameters can affect the harmonic analysis in the same way ifthey are kept as free parameters in the fit. To quantify anddescribe non-circular motions, we calculate the absoluteamplitudes ⟨ ⟩A and the phases of each component decomposed.For the amplitudes, we take the median of Am(R) as describedin Schoenmakers et al. (1997) (see also Trachternachet al. 2008),for m = 1,
=A R s R( ) ( ) , (1)1 12
for >m 1,
= +A R c R s R( ) ( ) ( ) , (2)m m m2 2
where R is the galaxy radius.As shown in the section labeled “Harmonic Analysis” in the
appendix, the amplitudes of harmonic terms (e.g., c2, s1 and s2which are corrected for inclination) derived from the bulkvelocity fields (black dots in the Harmonic Analysis panels) arelower than those derived using the IWM velocity fields over allradii. This shows that the effect of random non-circular motionsare largely reduced in the bulk velocity fields. The tilted-ringparameters of the sample galaxies derived using the bulkvelocity fields are given in Table 1. We note that the kinematiccenter positions given in Table 1 that are derived from thetilted-ring analysis are offset from the optical (V-band, mostly)central isophot used by Hunter et al. (2012).
3.1.2. Asymmetric Drift Correction
Pressure support caused by random gas motions in thegaseous disk of a galaxy tends to lower the rotation velocity,which results in an underestimate of the dynamical mass of the
27 The Groningen Image Processing System.
5
The Astronomical Journal, 149:180 (96pp), 2015 June Oh et al.

galaxy. In general the dynamical effect of the pressure supportis higher in the outer region of a galaxy where the gas density islow. In particular, this, so-called “asymmetric drift” issignificant in dwarf galaxies whose maximum rotationvelocities are comparable to the velocity dispersions in thegas disk. The asymmetric drift correction hence should bemade to derive more reliable rotation curves of galaxies wherethe dynamical support by random motions to its gas disk issignificant. This is the case of some of our sample galaxieswhose velocity dispersions are comparable to their maximumrotation velocities in the outer region. For the asymmetric driftcorrection, we follow the method described in Bureau &Carignan (2002; see also Oh et al. 2011b) as follows.
The asymmetric drift correction σD is given as,
σ σρσ
σσ
= −∂
∂
= −∂ Σ
∂
( )
( )R
R
RR
ln
ln, (3)
D2 2
2
2H
2I
where σD is the asymmetric drift correction, R is the galaxyradius, σ is the velocity dispersion, and ρ is the volume densityof gas disk. In general, ρ can be approximated as the gassurface density ΣH I for a gas disk with an exponentialdistribution in the vertical distribution and a constant scaleheight z0 (i.e., d z dr(ln( ))0 = 0). Large fluctuations in thederivative in Equation (3) can be smoothed by fitting ananalytical function which has three free parameters, I0
⊙ − −M( pc km s ),2 2 2 R0 (arcsec), and α (arcsec−1) to thenumerator as follows,
σΣ =+
+ α( )
RI R
R e( )
1. (4)
RH2 0 0
0I
Lastly, the corrected rotation velocity Vcor is derived byadding the asymmetric drift correction σD to the rotationvelocity Vrot derived from tilted-ring fits, quadratically,
σ= +V V . (5)Dcor2
rot2 2
The analytical function given in Equation (4) provides agood fit to most sample galaxies except for DDO 52, IC 10,NGC 3738 and UGC 8508 where a significant degree of radialfluctuation is present in σΣH
2I at small radii. However, the
correction at small radii is insignificant and thus will not affectsignificantly the final results.
Valenzuela et al. (2007) have shown that the standardasymmetric correction can be underestimated without con-sidering the gas pressure gradients triggered by star formationand feedback. However, the effect of additional thermalpressure gradients in the gas is most likely insignificant forthe sample galaxies in this study. The thermal pressure isalready included in the observed velocity dispersion used forthe asymmetric drift correction as part of its broadening. Inaddition, as shown in the velocity dispersion map (i.e., moment2) in the appendix, significant anisotropy in the dispersion isnot found in the galaxies. This implies that any separation ofturbulent and thermal pressures, with explicit calculation ofasymmetries in the turbulent component, would have insignif-icant effect on the asymmetric drift corrected rotation curves.The asymmetric drift corrected rotation curves of the sample
galaxies which are used for the mass modeling are presented inthe appendix.
3.2. Gas Distribution
The rotation curves derived in Section 3.1 already provide agood approximation of the DM halos’ kinematics of the samplegalaxies given the dominant contribution of the DM halo to thetotal kinematics of dwarf galaxies. However, to derive moreaccurate DM distributions of the galaxies, we construct massmodels of their gaseous and stellar components which accountfor most of the baryons in dwarf galaxies.We use total integrated H I intensity maps (moment 0) of the
galaxies to derive the mass model of the gaseous component.For consistency with the rotation curves in Section 3.1, weapply the derived tilted-ring models to the H I intensity maps,and obtain gas surface density profiles of the galaxies which arescaled up by a factor of 1.4 to take Helium and metals intoaccount. We then convert the gas surface density profiles to thecorresponding gas rotation velocities assuming that gascomponents are mainly distributed in a thin disk. As anexample, the derived gas surface density profile and thecorresponding rotation velocity of CVnIdwA are shown in thepanels (g) and (h) of Figure 10, respectively. Here, we do notcorrect for the effect of molecular hydrogen (H2) since lowmetallicities in dwarf galaxies can induce only a small fractionof the gaseous component in the form of H2 (e.g., Leroyet al. 2007, 2011; Schruba et al. 2012).
3.3. Stellar Distribution
We use Spitzer IRAC 3.6 μm images to derive mass modelsof the stellar components of the galaxies. Compared withoptical images, the Spitzer IRAC 3.6 μm image is less affectedby dust and less sensitive to young stellar populations whichusually emit most energy in the optical regime but occupy onlya small fraction of the total stellar mass. Instead, the SpitzerIRAC 3.6 μm image is useful for tracing old stellar populationsthat are dominant in late-type dwarf galaxies. This enables us toderive a robust estimate of the stellar mass of our samplegalaxies as used for deriving the mass models of the stellarcomponents of THINGS galaxies (de Blok et al. 2008; Oh et al.2008, 2011b; Trachternach et al. 2008).Like we did for the gas component, we derive 3.6 μm surface
brightness profiles of the stellar components of the galaxies byapplying the derived tilted-ring parameters to the Spitzer IRAC3.6 μm images as shown in the figures in the appendix (e.g.,Figure 10). In general, as discussed in Walter et al. (2008), theSpitzer IRAC 3.6 μm image provides a pseudo dust free pictureof old stellar populations in galaxies. However, unlike the caseof the gas component whose mass can be directly estimatedfrom H I observations, estimating the stellar mass in galaxies iscritically dependent on the assumed stellar mass-to-light ratio(Υ⋆) value which usually gives rise to the largest uncertaintywhen converting the luminosity profile to the mass densityprofile. In order to derive more reliable Υ⋆ values in the 3.6 μmband, we use an empirical relation between galaxy opticalcolors and Υ⋆
3.6 values based on stellar population synthesismodels (Bell & de Jong 2001; Bruzual & Charlot 2003) asgiven in Oh et al. (2008). Hereafter, we call these model Υ⋆
3.6
values. Using the derived Υ⋆3.6 values, we convert the 3.6 μm
surface brightness profiles of our sample galaxies to stellar
6
The Astronomical Journal, 149:180 (96pp), 2015 June Oh et al.

surface density profiles (see the figures in the appendix, e.g.,Figure 10).
As discussed in Oh et al. (2011a), the kinematic methodcombined with the model Υ⋆
3.6 values has been found to bereliable for estimating stellar masses of late-type dwarf galaxiesbased on a comparison of the derived stellar masses of thesimulated dwarf galaxies to the input ones. This robustlysupports the veracity of the methodology used for measuringthe stellar masses of our sample galaxies. In addition, we alsorefer to the stellar masses of the sample galaxies derived usinga spectral energy distribution (SED) fitting technique (Zhanget al. 2012). As shown in Figure 1, the stellar masses derivedusing these two independent methods show good agreementwithin the scatter.
Following Oh et al. (2011b), we calculate the correspondingrotation velocities of the stellar components of the samplegalaxies from the derived surface density profiles. For this, weassume a vertical zsech ( )2 scale height distribution of stars witha ratio of h z0 = 5 where h and z0 are the radial scale lengthand the vertical scale height of stellar disk in the 3.6 μm surfacebrightness profiles, respectively (van der Kruit & Searle 1981;Kregel et al. 2002). Although it may overestimate the rotationvelocities of the stellar components of galaxies with a fatterstellar disk, this is a valid assumption for most disk-dominateddwarf galaxies like our sample galaxies. The derived rotationvelocities of the stellar components of the sample galaxies areshown in the figures in the appendix (e.g., panel (d) ofFigure 10), and the stellar masses estimated in this paper aregiven in Table 2.
The mean ratio of the masses between the gas and stellarcomponents of the sample galaxies, ⟨ ⟩M Mgas star
KIN is ∼5.6which is consistent with ⟨ ⟩ ∼M M 7.2gas star
SED (where MstarSED is
derived using a SED fitting technique) of 34 LITTLE THINGSsample galaxies in Zhang et al. (2012). This indicates that themajority of the baryons in our sample galaxies is in the form of
gaseous components. As discussed earlier, given that the massof gaseous components in galaxies can be reliably measuredfrom H I observations without any critical assumption, the massmodels of the baryons derived in this study are likely to providea good description of the distribution of baryons in the galaxies.Therefore, any remaining uncertainties in the mass models ofbaryons are most likely to be insignificant and thus will notaffect significantly the final mass models of the DM halos ofour sample galaxies.
3.4. Disk-halo Decomposition
In this section, we decompose the total kinematics of thesample galaxies into the dynamical contributions of thebaryonic disks and DM halos by disentangling the massmodels of baryons from the total rotation curves. For this, wesubtract in quadrature the rotation velocities of the gas andstellar components from the total rotation velocities, and obtainimplied rotation curves for the DM halos as shown in thefigures in the appendix (e.g., see the left-lower panel ofFigure 10). For a quantitative analysis of the DM distribution inthe galaxies, we fit CDM (Navarro et al. 1996b, 1997; hereafterNFW) and spherical pseudo-isothermal halo models (e.g.,Begeman et al. 1991), the two representative cusp- and core-like halo models, to the DM halo rotation curve, respectively.An Einasto profile which is a Sérsic function in the context ofCDM halos has been found to provide an equal or better fit tothe halos in pure DM simulations compared to an NFW profileNavarro et al. (2004b). In this work, we use NFW profiles toquantify the DM halos of the sample galaxies for consistencywith the previous DM mass modeling of THINGS andsimulated dwarf galaxies in Oh et al. (2011a, 2011b). Arelative comparison of the two halo models in terms of fitquality enables us to examine which model best describes theDM component of the sample galaxies, especially toward thecenters of the galaxies.
3.4.1. Cusp-like Halo Model
The cosmologically motivated NFW halo model, the so-called “universal density profile” which describes the cusp-likeradial DM distribution found in DM-only ΛCDM simulationsis given as,
ρρ
=+( )( )
RR R R R
( )1
, (6)i
s sNFW 2
where ρi is correlated with the mean density of the universe atthe time of the collapse of the halo and Rs is the characteristicradius of the DM halo (Navarro et al. 1996b). This profile hasbeen widely adopted to account for the DM distribution whichsteeply increases toward the centers of the halos in thesimulations. This, a so-called cusp feature, can be wellapproximated by a power law, ρ ∼ αR with α ∼ −1.0 nearthe central region of the halos, giving a DM halo rotationvelocity as follows,
= + − ++ − +
V R Vcx cx cx
x c c c( )
ln(1 ) (1 )
[ln(1 ) (1 )], (7)NFW 200
where c is the concentration parameter defined as R Rs200 . V200
is the rotation velocity at a radius R200 where the mass densitycontrast with the critical density of the universe exceeds 200,and x is defined as R R200 (Navarro et al. 1996b). In particular,
Figure 1. Comparison of the stellar masses derived using our method withthose derived using the multi-band spectral energy distribution (SED) fittingtechnique described in Zhang et al. (2012). The solid and dashed lines indicatea least-squares fit with a slope of 0.96, and line of equality, respectively. The1σ scatter of the fit to the data is 0.20 dex.
7
The Astronomical Journal, 149:180 (96pp), 2015 June Oh et al.
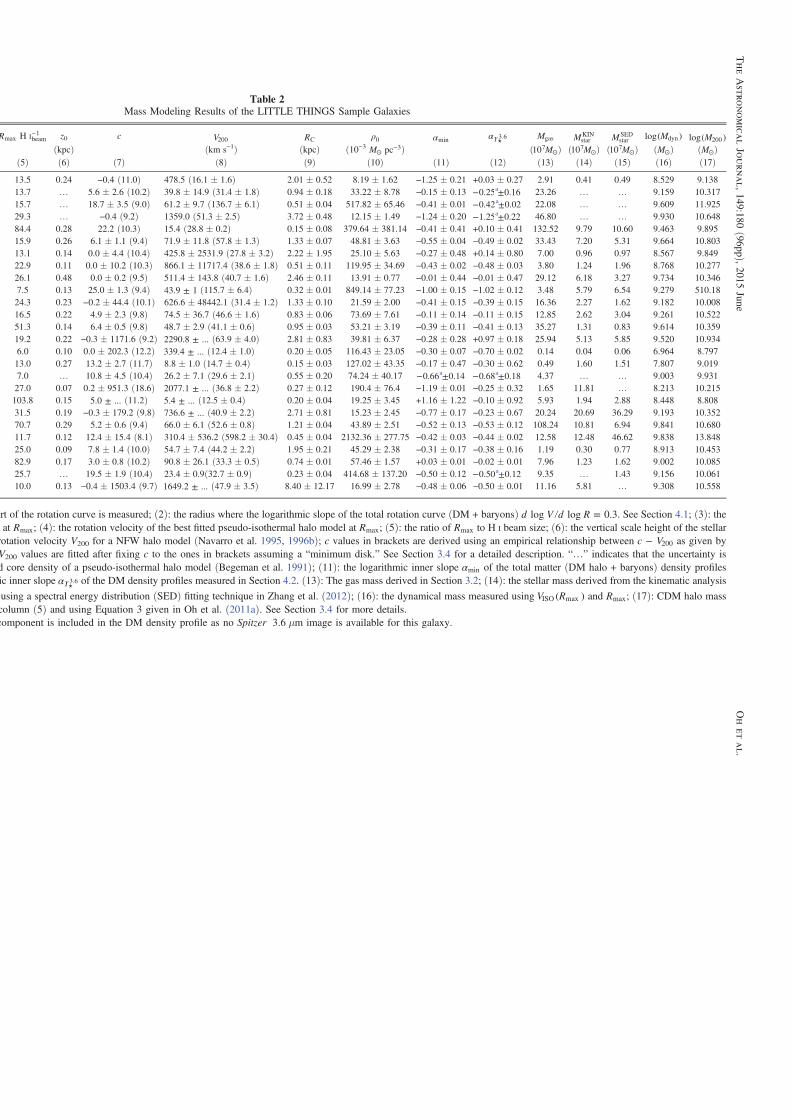
Table 2Mass Modeling Results of the LITTLE THINGS Sample Galaxies
Rmax H I−beam1 z0 c V200 RC ρ0 αmin αΥ⋆3.6 Mgas Mstar
KIN MstarSED Mlog( )dyn Mlog( )200
(kpc) (km s−1) (kpc) (10−3 ⊙ −M pc 3) ( ⊙M107 ) ( ⊙M107 ) ( ⊙M107 ) ( ⊙M ) ( ⊙M )(5) (6) (7) (8) (9) (10) (11) (12) (13) (14) (15) (16) (17)
13.5 0.24 −0.4 (11.0) 478.5 (16.1 ± 1.6) 2.01 ± 0.52 8.19 ± 1.62 −1.25 ± 0.21 +0.03 ± 0.27 2.91 0.41 0.49 8.529 9.13813.7 K 5.6 ± 2.6 (10.2) 39.8 ± 14.9 (31.4 ± 1.8) 0.94 ± 0.18 33.22 ± 8.78 −0.15 ± 0.13 −0.25a±0.16 23.26 K K 9.159 10.31715.7 K 18.7 ± 3.5 (9.0) 61.2 ± 9.7 (136.7 ± 6.1) 0.51 ± 0.04 517.82 ± 65.46 −0.41 ± 0.01 −0.42a±0.02 22.08 K K 9.609 11.92529.3 K −0.4 (9.2) 1359.0 (51.3 ± 2.5) 3.72 ± 0.48 12.15 ± 1.49 −1.24 ± 0.20 −1.25a±0.22 46.80 K K 9.930 10.64884.4 0.28 22.2 (10.3) 15.4 (28.8 ± 0.2) 0.15 ± 0.08 379.64 ± 381.14 −0.41 ± 0.41 +0.10 ± 0.41 132.52 9.79 10.60 9.463 9.89515.9 0.26 6.1 ± 1.1 (9.4) 71.9 ± 11.8 (57.8 ± 1.3) 1.33 ± 0.07 48.81 ± 3.63 −0.55 ± 0.04 −0.49 ± 0.02 33.43 7.20 5.31 9.664 10.80313.1 0.14 0.0 ± 4.4 (10.4) 425.8 ± 2531.9 (27.8 ± 3.2) 2.22 ± 1.95 25.10 ± 5.63 −0.27 ± 0.48 +0.14 ± 0.80 7.00 0.96 0.97 8.567 9.84922.9 0.11 0.0 ± 10.2 (10.3) 866.1 ± 11717.4 (38.6 ± 1.8) 0.51 ± 0.11 119.95 ± 34.69 −0.43 ± 0.02 −0.48 ± 0.03 3.80 1.24 1.96 8.768 10.27726.1 0.48 0.0 ± 0.2 (9.5) 511.4 ± 143.8 (40.7 ± 1.6) 2.46 ± 0.11 13.91 ± 0.77 −0.01 ± 0.44 −0.01 ± 0.47 29.12 6.18 3.27 9.734 10.3467.5 0.13 25.0 ± 1.3 (9.4) ±43.9 1 (115.7 ± 6.4) 0.32 ± 0.01 849.14 ± 77.23 −1.00 ± 0.15 −1.02 ± 0.12 3.48 5.79 6.54 9.279 510.1824.3 0.23 −0.2 ± 44.4 (10.1) 626.6 ± 48442.1 (31.4 ± 1.2) 1.33 ± 0.10 21.59 ± 2.00 −0.41 ± 0.15 −0.39 ± 0.15 16.36 2.27 1.62 9.182 10.00816.5 0.22 4.9 ± 2.3 (9.8) 74.5 ± 36.7 (46.6 ± 1.6) 0.83 ± 0.06 73.69 ± 7.61 −0.11 ± 0.14 −0.11 ± 0.15 12.85 2.62 3.04 9.261 10.52251.3 0.14 6.4 ± 0.5 (9.8) 48.7 ± 2.9 (41.1 ± 0.6) 0.95 ± 0.03 53.21 ± 3.19 −0.39 ± 0.11 −0.41 ± 0.13 35.27 1.31 0.83 9.614 10.35919.2 0.22 −0.3 ± 1171.6 (9.2) ±2290.8 ... (63.9 ± 4.0) 2.81 ± 0.83 39.81 ± 6.37 −0.28 ± 0.28 +0.97 ± 0.18 25.94 5.13 5.85 9.520 10.9346.0 0.10 0.0 ± 202.3 (12.2) ±339.4 ... (12.4 ± 1.0) 0.20 ± 0.05 116.43 ± 23.05 −0.30 ± 0.07 −0.70 ± 0.02 0.14 0.04 0.06 6.964 8.79713.0 0.27 13.2 ± 2.7 (11.7) 8.8 ± 1.0 (14.7 ± 0.4) 0.15 ± 0.03 127.02 ± 43.35 −0.17 ± 0.47 −0.30 ± 0.62 0.49 1.60 1.51 7.807 9.0197.0 K 10.8 ± 4.5 (10.4) 26.2 ± 7.1 (29.6 ± 2.1) 0.55 ± 0.20 74.24 ± 40.17 −0.66a±0.14 −0.68a±0.18 4.37 K K 9.003 9.93127.0 0.07 0.2 ± 951.3 (18.6) ±2077.1 ... (36.8 ± 2.2) 0.27 ± 0.12 190.4 ± 76.4 −1.19 ± 0.01 −0.25 ± 0.32 1.65 11.81 K 8.213 10.215103.8 0.15 ±5.0 ... (11.2) ±5.4 ... (12.5 ± 0.4) 0.20 ± 0.04 19.25 ± 3.45 +1.16 ± 1.22 −0.10 ± 0.92 5.93 1.94 2.88 8.448 8.80831.5 0.19 −0.3 ± 179.2 (9.8) ±736.6 ... (40.9 ± 2.2) 2.71 ± 0.81 15.23 ± 2.45 −0.77 ± 0.17 −0.23 ± 0.67 20.24 20.69 36.29 9.193 10.35270.7 0.29 5.2 ± 0.6 (9.4) 66.0 ± 6.1 (52.6 ± 0.8) 1.21 ± 0.04 43.89 ± 2.51 −0.52 ± 0.13 −0.53 ± 0.12 108.24 10.81 6.94 9.841 10.68011.7 0.12 12.4 ± 15.4 (8.1) 310.4 ± 536.2 (598.2 ± 30.4) 0.45 ± 0.04 2132.36 ± 277.75 −0.42 ± 0.03 −0.44 ± 0.02 12.58 12.48 46.62 9.838 13.84825.0 0.09 7.8 ± 1.4 (10.0) 54.7 ± 7.4 (44.2 ± 2.2) 1.95 ± 0.21 45.29 ± 2.38 −0.31 ± 0.17 −0.38 ± 0.16 1.19 0.30 0.77 8.913 10.45382.9 0.17 3.0 ± 0.8 (10.2) 90.8 ± 26.1 (33.3 ± 0.5) 0.74 ± 0.01 57.46 ± 1.57 +0.03 ± 0.01 −0.02 ± 0.01 7.96 1.23 1.62 9.002 10.08525.7 K 19.5 ± 1.9 (10.4) 23.4 ± 0.9(32.7 ± 0.9) 0.23 ± 0.04 414.68 ± 137.20 −0.50 ± 0.12 −0.50a±0.12 9.35 K 1.43 9.156 10.06110.0 0.13 −0.4 ± 1503.4 (9.7) ±1649.2 ... (47.9 ± 3.5) 8.40 ± 12.17 16.99 ± 2.78 −0.48 ± 0.06 −0.50 ± 0.01 11.16 5.81 K 9.308 10.558
art of the rotation curve is measured; (2): the radius where the logarithmic slope of the total rotation curve (DM + baryons) =d V d Rlog log 0.3. See Section 4.1; (3): theat Rmax; (4): the rotation velocity of the best fitted pseudo-isothermal halo model at Rmax; (5): the ratio of Rmax to H I beam size; (6): the vertical scale height of the stellarrotation velocity V200 for a NFW halo model (Navarro et al. 1995, 1996b); c values in brackets are derived using an empirical relationship between −c V200 as given byV200 values are fitted after fixing c to the ones in brackets assuming a “minimum disk.” See Section 3.4 for a detailed description. “K” indicates that the uncertainty isd core density of a pseudo-isothermal halo model (Begeman et al. 1991); (11): the logarithmic inner slope αmin of the total matter (DM halo + baryons) density profilesic inner slope αΥ⋆3.6 of the DM density profiles measured in Section 4.2. (13): The gas mass derived in Section 3.2; (14): the stellar mass derived from the kinematic analysis
using a spectral energy distribution (SED) fitting technique in Zhang et al. (2012); (16): the dynamical mass measured using V R( )ISO max and Rmax; (17): CDM halo masscolumn (5) and using Equation 3 given in Oh et al. (2011a). See Section 3.4 for more details.component is included in the DM density profile as no Spitzer 3.6 μm image is available for this galaxy.
TheAstronomicalJournal,149:180
(96pp),2015
JuneOhetal.

the concentration parameter c is useful for quantifying thedegree of DM concentration in galaxies. The measurement ofthe value of c in nearby galaxies provides an observationalconstraint on the central cusps predicted from ΛCDM simula-tions (McGaugh et al. 2007; see also de Blok et al. 2003).
3.4.2. Core-like Halo Model
As an alternative way to describe the DM distribution in agalaxy observationally motivated, spherical pseudo-isothermalhalo models with a central constant-density core have beenused in studies of galaxy rotation curves. The form of this core-like halo model is given as follows:
ρρ
=+ ( )
RR R
( )1
, (8)C
ISO0
2
where ρ0 and RC are the core density and core radius of a halo,respectively. This halo model is employed to describe the massdistribution of a DM halo with a sizeable constant density core(ρ ρ∝ 0). Similarly, the corresponding rotation velocity to thepseudo-isothermal halo potential is given by,
ρ= −⎡⎣⎢
⎛⎝⎜
⎞⎠⎟⎤⎦⎥V R πG R
R
R
R
R( ) 4 1 atan . (9)C
C
CISO 0
2
In order to quantify the DM distribution in the samplegalaxies, we fit the model rotation velocities of the two halomodels as given in Equations (7) and (9) to the kinematic DMsignature of the galaxies. As shown in the figures in theappendix (e.g., the left-lower panel of Figure 10), the core-likepseudo-isothermal halo models are mostly preferred over thecusp-like NFW models in terms of the quality of the fit (i.e.,based on reduced χ2 values). The fitted parameters of the halomodels are presented in Table 2.
As given in Table 2, we derive the dynamical masses (Mdyn)of the sample galaxies using V R( )ISO max and Rmax at which theoutermost part of the rotation curve is measured. Given thatrotation curves at the adopted Rmax are mostly rising in oursample galaxies, the derived dynamical mass, Mdyn withV R( )ISO max and Rmax gives a lower limit of the halo mass.For reference, we also estimate the halo masses, M200, of oursample galaxies assuming an NFW halo model. However, thefitted values of c are unphysical (i.e., negative or close to zero)for a large fraction (11/26 galaxies) of the sample galaxies. Wetherefore derive a c value using an empirical relationshipbetween −c V200 from the WMAP28 observations in McGaughet al. (2007) by substituting V200 with the V R( )ISO max adopted.We then fit the NFW halo model after fixing c and leaving onlyV200 as a free parameter, assuming a minimum disk (where therotation curve is attributed to the DM halo only and thedynamical contribution of baryons is ignored). These c andV200 values are given in brackets in Table 2. Lastly, we derivethe resulting halo mass, M200, with the newly estimated V200
using Equation (3) in Oh et al. (2011a). As presented inTable 2, M200 values of the sample galaxies are larger than Mdynvalues, which implies that our observations most likely do notreach the flat part of the rotation curves. This is consistent withthe fact that the rotation curves of most sample galaxies are stillrising at the last measured points.
Except in those few cases, such as DDO 70, DDO 101, DDO154, DDO 210, DDO 216, and Haro 36 where CDM NFW halomodels provide comparable fits to the DM rotation curves, thefitted values of the NFW halo parameters are unphysical (i.e.,negative concentration parameter c, unphysically large valuesof V200). This is consistent with results previously found inother nearby dwarf and LSB galaxies (e.g., de Blok &Bosma 2002; Kuzio de Naray et al. 2008; van Eymerenet al. 2009; Oh et al. 2011b). The slowly increasing DMrotation curves in the inner region of the sample galaxies reflecta halo whose gravitational potential is not deep enough tosustain the power-law DM density cusps that are as steep asρ ∝ −R 1.0. Hence, the cosmologically motivated cusp-like halomodels are not able to adequately describe the observed solid-body rotation curves of our sample dwarf galaxies.It may be argued that those galaxies that are equally well
fitted by the two halo models indicate the possibility of akinematic signature of central cusps in dwarf galaxies beingconsistent with ΛCDM simulations. Despite the high-resolutionof LITTLE THINGS VLA H I observations, it is, however,most likely that the central regions of the galaxies are not fullysampled with a sufficient number of independent synthesizedbeams needed for accurately distinguishing the inner steepnessof the two halo models. As quantified in the parameter, Rmax H I−beam1 in Table 2, this is mainly due to the small size of the
rotating disk (e.g., DDO 210) or the relatively large distance(e.g., Haro 36). Given that the difference between the cusp-and core-like halo models is the most prominent in the centralregions of galaxies, higher sampling of the inner regions of thegalaxies is required before making a firmer conclusion on thesignature of the potential central cusps. We will discuss thismatter in a more quantitative way in the following section.
4. DM DISTRIBUTION
In this section, we compare the inner shape of rotation curvesand DM density profiles of the sample galaxies with those ofsimulated dwarf galaxies from N-body+SPH ΛCDM simulationsin order to examine their DM distributions near the centers. Thesecomparisons between observations and simulations allow us toestimate the degree of cuspiness of the central DM distribution ina qualitative way. In addition, we also measure the inner DMdensity slopes of the galaxies to make a more quantitativecomparison to the simulations.
4.1. Rotation Curve Shape
The characteristic shape of the steeply rising rotation curveinherent in the cusp-like DM distribution near the centers ofsimulated dwarf galaxies based on the ΛCDM paradigm can beused for a qualitative test of the simulations (Hayashi &Navarro 2006; see also Oh et al. 2011b, 2011a). Thisqualitative test is particularly useful in that a direct comparisonbetween the observed and predicted DM rotation curves can bemade without any additional assumption on the shape of theDM halo (e.g., a spherical or triaxial halo potential) which isneeded for converting rotation curves to the correspondingdensity profiles, and the associated additional uncertainties thismight introduce.This is done in the left panel of Figures 2–4 where we scale
the rotation curves of both our sample galaxies andΛCDMNFW halos with respect to the rotation velocity V0.3at a radius R0.3 which is where the logarithmic slope of the28 The WMAP (Spergel et al. 2003, 2007).
9
The Astronomical Journal, 149:180 (96pp), 2015 June Oh et al.

curve is =d V d Rlog log 0.3 (see Hayashi & Navarro 2006).This enables us not only to make a relative comparison of therotation curves between observations and simulations but alsoto accentuate the inner rotation curve shape which is sensitiveto the degree of central DM concentration.
All the scaled (DM only) rotation curves of the 21 LITTLETHINGS sample galaxies for which Spitzer 3.6 μm image isavailable are overplotted in the upper-left panel of Figure 5. Wealso overplot the median values of the rotation curves in each0.1R R0.3 bin. In the lower-left panel of Figure 5, we also
overplot the scaled rotation curves of seven dwarf galaxiesfrom THINGS (three of them are also in LITTLE THINGS) aswell as the two simulated dwarf galaxies presented inGovernato et al. (2010) which all show a linear increase intheir inner regions to the median values of the LITTLETHINGS rotation curves. In particular, the two simulated dwarfgalaxies were affected by baryonic feedback processes (mainlyrepeated gas outflows driven by SN explosions) in such a waythat the central cusps predicted from DM-only simulations areflattened (Governato et al. 2010). The flattened DM
Figure 2. Left panels: the rotation curves of the first nine galaxies of the 26 LITTLE THINGS (in dynamical mass order) which are all scaled with respect to therotation velocity V0.3 at R0.3 where the logarithmic slope of the rotation curve is =d V d Rlog log 0.3 as described in Hayashi & Navarro (2006). The upper (DM +baryons) and lower (DM only) panels show the ones including and excluding the dynamical contribution by baryons, respectively. The gray solid and black solid lineswith small dots indicate the CDM NFW dark matter rotation curves with V200 which is > 90 km s−1 and < 90 km s−1, respectively. The dashed lines (denoted as ISO)show the best fitted pseudo-isothermal halo models to the galaxies. Right panels: the corresponding dark matter density profiles derived using the scaled rotationcurves in the left panels. The gray ( >V 90200 km s−1) and black solid lines with small dots ( <V 90200 km s−1) represent the CDM NFW models with the inner densityslope α ∼ −1.0. The dashed lines indicate the best fitted pseudo-isothermal halo models with α ∼ 0.0. See Section 4 for more details.
The data used to create this figure are available.
10
The Astronomical Journal, 149:180 (96pp), 2015 June Oh et al.

distribution results in slowly increasing rotation curves in theinner region of the simulated galaxies (see Oh et al. 2011a forfurther discussion).
In line with the results in Oh et al. (2011a), the inner shapeof the scaled rotation curves of the LITTLE THINGS samplegalaxies falls mostly below that of the DM-only NFW halomodels, indicating a shallower DM distribution near thecenters. As shown in the lower-left panel of Figures 2–4, thediscrepancy with NFW models becomes more pronouncedwhen comparing these models to DM rotation curves derived
after subtracting the contribution from baryons from the totalkinematics for each of the sample galaxies. Instead, they aremore in line with those of both the THINGS dwarf galaxies andsimulations (DG1 and DG2) where the effect of baryonicfeedback processes is included. The linearly (or less steeply)rising rotation curves in the inner region of the galaxies indicatea nearly constant or shallower mass distribution toward thecenters as found in the majority of nearby dwarf galaxies. TheLITTLE THINGS sample galaxies give no clear indication of
Figure 3. Left panels: the rotation curves of the other nine galaxies of the 26 LITTLE THINGS (in dynamical mass order) which are all scaled with respect to therotation velocity V0.3 at R0.3 where the logarithmic slope of the rotation curve is =d V d Rlog log 0.3 as described in Hayashi & Navarro (2006). The upper (DM +baryons) and lower (DM only) panels show the ones including and excluding the dynamical contribution by baryons, respectively. The gray solid and black solid lineswith small dots indicate the CDM NFW dark matter rotation curves with V200 which is > 90 km s−1 and < 90 km s−1, respectively. The dashed lines (denoted as ISO)show the best fitted pseudo-isothermal halo models to the galaxies. Right panels: the corresponding dark matter density profiles derived using the scaled rotationcurves in the left panels. The gray ( >V 90200 km s−1) and black solid lines with small dots ( <V 90200 km s−1) represent the CDM NFW models with the inner densityslope α ∼ −1.0. The dashed lines indicate the best fitted pseudo-isothermal halo models with α ∼ 0.0. See Section 4 for more details (continued).
The data used to create this figure are available.
11
The Astronomical Journal, 149:180 (96pp), 2015 June Oh et al.

the central cusps in their DM halos unlike the predictions fromΛCDMDM-only simulations.
4.2. DM Density Profiles
As a more direct way to examine the central DM distributionof the sample galaxies and compare them withΛCDM simulations, we derive their DM density profiles fromthe DM rotation curves decomposed in Section 3.4. A directconversion of the rotation curve to the corresponding DMdensity profile can be made by the following formula (see de
Blok et al. 2001 for more details),
ρ = ∂∂
+ ⎜ ⎟⎡⎣⎢⎢
⎛⎝
⎞⎠⎤⎦⎥⎥R
πG
V
R
V
R
V
R( )
1
42 , (10)
2
where V is a rotation velocity observed at a radius R, and G isthe gravitational constant. For this conversion, we assume aspherical halo potential which is valid for most nearby galaxies(Trachternach et al. 2008). This method has been used forderiving DM density profiles of dwarf and LSB disk galaxies,
Figure 4. Left panels: the rotation curves of the remaining eight galaxies of the 26 LITTLE THINGS (in dynamical mass order) which are all scaled with respect to therotation velocity V0.3 at R0.3 where the logarithmic slope of the rotation curve is =d V d Rlog log 0.3 as described in Hayashi & Navarro (2006). The upper (DM +baryons) and lower (DM only) panels show the ones including and excluding the dynamical contribution by baryons, respectively. The gray solid and black solid lineswith small dots indicate the CDM NFW dark matter rotation curves with V200 which is > 90 and < 90 km s−1, respectively. The dashed lines (denoted as ISO) show thebest fitted pseudo-isothermal halo models to the galaxies. Right panels: the corresponding dark matter density profiles derived using the scaled rotation curves in theleft panels. The gray ( >V 90200 km s−1) and black solid lines with small dots ( <V 90200 km s−1) represent the CDM NFW models with the inner density slopeα ∼ −1.0. The dashed lines indicate the best fitted pseudo-isothermal halo models with α ∼ 0.0. See Section 4 for more details (continued).
The data used to create this figure are available.
12
The Astronomical Journal, 149:180 (96pp), 2015 June Oh et al.

and proved to be reliable as found in the comparison of thederived DM density profiles of simulated dwarf galaxies withtheir input ones (Oh et al. 2011a).
In the right panel of Figures 2–4, we present the derived(dark) matter density profiles of the LITTLE THINGS samplegalaxies. In addition, we calculate the median values of the DMdensity profiles as shown in the upper-right panel of Figure 5.We also overplot the DM density profiles of the THINGS andsimulated dwarf galaxies in the lower-right panel of Figure 5.The radial fluctuation shown in some of the DM density
profiles (e.g., IC 1613 etc.) is largely due to fluctuations in thederived rotation curves at the relevant radius. These are mainlybecause of either the effect of non-circular motions, the noise invelocity profiles with low signal-to-noise ratio values, or bothin the region.As already implied by the solid-body like inner rotation
curve shape of the LITTLE THINGS sample galaxies inSection 4.1, their central DM density profiles are systematicallyshallower than those of the cusp-like DM density profilespredicted from DM-only ΛCDM simulations. As shown in the
Figure 5. Upper-left panel: the (DM only) rotation curves (small dots) of the 21 LITTLE THINGS (including 3 THINGS galaxies) for which Spitzer3.6 μm image isavailable. These are all scaled with respect to the rotation velocityV0.3 at R0.3 where the logarithmic slope of the rotation curve is =d V d Rlog log 0.3 as described inHayashi & Navarro (2006). The “×” symbol represents the median values of the rotation curves in each 0.1R R0.3 bin. The error bars show the 1σ scatter. Lower-leftpanel: the scaled rotation curves of the seven THINGS, and the two simulated dwarf galaxies (DG1 and DG2 in Governato et al. 2010) which are overplotted to themedian values of the LITTLE THINGS rotation curves. The gray solid and black solid lines with small dots indicate the CDM NFW dark matter rotation curves withV200 which is > 90 and < 90 km s−1, respectively. Right panels: the corresponding dark matter density profiles derived using the scaled rotation curves in the leftpanels. The gray ( >V 90200 km s−1) and black solid lines with small dots ( <V 90200 km s−1) represent the CDM NFW models with the inner density slope α ∼ −1.0.See Section 4 for more details.
13
The Astronomical Journal, 149:180 (96pp), 2015 June Oh et al.

lower-right panel of Figures 2–4, the difference is even morepronounced in the comparison of the DM density profilescorrected for the baryons although the dynamical contributionby baryons is rather insignificant. The sample dIrr galaxies aremore consistent with the core-like DM density profiles (dot-dashed lines in the right-hand frames of Figures 2–4) thanNFW-type profiles. This is much like the THINGS dwarfgalaxies, and the simulated dwarfs (DG1 and DG2) withbaryonic feedback processes as shown in the lower-right panelof Figure 5.
We also measure the inner density slopes α of the DMdensity profiles to quantify the cuspiness of the central DMdistribution. This yields a more quantitative comparisonbetween the observations and simulations. As shown in thefigures in the appendix (e.g., panel (f) of Figure 10), weperform a least squares fit (dotted lines) to the inner data points(gray dots) within a “break radius.” As described in de Blok &Bosma (2002; see also Oh et al. 2011b), we determine a breakradius of a DM density profile where the slope changes mostrapidly in the inner region of the profile. Following de Blok &Bosma (2002), we adopt the mean difference between theslopes which are measured including the first data point outsidethe break radius and excluding the data point at the breakradius, respectively, as an error bar αΔ of the inner densityslope. We measure the inner density slopes α, of the galaxiesfrom their total matter (including both DM halo and baryons)as well as DM-only density profiles. The former, a so-called“minimum disk assumption” that attributes the total rotationcurve to the DM component only, gives a steeper inner densityslope. Meanwhile, the latter where the dynamical contributionby baryons is subtracted from the total rotation curve allows usto examine the effect of the model Υ⋆
3.6 on the measured innerdensity slope. The mean values of the slopes of the 26 LITTLETHINGS dwarf galaxies are α = − ±0.42 0.21min andα = − ±Υ⋆ 0.32 0.243.6
29 for the minimum disk and the model
Υ⋆3.6 disk assumptions, respectively.As expected, the slopes measured assuming the minimum
disk are slightly steeper than those measured using the modelΥ⋆
3.6 disk for most sample galaxies. However, the differencebetween the two slopes is largely insignificant since most of thesample galaxies are DM dominated as indicated by their lowbaryonic fraction. The measured logarithmic inner densityslopes α of our sample galaxies are listed in Table 2.
The LITTLE THINGS sample dwarf galaxies do not ingeneral agree with the steep logarithmic inner slope (∼1.0) ofthe DM density profiles predicted from ΛCDMDM-onlysimulations. Instead, they show a range of shallower slopesbeing consistent with a core-like DM distribution at the centers,which supports the previous results found in nearby dwarf andLSB disk galaxies. Our results (α = − ±0.42 0.21min ;α = − ±Υ⋆ 0.32 0.243.6 ) are consistent with the mean logarithmicslope, α = − ±0.29 0.07min , of the seven THINGS dwarfgalaxies derived assuming a minimum disk in Oh et al.(2011b). Moreover, if we combine the sample dwarf galaxiesfrom LITTLE THINGS and THINGS which have a similar dataquality and whose inner density slopes are derived in exactlythe same way, the mean value of the slopes of the 29 dwarfgalaxies is α = − ±0.40 0.24min . This shows good agreementwithin the error bars with α = − ±0.2 0.2min derived from LSB
galaxies in de Blok et al. (2001) but a clear deviation from theα ∼ −1.0 predicted from ΛCDMDM-only simulations.
A few galaxies in our sample, such as DDO 101 and DDO210 whose rotation curves are equally fitted by both NFW andpseudo-isothermal halo models appear to have relativelysteeper slopes compared to the other ones. However, asdiscussed in Section 3.4, this could be due to insufficientsampling of the DM density profiles in the inner region. Thegradient of the logarithmic density slope, ρd d Rlog loggradually decreases toward the outer region of a galaxy, givinga steeper slope α. Therefore, the steeper a slope α is, the moredata points in the outer regions are included when measuringthe logarithmic slope of a DM density profile. This could,conceivably, be the case for galaxies with insufficient spatialsampling. As discussed above, the insufficient sampling mainlyarises from either the smaller size of the H I disk (e.g., DDO210) or the larger distances of the galaxies (e.g., Haro 36).
5. EFFECT OF SN FEEDBACK ON THE CENTRAL CUSPS
As discussed in Governato et al. (2010), the constant-densitycores observed near the centers of dwarf galaxies can bereconciled with simulations by taking the effect of baryonicfeedback processes into account without a need for any explicitmodification of the current ΛCDM paradigm. In particular,repeated gas outflows driven by SNe have been found to beefficient enough to redistribute the matter in dwarf galaxies,resulting in shallower DM density profiles as observed innearby dwarf galaxies (Oh et al. 2011a).The investigation of the effect of SN-driven gas outflows on
the central DM distribution has been extended to low mass fielddwarf galaxies using GASOLINE (Wadsley et al. 2004), aparallel SPH tree-code with multistepping (Governatoet al. 2012; Pontzen & Governato 2012; di Cintio et al.2014; see also Pontzen & Governato 2014). In the simulations,the present-day stellar mass of galaxies ranges from 109.8 downto 104.5 ⊙M where the energy transfer from repeated gasoutflows to the DM component becomes inefficient. Morespecifically, the SN feedback in small halos where less than0.03% of the total amount of baryons is converted into stars isless effective at removing the central cusps and turning thecusp-like DM density profiles into core-like ones. According tothis scenario, it is expected that the central DM distribution inthese systems remains cuspy, and the inner slopes of their DMdensity profiles are steeper than those of higher mass counter-parts (Governato et al. 2012; Zolotov et al. 2012). It impliesthat the central cusps predicted from ΛCDMDM-only simula-tions should survive in low mass halos. This underlines thecosmological importance of low mass dwarf galaxies in thelocal universe for testing the “cusp/core” problem.As discussed earlier, the systematic uncertainties caused by
low resolution radio observations are significantly reduced inthe high-resolution H I data from LITTLE THINGS, whichallows us to derive more accurate rotation curves of the samplegalaxies and thus their central DM distributions. In addition,the Spitzer IRAC 3.6 μm data combined with model Υ⋆
3.6 valuesbased on stellar population synthesis models and galaxy colorsprovide more reliable stellar masses of the sample galaxies.In Figure 6, we plot the inner density slopes α of the sample
dwarf galaxies from both LITTLE THINGS and THINGSagainst their stellar masses M* on a logarithmic scale. Inaddition, we also add those of a sample of THINGS diskgalaxies whose mass models were derived in de Blok et al.
29 The dynamical contribution by the stellar component is included in the DMdensity profiles of five galaxies where no Spitzer 3.6 μm image is available.
14
The Astronomical Journal, 149:180 (96pp), 2015 June Oh et al.

(2008) in order to examine the α − M* relationship in thehigher mass regime. Compared to dwarf galaxies, the centralkinematics of disk galaxies are usually dominated by a bulgecomponent. It is therefore not trivial to perform a reliable disk-halo decomposition of the disk galaxies despite using the multi-wavelength data from THINGS whose data quality iscomparable to that of LITTLE THINGS. For this reason, inFigure 6, we use the inner density slopes of the disk galaxiesmeasured assuming a minimum disk. As discussed inSection 4.2, it should be noted that the minimum diskassumption attributes the total kinematics of a galaxy to theDM only, ignoring the contribution of baryonic components,giving a lower limit on the inner density slope (i.e., a steeperslope).
As shown in Figure 6, the ΛCDMSPH simulations includingthe effect of baryonic feedback processes predict cusp-like DMdistributions with steeper inner density slopes (α < −1.0) inDM halos whose stellar mass is less than about 106 ⊙M . Asdiscussed in Governato et al. (2012), the lower the mass of thestellar component in a galaxy, the less the dynamical effect ofSN feedback on the DM potential. Consequently, this results inthe central DM distribution in the low mass halo regimeremaining cuspy. According to this, the initial cusps formed inthe early universe would still exist today in low mass dwarfgalaxies which have stellar masses less than ∼106 ⊙M wherethe repeated thermal energy injection from SN explosionsbecomes substantially inefficient, mainly due to the rapidlydecreasing star formation efficiency in these systems (Govern-ato et al. 2012; Pontzen & Governato 2012).
However, in Figure 6, as the stellar mass of a galaxyincreases, the inner DM density slope α becomes shallower inthe ΛCDMSPH simulations including baryonic feedback
processes (open stars) with respect to the counterpart in theDM-only simulations (dashed line). As discussed in Governatoet al. (2010) and Pontzen & Governato (2012) (see also diCintio et al. 2014), the central DM cusps can be disrupted bythe rapid gas injection caused by SN-driven gas outflows intothe central region of galaxies, resulting in a shallower DMdensity distribution. This shows that DM-baryon interactions indwarf galaxies through gas outflows play a critical role not onlyin forming bulgeless dwarf galaxies but also in flatteningcentral cusps predicted from DM-only ΛCDM simulations.This demonstrates that proper modeling of DM-baryoninteractions in hydrodynamical ΛCDM galaxy simulations isable to alleviate the long-standing tension associated with thecentral DM distribution in dwarf galaxies between simulationsand observations. We refer to Governato et al. (2012) (see alsoPontzen & Governato 2012, 2014; and di Cintio et al. 2014) fora detailed discussion of the effect of SN feedback on the centralDM distribution in dwarf galaxies.Meanwhile, in Figure 6, the trend of slope change
αd d Mlog log * predicted from dwarf galaxy simulationswith baryonic feedback processes is reversed in massive diskgalaxies (open boxes) where a bulge component becomesdominant in the central kinematics. As discussed in di Cintioet al. (2014), the effect of SN feedback can be surpassed by thedeep gravitational potential which is caused by the bulgecomponent in the central region. However, as discussed earlier,the steep slopes of the THINGS disk galaxies could be partiallyaffected by the minimum disk assumption used for derivingtheir DM density profiles. The central kinematics of a diskgalaxy with a substantial bulge component is sensitive to evensmall uncertainties in Υ⋆ when converting the luminosity profileto the mass density profile. This makes it difficult to perform anaccurate disk-halo decomposition of bulge-dominated diskgalaxies. This stresses the usefulness of bulge–less dwarfgalaxies in testing the effect of SN feedback on the central DMdistribution of galaxies.As shown in Figure 6, the simulated dwarf galaxies which
have comparable stellar masses ranging from 106 to 109 ⊙Mshow good agreement with the majority of the sample dwarfgalaxies from THINGS and LITTLE THINGS. However, asalready discussed in Section 4.2, the rotation curves of someLITTLE THINGS sample galaxies (e.g., DDO 70, DDO 101,DDO 154, DDO 210 and Haro 36) are equally well fitted byCDM NFW and pseudo-isothermal halo models in terms of χred2values. Moreover some of them, such as DDO 101, DDO 210and Haro 36, appear to have relatively steep inner densityslopes (although Haro 36 is defined as a blue compact dwarfgalaxy which usually shows a steep increase in rotationvelocity in the inner region mainly due to young starburstcomponents formed during galaxy interaction or mergers; e.g.,Bekki 2008). In particular, DDO 210 is a good candidate fortesting the SN feedback efficiency scenario by Governato et al.(2012) given that its stellar mass falls within the regime whereaccording to the simulations primordial CDM cusps areexpected to survive. In Figure 6, DDO 210 shows no distinctsignature of the central cusp (α ∼ −1.0) given its correspond-ing stellar mass, deviating from the prediction of ΛCDMDM-only simulations (dashed line). Nevertheless, in a qualitativesense, its relatively steep inner density slope α ∼ −0.70compared to the others still leaves a room for a potentialsignature of the central cusp, which supports the lower SNenergy injection scenario in low mass dwarf galaxies.
Figure 6. Inner dark matter density slope α of the sample galaxies fromLITTLE THINGS (filled circles) and THINGS (filled squares, THINGSdwarfs; open squares, THINGS disk galaxies) against their total stellar masses.The dashed line indicates the α-M
*total prediction from ΛCDM dark matter only
simulations. The open stars and solid line represent the α vs. M*total of the
resolved halos from the ΛCDM SPH simulations with baryonic feedbackprocesses which are measured at 500 pc and z = 0 (Governato et al. 2012; diCintio et al. 2014). See Section 5 for more discussions.
15
The Astronomical Journal, 149:180 (96pp), 2015 June Oh et al.

However, as noted earlier, the resolution of LITTLE THINGSH I observations is not high enough to resolve the small H I disk(∼60″ diameter) and distinguish between cusp- and core-likeDM behavior near the center of DDO 210. We note that DDO210 has the most compact H I disk (in terms of the beam size,e.g., Rmax H I ∼− 6.0beam
1 as given in Table 2) of the samplegalaxies. Likewise, some of our sample galaxies may stillsuffer from beam smearing which is discussed in the followingsection.
6. INNER DENSITY SLOPE VERSUS RESOLUTION
As in de Blok et al. (2001), for a quantitative examination ofthe beam smearing effect on our sample galaxies, we plot theinner density slopes α of the galaxies including the THINGSsample as well as the two simulated dwarf galaxies (DG1 andDG2) modeled by Governato et al. (2010) against the observedradii of their innermost point Rinner in Figure 7. For the sampledwarf galaxies from LITTLE THINGS, we use the slopesderived assuming the model Υ⋆
3.6 disk. We also show the α-Rinner relations of the NFW and pseudo-isothermal halo modelsas solid and dotted lines, respectively, derived using theiranalytical formulas as given in Equations (6) and (8).
As shown in Figure 7, most sample galaxies show significantdeviations from the predicted α-Rinner trend (solid line) ofΛCDMNFW halos at around a Rinner of ∼0.2 kpc. Instead, theyare more consistent with those of pseudo-isothermal halomodels with different core-radii (dotted lines) as well as theearlier results found from LSB galaxies (gray symbols) in deBlok & Bosma (2002). However, the clear difference between
the two halo models (i.e., NFW and pseudo-isothermal) at highresolutions (e.g., <Rinner 0.5 kpc) becomes ambiguous as theinnermost radius Rinner of a given DM density profile increases.For example, a galaxy with a larger Rinner (i.e., low resolution)tends to show a steeper inner slope of DM density profile. Thelarger Rinner makes it lie in the region where the slopes of thetwo halo models are approximately similar to each other. Inaddition, as discussed in Section 4.2, the derivative
ρd d Rlog log of a DM density profile on a logarithmic scaledecreases toward the outer region of a galaxy. If the DMdensity profile is affected by beam smearing, the break radiusof the profile which is determined when measuring the innerslope tends to migrate into the outer regime where
ρd d Rlog log has a lower value. Therefore, the inner densityslope α within the break radius is most likely to be steeper thanthe ones derived from well sampled profiles. This could be thecase of DDO 101 and DDO 210. In particular, DDO 101 ismost likely to be affected by the beam smearing effect asshown in Figure 7.Yet higher resolution velocity fields obtained with radio
interferometers or using other tracers such as integral fieldmapping are required to study the effect of SN feedback on thecentral cusps of the lowest mass dwarf galaxies. Such high–resolution observations of low mass dwarf galaxies wouldprovide an ultimate test of the ΛCDM paradigm. Unlikeclusters of galaxies where the depth of the gravitationalpotential well is deep enough to retain warm DM (WDM) aswell as CDM, there is no room for WDM in dwarf galaxiesinhabiting DM halos with much shallower potential wells.Therefore, finding a signature of a central cusp in dwarfgalaxies will prove that there is at least some CDM in theuniverse. This again highlights the cosmological importance oflow mass dwarf galaxies, not only for resolving the “cusp/core”controversy in ΛCDM simulations but also as an indirect prooffor the existence of CDM in the universe.
7. CONCLUSION
In this paper we derive the rotation curves of 26 dwarfgalaxies culled from LITTLE THINGS, and examine their DMdistributions near the centers of the galaxies. From this, weaddress the “cusp/core” problem which has been one of thelong-standing problems in ΛCDM simulations on galacticscales. The high-resolution LITTLE THINGS H I data (∼6″angular; ∼2.6 km s−1 spectral) complemented with optical andSpitzer IRAC 3.6 μm images are sufficiently detailed to resolvethe central region of the sample galaxies where the cusp- andcore-like halo models are clearly distinguished.In particular, we use the bulk velocity fields of the galaxies
extracted using the method described in Oh et al. (2008) tocorrect for turbulent random non-circular gas motions. Thisenables us to derive more reliable rotation curves and thus moreaccurate DM distributions in the galaxies. We corrected for themodest dynamical contribution by baryons in dwarf galaxies byusing Spitzer IRAC 3.6 μm images combined with model Υ⋆
3.6
values based on stellar population synthesis models. Thisallowed us to derive robust mass models of the stellarcomponents of the galaxies and thus better constrain theircentral DM distributions.From this, we found that the decomposed DM rotation
curves of most sample galaxies are well matched in shape tothose of core-like halos which are characterized by a linearincrease of rotation velocity in the inner region. We also derive
Figure 7. Inner slope of the dark matter density profiles α vs. the radius Rin ofthe innermost point within which α is measured as described in the small figure(de Blok et al. 2001). The α-Rin of the sample galaxies from LITTLETHINGS, THINGS and the two simulated dwarf galaxies (DG1 and DG2:Governato et al. 2010) as well as the previous measurements (gray symbols) ofLSB galaxies (open circles: de Blok et al. 2001; triangles: de Blok &Bosma 2002; open stars: Swaters et al. 2003). Filled circles with arrowsindicate the galaxies of which inner density slopes are measured assuming a“minimum disk,” giving a steeper slope. The solid and dotted lines representthe α-Rin trends of dark-matter-only ΛCDM NFW and pseudo-isothermal halomodels, respectively. See Section 6 for more details.
16
The Astronomical Journal, 149:180 (96pp), 2015 June Oh et al.

the DM density profiles of the sample galaxies and quantify thedegree of the central DM concentration by measuring thelogarithmic inner slopes of the profiles. The mean value of theinner slopes α of the 26 sample galaxies is −0.32, whichindicates a mass distribution with a sizable constant density-core toward the centers of the galaxies. This is consistent withthat found in most nearby dwarf galaxies (e.g., LSB galaxies inde Blok & Bosma 2002; THINGS dwarfs in Oh et al. 2011b)which all show a linear increase in the inner shapes of theirrotation curves resulting in shallower inner density slopes( α⟨ ⟩ ∼ −0.2). Considering the fact that observational uncer-tainties are significantly reduced in the high-resolution LITTLETHINGS data, the core-like DM distribution found in oursample galaxies provides a stringent observational constrainton the central DM distribution of halos in ΛCDM simulations.
We find that the derived slopes of the DM density profiles donot agree with the cusp predicted by ΛCDMDM-onlysimulations. However, recent cosmological N-bodySPH galaxy simulations by Governato et al. (2010) (see alsoGovernato et al. 2012; Pontzen & Governato 2012) haveshown that the discrepancy between observations and simula-tions can be reconciled within the ΛCDM paradigm byconsidering the dynamical effect of baryonic feedbackprocesses on the central cusps. According to the simulations,DM-baryon interactions in dwarf galaxies through gas outflowsdriven by SN explosions play a critical role not only in formingbulgeless dwarf galaxies but also in turning central cusps intocores.
As discussed in Oh et al. (2011a), the slowly rising rotationcurves and the resulting shallower DM density profiles of thesimulated dwarf galaxies with SN feedback are qualitativelysimilar to those of the dwarf galaxies from THINGS. This isalso the case for our sample galaxies from LITTLE THINGSwhose DM rotation curves in the inner region rise too slowly tomatch the steep rotation curves of CDM halos. This shows thatproper modeling of DM-baryon interactions in ΛCDM galaxysimulations is able to alleviate the long-standing tensionbetween observations and simulations regarding the centralDM distribution in dwarf galaxies.
Notwithstanding the dominant trend of core-like DMdistribution in the LITTLE THINGS sample galaxies, some ofthe sample galaxies, such as DDO 210 and Haro 36 are equallywell fitted by core- and cusp-like halo models in describing theirDM rotation curves. They have relatively steeper inner densityslopes with α ≈ −0.70 and −0.50 for DDO 210 and Haro 36,respectively, compared to the mean value (DM only) of the restof the sample (∼−0.29). It is possible, however, despite thehigh angular resolution of the LITTLE THINGS H I data, theinner density slopes of these two galaxies are affected by beamsmearing (the H I disk of DDO 210 being intrinsically small andHaro 36 being one of the more distant dwarfs). Insufficientspatial resolution in the inner region of the galaxies results insteeper observed inner DM density slopes.
According to the latest N-body SPH simulations of dwarfgalaxies with baryonic feedback processes (Governatoet al. 2012), the SN feedback in low mass dwarf galaxies witha stellar mass less than 106 ⊙M is not sufficient to disrupt thecentral cusps, the repeated energy injection from SN explosionsinto DM halos becoming inefficient, largely due to low starformation efficiencies in these low mass systems. However,previous observational studies regarding the “cusp/core”problem have mostly focused on relatively massive dwarf
galaxies for which reliable rotation curves are available. Lowmass dwarf galaxies have been usually excluded for the studyof the central DM distribution due to the low amplitude of theirmaximum rotation velocities. The kinematics of such low massdwarf galaxies is more vulnerable to kinematic disturbanceslike non-circular motions in galaxies compared to moremassive ones, and also more sensitive to additional corrections(e.g., asymmetric drift) made when deriving rotation curves. Inthis respect, the possibility of a selection effect in favor ofrelatively massive dwarf galaxies where the effect of SNfeedback is enough to turn the central cusps into cores shouldbe considered.It would therefore be worthwhile to perform high-resolution
follow-up observations, for example using an optical integralfield unit, of low mass dwarf galaxies including some of theLITTLE THINGS dwarf galaxies (e.g., DDO 210) whosestellar masses lie in the regime where primordial CDM cuspsare predicted from the simulations (Governato et al. 2012).These high-resolution observations will enable us to achieve afiner sampling of the central region of the galaxies, and thusmore accurate inner DM density profiles. From this, morestringent observational constraints on the central cusp of lowmass dwarf galaxies could be provided. Moreover, an accuratemeasurement of the DM distribution in these low mass dwarfgalaxies will provide an ultimate test for the CDM paradigmgiven that dwarf galaxies inhabiting DM halos with a shallowpotential well have only room for CDM, unlike clusters ofgalaxies whose gravitational potential is deep enough to retainWDM as well as CDM. Therefore, the presence or absence of asignature of the central cusp in these low mass halos willprovide a critical observational test, either supporting orfalsifying the ΛCDM paradigm.
We thank W. J. G. de Blok for providing the inner densityslopes and stellar masses of the THINGS disk galaxies anduseful comments and discussion. We thank Fabio Governato,Andrew Pontzen, Chris Brook and Arianna Di Cintio for usefuldiscussion on the simulations and providing the data. Parts ofthis research were conducted by the Australian ResearchCouncil Centre of Excellence for All-sky Astrophysics(CAASTRO), through project number CE110001020. Thiswork was funded in part by the National Science Foundationthrough grants AST-0707563 and AST-0707426 to D. A. H.and B. G. E.
APPENDIX ADATA AND KINEMATIC ANALYSIS
In this appendix, we present the data and kinematic analysisof the 26 LITTLE THINGS (Hunter et al. 2012) dwarfgalaxies. For each galaxy, we show the (1) data (Figures 11,14, 17, 20, 23, 26, 29, 32, 35, 38, 41, 44, 47, 50, 53, 56, 59, 62,65, 68, 71, 74, 77, 80, 83, and 86), (2) kinematic analysis(Figures 12, 15, 18, 21, 24, 27, 30, 33, 36, 39, 42, 45, 48, 51,54, 57, 60, 63, 66, 69, 72, 75, 78, 81, and 84), and (3) massmodeling (13, 16, 19, 22, 25, 28, 31, 34, 37, 40, 43, 46, 49, 52,55, 58, 61, 64, 67, 70, 73, 76, 79, and 85) with descriptions.A. Data—(a) integrated H I intensity map (moment 0). The
contour levels start at σ+3 in steps of σ+3 . (b) IWM velocityfield (moment 1). (c) Velocity dispersion map (moment 2). (d)Spitzer IRAC 3.6 μm image obtained from the archivesincluding “SINGS” (Kennicutt et al. 2003) and Spitzer “LocalVolume Legacy” (Dale et al. 2009). (e) Bulk velocity field
17
The Astronomical Journal, 149:180 (96pp), 2015 June Oh et al.