high resolution electron energy-loss spectroscopymmrc.caltech.edu/lk eels/info/hreels-mps.pdf ·...
TRANSCRIPT


High Resolution Electron Energy-Loss SpectroscopyManuel P. Soriaga, Xiaole Chen and Ding Li
Texas A&M University, College Station, TX, USA
John L. Stickney
University of Georgia, Athens, GA, USA
Method Summary 11 Introduction 22 Technical Background 23 Selected Applications 44 Acknowledgments 145 Abbreviations and Acronyms 146 End Notes 147 Further Reading 158 References 15
METHOD SUMMARY
Acronyms, Synonyms• High-resolution Electron Energy-Loss Spectroscopy• Electron Energy-Loss Spectroscopy.
Measured physical quantities• the number of counts (intensity) as a function of the energy loss of inelastically backscattered low-energy electrons.
Information available• the vibrational modes, and the corresponding energies, of species at the interface: substrate, physisorbed adsorbate,chemisorbed adsorbate, adsorbate–adsorbate interactions.
Information not available, limitations• The properties are not related to the vibrational modes of the interfacial species.
Examples of questions that can be answered• What molecular species are present on the surface?• What is the mode of bonding between the adsorbate and the substrate?• How does the surface chemical bond influence the vibrational properties of the adsorbate?• What is the surface coverage of the adsorbed species?
Major advantages• extremely sensitive; limit of detection is ca .0.01% of a monolayer• broad spectral range; typically, 50 (6.2 meV) to 4000 cm−1 (496 meV)

2 APPLICATIONS OF PHYSICAL METHODS TO INORGANIC AND BIOINORGANIC CHEMISTRY
• impact-scattering mechanism not restricted by selection rules; in combination with dipole scattering, all vibrationalmodes may be discernible• nondestructive.
Major disadvantages• an ex situ method requiring an ultrahigh vacuum environment• comparatively low resolution: typically, 30 cm−1 (3.7 meV); at best, 4 cm−1 (0.5 meV)• backscattering may be inhibited by cationic species.
Sample constraints• The sample surface must be conductive and relatively smooth.
1 INTRODUCTION
A vast amount is now known, at the atomic level,about heterogeneous processes at gas–solid interfaces. Yet,three decades ago, research in solid surface science wasmired in traditional thermodynamic and kinetic experimentsthat were not able to yield molecular level information.Fundamental issues, such as the molecular structure andchemical composition of the surface complex, could not beadequately addressed by the data generated from the classicalmethods. It was not until the development of highly surface-specific empirical tools that tangible gains in the study of thegas–solid interface were achieved.
The main difficulty in surface characterization liesin the exceedingly low population of surface atoms (1015
atoms cm−2) relative to that of bulk species (1023 atomscm−3). Experiments intended to examine the physical andchemical properties of surfaces must employ techniquesthat interact only with the outermost layers. For example,standard structural tools such as (nongrazing incidence) X-raydiffraction are not applicable to single-crystal surfaces since Xrays penetrate deeply into the material and yield informationon the bulk rather than the surface.
The majority of interfacial characterization tech-niques take advantage of the unique surface sensitivity oflow-energy electrons. Such surface specificity arises becausethe mean free path of an electron through a solid is dependentupon its kinetic energy.1,2 In particular, an electron whosekinetic energy is between 10 and 500 eV can traverse nomore than 2 nm within the solid. Hence, the ‘‘interrogation’’of low-energy electrons emergent from a sample will bearinformation that is specific only to the surface.
A solid subjected to a beam of electrons of primary(incident) energy Ep gives rise to backscattered (primary)and emitted (secondary) electrons. The energy distributionof these electrons can be divided into four regions basedupon the origin of the scattered electrons. These regionscorrespond to the following: (i) True secondary electrons,are created from multiple inelastic interactions between theincident and bound electrons; these electrons give rise to anintense broad band at the lower end of the spectrum. (ii) Auger
electrons which, along with primary electrons inelasticallyscattered by surface electronic states, are responsible forthe small peaks in the medium-energy range. (iii) Primaryelectrons, which are inelastically scattered upon interactionswith surface vibrational states; peaks associated with theseelectrons reside close to the elastic peak as their energy lossesare comparatively small. (iv) Primary electrons, which arescattered elastically; such electrons, comprise only a smallpercent of the total incident electrons, and they generatethe elastic peak at Ep. Regions (ii) to (iv) of the energyspectrum have been exploited in modern surface-structural andinterfacial-elemental analysis. The elastic peak, for example,is used in diffraction experiments. The peaks in Region(iii) form the basis of high-resolution electron energy-lossspectroscopy (HREELS).
2 TECHNICAL BACKGROUND
2.1 Energy-Loss Mechanisms
Almost all of the electrons incident at a solid surfaceundergo inelastic events that cause them to be backscatteredat energies lower than their initial or primary energy Ep. If El
is the energy lost to the surface, peaks would appear in thespectrum at energies �E = Ep − El. Such peaks, commonlyreferred to as energy-loss peaks, originate from core-level ionizations, valence-level excitations, plasmon losses,or vibrational excitations.1,2 Since Evibrational < 4000 cm−1
(0.50 eV)a, the vibrational energy-loss peaks lie close to theelastic peak and can be observed only if electron-energydiscrimination is carried out at high resolution.
Two mechanisms give rise to high-resolution electronenergy-loss (HREEL) spectra1–8: dipole scattering and impactscattering. In dipole scattering, the incident electron may betreated similarly to an electromagnetic (infrared) wave thatinteracts, at long range, with oscillating dipoles created by thevibration of species at the surface. Dipole-scattering HREELSis thus governed by the well-known harmonic-oscillatorb

infrared selection rules: At ambient temperatures, (i) onlyfundamental transitions are allowed; and (ii) only vibrationsaccompanied by a change in dipole moment are observed.
On metal surfaces, two additional selection rulesapply. The first is that only vibrations perpendicular to thesurface are HREELS active. This rule follows from twophenomena unique at metal surfaces3–8: (i) Electromagneticwaves polarized perpendicularly to the plane of incidence(parallel to the plane of the surface) undergo a 180◦ phaseshift upon reflection. That is, at the metal surface, the out-of-phase electric-field vectors of the incident and reflectedwaves cancel each other; as a result, no field exists thatcan couple with dipoles that oscillate parallel to the surface.(ii) The dynamic dipole moment generated by an oscillator thatvibrates in the surface-parallel direction is cancelled by that ofits image dipole (Figure 1); hence, there the net dynamic dipolemoment is zero. On the other hand, if the real dipole is orientedperpendicularly to the surface, its dynamic dipole moment isreinforced by that of its image dipole. This selection rule is thesame as that for infrared reflection-absorption spectroscopy(IRAS).c
The second dipole-scattering selection rule states thatthe intensity is at a maximum when the angle of collection isthe same as the angle of (specular) reflection. This selectionrule is illustrated in Figure 2; the intensity of the dipole-scattered peak at 130 meV (1050 cm−1) falls precipitously assoon as the collection angle deviates from the specular angle.Figure 2 also shows that the angular dependence of the elasticpeak is the same as that of the dipole-scattered peak.
The mechanism for impact scattering at solids israther complex as it involves the penetration of the incidentelectron into the adsorbed molecule; the theoretical treatmentrequires a quantum mechanical formalism. The transfer ofenergy from the incident electron to a vibrational mode occurs,within a very short time, while the electron is inside themolecule. The dipole-scattering selection rules do not apply toimpact scattering. Theoretical considerations have predicted,and experimental studies have confirmed, the following‘‘propensity rules’’ for this mechanism4: (i) Impact scattering
+
−
+
−
−+
+−
Image dipoles
Surface dipoles
Figure 1 The dynamic electric moment of the dipole orientedparallel to the metal surface is cancelled by that of its image dipole.In the vertical orientation, the dynamic electric moments of thesurface and image dipoles reinforce each other
HIGH RESOLUTION ELECTRON ENERGY-LOSS SPECTROSCOPY 3
qI
J
1000
100
10
1
0.1
0.01
0.001−5 0 5 10 15 20 25 30
130 meV
80 meV
Elastic beam
Abs
olut
e in
tens
ities
(kH
z)
J (°)
Figure 2 The influence of off-specular angle (ϕ) on the absolutepeak intensities in dipole scattering (130 meV) and in impact scatter-ing (80 meV). (Published in Electron Energy Loss Spectroscopy andSurface Vibrations, Ibach H & Mills D L, Elsevier 1982)
vanishes in the specular direction; that is, impact-scatteredpeaks can be observed only if detection is at angles removedfrom the specular direction. The dependence of impactscattering on the off-specular scattering angle (ϕ), whereϕ is the deviation of the collection angle from the angle of(specular) reflection, is shown in Figure 2.4 Impact scattering(80 meV (645 cm−1)) is most prominent when ϕ ∼ 15◦.(ii) Impact scattering is more likely to be dominant, even at lowoff-specular angles, at higher vibrational energies. (iii) Strongdipole scatterers are weak impact scatterers; conversely, weakdipole scatterers are strong impact scatterers.d
It is clear that the combination of specular andoff-specular HREELS provides a means for the completeidentification of the normal modes of an adsorbed molecule;considerations based upon point-group and space-group theorywould, of course, be required. HREELS is an extremelysensitive technique. The limit of detection for strong dipolescatterers such as CO can be as low as 0.0001 monolayer; forweak scatterers such as hydrogen, the limit is 0.01 monolayer.In comparison, IRAS for chemisorbed CO, a strong infraredabsorber, is restricted to coverages above 0.1 monolayer.HREELS studies of non-CO organic molecules adsorbed atatomically smooth surfaces are abundant; similar experimentsusing IRAS are meager. The energy accessible to HREELS
4 APPLICATIONS OF PHYSICAL METHODS TO INORGANIC AND BIOINORGANIC CHEMISTRY
ranges from 50 (6.2 meV) to 4000 cm−1 (496 meV); commonIRAS detectors are not useful below 600 cm−1 (74 meV). Onthe other hand, IRAS has higher-resolution (nominally 4 cm−1)than HREELS (typically 30 cm−1 (3.7 meV)), althoughresolutions of up to 4 cm−1 (0.25 meV) have been claimedfor the latest models of (Ultrahigh-resolution electron energy-loss spectroscopy (UHREELS)) instruments.7 The primarylimitation of HREELS is that the apparatus is quite specialized,rather delicate and requires an ultrahigh vacuum (UHV)environment; IRAS can be carried out under ambientconditions. It has recently been observed that countercationspresent in the adsorbed layer may block low-energy electronbackscattering.8
2.2 Instrumentation
Figure 3(a) shows a schematic diagram of a first-generation HREEL spectrometer.3 In this model, the energyof incident electrons can be varied from 1 to 10 eV. Toafford high-resolution, energy monochromation and analysisare done either with a cylindrical mirror analyzer, cylindricaldeflector, or spherical deflector analyzers in combinationwith retarding-field optics. Off-specular collection of thebackscattered electrons is afforded by rotation of either thesample or the analyzer. Owing to extremely low signals(10−10 A), continuous dynode electron multiplier detectorsare employed. Figure 3(b) is a photograph of an UHREELSspectrometer.7 This model consists of an electron gun, atwo-stage monochromator, a single-stage energy analyzer,and a channel electron multiplier detector. Both energymonochromation and energy analysis are carried out with 127◦cylindrical deflection analyzers. The incident electrons have aninitial energy spread of 0.3 eV. The two- stage monochromatorserves to narrow the energy spread to <1 meV and generate ahighly monoenergetic beam of low-energy electrons (typically1 to 10 eV). A zoom lens system focuses and accelerates theelectron beam onto the sample. The backscattered electronsare passed through a separate zoom lens for focusing anddeceleration before they are sorted out by a single-stage energyanalyzer into the detector. The signal is fed to a preamplifieras pulses for electron counting. The analyzer is designed to berotatable from 0◦ to 78◦ for off-specular (impact-scattering)measurements.
3 SELECTED APPLICATIONS
3.1 Inorganic Molecules
3.1.1 Carbon Monoxide
Carbon monoxide is the most widely used molecularprobe in the study of the coordination chemistry and catalytic
reactivity of metal surfaces. The chemisorption of COat transition-metal surfaces is similar to the coordinate-covalent bond formation in homogeneous metal–carbonylcomplexes.9–11 The interaction initially involves a σ bondformed by the electron-pair donation from a filled spσ ligandorbital to an unoccupied dσ metal orbital; this is followedby a π bond created by the electron-pair back-donation froma filled dπ (or dpπ ) metal orbital to an empty 2π∗ ligandorbital.9,10 As a result of the surface coordination, the C≡Obond is weakened and νCO, the vibrational frequency of theC≡O stretch mode (2142 cm−1 (266 meV) in the gas phase)undergoes an appreciable redshift. The larger the extent ofthe back-donation, the stronger the metal–carbon (M–C)interaction, and the weaker the C≡O bond. The degree of π
back-donation is also heightened by an increase in the numberof surface atoms bridged by the CO ligand. In the lattercase, multiple M–C bonds will be expected; for example,CO chemisorbed on a threefold hollow site will most likelybe bonded to three different metal atoms. Consequently, νCO
will display strong dependence on site geometry11: At ‘‘atop’’(onefold) sites, νCO lies in the range from 2000 (248 meV)to 2130 cm−1 (264 meV); at twofold bridge sites, νCO fallsbetween 1840 (228 meV) and 1960 cm−1 (242 meV); andfor threefold bridge sites, νCO appears in the range from1800 (223 meV) to 1920 cm−1 (238 meV). HREELS has beenemployed in the study of CO chemisorption on most transitionmetals.12–26 Bimetallic22 and oxide surfaces23,24 relevant incatalytic oxidation have also been investigated.
Since the infrared absorptivity of the C≡O stretchmode is fairly large, IRAS has also enjoyed widespread use inthe study of CO chemisorption. However, for the investigationof the metal–carbon vibrational mode, IRAS may not bethe technique of choice since the frequency of this mode(νM – CO) lies below 400 cm−1 (50 meV), a region in whichnonsynchrotron-based sources are quite weak and wide-rangephotoconductive detectors suffer degraded sensitivity. Studieson the metal–carbon stretch mode may be more reliablyinvestigated by HREELS, although (infrared) sum-frequencygeneration also seems viable.27 The expectation is that, sinceνCO is dependent upon adsorption-site geometry, νM – CO willlikewise be influenced by it. For example, on Rh(111), ithas been found that νM – CO was highest when the ligand wascoordinated on a onefold site and lowest when located on athreefold site.28 This observation may appear inconsistent withthe fact that linearly bonded CO has the weakest metal–carbonbond. But it must be noted that an atop site attached CO hasonly one M–C bond, whereas a threefold-site-bonded COwould have three distinct bonds with three different metalatoms. While the combined strength of the three bonds wouldbe greater than just one bond, the vibrational energy of eachof the three (degenerate) bonds would, individually, not beas high. Of course, the role of dipole–dipole interactions inthe observed frequency shift cannot be discounted since theshifts become pronounced at near-monolayer coverages wherelateral interactions become significant.28

HIGH RESOLUTION ELECTRON ENERGY-LOSS SPECTROSCOPY 5
Electron gun
Heating device
1 cmElectron multiplier
Sample26
272829
3031
3233 34
3536
37
38
22
212019
18
17
161514
1312111098765432
1
23
24
25
Electron monochromator Electron analyzer
Electron optics
21/16'', Adjustable
12.99''
9.11''dia.9.54''dia.
12''Flange
e-gun Premonochromator
Monochromator Channeltron
[Top view]
Scatteringchamber
Rotating analyser
a Metal shields1/32''thick
6.90''
(a)
(b)
Figure 3 (a) Schematic diagram of first-generation HREEL spectrometer. (Reprinted from Froitzheim.3 With kind permissionof Springer Science & Business Media); (b) Photograph of a modern ultrahigh-resolution EEL spectrometer. (Reprinted fromhttp://www.lktech.com/products/els5000.html, courtesy of LK Technologies, Inc)
Two other HREELS studies of dipole–dipolecoupling will be mentioned. One focused on Ni(100) andinvolved the determination of the effect of temperature andcoverage on νCO.13 The results are displayed in Figure 4. The
peak near 50 meV (400 cm−1) was associated with νM – CO andthe peaks at 240 (1920 cm−1) and 250 meV (2016 cm−1) wereassigned, respectively, to νCO at twofold and atop sites. At150 K, only one peak, due to bridge-bonded CO, was observed

6 APPLICATIONS OF PHYSICAL METHODS TO INORGANIC AND BIOINORGANIC CHEMISTRY
50 meV
60 meV
240 meV 260 meV
Ep = 4 eV
T = 300 K
T = 250 K
T = 200 K
1.5 L of CO, T = 150 K
0.5 L of CO, T = 150 K
0 100 200 300
Energy loss (meV)
Clean
Inte
nsity
(ar
bitr
ary
units
)
Figure 4 HREEL spectra of CO on Ni(100) for 0.5 L and 1.5 L ofCO and thermal behavior of the 1.5 L CO in the 150–300 K range.(Reprinted from Formoso, Marino, Chiarello, Agostino, Caruso andColavita,13 Elsevier 2006)
at submonolayer coverages. At near-monolayer coverage, asecond prominent peak emerged at 260 meV (2097 cm−1).The latter was not assigned to atop site-bonded CO since νCO
for that is only 250 meV. A dipole–dipole interaction betweenadjacent CO molecules was thus postulated. It was thoughtthat this type of coupling would weaken the metal–CO bondbecause of reduced π -back donation; the latter, in turn, wouldstrengthen the C≡O bond and lead to the blueshift of νCO.Further evidence for the dipolar interactions was providedby the decrease in the intensity of the 260-meV peak as thetemperature is raised; an increase in temperature tends todisrupt dipole–dipole coupling. At 300 K, CO coordinated attwofold and atop sites, devoid of dipole–dipole interactions,were indicated.
The other study examined the influence of Snadatoms on the dipole–dipole interactions at Pt single-crystalsurfaces.22 On Pt(110), CO was bonded predominantly on
atop sites at near-monolayer coverages. The same mode ofcoordination was found for the Pt(110)-(1 × 2)-Sn surface.When the CO coverage was further increased on the Sn-free surface, an upward shift to 260 meV was observed forνCO,22 a result that served as an indicator of the presence ofdipole–dipole interactions. No similar blueshift in νCO wasnoted on Pt(110)-(1 × 2)-Sn, most likely because CO does notbind strongly on the interfacial Sn atoms; it was noted that thecoverage of CO decreased when the amount of coadsorbed Snwas increased.
3.1.2 Dioxygen
When dioxygen is chemisorbed on a transition-metalsurface, an electron pair is donated from a filled 2π orbitalof O2 to a vacant dσ orbital on the metal, followed byback-donation from a filled dπ (or dpπ ) metal orbital toan empty 2π∗ orbital on dioxygen. As a result, the O=Obond is weakened considerably.29–40 For example, at 100 K,chemisorption of O2 on most metals is molecular, but thevibrational frequency of the O–O stretch mode (νOO) isdrastically redshifted, 630 cm−1 (78.1 meV) on Ag(110),40
870 cm−1 (108 meV) on Pt(111),38 and 850 cm−1 (105 meV)on Cu(111),33 relative to that in the gas phase 1580 cm−1
(196 meV). At room temperature, O2 is dissociativelychemisorbed as oxygen atoms on the same metals.
While O2 adsorption has been investigated for avariety of substrates,29–40 Ag and Pt have received widestattention; Ag because of its superior selectivity towardethylene epoxidation, and Pt for its singularly high catalyticefficiency in almost all types of exhaustive oxidation reactions.The interaction of O2 with Ag(110) was found to yieldfour distinct adsorption states that depended upon thetemperature: a physisorbed (condensed) layer at T < 40 K,two molecularly chemisorbed phases between 60 K and180 K, and a dissociatively chemisorbed (atomic) state atT > 180 K.41 The first molecularly chemisorbed species,labeled α-O2,37 may be generated from the physisorbedstate by a temperature increase to 60 K; however, α-O2 isnot dissociated to atomic oxygen at higher temperatures. Itwas thought that lateral interactions within the preformedphysisorbed layer induced a precursor orientation that enabledconversion to α-O2. The other molecular species, tagged as β-O2, was formed when the Ag surface was dosed directly fromthe gas phase at T > 60; evidently, under these conditions,the physisorbed layer that is favorably oriented toward α-O2 formation is not the initial product. Above 180 K, β-O2
undergoes dissociative chemisorption to oxygen adatoms.Similar results were obtained for Pt(111): four
temperature-dependent adsorption states of O2 were alsoformed.38,42,43 The two molecularly chemisorbed formsidentified were (i) a superoxo-type (O−
2 ) species bondedat twofold bridge sites and characterized by νOO of870 cm−1 (108 meV), and (ii) a peroxolike (O2−
2 ) species morestrongly coordinated (νOO = 690 cm−1 (86 meV)) at threefold

HIGH RESOLUTION ELECTRON ENERGY-LOSS SPECTROSCOPY 7
−200 200
(a) (b)
4.8mV FWHM4.8mV FWHM
× 750
× 750
490
490690690870
870
0.04 ML
0.02 ML
0.01 ML
0.005 ML
0.003 ML
0.005 ML
0.013 ML
CleanClean
O2/Pt(111)Ei = 0.055 eV
Ta = 77 K
O2/Pt(111)Ei = 0.70 eVTa = 77 K
600 1000 1400 1800 2200 2600
Energy loss (cm−1)
Arb
itrar
y co
unts
200−200 600 1000 1400 1800 2200 2600
Energy loss (cm−1)
Figure 5 HREEL spectra of low-coverage doses of: (a) low incident energy (0.055 eV) oxygen, and (b) high incident energy (0.70 eV)oxygen on Pt(111) surfaces. (Reprinted with permission from P. D. Nolan, B. R. Lutz, P. L. Tanaka. J. E. Davis and C. B. Mullins. J. Chem.Phys. 111:3696 (1999). 1999 by the American Institute of Physics)
hollow sites. Experiments that combined HREELS withO2-molecular-beam techniques indicated that high incidentenergies promoted the formation of the peroxo species(Figure 5a). At lower impact energies, both species weregenerated but the fraction of the superoxo species increasedwhen the O2 dosage was increased (Figure 5b). It waspostulated that the O2 molecules of higher energy are able toovercome the activation barrier for the two-electron metal-to-ligand charge transfer in the production of the peroxo species.
3.1.3 Water
As the most widely utilized solvent, studies of theadsorption of water at various surfaces abound. In suchinvestigations, the emphasis has been on (i) its propensitytoward dissociation, (ii) its structure in the adsorbed state,and (iii) its chemistry in the presence of other coadsorbedspecies. Although IRAS and HREELS have been employedin such studies, the former is limited to ultrathin films becauseof the strong infrared absorptivity of the O–H stretch mode;condensed multilayers can only be investigated by HREELS.44
The HREEL spectrum of water adsorbed on Pt(100)in multilayer amounts resembles that of ice. In submonolayerquantities, three νOH peaks were observed at 2850 (353 meV),3380 (419 meV), and 3670 cm−1 (455 meV) respectively,these were assigned to O–H stretch modes in metal-bondedhydroxyls, hydrogen-bonded water, and water devoid ofintermolecular interactions.44 It is known that hydrogenbonding leads to a decrease in the O–H stretch frequency(νOH). When the oxygen is coordinated to the metal, thedecrease in νOH is more profound. In fact, the presence ofthe lowest frequency νOH peak suggests that a fraction of
the adsorbed water has undergone dissociation. On Ru(0001),three νOH peaks at 2935 (364 meV), 3290 (408 meV) and3500 cm−1 (434 meV) were also observed at submonolayercoverages. Unexpectedly, however, the 408-meV peak waspresent even when the interfacial water existed as a bilayer.45
This result prompted the conjecture that partial decompositionhad likewise taken place within the bilayer. A subsequenttheoretical investigation, however, showed that the 2935 cm−1
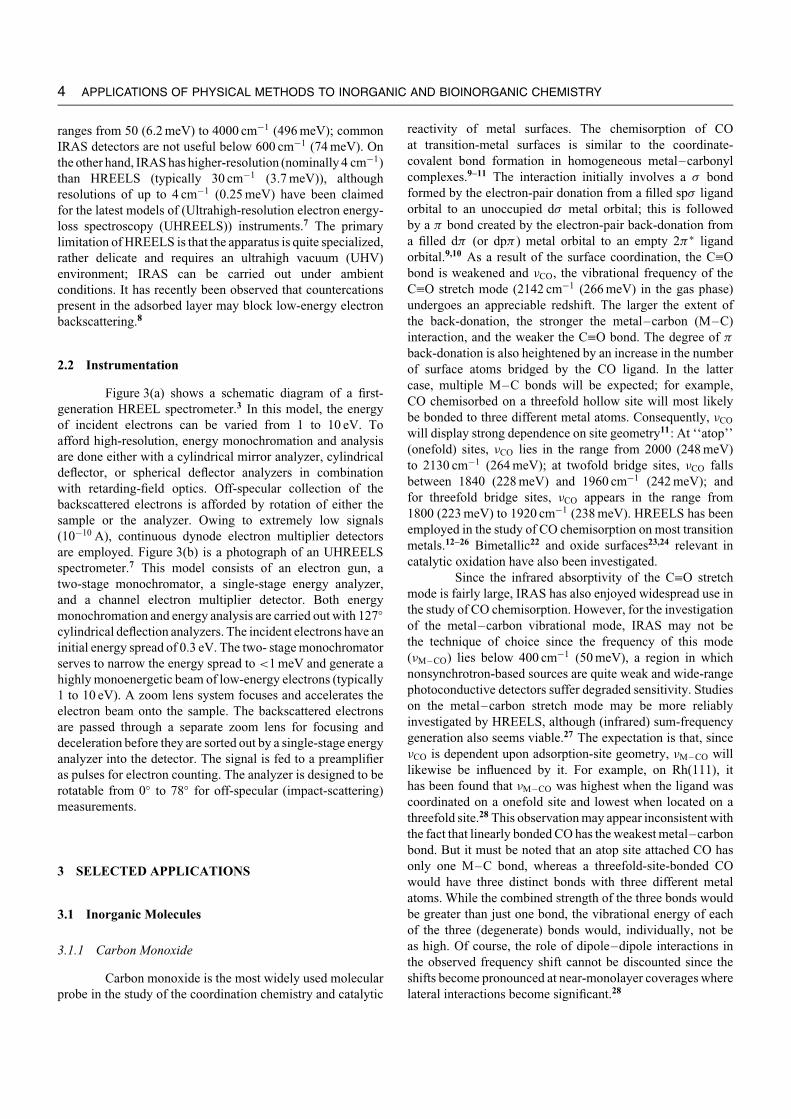
peak would still be possible in a bilayer that was completelymolecular; as illustrated in Figure 6,46 two structural types ofhydrogen-bonded water are possible in the bilayer.
Interfacial water was studied on Pd(100) and onPd(100)-(1 × 1)-O surfaces. At 10 K and submonolayercoverages, the interfacial water was found to exist asmonomers47 at both surfaces. When the temperature wasincreased to 110 K, hydrogen-bond formation between thewater molecules transpired on the clean surface but not onthe oxided metal. Evidently, oxygen coadsorbed on the metaldisrupted hydrogen bonding between the water molecules.Such disruption, however, does not appear to occur when thesurface oxygen is part of a nonmetallic species: When waterwas adsorbed on ultrathin SiO2 films, hydrogen-bonded waterwas observed even at submonolayer coverages; evidently, theadsorbate–adsorbate hydrogen bonds are stronger than thesubstrate–adsorbate interactions.48
The adsorption of water on Ni(100) was comparedwith that on Pd(110) surfaces.49 It was noted that the Pd–OH2
bond is substantially weaker than the Ni–OH2 bond, a resultconsistent with the fact that a molecular bilayer structure isformed on Pd(110) but not on Ni(100).
Work has also been published on other interfacialmaterials and structures that include (i) α-Cr2O3(001)/α–Fe2
8 APPLICATIONS OF PHYSICAL METHODS TO INORGANIC AND BIOINORGANIC CHEMISTRY
(a)
(c)
(b)
(d)
Figure 6 Equilibrium structure of (a) water monomer, (b) dimer,(c) H-up bilayer, and (d) H-down bilayer on the Pt(111) surface.(Reprinted with permission from M. Sock, A. Eichler, S. Surnev.J. N. Andersen, B. Klotzer, K. Hayek, M. G. Ramsey and F. P.Netzer. Surf. Sci. 545:122 (2003). 2003 by the American PhysicalSociety)
O3/α–Al2O3(001), a surface strained by the incorporation ofFe2O3;50 (ii) ultrathin Pd films on MgO(100) substrates;51
(iii) Si(100)-(2 × 1) and Si(111)-(7 × 7) single- crys-tal planes;52 (iv) defect-free SrTiO3(100);53 (v) Ag(011);54
(vi) MgO(100) superlattices on Mo(100);55 (vii) coadsorptionof CO and water on Al(111);56 (viii) oxygen-covered Pt groupmetals57,58; and (ix) hydrogen-pretreated Pt surfaces.59
3.1.4 Organometallic Compounds
Interest in the structure of adsorbed organometalliccompounds stems from their capabilities as research-laboratory and industrial catalysts. In view of its inherentsurface sensitivity and dramatically enhanced resolution,UHREELS has recently become a viable technique inthe acquisition of fingerprint spectra60,61 of adsorbedorganometallic compounds such as the metallocenes.62–65
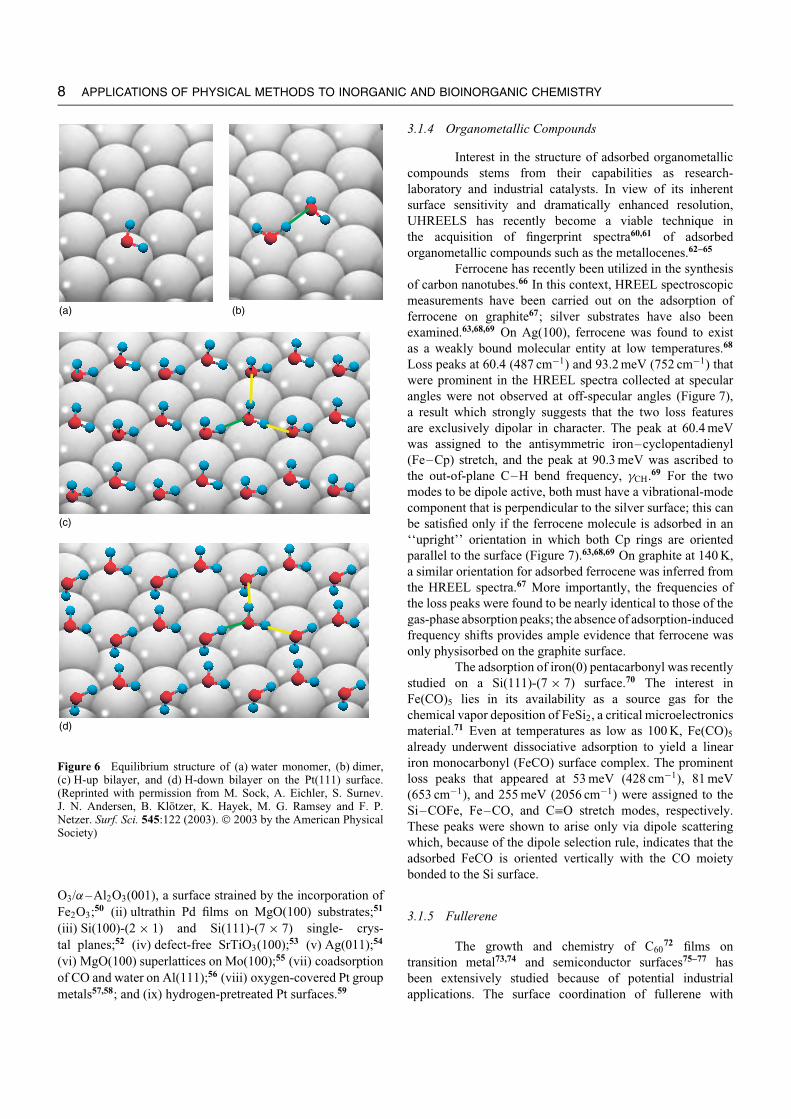
Ferrocene has recently been utilized in the synthesisof carbon nanotubes.66 In this context, HREEL spectroscopicmeasurements have been carried out on the adsorption offerrocene on graphite67; silver substrates have also beenexamined.63,68,69 On Ag(100), ferrocene was found to existas a weakly bound molecular entity at low temperatures.68
Loss peaks at 60.4 (487 cm−1) and 93.2 meV (752 cm−1) thatwere prominent in the HREEL spectra collected at specularangles were not observed at off-specular angles (Figure 7),a result which strongly suggests that the two loss featuresare exclusively dipolar in character. The peak at 60.4 meVwas assigned to the antisymmetric iron–cyclopentadienyl(Fe–Cp) stretch, and the peak at 90.3 meV was ascribed tothe out-of-plane C–H bend frequency, γCH.69 For the twomodes to be dipole active, both must have a vibrational-modecomponent that is perpendicular to the silver surface; this canbe satisfied only if the ferrocene molecule is adsorbed in an‘‘upright’’ orientation in which both Cp rings are orientedparallel to the surface (Figure 7).63,68,69 On graphite at 140 K,a similar orientation for adsorbed ferrocene was inferred fromthe HREEL spectra.67 More importantly, the frequencies ofthe loss peaks were found to be nearly identical to those of thegas-phase absorption peaks; the absence of adsorption-inducedfrequency shifts provides ample evidence that ferrocene wasonly physisorbed on the graphite surface.
The adsorption of iron(0) pentacarbonyl was recentlystudied on a Si(111)-(7 × 7) surface.70 The interest inFe(CO)5 lies in its availability as a source gas for thechemical vapor deposition of FeSi2, a critical microelectronicsmaterial.71 Even at temperatures as low as 100 K, Fe(CO)5
already underwent dissociative adsorption to yield a lineariron monocarbonyl (FeCO) surface complex. The prominentloss peaks that appeared at 53 meV (428 cm−1), 81 meV(653 cm−1), and 255 meV (2056 cm−1) were assigned to theSi–COFe, Fe–CO, and C≡O stretch modes, respectively.These peaks were shown to arise only via dipole scatteringwhich, because of the dipole selection rule, indicates that theadsorbed FeCO is oriented vertically with the CO moietybonded to the Si surface.
3.1.5 Fullerene
The growth and chemistry of C6072 films on
transition metal73,74 and semiconductor surfaces75–77 hasbeen extensively studied because of potential industrialapplications. The surface coordination of fullerene with

60.4
93.2
364.5 378.7
× 150
× 150
100 150 200 250
A
B
0 50 100 150 200 250 300 350 400
Energy loss (meV)
Inte
nsity
(ar
bitr
ary
units
)
Figure 7 HREEL spectra for ferrocene adsorbed on Ag(100) at110 K. A, specular spectrum; B, off-specular spectrum. (Reprintedwith permission from Waldfried, Welipitiya, Hutchings, de Silva,Gallup, Dowben, Pai, Zhang, Wendelken and Boag.69 1997American Chemical Society)
transition-metal surfaces involves the donation of electronsfrom the π orbitals of the ligand to the d orbitals of themetal accompanied by the back-donation of electrons from ametal d orbital to the ligand π∗ orbital. The π -electron back-donation significantly alters the chemical properties of thesurface-attached C60. Because of its high symmetry, there aremore than just a few degenerate and IR-inactive vibrationalmodes.78,79 However, most of these modes are observablein HREELS especially when detection is conducted at bothspecular and off-specular angles.80
Alkali-doped fullerides that exhibit superconduc-tivity have received considerable attention. The spectralfingerprints of these materials show vibrational-mode-specificfrequency shifts and intensity variations related to elec-tron donation from the intercalated metal atoms to the C60
molecules (Figure 8a). HREELS of K-doped C60 thin filmsadsorbed on Ag(111) and Cu(111) showed loss peaks, barelyvisible for the undoped monolayer that increased when thedopant concentration was increased. This trend was thoughtto be a consequence of the charge transfer from the (elec-tropositive) K atom to C60.81 The existence of positive K+ions and negative C−
60 ions may have been established by theappearance of a prominent optical-phonon loss peak broughtabout by the collective oscillations of the cations against theanions (Figure 8b).
Studies on fluoro–fullerenes (C60Fx) were recentlyundertaken because of the interest in such materials as cathodesin Li batteries.83 A recent HREELS-based work focused onthe interaction between C60Fx and the silicon surface.84,85 Thespectrum of C60Fx thin layers deposited on Si(111)-(7 × 7)revealed a weak but well-defined loss feature at 107 meV. Thispeak was attributed to a Si–F stretch mode, which implied
HIGH RESOLUTION ELECTRON ENERGY-LOSS SPECTROSCOPY 9
T1u(2)
T1u(1)
T1u(4)
Ag(111)
Ag(111)
Ag(1)
Ag(2)
Energy loss (mev)
Energy loss (mev)
(a) (b)
60 160 170 18070
(i) (ii)
Cha
nge
tran
sfer
(el
ectr
ons)
−20 −10 0 10 20
500 600 1300 1400
Energy loss (cm−1) Energy loss (cm−1)
−100 0 100
Figure 8 Evolutions of intramolecular vibrations (a) and extramo-lecular phonons, (b) of K-doped C60 on Ag(111) at different dopantconcentrations. The lowest curves correspond to the undopedmonolayers and the topmost ones to the saturated monolayers.(Reprinted from Silien, Thiry and Caudano,82 Elsevier 2004)
that the Si surface was able to defluorinate C60Fx and forma Si–F selvedge on the silicon substrate. The Si–F bond israther strong and renders the substrate chemically inert towardfurther adsorption of C60Fx.84 The defluorination process isenhanced by an increase in temperature.85
3.2 Organic Molecules
3.2.1 Ethylene
The structure and reactivity of ethylene chemisorbedon transition-metal surfaces are of fundamental importancein surface science and heterogeneous catalysis. HREELS hasbeen foremost among the surface characterization techniquesemployed; in fact, the first vibrational spectroscopic studyof ethylene chemisorbed on Pt(111) was carried out withelectron energy-loss spectroscopy (EELS)86 almost a decadebefore IRAS was employed.87,88
At temperatures below 200 K, two types of ethylene-derived surface species have been identified. One is adi-σ -bonded species that results when the C=C double bond

10 APPLICATIONS OF PHYSICAL METHODS TO INORGANIC AND BIOINORGANIC CHEMISTRY
is broken to form two C–metal bonds; the other is a π -bonded species in which the ethylene molecule remains intact.At higher temperatures, a third species, ethylidyne, may begenerated on close packed face-centered cubic (111) surfaces.
The di-σ -bonded species has been observed onPt(111),89 Pt(100),90 Fe(110),91 Ru(001),92 Si(100)93,94 andNi(hkl).95–97 The HREEL spectrum of di-σ -bonded ethyleneis characteristic of aliphatic (sp3-hybridized) compounds witha C–H symmetrical stretch at ca. 3000 cm−1 (372 meV)and a CH2 wag and C–C stretch in the region from1170 cm−1 (145 meV) to 1830 cm−1 (227 meV); a peak near450 cm−1 (55.8 meV) has been attributed to a metal–C stretchmode.98 The π -bonded species has been found on Cu(100),99
Pd(hkl)100–103 as well as on hydrogen or oxygen pretreatedsurfaces.104–107 The HREEL spectrum of the π -adsorbedspecies bears features reminiscent of the infrared spectrumof the ethylene ligand in Zeise’s salt, K[(C2H4)PtCl3]108 withthe C–H symmetric stretch at 3000 cm−1, and a CH2 wag andthe C=C stretch in the region near 1530 cm−1 (190 meV); themetal–C stretch was found at 300 cm−1 (37 meV).98
When either the di-σ -bonded or the π -coordinatedspecies is warmed to room temperature, ethylidyne (≡C–CH3)is generated89,109,110; this surface compound is rather stablesince the anchored carbon is bonded to three different metalatoms. The HREEL spectrum of chemisorbed ethylidyne ischaracterized by vibrational modes of C3v symmetry; theC–H stretch is at 2900 cm−1 (360 meV), the CH3 wagand C–C stretch within the 1400 (174 meV) to 1800 cm−1
(223 meV) interval, and the M–C stretch near 425 cm−1
(52.7 meV).98 Although the complete mechanism of theethylene to ethylidyne conversion is not known, it is thoughtto involve an initial dehydrogenation step followed byhydrogen migration; ethylidene (=CH–CH3) was proposedas an intermediate in the transformation reaction at Pt(111).111
The adsorption of ethylene on clean and oxygenpretreated Pd(111) surfaces was recently studied107; theresults in terms of HREEL spectra, are shown in Figure 9.As anticipated, ethylene was chemisorbed at 100 K as adi-σ -bonded species on the clean metal (Figure 9a). Onthe oxygen precoated surface, however, a π -coordinatedcomplex was obtained (Figure 9b). At 300 K, ethylenechemisorption always resulted in an ethylidynic complexregardless of whether or not the surface was pretreated withoxygen (Figure 9c). When the di-σ -bonded or the π -attachedspecies was warmed to 450 K, quantitative desorption ofstarting material (C2H4) occurred without dehydrogenation;no ethylidyne species was produced from either structureduring the temperature increase.
Adsorption of ethylene on Rh(100) presaturated withhydrogen produced a π -bonded species at low temperatures.105
The degree of sp2-to-sp3 rehybridization upon chemisorptionwas expressed in terms of a ‘‘πσ parameter’’ derived from theHREEL spectrum via the mixing of the C–C (or C=C) stretchand the CH2 scissor modes.112 The πσ parameter, which wasnormalized to zero for pure sp2 hybridization (C2H4) and tounity for pure sp3 hybridization (C2H4Br2), was estimated tobe 0.39 for chemisorbed C2H4; in comparison, a πσ parameterof 0.38 was obtained for Zeise’s salt. The close agreement
0 50 100 150 200 250 300 350 400 450
Energy loss (meV)(a)
0 50 100 150 200 250 300 350 400 450 0 50 100 150 200 250 300 350 400 450
Energy loss (meV) Energy loss (meV)(b) (c)
136
108
CO
177363
× 200
× 1000Specular
× 5Off-specular
× 5
118
59
190CO
158
Specular× 300
Off-specular× 50
369381
× 2
46 167
135
CO366
× 50
Off-specular
× 600
Specular
Figure 9 Specular and off-specular HREEL spectra of (a) Pd(111) surface exposed to C2H4 at 100 K; (b) Pd(111)-2 × 2-O surface exposedto C2H4 at 100 K; and (c) Pd(111) exposed to C2H4 at 300 K. The bars below the spectra indicate the calculated vibrations of each species inthe inset. (Reprinted from Sock, Eichler, Surnev, Andersen, Klotzer, Hayek, Ramsey and Netzer,107 Elsevier 2003)

between the two πσ parameters provides additional evidencethat the ethylene molecule is bound to the surface as a π -bonded ligand. It was also reported in the same work that anethyl intermediate was formed from π -bonded ethylene byinsertion of preadsorbed H atoms, a process that is initiatedeven at temperatures below 110 K. At 110 K < T < 200 K,evolution of gaseous ethane was observed, but further thermaltreatment resulted in the rupture of the carbon–carbon bond.
3.2.2 Methanol
Research activity on methanol has been vigorousbecause of its commercial importance as an alternativefeedstock in fuel cells. When CH3OH is chemisorbed on acatalytic surface at ambient temperatures, it is usually presentas a methoxy intermediate; the latter then undergoes extensivedecomposition to yield a product distribution that dependsupon the temperature. A tabulation of products generatedunder various experimental conditions such as metal catalystand decomposition temperature is given in Table 1; HREELS
HIGH RESOLUTION ELECTRON ENERGY-LOSS SPECTROSCOPY 11
and temperature programmed mass spectrometry were used togenerate the data.
3.2.3 Aromatic Compounds
An immediate issue in the chemisorption of aromaticcompounds is whether the phenyl ring is oriented parallel orperpendicular to the plane of the metal surface. In this regard,the intensity of the out-of-plane C–H bend (γCH) relative tothe in-plane C–H stretch (νCH) provides a direct diagnosticindicator of adsorbed aromatic orientation.130–132 At specularangles, the dipole selection rule states that νCH for a ringchemisorbed completely flat would be EELS-inactive; onlythe γCH mode would exhibit EELS activity. At off-specularangles, the impact-scattering selection rules are less restrictiveand all modes would conceivably be EELS-active, althoughpeaks obtained at specular angles would tend to vanish as theoff-specular angle ϕ is increased.
Early studies with smooth polycrystalline Pt elec-trodes indicated that aromatic compounds such as p-diphenols
Table 1 Methanol decomposition on various metal surfaces
Surface Temperature (K)Decomposition/chemisorption
products References
V(110) 100 Methoxy (–O–CH3) 113C-modified V(110) 100 –O–CH3 113Ti(0001) 100 –O–CH3 113C-modified Ti(0001) 100 –O–CH3 113S-modified Fe(100) 150 CH3O–(decreases if S is increased) 114
450 CO (decreases if S is increased) 114Fe(100) 110 CH3O– 114
450 H2 and CO 114O-modified Fe(100) 150 –O–CH3 115Pt(111) 200 CO and H 116Pt(100) 200 H and CO 117Pt(110) 140 –CHx 118
250 CH4, H and C 118Pt(110)-(2 × 1) 130 –O–CH3 118
250 CO and H 115Rh(100) 250 –O–CH3 119
320 CO and H 119Rh(111) 140 –O–CH3 120
210 CO and H2 120O-modified Rh(111) 140 –O–CH3 120Ni(110) 170 –O–CH3 121
270 CO and H 121Ru(0001) 300 CO and H 122Pd(111) 300 CO 123Pd(100) 77 Methoxide (CH3O−) 124
530 CO, H and H2 124Ge 300 –CH3 and –OH 125NiAl(100) 120 –O–CH3 126
400 H2, CH4, –CH3 and C2H4 126NiAl(110) 120 –O–CH3 126
400 H2, CO, CH4, –CH3 and C2H4 114NiAl(111) 200 –O–CH3 127
650 H2, CO, CH4, and CH3 127Cu(100) 370 Unidentified gaseous products 128Co-modified Mo(110) 250 CH3O− 129

12 APPLICATIONS OF PHYSICAL METHODS TO INORGANIC AND BIOINORGANIC CHEMISTRY
0 500 1000 1500 2000 2500 3000 3500 4000
(c)Energy loss (cm−1)
Cou
nts
(Nor
mal
ized
)
Hydroquinone sulfonate (HQS)
1466
HQS3007
810
545634 1260
1466
810
515 604 1230
3007 QS
Quinone sulfonate (QS)
3.00
2.00
1.00
0
0 1.00 2.00 3.00nM
SOO
OC C
C
O
O
(a)(b)
0
0.40 nM
Figure 10 HREEL spectrum (a), in situ scanning tunneling microscope image (b), and molecular model (c) of quinone sulfonate chemisorbedon Pd(100)
are chemisorbed in discrete, nonrandom orientations thatdepend upon interfacial factors such as the solution concen-tration of the aromatic and the composition of the supportingelectrolyte.133–135 For example, when chemisorbed from dilute(0.1 mM) solutions, a molecular layer of horizontally ori-ented (η6-coordinated) quinonoid species is formed; at higherconcentrations (2 mM), a layer of vertically oriented (2,3-η2-bound) aromatic molecules is generated. The orientationalassignments made from measured adsorbed-molecule crosssections have since been verified by independent experimentsforemost of which has been HREELS; work with the diphenolshas been carried out with Pt and Pd single crystals.136–139
Figure 10 shows HREEL spectra of a Pd(111) elec-trode emersede from aqueous solutions that contained either0.1 mM hydroquinone sulfonate or 0.1 mM benzoquinonesulfonate.132 Four features are most notable: (i) the spectraare identical whether the starting material is the diphenol orthe quinone; (ii) there is a pronounced out-of-plane C–H bend(γCH) at 810 cm−1 (100 meV); (iii) no O–H stretch (νOH)is observed near 3600 cm−1 (446 meV); and (iv) there is asmall but noticeable in-plane C–H stretch (νCH) at 3007 cm−1
(373 meV). These results indicate that, upon surface coor-dination, the diphenolic species undergoes a two-electron,two-proton oxidation to form essentially flat-chemisorbedbenzoquinone; the small νCH peak, however, indicates thatthe aromatic ring is not completely flat, but is slightly tilted.The combination of HREELS and electrochemical (in situ)scanning tunneling microscopy140 has been used to deducethe adsorbed–molecule orientation of the sulfonated quinone
(Figure 10). Recent HREELS and thin-layer electrochemicalmeasurements141 have demonstrated that, at a tenfold increasein solution concentration, hydroquinone is chemisorbed onPd(111) in an edgewise orientation reminiscent of an o-benzyne organometallic complex.133–135
The desorption and decomposition of benzene hasbeen studied on Pt(111) and on Sn-modified Pt(111) forcomparative purposes.142 On the former surface, only a portionof the chemisorbed benzene desorbs upon heat treatment; theremainder is dehydrogenated to form a layer of carbon on thesurface. On the Pt(111)-Sn alloys, only physisorption takesplace.
The cyclization reaction of acetylene at ambienttemperatures to form benzene on Pd(111) has recentlybeen reinvestigated in an attempt to gain insights into itsmechanism.143 It has been claimed that, at low exposures ofacetylene, only ethylidyne is formed. At higher exposures,benzene is formed, albeit at low coverages, as indicated byappearance of the ν4 band of benzene at 720 cm−1.
More recent work on the chemisorption of aromaticmolecules has focused on new materials (e.g., Mo(112)-c(2 × 2)-SiO2 and Mo2C/Mo(100)) and with various benzenederivatives (e.g., C6H5I and C5NH5).144–147
3.2.4 Polymers
Only feeble attempts were initially made two decadesago in the application of HREELS to the study of polymersurfaces. The efforts did not become more earnest until a

decade later. The use of HREELS has primarily been focusedon the following aspects related to polymer films deposited onmetals as well as to surfaces of the polymer films themselves:surface morphology, interfacial composition, the scatteringmechanism, and the strength of the polymer–substrate bond.The utility of HREELS to probe polymer-surface morphologyrests on the observation that elastic peaks due to electronsbackscattered from hydrogen atoms can be correlated with thehydrogen content at smooth surfaces.148
Systems that employed HREELS for interfacial-composition determinations included: poly(ethylene oxide)-polystyrene diblock copolymer on Si wafers149; formalde-hyde poly(oxymethylene) films on Cu(100)150; and Lang-muir–Blodgett films of 4,4’-oxydianiline-pyromelliticdianhydride polyimide on Au and on highly ordered pyrolyticgraphite.151
HREELS experiments with bisphenol-A polycar-bonate, high-density polyethylene, and poly(2-vinylpyridine)suggested that, although dipole and impact scattering areprominent in polymer films, negative-ion resonance scat-tering cannot be discounted.152 Investigations with highlyoriented poly(tetrafluoroethylene) likewise indicated apprecia-ble negative-ion resonance impact scattering with a maximumcross section at an incident electron energy of around 4 eV.153
The use of vibrational spectroscopy to monitorthe strength of polymer adhesion on foreign substrates isbased upon adsorption-induced frequency shifts and intensitychanges in the free polymer modes and the emergence ofnew spectral peaks; the latter, due to metal–polymer bonds,generally appear at energies lower than 75 meV that can beaccessed only by HREELS. It was found, for example, thatPd is inert toward polyimide, but Cr is quite reactive.154 Theinteraction between aluminum deposited onto a polyimide filmwas also investigated by HREELS. When the Al coverage was< 1014 atoms cm−2, the reaction was limited to Al with thecarbonyl group to form a C–O–metal complex. At a twofoldincrease in coverage, Al–O and Al–C bonds were formed; atintermediate coverages, no polymer–Al reactions transpiredbut bond breaking processes in the polymer occurred.155
3.2.5 Self-Assembled Monolayers
Technological and scientific interest in self-assembled monolayers (SAMs) lie in their applicability inmany areas such as corrosion protection, biomimetic mem-branes, and chemical sensors.156 The driving force in thefacile formation of SAMs is the high affinity of an end groupfor the metal substrate. Organosulfur compounds such asalkanethiol and dialkyl disulfides have been widely studiedbecause they spontaneously form highly ordered structureson transition-metal surfaces such as Au and Pt. IRAS, Ramanscattering, sum-frequency generation and HREELS are amongthe vibrational spectroscopy techniques employed to probe thestructure and organization of monolayer and bilayer SAMs.157
HREELS has the unique advantage in that the metal–sulfur
HIGH RESOLUTION ELECTRON ENERGY-LOSS SPECTROSCOPY 13
stretch mode occurs at low frequencies inaccessible by theother methods; hence, a determination of the adsorptionsites of the organosulfur compounds is possible only withHREELS.158,159 In addition, the degree of order in SAMs canbe addressed uniquely by HREELS via a comparison of thespecular and off-specular HREEL spectra.160
A vast majority of HREELS work has been focusedon Au(111) and Au(100) surfaces.161–163 The HREELspectrum of alkanethiols surface coordinated on Au canbe divided into the following group-frequency regions: 200(24.8 meV) to 360 cm−1 (44.6 meV) for the Au–S stretchregion; 620 (77 meV) to 740 cm−1 (91.7 meV) for the C–Sstretch region; 1000 (124 meV) to 1100 cm−1 (136 meV) forthe C–C stretch region; 1200 (149 meV) to 3000 cm−1
(372 meV) for the C–H stretch region; and 700 (86.9 meV) to900 cm−1 (112 meV) for the C–H wag region). The absenceof an S–H peak in the spectrum indicates that alkanethiolchemisorption involves the loss of an S–H bond to form anM–S bond accompanied by the evolution of H2 gas.
The effect of alkyl chain length on the structure ofalkanethiols on Au(111) was studied with CH3(CH2)n−1SH,where n = 2, 4, 6, 8, 10, 11, 12, 14, 15, 16, and 18).164 Theresults, in terms of HREEL spectra, are displayed in Figure 11.It is most interesting to note that the intensity of CH3 σ -deformation mode at 1380 cm−1 (171 meV) is profoundlydependent on the number of carbons in the alkyl chain: It ispresent only when the number of carbon atoms is even (cf., thespectra labeled C10, C12 and C16); it is absent when the numberis odd (cf., the spectra labeled C11 and C15). This ‘‘odd–even’’trend is caused by the fact that the orientation of the CH3 headis parallel to the surface for odd number of carbon atomsbut perpendicular when the number is even (cf., the inset inFigure 11). As dictated by the dipole selection rules, only theoscillator that has a component perpendicular to the surface(as in the even number chain) would show HREELS activity.It can also be seen in the frequency region below 220 cm−1
(27.3 meV) that more than one peak, separated by about30 cm−1 (3.7 meV) are present; this indicates the existenceof multiple adsorption sites for the subject alkanethiols onAu(111).
Octanethiol SAMs on Au(111) have been foundto undergo an adlattice transition from a c(4 × 2) to a(6 × √
3) structure after long-term storage. HREELS wasone of the techniques employed to examine the causefor the transitions.165 It was established that the structuraltransitions were caused by the dynamic surface diffusion ofthe sulfur anchor group between multiple adsorption sites.The adsorption-site exchange also resulted in orientationalchanges in alkyl chains.164
The properties of octadecanethiol SAMs on threedifferent gold substrates, Au on Si, Au(111), and Au(100),were studied by HREELS for comparative purposes.132,140,141
The angular distribution of the elastic peak from the SAMon the Au on Si film was found to be at least 5 timesbroader than those on Au(111) and Au(100). This suggests

14 APPLICATIONS OF PHYSICAL METHODS TO INORGANIC AND BIOINORGANIC CHEMISTRY
0 1000 2000 3000Energy loss (cm−1)
Inte
nsity
(cp
s)
C16
C15
C12
C11
C10
x3
x3
x3
x3
x3
200cps
Cn-thiols on Au
EvenOdd
Figure 11 Odd–even effect on HREEL spectra of variousalkanethiol SAMs on Au. The specular spectra and the off-specularspectra were plotted as solid and dotted lines, respectively. (Reprintedwith permission from Kato, Noh, Hara and Kawai.158 2002American Chemical Society)
that the SAM on the Au film was far less ordered than onAu(111) and Au(100). An analysis of the dipole scatteringand impact scattering contributions to the HREEL spectraprovided evidence that the CH2 (rocking and scissoring) andCH3 (bending) modes are predominantly dipole scatterers,whereas the C–C and C–H stretching modes are primarilyimpact scatterers.165
Thiophenols and thiophenol derivatives chemisorbedon well-defined electrode surfaces have also been stud-ied by HREELS.2 The cyclic voltammetric peaks forthe quinone/hydroquinone redox reaction of the 2,5-dihydroxythiophenol immobilized on the Pt surface was muchbroader than for the unadsorbed species; the broadening van-ished when a methylene group was placed between the—SHgroup and the phenyl ring. These results indicated strongsubstrate mediated adsorbate–adsorbate interactions. Such
interactions, however, were not manifested in the HREELspectrum. This suggested that the adsorbate–adsorbate inter-actions were purely electronic in nature, devoid of vibrational(or vibronic) perturbations.
4 ACKNOWLEDGMENTS
Acknowledgment is made to the National ScienceFoundation by J. L. Stickney and M. P. Soriaga and to theWelch Foundation by MPS for support of their work cited inthis article.
5 ABBREVIATIONS AND ACRONYMS
EELS = electron energy-loss spectroscopy; HR-EEL = high-resolution electron energy-loss; HREELS =high-resolution electron energy-loss spectroscopy; UHRE-ELS = ultrahigh-resolution electron energy-loss spec-troscopy; IRAS = infrared reflection-absorption spec-troscopy; SAMs = self-assembled monolayers; UHV =ultrahigh vacuum; Cp = cyclopentadienyl group ϕ = off-specular scattering angle.
6 END NOTES
a. 1 eV = 8066 cm−1 = 96.48 kJ mol−1.b. HREELS generally does not possess enough sensitivity
to detect higher-order effects due to mechanical and/orelectrical anharmonicity.
c. In IRAS, the surface is irradiated at near-grazing incidenceand the quantity of absorption is obtained from theattenuation of the intensity of the reflected beam. Adsorbedmolecule orientation can be determined directly from thespectrum since the metal–surface dipole selection rulestates that only vibrations with components perpendicularto the surface are active.
d. A third mechanism, first observed in gas-phase electron-impact scattering, has been referred to as negative-ionresonance. In this process, an electron is trapped, within10−15 s, inside the molecule in a negative-ion state. Forchemisorbed molecules, however, the adsorbate-substratechemical bond and the electron–surface interactions candramatically alter the resonance properties.6 Hence, forHREELS at metal surfaces, this mechanism is quite rare;it will not be treated further in this article.
e. In electrochemical surface science, emersion is a term usedto indicate the removal of an electrode from solution underpotential control.

7 FURTHER READING
F. Allegretti, V. De Renzi, R. Biagi, U. del Pennino, G. Contini,V. Di Castro, C. Mariani and C. Fontanesi, Surf. Sci., 2003, 539,63.
J. M. Auerhammer, M. Knupfer, H. Peisert and J. Fink, Surf. Sci.,2002, 506, 333.
A. Bansal, Xiuling. Li, Sang. I. Yi, W. H. Weinberg and N. S. Lewis,J. Phys. Chem., 2001, 105, 10266.
W. Chen, I. Ermanoski, Q. Wu, T. E. Madey, H. H. Hwu and J. G.Chen, J. Phys. Chem., 2003, 107, 5231.
Y. Chen, R. E. Palmer and J. P. Wilcoxon, Surf. Sci., 2000, 454–456,963.
M. S. Chen, A. K. Santra and D. W. Goodman, J. Phys. Chem., 2004,108, 17940.
T. V. Choudhary and D. W. Goodman, Top. Catal., 2002, 20, 35.
V. De Renzi, R. Biagi and U. del Pennino, Phys. Rev. B, 2001,64, 1.
S. V. Didziulis, P. Frantz, L. C. Fernandez-Torres, R. L. Guenardand S. S. Perry, J. Phys. Chem., 2001, 105, 5196.
A. -S. Duwez, J. Electron Spectrosc. Relat. Phenom., 2004, 134, 97.
Y. Fukuda, T. Kobayashi, H. Yoshida, T. Sekizawa and N. Sanada,Appl. Surf. Sci., 2002, 190, 279.
V. V. Gorodetskii, M. Yu. Smirnov and A. R. Cholach, Stud. Surf.Sci. Catal., 1993, 75, 1587.
C. J. Hagedorn, M. J. Weiss and W. H. Weinberg, J. Phys. Chem.,2001, 105, 3838.
R. D. Haley, M. S. Tikhov and R. M. Lambert, Catal. Lett., 2001,76, 125.
G. Hamm, T. Schmidt, J. Breitbach, D. Franke, C. Becker andK. Wandelt, Surf. Sci., 2004, 562, 170.
M. A. Henderson and S. A. Chambers, Surf. Sci., 2000, 449, 135.
G. Hess, Ch. Baumgartner and H. Froitzheim, Phys. Rev. B, 2001,63, 1.
T. Hoeche, F. Heyroth, M. Grodzicki and P. A. van Aken, Phys.Status Solidi A, 2005, 202, 2355.
K. Jacobi, Y. Wang, C. Y. Fan and H. Dietrich, J. Chem. Phys., 2001,115, 4306.
I. Jungwirthova and L. L. Kesmodel, Surf. Sci., 2000, 470, L39.
S. Katano, H. S. Kato, M. Kawai and K. Domen, J. Phys. Chem.,2003, 107, 3671.
K. A. Layman, M. M. Ivey and J. C. Hemminger, J. Phys. Chem.,2003, 107, 8538.
J. P. Lu, M. R. Albert and S. L. Bernasek, Surf. Sci., 1991, 258, 269.
K. K. Meagher, A. B. Bocarsly, S. L. Bernasek and T. A.Ramanarayanan, J. Phys. Chem., 2000, 104, 3320.
U. A. Paulus, Y. Wang, H. P. Bonzel, K. Jacobi and G. Ertl, J. Phys.Chem., 2005, 109, 2139.
V. M. Rei, P. Lang, G. Horowitz, C. Nogues, Y. Jugnet, O. Pelle-grino and A. M. Botelho do Rego, Langmuir, 2003, 19, 2649.
T. J. Rockey, M. Yang and H. L. Dai, Surf. Sci., 2005, 589, 42.
HIGH RESOLUTION ELECTRON ENERGY-LOSS SPECTROSCOPY 15
E. Salomon, T. Angot, N. Papageorgiou and J. -M. Layet, Surf. Sci.,2005, 596, 74.
C. Silien, Y. Caudano, A. Peremans and P. A. Thiry, Appl. Surf. Sci.,2000, 162, 445.
C. Silien, P. A. Thiry and Y. Caudano, Phys. Rev. B, 2003, 67,075412.
M. Sock, A. Eichler, S. Surnev, J. N. Andersen, B. Klotzer,K. Hayek, M. G. Ramsey and F. P. Netzer, Surf. Sci., 2003, 545,122.
P. J. Unwin and T. S. Jones, Surf. Sci., 2003, 532, 1011.
J. Wang, C. Y. Fan, Q. Sun, K. Reuter, K. Jacobi, M. Scheffler andG. Ertl, Angew. Chem., 2003, 42, 2151.
C. M. Whelan, F. Cecchet, G. J. Clarkson, D. A. Leigh, R. Caudanoand P. Rudolf, Surf. Sci., 2001, 474, 71.
X. Yang, Z. H. He, X. J. Zhou, S. H. Xu and K. T. Leung, Appl. Surf.Sci., 2006, 252, 3647.
H. Zhao, J. Kim and B. E. Koel, Surf. Sci., 2003, 538, 147.
8 REFERENCES
1. G. A. Somorjai, ‘Introduction to Surface Chemistry andCatalysis’, John Wiley & Sons, New York, 1994.
2. G. Ertl and J. Kuppers, ‘Low Energy Electrons and SurfaceChemistry’, VCH Publishers, Weinheim, 1985.
3. H. Froitzheim, in ‘Topics in Current Physics’, ed. H. Ibach,Springer-Verlag, New York, 1977.
4. H. Ibach and D. L. Mills, ‘Electron Energy Loss Spectroscopyand Surface Vibrations’, Academic Press, New York, 1982.
5. N. R. Avery, in ‘Vibrational Spectroscopy of Molecules onSurfaces’, eds. J. T. Yates, Jr and T. E. Madey, Plenum Press,New York, 1987.
6. L. L. Kesmodel, in ‘Surface Imaging and Visualization’, ed.A. T. Hubbard, CRC Press, Boca Raton, 1995.
7. http://www.lktech.com/products/els5000.php, 2006.
8. J. E. Soto-Chevres, Molecular Adsorption at Well-DefinedPalladium Electrode Surfaces, Ph. D. Dissertation, TexasA&M University, College Station, 2000.
9. F. A. Cotton and G. Wilkinson, ‘Advanced InorganicChemistry’, Wiley-Interscience, New York, 1988.
10. G. Blyholder, J. Phys. Chem., 1964, 68, 2772.
11. N. Sheppard and T. T. Nguyen, in ‘Advances in Infraredand Raman Scattering’, eds. R. E. Hester and R. J. H. Clark,Hayden and Son, London, 1978.
12. W. Erley, H. Wagner and H. Ibach, Surf. Sci., 1979, 80, 612.
13. V. Formoso, A. Marino, G. Chiarello, R. G. Agostino,T. Caruso and E. Colavita, Surf. Sci., 2006, 600, 1456.
14. H. S. Kato, H. Okuyama, J. Yoshinobu and M. Kawai, Surf.Sci., 2002, 513, 239.
15. H. Steininger, S. Lehwald and H. Ibach, Surf. Sci., 1982, 123,264.

16 APPLICATIONS OF PHYSICAL METHODS TO INORGANIC AND BIOINORGANIC CHEMISTRY
16. J. Wang, Y. Wang and K. Jacobi, Surf. Sci., 2001, 482, 153.
17. J. Radnik and H. J. Ernst, J. Chem. Phys., 1999, 110, 10522.
18. D. L. S. Nieskens, M. M. M. Jansen, A. P. Van Bavel,D. Curulla-Ferre and J. W. Niemantsverdriet, Phys. Chem.Phys., 2006, 8, 624.
19. A. G. Baca, L. E. Klebanoff, M. A. Schulz, D. Paparazzo andD. A. Shirley, Surf. Sci., 1986, 173, 215.
20. M. L. Colaianni, J. G. Chen, W. H. Weinberg and J. T. Yates,Jr, J. Am. Chem. Soc., 1992, 114, 3735.
21. C. M. Friend, J. G. Serafin, E. K. Baldwin, P. A. Stevens andR. J. Madix, J. Chem. Phys., 1987, 87, 1847.
22. H. Von Schenck, E. Janin, O. Tjernberg, M. Svensson andM. Gothelid, Surf. Sci., 2003, 526, 184.
23. C. Lemire, R. Meyer, V. E. Henrich and H. J. Freund, Surf.Sci., 2004, 572, 103.
24. S. H. Kim, U. A. Paulus, Y. Wang, J. Wintterlin, K. Jacobiand G. Ertl, J. Chem. Phys., 2003, 119, 9729.
25. H. Hopster and H. Ibach, Surf. Sci., 1978, 77, 109.
26. S. R. Bare, P. Hofmann and D. A. King, Surf. Sci., 1984, 144,347.
27. Z. Chen, D. H. Gracias and G. A. Somorjai, Appl. Phys. B,1999, 68, 549.
28. R. Linke, D. Curulla, M. J. P. Hopstaken and J. W.Niemantsverdriet, J. Chem. Phys., 2001, 115, 8209.
29. Y. C. Lee and P. A. Montano, Surf. Sci., 1985, 149, 471.
30. T. S. Rahman, A. B. Anton, N. R. Avery and W. H. Weinberg,Phys. Rev. Lett., 1983, 51, 1979.
31. N. D. Shinn and T. E. Madey, Surf. Sci., 1986, 173, 379.
32. S. H. Kim and P. C. Stair, Surf. Sci., 2000, 457, L347.
33. T. Sueyoshi, T. Sasaki and Y. Iwasawa, Surf. Sci., 1996, 365,310.
34. C. de Verdiere, J. Szeftel and P. Soukiassian, Phys. Rev. B,1990, 42, 7234.
35. F. P. Leisenberger, G. Koller, M. Sock, S. Surnev, M. G.Ramsey, F. P. Netzer, B. Klotzer and K. Hayek, Surf. Sci.,2000, 445, 380.
36. P. D. Nolan, B. R. Lutz, P. L. Tanaka, J. E. Davis and C. B.Mullins, J. Chem. Phys., 1999, 111, 3696.
37. F. Bartolucci, R. Franchy, J. C. Barnard and R. E. Palmer,Phys. Rev. Lett., 1998, 80, 5224.
38. J. L. Gland, B. A. Sexton and G. B. Fisher, Surf. Sci., 1980,95, 587.
39. H. Steininger, S. Lehwald and H. Ibach, Surf. Sci., 1982,123, 1.
40. C. Backx, C. P. M. De Groot and P. Biloen, Surf. Sci., 1981,104, 300.
41. K. C. Prince, G. Paolucci and A. M. Bradshaw, Surf. Sci.,1986, 175, 101.
42. D. H. Parker, M. E. Bartram and B. E. Koel, Surf. Sci., 1989,217, 489.
43. K. Gustafsson and S. Andersson, J. Chem. Phys., 2004, 120,7750.
44. H. Ibach and S. Lehwald, Surf. Sci., 1980, 91, 187.
45. P. A. Thiel, R. A. Depaola and F. M. Hoffmann, J. Chem.Phys., 1984, 80, 5326.
46. S. Meng, L. F. Xu, E. G. Wang and S. Gao, Phys. Rev. Lett.,2002, 89, 176104.
47. C. T. Nyberg, C. G. Tengstal, P. Uvdal and S. Andersson, J.Electron Spectrosc. Relat. Phenom., 1986, 38, 299.
48. S. F. Wendt, T. Wei, M. S. Chen, V. Kempter and D. W.Goodman, Surf. Sci., 2004, 565, 107.
49. R. B. Rosseau and T. H. Ellis, Surf. Sci., 1993, 280, 23.
50. M. A. Henderson and S. A. Chambers, Surf. Sci., 2000, 449,135.
51. F. Xu, Q. Guo and P. Moller, J. Phys. Chem. B, 2005, 109,9517.
52. H. W. Ibach, H. Wagner and D. Bruchmann, Solid StateCommun., 1982, 42, 457.
53. P. A. E. Cox and P. D. Naylor, J. Electron Spectrosc. Relat.Phenom., 1983, 29, 247.
54. K. J. Wu, G. S. Elliott and S. D. Kevan, J. Chem. Phys., 1989,91, 7964.
55. Y. Yu, Q. Guo, S. Liu, E. Wang and P. Moller, Phys. Rev. B,2003, 68, 115414.
56. K. B. Jacobi, P. Geng, W. Hansen, J. Schreiner and C. Astaldi,Surf. Sci., 1991, 245, 72.
57. E. Stuve and R. J. Madix, Surf. Sci., 1984, 146, 179.
58. M. S. Hock, I. Bassignana, K. Wagemann and J. Kueppers,Surf. Sci., 1986, 177, L978.
59. N. B. Chen and R. I. Masel, Surf. Sci., 1999, 419, 150.
60. G. Davidson, Spectrosc. Prop. Inorg. Organomet. Compd.,1985, 18, 220.
61. S. Cradock, Spectrosc. Prop. Inorg. Organomet. Compd.,1985, 17, 184.
62. D. L. Pugmire, C. M. Woodbridge, N. M. Boag and M. A.Langell, Surf. Sci., 2001, 472, 155.
63. C. M. Woodbridge, D. L. Pugmire, R. C. Johnson, N. M. Boagand M. A. Langell, J. Phys. Chem. B, 2000, 104, 3085.
64. C. F. McConville and T. S. Jones, Surf. Sci., 2002, 515, 403.
65 Y. Fukuda, T. Kobayashi, H. Yoshida, T. Sekizawa andN. Sanada, Appl. Surf. Sci., 2002, 190, 279.
66. R. Sen, A. Govindaraj and C. N. R. Rao, Chem. Phys. Lett.,1997, 267, 276.
67. P. J. Durston and R. E. Palmer, Surf. Sci., 1998, 400, 277.
68. D. Welipitiya, P. A. Dowben, J. Zhang, W. W. Pai and J. F.Wendelken, Surf. Sci., 1996, 367, 20.
69. C. Waldfried, D. Welipitiya, C. W. Hutchings, H. S. V. deSilva, G. A. Gallup, P. A. Dowben, W. W. Pai, J. Zhang, J. F.Wendelken and N. M. Boag, J. Phys. Chem. B, 1997, 101,9782.

70. S. Mulbauer, A. Petkova and H. Froitzheim, Surf. Sci., 2004,562, 195.
71. B. Rosen, H. Ch. Schafer, Ch. Dieker, L. Luth, A. Rizzi andD. Gerthsen, J. Vac. Sci. Technol., B, 1993, 11, 1407.
72. H. W. Kroto, J. R. Heath, S. C. O’Brian, R. F. Curl and R. E.Smalley, Nature, 1985, 318, 162.
73. A. Sellidj and B. E. Koel, J. Phys. Chem., 1993, 97, 10076.
74. C. Silien, I. Marenne, J. Auerhammer, N. Tagmatarchis,K. Prassides, P. A. Thiry and P. Rudolf, Surf. Sci., 2001,482, 1.
75. G. Gensterblum, L. M. Yu, J. J. Pireaux, P. A. Thiry,R. Caudano, Ph. Lambin, A. A. Lucas, W. Kratschmer andJ. E. Fischer, J. Phys. Chem. Solids, 1992, 53, 1427.
76. P. Dumas, M. Gruyters, P. Rudolf, Y. He, L. -M. Yu,G. Gensterblum, R. Caudano and Y. J. Chabal, Surf. Sci.,1996, 368, 330.
77. S. Suto, K. Sakamoto, D. Kondo, T. Wakita, A. Kimura,A. Kakizaki, C. -W. Hu and A. Kasuya, Surf. Sci., 1999, 438,242.
78. H. Kuzmany, R. Winkler and T. Pichler, J. Phys.: Condens.Matter, 1995, 7, 6601.
79. H. Kuzmany, M. Matus, B. Burger and J. Winter, Adv. Mater.,1994, 6, 731.
80. G. Gensterblum, J. J. Pireaux, P. A. Thiry, R. Caudano, J. P.Vigneron, Ph. Lambin and A. A. Lucas, Phys. Rev. Lett., 1991,67, 2171.
81. W. Andreoni, P. Giannozzi and M. Parrinello, Phys. Rev.B1995, 51, 2087.
82. C. Silien, P. A. Thiry and Y. Caudano, Surf. Sci., 2004, 558,174.
83. T. Nakajima, B. Zemva and A. Tressaud, ‘AdvancedInorganic Fluorides: Synthesis, Characterization andApplications’, Elsevier, St. Louis, 2000.
84. J. T. Sasowski, Y. Fujikawa, K. F. Kelly, K. Nakayama,T. Sakurai, E. T. Mickelson, R. H. Hauge and J. L. Margrave,J. Cryst. Growth, 2001, 229, 580.
85. J. T. Sasowski, Y. Fujikawa, K. F. Kelly, K. Nakayama,T. Sakurai, E. T. Mickelson, R. H. Hauge and J. L. Margrave,Mater. Charact., 2002, 48, 127.
86. H. Ibach and S. Lehwald, J. Vac. Sci. Technol., 1978, 15, 407.
87. M. A. Chesters and E. M. McCash, Surf. Sci., 1987, 187, L639.
88. I. J. Malik, M. E. Brubaker, S. B. Mohsin and M. Trenary, J.Chem. Phys., 1987, 87, 5554.
89. H. Steininger, H. Ibach and S. Lehwald, Surf. Sci., 1982, 117,685.
90. G. H. Hatzikos and R. I. Masel, Surf. Sci., 1987, 185, 479.
91. W. Erley, A. M. Baro and H. Ibach, Surf. Sci., 1982, 120, 273.
92. M. A. Barteau, J. Q. Broughton and D. Menzel, Appl. Surf.Sci., 1984, 19, 92.
93. J. Yoshinobu, H. Tsuda, M. Onchi and M. Nishijima, SolidState Commun., 1986, 60, 801.
HIGH RESOLUTION ELECTRON ENERGY-LOSS SPECTROSCOPY 17
94. C. Huang, W. Widdra and W. H. Weinberg, Surf. Sci., 1994,315, L953.
95. L. Hammer, T. Hertlein and K. Muller, Surf. Sci., 1986, 178,693.
96. S. Lehwald, H. Ibach and H. Steininger, Surf. Sci.1982, 117,342.
97. C. E. Anson, B. J. Bandy, M. A. Chesters, B. Keiller, I. A.Oxton and N. Sheppard, J. Electron Spectrosc. Relat. Phenom.,1983, 29, 315.
98. N. Sheppard, Annu. Rev. Phys. Chem., 1988, 39, 589.
99. C. Nyberg, C. G. Tengstal, S. Andersson and M. W. Holmes,Chem. Phys. Lett., 1982, 87, 87.
100. J. A. Gates and L. L. Kesmodel, Surf. Sci., 1985, 120, L461.
101. J. A. Gates and L. L. Kesmodel, Surf. Sci., 1985, 124, 68.
102. M. A. Chesters, G. S. McDougall, M. E. Pemble andN. Sheppard, Appl. Surf. Sci., 1985, 22, 369.
103. H. Okuyama, S. Ichihara, H. Ogasawara, H. Kato, T. Komeda,M. Kawai and J. Yoshinobu, J. Chem. Phys., 2000, 112, 5948.
104. S. Ichihara, H. Okuyama, H. Kato, M. Kawai and K. Domen,Chem. Lett., 2000, 2, 112.
105. C. Egawa, Surf. Sci., 2000, 454, 222.
106. E. M. Stuve and R. J. Madix, Surf. Sci., 1985, 160, 293.
107. M. Sock, A. Eichler, S. Surnev, J. N. Andersen, B. Klotzer,K. Hayek, M. G. Ramsey and F. P. Netzer, Surf. Sci., 2003,545, 122.
108. M. J. Grogan and K. Nakamoto, J. Am. Chem. Soc., 1966, 88,5454.
109. J. A. Gates and L. L. Kesmodel, Surf. Sci., 1982, 120, L461.
110. J. A. Gates and L. L. Kesmodel, Surf. Sci., 1983, 124, 68.
111. C. Hwang, C. Lee, H. Kang and C. Kim, Surf. Sci., 2001, 490,144.
112. E. M. Stuve, R. J. Madix and C. R. Brundle, Surf. Sci., 1985,152, 532.
113. M. B. Zellner, H. H. Hwu and J. G. Chen, Surf. Sci., 2005,598, 185.
114. J. P. Lu, M. R. Albert and S. L. Bernasek, Surf. Sci., 1991,258, 269.
115. J. P. Lu, M. Albert, S. L. Bernasek and D. Dwyer, Surf. Sci.,1989, 218, 1.
116. K. D. Gibson and L. H. Dubois, Surf. Sci., 1990, 233, 59.
117. N. Kizhakevariam and E. M. Stuve, Surf. Sci., 1993, 286, 246.
118. J. Wang and R. I. Masel, J. Vac. Sci. Technol., A, 1991, 9,1879.
119. J. E. Parmeter, X. Jiang and D. W. Goodman, Surf. Sci., 1990,240, 85.
120. C. Houtman and M. Barteau, Langmuir, 1990, 6, 1558.
121. L. J. Richter and W. Ho, J. Chem. Phys., 1985, 83, 2569.
122. J. Hrbek, R. A. DePaola and F. M. Hoffmann, J. Chem. Phys.,1984, 81, 2818.
123. J. A. Gates and L. L. Kesmodel, J. Catal., 1983, 83, 437.

18 APPLICATIONS OF PHYSICAL METHODS TO INORGANIC AND BIOINORGANIC CHEMISTRY
124. K. Christmann and J. E. Demuth, J. Chem. Phys., 1982, 76,6318.
125. C. W. Lim, J. M. Soon, N. L. Ma, W. Chen and K. P. Loh,Surf. Sci., 2005, 575, 51.
126. B. Sheu and D. R. Strongin, J. Catal., 1995, 154, 379.
127. S. Chaturvedi and D. R. Strongin, J. Phys. Chem. B, 1998,102, 2970.
128. B. A. Sexton, Surf. Sci., 1979, 88, 299.
129. N. F. Brown and M. A. Barteau, J. Phys. Chem., 1996, 100,2269.
130. C. M. Whelan, F. Cecchet, R. Baxter, F. Zerbetto,G. Clarkson, D. Leigh and P. Rudolf, J. Phys. Chem. B, 2002,106, 8739.
131. C. M. Whelan, F. Cecchet, G. Clarkson, D. Leigh, R. Caudanoand P. Rudolf, Surf. Sci., 2001, 474, 71.
132. J. E. Soto, Y. G. Kim, X. Chen, Y. S. Park and M. P. Soriaga,J. Electroanal. Chem., 2001, 500, 374.
133. M. P. Soriaga and A. T. Hubbard, J. Am. Chem. Soc., 1982,104, 2735.
134. M. P. Soriaga, E. Binamira-Soriaga, A. T. Hubbard, J. B.Benziger and K. W. P. Pang, Inorg. Chem., 1985, 24, 65.
135. M. P. Soriaga, Chem. Rev., 1990, 90, 771.
136. F. Lu, G. N. Salaita, L. Laguren-Davidson, D. A. Stern,E. Wellner, D. G. Frank, N. Batina, D. C. Zapien, N. Waltonand A. T. Hubbard, Langmuir, 1988, 4, 637.
137. G. Salaita, L. Laguren-Davidson, F. Lu, N. Walton, E. Well-ner, D. A. Stern, N. Batina, D. Frank, C. Lin and A. T.Hubbard, J. Electroanal. Chem., 1988, 245, 253.
138. J. E. Soto, Y. -G. Kim and M. P. Soriaga, Electrochem.Commun., 1999, 1, 135.
139. Y. -G. Kim, J. E. Soto, X. Chen, Y. -S. Park and M. P. Soriaga,J. Electroanal. Chem., 2003, 554, 167.
140. Y. -G. Kim and M. P. Soriaga, Phys. Chem. Chem. Phys.,2001, 3, 3303.
141. X. Chen, J. Sanabria-Chinchilla and M. P. Soriaga,Electroanalysis, 2005, 1, 2121.
142. J. Breitbach, D. Franke, G. Hamm, C. Becker and K. Wandelt,Surf. Sci., 2002, 507, 18.
143. I. Jungwirthova and L. L. Kesmodel, Surf. Sci., 2000, 470,L39.
144. L. Bugyi, A. Oszko and F. Solymosi, Surf. Sci., 2003, 539, 1.
145. J. Eng, B. Bent, B. Fruhberger and J. G. Chen, J. Phys. Chem.B, 1997, 101, 4044.
146. H. G. Huang, J. Y. Huang, Y. S. Ning and G. Q. Xu, J. Chem.Phys., 2004, 121, 4820.
147. M. Allan, Chem. Phys., 1983, 81, 235.
148. F. R. Yubero, J. P. Espinos, J. Cotrino and A. R. Gonzalez-Elipe, Appl. Phys. Lett., 2005, 87, 084101.
149. A. M. Botelho do Rego, O. Pellegrino, J. G. Martinho andJ. Lopes da Silva, Surf. Sci., 2001, 482, 1228.
150. T. R. Bryden and J. Simon, Langmuir, 2001, 17, 5850.
151. R. Becker, M. R. Ashton, T. S. Jones, N. V. Richardson andH. Sotobayashi, J. Phys.: Condens. Matter, 1991, 3, S29.
152. W. P. McKenna and G. Apai, J. Phys. Chem., 1992, 96, 5902.
153. P. S. Dannetun and M. Rei Vilar, Thin Solid Films, 1996, 286,321.
154. N. J. Dinardo and T. C. Clarke, Chem. Phys. Lett., 1985, 121,239.
155. J. -J. Pireaux, C. Gregoire, P. A. Thiry, R. Caudano and T. C.Clarke, J. Chem. Phys., 1988, 88, 3353.
156. A. Ulman, ‘An Introduction to Ultrathin Organic Films: FromLangmuir-Blodgett to Self-Assembly’, Academic Press, NewYork, 1991.
157. A. Kudelski, Vib. Spectrosc., 2005, 39, 200.
158. H. S. Kato, J. Noh, M. Hara and M. Kawai, J. Phys. Chem. B,2002, 106, 9655.
159. J. Noh, H. S. Kato, M. Kawai and M. Hara, J. Phys. Chem. B,2006, 110, 2793.
160. A. S. Duwez, L. M. Yu, J. Riga, J. Delhalle and J. -J. Pireaux,J. Phys. Chem. B, 2000, 104, 8830.
161. A. S. Duwez, L. M. Yu, J. Riga, J. -J. Pireaux and J. Delhalle,Thin Solid Films, 1998, 327, 156.
162. A. S. Duwez, L. M. Yu, J. Riga, J. Delhalle and J. -J. Pireaux,Langmuir, 2000, 16, 6569.
163. J. Noh, H. S. Kato, M. Kawai and M. Hara, J. Phys. Chem. B,2002, 106, 13268.
164. J. Gui, D. A. Stern, D. Frank, F. Lu, D. Zapien and A. T.Hubbard, Langmuir, 1991, 7, 955.
165. B. G. Bravo, T. Mebrahtu and M. P. Soriaga, Langmuir, 1987,3, 595.